WO2015033739A1 - 評価方法、評価装置およびプログラム - Google Patents
評価方法、評価装置およびプログラム Download PDFInfo
- Publication number
- WO2015033739A1 WO2015033739A1 PCT/JP2014/071102 JP2014071102W WO2015033739A1 WO 2015033739 A1 WO2015033739 A1 WO 2015033739A1 JP 2014071102 W JP2014071102 W JP 2014071102W WO 2015033739 A1 WO2015033739 A1 WO 2015033739A1
- Authority
- WO
- WIPO (PCT)
- Prior art keywords
- particle
- data set
- particles
- evaluation method
- movement
- Prior art date
- Legal status (The legal status is an assumption and is not a legal conclusion. Google has not performed a legal analysis and makes no representation as to the accuracy of the status listed.)
- Ceased
Links
Images






Classifications
-
- B—PERFORMING OPERATIONS; TRANSPORTING
- B01—PHYSICAL OR CHEMICAL PROCESSES OR APPARATUS IN GENERAL
- B01F—MIXING, e.g. DISSOLVING, EMULSIFYING OR DISPERSING
- B01F23/00—Mixing according to the phases to be mixed, e.g. dispersing or emulsifying
- B01F23/60—Mixing solids with solids
-
- B—PERFORMING OPERATIONS; TRANSPORTING
- B01—PHYSICAL OR CHEMICAL PROCESSES OR APPARATUS IN GENERAL
- B01F—MIXING, e.g. DISSOLVING, EMULSIFYING OR DISPERSING
- B01F27/00—Mixers with rotary stirring devices in fixed receptacles; Kneaders
- B01F27/80—Mixers with rotary stirring devices in fixed receptacles; Kneaders with stirrers rotating about a substantially vertical axis
- B01F27/90—Mixers with rotary stirring devices in fixed receptacles; Kneaders with stirrers rotating about a substantially vertical axis with paddles or arms
-
- B—PERFORMING OPERATIONS; TRANSPORTING
- B01—PHYSICAL OR CHEMICAL PROCESSES OR APPARATUS IN GENERAL
- B01F—MIXING, e.g. DISSOLVING, EMULSIFYING OR DISPERSING
- B01F2215/00—Auxiliary or complementary information in relation with mixing
- B01F2215/04—Technical information in relation with mixing
- B01F2215/0404—Technical information in relation with mixing theories or general explanations of phenomena associated with mixing or generalizations of a concept by comparison of equivalent methods
Definitions
- the present invention relates to an evaluation method, an evaluation apparatus, and a program.
- a stirring vessel may be used to stir a plurality of particles.
- the stirring state of the particles inside the stirring container may be evaluated.
- Patent Document 1 describes that the agitation state of particles is simulated based on a discrete element method (DEM: Discrete Element Method).
- DEM discrete Element Method
- the degree of mixing of particles at an arbitrary position is calculated based on the result of simulation. This degree of mixing is determined by the ratio of the number of sampled particles to the number of specific types of particles in the sampled particles.
- Non-Patent Document 1 also describes that the stirring state of particles is simulated based on DEM.
- the present inventors examined an index for judging the mixing state of particles stirred in a stirring vessel.
- a simulation unit that simulates a state in which a plurality of types of particles are stirred inside the stirring vessel;
- a movement amount calculation unit that calculates a movement amount of each simulated particle from the first time to the second time;
- a data set generation unit for generating a data set including each particle and the movement amount corresponding to the particle in association with each other;
- a display for displaying the data set in a statistically processed format;
- An evaluation device is provided.
- a program for causing a computer to function as an evaluation device In the computer, A function of simulating a state in which a plurality of types of particles are stirred inside the stirring vessel; A function of calculating the amount of movement of each simulated particle from the first time to the second time; A function of generating a data set including each particle and the amount of movement corresponding to the particle in association with each other; A function of displaying the data set in a statistically processed format; A program for providing
- an index for determining the mixing state of particles in the stirring vessel is provided.
- (A) is a top view which shows an example of a stirring container
- (b) is sectional drawing in AA 'of (a).
- each component of each device indicates a functional unit block, not a hardware unit configuration.
- Each component of each device includes a CPU, memory, a program that realizes the components shown in the figure loaded in the memory, a storage medium such as a hard disk for storing the program, and a network connection interface. It is realized by any combination of software and software. There are various modifications of the implementation method and apparatus.
- FIG. 1 is a flowchart showing an evaluation method according to the first embodiment.
- This evaluation method includes the following steps. First, a state in which a plurality of types of particles are stirred inside the stirring vessel is simulated (step S10). Next, the amount of movement of each simulated particle from the first time to the second time is calculated (step S20). Next, a predetermined data set is generated (step S30). The data set includes each particle and the movement amount corresponding to the particle in association with each other. Next, the data set is displayed in a statistically processed format (step S40).
- the data set displayed in the statistically processed format in step S40 can be handled as mixed state information.
- the mixed state information refers to information indicating a mixed state of a plurality of types of particles, for example, the following information.
- Information indicating how uniformly a plurality of types of particles are mixed (uniformity of mixing of a plurality of types of particles)
- a plurality of particles are unevenly distributed in the system
- information indicating how each particle is distributed distributed (distribution state of each particle)
- iii) how a plurality of types of particles are distributed for each type (for each type of particles) Information
- the mixed state of a plurality of types of particles can be evaluated based on the above mixed state information.
- an index for determining the mixing state of particles in the stirring vessel is provided.
- the evaluation apparatus 100 executes the evaluation method shown in FIG. FIG. 2 is a block diagram showing the configuration of the evaluation apparatus 100.
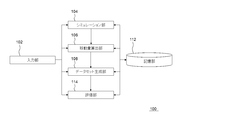
- the evaluation apparatus 100 includes an input unit 102, a simulation unit 104, a movement amount calculation unit 106, a data set generation unit 108, a display unit 110, and a storage unit 112.
- the input unit 102 sends a signal indicating an instruction of the user of the evaluation apparatus 100 to the simulation unit 104, the movement amount calculation unit 106, the data set generation unit 108, and the display unit 110.
- the simulation unit 104 simulates the stirring state of the particles (Step S10).
- the movement amount calculation unit 106 calculates the movement amount (step S20).
- the data set generation unit 108 generates a data set (step S30).
- the display unit 110 displays the data set in a statistically processed format (step S40).
- the storage unit 112 stores information from the simulation unit 104, the movement amount calculation unit 106, the data set generation unit 108, and the display unit 110. Details of the evaluation apparatus 100 are as follows.
- the simulation unit 104 simulates a state in which a plurality of types of particles are stirred inside the stirring vessel.
- the simulation unit 104 simulates a state in which a plurality of types of particles are agitated inside the agitation vessel based on a discrete element method (DEM: Discrete Element Method).
- DEM discrete element method
- the simulation unit 104 may simulate a state in which a plurality of types of particles are agitated inside the agitation vessel using a method different from the DEM (for example, an embedded boundary method).
- the simulation unit 104 models a stirring vessel and particles in the DEM.
- the structure and shape of the stirring vessel to be modeled is not limited to a specific structure and shape.
- the shape of the modeled particle is not limited to a specific shape.
- the particle modeled in this embodiment is a solid particle.
- FIG. 3 is a conceptual diagram of a contact force model of two particles i and j.
- FIG. 3A shows a contact force model in the normal direction of the contact point between the particle i and the particle j.
- FIG. 3B shows a contact force model in the tangential direction of the contact point between the particle i and the particle j.
- the particles have a spherical shape.
- DEM the force acting in the normal direction of the contact points between the particles i and particle j in contact with each other, as shown in FIG. 3 (a), the dashpot spring and damping coefficient eta n of the spring constant k n Modeled.
- the force acting in the tangential direction of the contact point between the particle i and the particle j that are in contact with each other includes a spring having a spring constant k t , a dashpot having a damping coefficient ⁇ t , and a dynamic friction coefficient. It is modeled by friction slider mu f.
- the user may input appropriate values as the spring constants k n and k t , the damping coefficients ⁇ n and ⁇ t and the dynamic friction coefficient ⁇ f to the simulation unit 104 through the input unit 102.
- the simulation unit 104 models particles based on the input parameters.
- equations of translational motion and rotational motion of each particle are established based on the models shown in FIGS. 3 (a) and 3 (b).
- the equations for translational motion and rotational motion in the particle i are as shown in the following formulas (1) and (2), respectively.
- the simulation unit 104 establishes the equations of motion shown in the equations (1) and (2) based on the models shown in FIGS. 3 (a) and 3 (b).
- m i , I i , v i , ⁇ i , and R i are the mass, moment of inertia, velocity, angular velocity, and radius of the particle i, respectively.
- F ij N and F ij T are normal and tangential forces generated by the contact between the particle i and the particle j, respectively.
- g is a gravitational acceleration.
- ⁇ rij is a torque generated by the contact between the particle i and the particle j.
- the simulation unit 104 sets up an equation for translational motion in consideration of gravitational acceleration. If the gravitational acceleration is not taken into account, term of m i g may be removed from the right hand side of equation (1). Expressions similar to Expressions (1) and (2) are established for each particle other than the particle i. In the present embodiment, the simulation unit 104 solves these equations of motion.
- the simulation unit 104 may solve the equation of motion by numerical analysis using a difference method. Thus, the simulation part 104 simulates the stirring state of particle
- the simulation unit 104 outputs the simulation result to the storage unit 112.
- the storage unit 112 stores simulation results.
- the result of the simulation shows information on the coordinates of each particle at a predetermined time.
- the simulation unit 104 sends a simulation end signal indicating that the simulation is finished to the movement amount calculation unit 106.
- the movement amount calculation unit 106 receives a simulation end signal from the simulation unit 104. Next, the movement amount calculation unit 106 accesses the storage unit 112. Then, the movement amount calculation unit 106 reads the simulation result stored in the storage unit 112. Next, the movement amount calculation unit 106 calculates the movement amount of each simulated particle from the first time to the second time (step S20).
- the movement amount of each particle is the distance that the particle has moved inside the stirring vessel from the first time to the second time.
- the first time and the second time are arbitrary times. The first time may be, for example, the time when stirring starts. For example, the second time may be a time at which stirring is completed.
- the movement amount calculation unit 106 calculates the distance that each particle has moved within the stirring vessel from the first time to the second time.
- the movement amount calculation unit 106 may calculate the distance based on the solution of Expression (1). Equation (1) gives the coordinates of each particle at a given time.
- the movement amount calculation unit 106 can calculate the distance that each particle has moved within the stirring vessel from the first time to the second time by tracing the coordinates of each particle at a predetermined time.
- the movement amount calculation unit 106 outputs the movement distance of each particle to the storage unit 112.
- the storage unit 112 stores the movement distance of each particle. After completing the calculation of the movement amount, the movement amount calculation unit 106 sends a movement amount calculation end signal indicating that the calculation of the movement amount has ended to the data set generation unit 108.
- the data set generation unit 108 receives a movement amount calculation end signal from the movement amount calculation unit 106. Next, the data set generation unit 108 accesses the storage unit 112. Then, the data set generation unit 108 reads the movement amount of each particle stored in the storage unit 112. Next, the data set generation unit 108 generates a data set (step S30).
- the data set includes each particle and the movement amount corresponding to the particle in association with each other.
- the data set generation unit 108 outputs the data set to the storage unit 112.
- the storage unit 112 stores a data set. After the generation of the data set is completed, the data set generation unit 108 sends a data set end signal indicating that the generation of the data set has ended to the display unit 110.
- the display unit 110 receives a data set generation end signal from the data set generation unit 108. Next, the display unit 110 accesses the storage unit 112. The display unit 110 reads the data set stored in the storage unit 112. Next, the display unit 110 statistically processes the data set. Next, the display unit 110 displays the data set in a statistically processed format to the user of the evaluation device 100 (step S40). In the present embodiment, the display unit 110 displays the data set on the display. A data set displayed in a statistically processed format can be handled as the above-described mixed state information.
- step S40 details of step S40 will be described with reference to FIGS.
- FIG. 4 is a diagram illustrating a first example of the data set displayed in step S40.
- the data set is statistically processed and displayed in a table format.
- each particle is associated with the amount of movement corresponding to the particle.
- cells for example, “particle A2” and “D A2 ” cells in FIG. 4 indicating each particle and the movement amount corresponding to the particle are provided for each type of particle (particle group). It is classified.
- the display unit 110 displays the table shown in FIG. 4 to the user of the evaluation apparatus 100.
- the user of the evaluation apparatus 100 can grasp the movement distance of each particle from a bird's-eye view using the table of FIG. In this way, the user of the evaluation apparatus 100 evaluates the particle mixing state based on the table of FIG.
- FIG. 5 is a diagram illustrating a second example of the data set displayed in step S40.
- the data set is statistically processed and displayed in a table format.
- a frequency distribution table in which each particle is classified based on the movement amount is displayed.
- the frequency of particles that fall within the range of the moving distance from d1 [cm] to d2 [cm] is f A1 [%] (first row of particle group A in FIG. 5).
- a frequency distribution table is generated for each type (particle group) of particles.
- a frequency distribution table may be generated for each of a plurality of types of particle groups, or a frequency distribution table including all types of particles may be generated.
- the display unit 110 displays the table shown in FIG. 5 to the user of the evaluation apparatus 100.
- the user of the evaluation apparatus 100 can grasp the movement distance of each particle from a bird's-eye view using the table of FIG. In this way, the user of the evaluation apparatus 100 evaluates the particle mixing state based on the table of FIG.
- FIG. 6 is a diagram showing a third example of the data set displayed in step S40.
- the data set is statistically processed and displayed in a graphical format, as shown in FIG.
- each particle is associated with a movement amount corresponding to the particle.
- plots indicating each particle for example, a white square plot indicating the particle A ⁇ b> 2 in FIG. 6 are classified for each particle type (particle group).
- the display unit 110 displays the graph shown in FIG. 6 to the user of the evaluation device 100.
- the user of the evaluation apparatus 100 can grasp the movement distance of each particle from a bird's-eye view with the graph of FIG. In this way, the user of the evaluation apparatus 100 evaluates the particle mixing state based on the graph of FIG.
- FIG. 7 is a diagram showing a fourth example of the data set displayed in step S40.
- the data set is statistically processed and displayed in a graphical format.
- a histogram in which each particle is classified based on the amount of movement is displayed.
- a histogram is generated for each type of particle (particle group).
- a histogram may be generated for each of a plurality of types of particle groups, or a histogram including all types of particles may be generated.
- the display unit 110 displays the graph shown in FIG. 7 to the user of the evaluation apparatus 100.
- the user of the evaluation apparatus 100 can grasp the moving distance of each particle from a bird's-eye view with the graph of FIG. In this way, the user of the evaluation apparatus 100 evaluates the particle mixing state based on the graph of FIG.
- the data set displayed in the statistically processed format as described above can be handled as mixed state information.
- an index for determining the mixing state of particles in the stirring vessel is provided.
- the amount of movement of the particles is the amount of movement along the actual trajectory in the three-dimensional space.
- the distance traveled by the particles in the projected locus is the amount of movement.
- the movement amount is calculated based on a trajectory obtained by orthogonally projecting a trajectory that each particle traces from the first time to the second time on a predetermined plane or a predetermined straight line.
- FIG. 8 is a diagram for explaining the projected trajectory.
- the particles follow a predetermined locus from the first time to the second time in the xyz rectangular coordinate system.
- the projected trajectory is a trajectory that is orthogonally projected on the xy plane.
- the projected trajectory is a trajectory orthogonally projected on the z axis.
- grains of FIG. In this way, the particles move in the direction in which z increases after moving in the direction in which z decreases in the locus orthogonally projected on the z axis.
- the movement amount calculation unit 106 applies the coordinate system shown in FIG. 8 to the simulation result. Then, the movement amount calculation unit 106 calculates the distance that each particle has moved in the projected locus.
- FIG. 9A is a plan view showing an example of the stirring container (stirring container 200).
- FIG. 9B is a cross-sectional view taken along the line AA ′ in FIG.
- the stirring vessel 200 includes a blade 202.
- the blade 202 rotates in a direction orthogonal to the gravitational acceleration g.
- the simulation unit 104 defines the x-axis direction, the y-axis direction, and the z-axis direction as shown in FIGS. 9A and 9B in modeling the stirring vessel 200.
- the z-axis direction is along the rotation axis direction of the blade 202.
- the x-axis and y-axis directions are along the rotation surface direction of the blade 202.
- the movement amount calculation unit 106 calculates the distance that each particle has moved in the projected locus in the coordinate system.
- the data set generation unit 108 and the display unit 110 of the present embodiment operate in the same manner as the data set generation unit 108 and the display unit 110 of the first embodiment.
- the data set generation unit 108 of the present embodiment generates a data set in the same manner as the data set generation unit 108 of the first embodiment.
- the data set includes each particle and the movement amount corresponding to the particle in association with each other.
- the display unit 110 of the present embodiment displays the mixed state information obtained by statistically processing the data set to the user of the evaluation apparatus 100.
- the present embodiment is different from the first embodiment in that the amount of movement of each particle is the distance traveled by the particle in the projected locus.
- the xyz orthogonal coordinate system is adopted and the projection trajectory is obtained.
- the present invention is not limited to this, and a polar coordinate system may be adopted to obtain the projection trajectory.
- FIG. 10 is a block diagram illustrating a configuration of the evaluation apparatus 100 according to the third embodiment, and corresponds to FIG. 2 of the first embodiment.
- the evaluation apparatus 100 according to the present embodiment has the same configuration as that of the evaluation apparatus 100 according to the first embodiment, except that an evaluation unit 114 is provided instead of the display unit 110. As will be described in detail later, the evaluation unit 114 is used to evaluate the mixed state of particles.
- FIG. 11 is a block diagram showing a configuration of the evaluation unit 114 shown in FIG. As shown in the figure, the evaluation unit 114 includes a similarity evaluation unit 116 and a distribution degree evaluation unit 118.
- the similarity evaluation unit 116 and the dispersion degree evaluation unit 118 receive the above-described data set from the data set generation unit 108 or the storage unit 112.
- the data set includes information indicating the distribution of movement amounts of one type of particles and information indicating the distribution of movement amounts of other types of particles (for example, FIG. 7).
- the similarity evaluation unit 116 evaluates the similarity between the movement amount distribution of one type of particle and the movement amount distribution of another type of particle.
- the distribution degree evaluation unit 118 evaluates the distribution degree of the distribution of the movement amount of one type of particles and the distribution degree of the distribution of the movement amount of other types of particles.
- the evaluation unit 114 evaluates the mixed state of one type of particle and another type of particle based on the above similarity. Furthermore, the evaluation unit 114 evaluates the above-described mixed state in consideration of the above-described spreading degree. Specifically, the evaluation unit 114 evaluates the above-described mixed state when each of the above-described spreading degree of one type of particles and the above-described spreading degree of other types of particles is equal to or less than a reference value.
- the reason for the above-mentioned correlation is that it is possible that any one type of particles and any other type of particles are moving substantially the same distance.
- the above-mentioned degree of dispersion is low, all the particles are moving the same distance in one kind of particles.
- all of the particles move approximately the same distance.
- the above-described similarity is high, the overlap between one type of the above-described distribution and another type of the above-described distribution is large. In other words, one type of particle and another type of particle are moving approximately the same distance. In such a case, the above-described uniformity is likely to be high.
- the reason for the above-described correlation was that the variation in the movement distance of the particles may affect the above-described uniformity.
- the center of one type of the above-described distribution and the center of the other type of the above-described distribution are substantially at the same position.
- the one kind of particles contains particles having a certain amount of movement from the center described above. And it is highly possible that such particles have lowered the above-described uniformity.
- FIG. 12 is a diagram for explaining an example of a method for evaluating the similarity of the distribution of particle movement amounts and the degree of dispersion of the distribution of particle movement amounts.
- This figure (a) has shown the distribution (probability density) of the movement distance of one kind of particle
- This figure (b) has shown the cumulative probability of the above-mentioned distribution of the particle group A, and the cumulative probability of the above-mentioned distribution of the particle group B.
- the cumulative probability of the particle group A is given by the integral of the probability density of the particle group A.
- the cumulative probability of the particle group B is given by the integral of the probability density of the particle group B.
- the similarity between the above-described distribution of the particle group A and the above-described distribution of the particle group B compares the above-described cumulative probability of the particle group A with the above-described cumulative probability of the particle group B.
- This can be evaluated. Specifically, the difference between the cumulative probability of the particle group A and the cumulative probability of the particle group B is calculated for each moving distance. Then, the above similarity is evaluated based on the maximum absolute value of the difference (D value of Kolmogorov-Smirnov test). In this case, it can be said that the smaller the maximum value is, the higher the degree of similarity between the above distribution of the particle group A and the above distribution of the particle group B is.
- the mixed state of the particle group A and the particle group B can be evaluated by determining whether or not the above-described maximum value is equal to or less than a predetermined reference value.
- the method for evaluating the similarity between the above-described distribution of the particle group A and the above-described distribution of the particle group B is not limited to the above-described example.
- an average value of the difference between the cumulative probability of the particle group A and the cumulative probability of the particle group B may be calculated.
- the mixed state of the particle group A and the particle group B can be evaluated by determining whether or not the above average value is equal to or less than a predetermined reference value.
- the distribution degree of the distribution of the particle group A can be evaluated based on the slope of the cumulative probability of the particle group A described above.
- the distribution degree can be evaluated based on the average value of the slopes of the cumulative probabilities in the range where the cumulative probability is greater than or equal to the first value and less than or equal to the second value.
- the first value and the second value are, for example, a value (for example, 25%) less than the median value (50%) and a value (for example, 75%) greater than the median value (50%), respectively.
- the distribution degree can be evaluated based on the slope of the cumulative probability at a position where the cumulative probability is the reference probability value.
- the reference probability value is, for example, the value of the cumulative probability at the position where the slope of the cumulative probability (the value of the first derivative of the cumulative probability) takes the maximum value, or an appropriate specific value (for example, 50%). It is.
- the distribution degree of the particle group B distribution can also be evaluated in the same manner as described above.
- the evaluation method of the distribution degree of the particle group A and the distribution degree of the particle group B is not limited to the above example.
- the distribution degree may be evaluated based on the standard deviation of the distribution.
- An evaluation method for evaluating the similarity by comparing a cumulative probability of the distribution of the movement amount of the first type of particles with a cumulative probability of the distribution of the movement amount of the second type of particles 3.1. Or 2.
- the evaluation method described in Further comprising the step of evaluating the distribution degree of the movement amount distribution of the first type particles and the distribution degree of the movement amount distribution of the second type particles The mixing state of the first-type particles and the second-type particles is evaluated when each of the first-type particles and the second-type particles is less than a reference value. Evaluation methods. 4).
- a simulation unit that simulates a state in which a plurality of types of particles are stirred inside the stirring vessel;
- a movement amount calculation unit that calculates a movement amount of each simulated particle from the first time to the second time;
- a similarity evaluation unit that evaluates the similarity between the movement amount distribution of the first type of the plurality of types of particles and the movement amount distribution of the second type of the plurality of types of particles;
- An evaluation unit that evaluates a mixed state of the first type particles and the second type particles based on the similarity; Evaluation device including 5.
- a program for causing a computer to function as an evaluation device In the computer, A function of simulating a state in which a plurality of types of particles are stirred inside the stirring vessel; A function of calculating the amount of movement of each simulated particle from the first time to the second time; A function of evaluating the similarity between the movement amount distribution of the first type of particles of the plurality of types and the movement amount distribution of the second type of particles of the plurality of types; A function of evaluating a mixed state of the first type particles and the second type particles based on the similarity; A program to give
Landscapes
- Chemical & Material Sciences (AREA)
- Chemical Kinetics & Catalysis (AREA)
- Management, Administration, Business Operations System, And Electronic Commerce (AREA)
Abstract
複数の種類の粒子が攪拌容器の内部で攪拌される状態がシミュレートされる(ステップS10)。次に、シミュレートされた各粒子の第1時刻から第2時刻までの間の移動量が算出される(ステップS20)。次に、所定のデータセットが生成される(ステップS30)。データセットは、各粒子と、当該粒子に対応する移動量と、を対応付けて含んでいる。次に、データセットが統計的に処理された形式で表示される(ステップS40)。
Description
本発明は、評価方法、評価装置およびプログラムに関する。
複数の粒子を攪拌するために攪拌容器が用いられることがある。この場合、攪拌容器の内部での粒子の攪拌状態が評価されることがある。特許文献1には、離散要素法(DEM:Discrete Element Method)に基づいて粒子の攪拌状態がシミュレーションされることが記載されている。特許文献1では、シミュレーションの結果に基づいて、任意の位置での粒子の混合度が算出されている。この混合度は、サンプリングされた粒子の数と、当該サンプリングされた粒子の中の特定の種類の粒子の数と、の比によって定められる。非特許文献1にも、DEMに基づいて粒子の攪拌状態がシミュレーションされることが記載されている。
Brenda Remy, Johannes G. Khinast, Benjamin J. Glasser, Chem. Eng. Sci., 66 (2011) 1811-1824.
本発明者らは、攪拌容器で攪拌される粒子の混合状態を判断するための指標を検討した。
本発明によれば、
複数の種類の粒子が攪拌容器の内部で攪拌される状態をシミュレートする工程と、
シミュレートされた前記各粒子の第1時刻から第2時刻までの間の移動量を算出する工程と、
前記各粒子と、当該粒子に対応する前記移動量と、を対応付けて含むデータセットを生成する工程と、
前記データセットを統計的に処理された形式で表示する工程と、
を含む評価方法が提供される。
複数の種類の粒子が攪拌容器の内部で攪拌される状態をシミュレートする工程と、
シミュレートされた前記各粒子の第1時刻から第2時刻までの間の移動量を算出する工程と、
前記各粒子と、当該粒子に対応する前記移動量と、を対応付けて含むデータセットを生成する工程と、
前記データセットを統計的に処理された形式で表示する工程と、
を含む評価方法が提供される。
本発明によれば、
複数の種類の粒子が攪拌容器の内部で攪拌される状態をシミュレートするシミュレーション部と、
シミュレートされた前記各粒子の第1時刻から第2時刻までの間の移動量を算出する移動量算出部と、
前記各粒子と、当該粒子に対応する前記移動量と、を対応付けて含むデータセットを生成するデータセット生成部と、
前記データセットを統計的に処理された形式で表示する表示部と、
を含む評価装置が提供される。
複数の種類の粒子が攪拌容器の内部で攪拌される状態をシミュレートするシミュレーション部と、
シミュレートされた前記各粒子の第1時刻から第2時刻までの間の移動量を算出する移動量算出部と、
前記各粒子と、当該粒子に対応する前記移動量と、を対応付けて含むデータセットを生成するデータセット生成部と、
前記データセットを統計的に処理された形式で表示する表示部と、
を含む評価装置が提供される。
本発明によれば、
コンピュータを評価装置として機能させるためのプログラムであって、
前記コンピュータに、
複数の種類の粒子が攪拌容器の内部で攪拌される状態をシミュレートする機能と、
シミュレートされた前記各粒子の第1時刻から第2時刻までの間の移動量を算出する機能と、
前記各粒子と、当該粒子に対応する前記移動量と、を対応付けて含むデータセットを生成する機能と、
前記データセットを統計的に処理された形式で表示する機能と、
を持たせるプログラムが提供される。
コンピュータを評価装置として機能させるためのプログラムであって、
前記コンピュータに、
複数の種類の粒子が攪拌容器の内部で攪拌される状態をシミュレートする機能と、
シミュレートされた前記各粒子の第1時刻から第2時刻までの間の移動量を算出する機能と、
前記各粒子と、当該粒子に対応する前記移動量と、を対応付けて含むデータセットを生成する機能と、
前記データセットを統計的に処理された形式で表示する機能と、
を持たせるプログラムが提供される。
本発明によれば、攪拌容器内における粒子の混合状態を判断するための指標が提供される。
上述した目的、およびその他の目的、特徴および利点は、以下に述べる好適な実施の形態、およびそれに付随する以下の図面によってさらに明らかになる。
以下、本発明の実施の形態について、図面を用いて説明する。尚、すべての図面において、同様な構成要素には同様の符号を付し、適宜説明を省略する。
なお、以下に示す説明において、各装置の各構成要素は、ハードウエア単位の構成ではなく、機能単位のブロックを示している。各装置の各構成要素は、任意のコンピュータのCPU、メモリ、メモリにロードされた本図の構成要素を実現するプログラム、そのプログラムを格納するハードディスクなどの記憶メディア、ネットワーク接続用インタフェースを中心にハードウエアとソフトウエアの任意の組合せによって実現される。そして、その実現方法、装置には様々な変形例がある。
(第1の実施形態)
図1は、第1の実施形態に係る評価方法を示すフローチャートである。この評価方法は、以下の工程を含んでいる。まず、複数の種類の粒子が攪拌容器の内部で攪拌される状態がシミュレートされる(ステップS10)。次に、シミュレートされた各粒子の第1時刻から第2時刻までの間の移動量が算出される(ステップS20)。次に、所定のデータセットが生成される(ステップS30)。データセットは、各粒子と、当該粒子に対応する移動量と、を対応付けて含んでいる。次に、データセットが統計的に処理された形式で表示される(ステップS40)。
図1は、第1の実施形態に係る評価方法を示すフローチャートである。この評価方法は、以下の工程を含んでいる。まず、複数の種類の粒子が攪拌容器の内部で攪拌される状態がシミュレートされる(ステップS10)。次に、シミュレートされた各粒子の第1時刻から第2時刻までの間の移動量が算出される(ステップS20)。次に、所定のデータセットが生成される(ステップS30)。データセットは、各粒子と、当該粒子に対応する移動量と、を対応付けて含んでいる。次に、データセットが統計的に処理された形式で表示される(ステップS40)。
ステップS40において統計的に処理された形式で表示されたデータセットは、混合状態情報として取り扱うことができる。すなわち、混合状態情報とは、複数の種類の粒子の混合状態を示す情報をいい、たとえば以下のような情報をいう。
(i)複数の種類の粒子がどの程度均一に混合されているか(複数の種類の粒子の混合の均一度)を示す情報
(ii)混合後、系内で複数の粒子が不均一に分布する場合において、各粒子がどのような状態で分布しているか(各粒子の分布状況)を示す情報
(iii)複数の種類の粒子が種類ごとにどのように分布しているか(各種類の粒子の分布状況)を示す情報
(i)複数の種類の粒子がどの程度均一に混合されているか(複数の種類の粒子の混合の均一度)を示す情報
(ii)混合後、系内で複数の粒子が不均一に分布する場合において、各粒子がどのような状態で分布しているか(各粒子の分布状況)を示す情報
(iii)複数の種類の粒子が種類ごとにどのように分布しているか(各種類の粒子の分布状況)を示す情報
本実施形態では、以上の混合状態情報に基づいて、複数の種類の粒子の混合状態を評価することができる。このようにして、本実施形態では、攪拌容器内における粒子の混合状態を判断するための指標が提供される。
次に、本実施形態の評価装置100について、図2を用いて説明する。評価装置100は、図1に示される評価方法を実行する。図2は、評価装置100の構成を示すブロック図である。評価装置100は、入力部102と、シミュレーション部104と、移動量算出部106と、データセット生成部108と、表示部110と、記憶部112と、を含んでいる。入力部102は、評価装置100のユーザの指示を示す信号を、シミュレーション部104、移動量算出部106、データセット生成部108および表示部110に送出する。シミュレーション部104は、粒子の攪拌状態をシミュレートする(ステップS10)。移動量算出部106は、移動量を算出する(ステップS20)。データセット生成部108は、データセットを生成する(ステップS30)。表示部110は、データセットを統計的に処理された形式で表示する(ステップS40)。記憶部112は、シミュレーション部104、移動量算出部106、データセット生成部108および表示部110からの情報を記憶する。評価装置100の詳細は以下のとおりである。
シミュレーション部104について説明する。シミュレーション部104は、複数の種類の粒子が攪拌容器の内部で攪拌される状態をシミュレートする。本実施形態では、シミュレーション部104は、離散要素法(DEM:Discrete Element Method)に基づいて、複数の種類の粒子が攪拌容器の内部で攪拌される状態をシミュレートする。他の例においては、シミュレーション部104は、DEMとは異なる方法(例えば、埋め込み境界法)を用いて、複数の種類の粒子が攪拌容器の内部で攪拌される状態をシミュレートしてもよい。
シミュレーション部104は、DEMにおいて、攪拌容器および粒子をモデル化する。モデル化される攪拌容器の構造および形状は、特定の構造および形状に限られない。モデル化される粒子の形状も、特定の形状に限られない。なお、本実施形態においてモデル化される粒子は、固体粒子である。
モデル化された粒子について、図3を用いて説明する。図3は、二粒子iおよびjの接触力モデルの概念図である。図3(a)は、粒子iと粒子jとの接触点の法線方向の接触力モデルを示している。図3(b)は、粒子iと粒子jとの接触点の接線方向の接触力モデルを示している。本実施形態では、粒子は、球状の形状を有する。DEMにおいて、互いに接触する粒子iと粒子jとの接触点の法線方向にはたらく力は、図3(a)に示されるように、バネ定数knのバネおよび減衰係数ηnのダッシュポットによりモデル化される。一方、互いに接触する粒子iと粒子jとの接触点の接線方向にはたらく力は、図3(b)に示されるように、バネ定数ktのバネ、減衰係数ηtのダッシュポットおよび動摩擦係数μfの摩擦スライダによりモデル化される。ユーザは、入力部102により、バネ定数knおよびkt、減衰係数ηnおよびηtならびに動摩擦係数μfとして適当な値を、シミュレーション部104に入力してもよい。この場合、シミュレーション部104は、入力されたパラメータに基づいて、粒子をモデル化する。
DEMでは、各粒子の並進運動の方程式および回転運動の方程式が、図3(a)および図3(b)に示されるモデルに基づいて立てられる。粒子iにおける並進運動の方程式および回転運動の方程式は、それぞれ、以下の式(1)および(2)に示されるようになる。シミュレーション部104は、図3(a)および図3(b)に示されるモデルに基づいて、式(1)および(2)に示される運動方程式を立てる。

ただし、mi、Ii、vi、ωi、Riは、それぞれ、粒子iの質量、慣性モーメント、速度、角速度、半径である。Fij
NおよびFij
Tは、それぞれ、粒子iと粒子jとの接触によって生じる、法線方向および接線方向の力である。gは、重力加速度である。τrijは、粒子iと粒子jとの接触によって生じるトルクである。式(1)では、シミュレーション部104は、重力加速度を考慮して並進運動の方程式を立てている。重力加速度が考慮されない場合、migの項が式(1)の右辺から除去されてもよい。式(1)および(2)と同様の式が、粒子i以外の各粒子にも立てられる。本実施形態では、シミュレーション部104がこれらの運動方程式を解く。シミュレーション部104は、差分法を用いた数値解析により運動方程式を解いてもよい。このようにしてシミュレーション部104は、粒子の攪拌状態をシミュレートする(ステップS10)。
シミュレーション部104は、シミュレーションの結果を記憶部112に出力する。記憶部112は、シミュレーションの結果を記憶する。当該シミュレーションの結果は、所定時刻における各粒子の座標の情報を示している。シミュレーション部104は、シミュレーションが終了した後、シミュレーションが終了した旨を示すシミュレーション終了信号を移動量算出部106に送出する。
次に、移動量算出部106について説明する。移動量算出部106は、シミュレーション終了信号をシミュレーション部104から受け取る。次に、移動量算出部106は、記憶部112にアクセスする。そして移動量算出部106は、記憶部112に記憶されているシミュレーションの結果を読み取る。次に、移動量算出部106は、シミュレートされた各粒子の第1時刻から第2時刻までの間の移動量を算出する(ステップS20)。本実施形態では、各粒子の移動量は、当該粒子が第1時刻から第2時刻までの間に攪拌容器の内部で移動した距離である。第1時刻および第2時刻は、任意の時刻である。第1時刻は、例えば、攪拌が開始する時刻であってもよい。第2時刻は、例えば、攪拌が終了する時刻であってもよい。
本実施形態では、移動量算出部106は、各粒子が第1時刻から第2時刻までの間に攪拌容器の内部で移動した距離を算出する。この場合、移動量算出部106は、式(1)の解に基づいて、当該距離を算出してもよい。式(1)によって所定時刻における各粒子の座標が与えられる。移動量算出部106は、所定時刻における各粒子の座標をトレースすることで、各粒子が第1時刻から第2時刻までの間に攪拌容器の内部で移動した距離を算出することができる。
移動量算出部106は、各粒子の移動距離を記憶部112に出力する。記憶部112は、各粒子の移動距離を記憶する。移動量算出部106は、移動量の算出が終了した後、移動量の算出が終了した旨を示す移動量算出終了信号をデータセット生成部108に送出する。
次に、データセット生成部108について説明する。データセット生成部108は、移動量算出終了信号を移動量算出部106から受け取る。次に、データセット生成部108は、記憶部112にアクセスする。そしてデータセット生成部108は、記憶部112に記憶されている各粒子の移動量を読み取る。次に、データセット生成部108は、データセットを生成する(ステップS30)。データセットは、各粒子と、当該粒子に対応する移動量と、を対応付けて含んでいる。
データセット生成部108は、データセットを記憶部112に出力する。記憶部112は、データセットを記憶する。データセット生成部108は、データセットの生成が終了した後、データセットの生成が終了した旨を示すデータセット終了信号を表示部110に送出する。
次に、表示部110について説明する。表示部110は、データセット生成終了信号をデータセット生成部108から受け取る。次に、表示部110は、記憶部112にアクセスする。そして表示部110は、記憶部112に記憶されているデータセットを読み取る。次に、表示部110は、データセットを統計的に処理する。次に、表示部110は、データセットを統計的に処理された形式で、評価装置100のユーザに対して表示する(ステップS40)。本実施形態では、表示部110は、ディスプレイに当該データセットを表示する。統計的に処理された形式で表示されたデータセットは、上述した混合状態情報として取り扱うことができる。
次に、ステップS40の詳細について、図4から図7を用いて説明する。
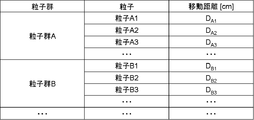
図4は、ステップS40で表示されるデータセットの第1例を示す図である。ステップS40では、図4に示されるように、データセットが統計的に処理されてテーブル形式で表示される。図4のテーブルでは、各粒子と、当該粒子に対応する移動量と、が対応付けられている。さらに図4では、各粒子と、当該粒子に対応する移動量と、を示すセル(例えば、図4の「粒子A2」および「DA2」のセル)が、粒子の種類(粒子群)ごとに分類されている。表示部110は、図4に示されるテーブルを評価装置100のユーザに対して表示する。評価装置100のユーザは、図4のテーブルによって、各粒子の移動距離を俯瞰的に把握することができる。このようにして評価装置100のユーザは、図4のテーブルに基づいて、粒子の混合状態を評価する。
図5は、ステップS40で表示されるデータセットの第2例を示す図である。ステップS40では、図5に示されるように、データセットが統計的に処理されてテーブル形式で表示される。図5のテーブルでは、各粒子が移動量に基づいて分類されている度数分布表が表示されている。図5の度数分布表は、例えば、移動距離がd1[cm]からd2[cm]までの範囲に入る粒子の頻度がfA1[%]であること(図5の粒子群Aの一行目)を意味している。図5では、粒子の種類(粒子群)ごとに度数分布表が生成されている。他の例では、複数の種類の粒子群ごとに度数分布表が生成されてもよいし、すべての種類の粒子を含む度数分布表が生成されてもよい。表示部110は、図5に示されるテーブルを評価装置100のユーザに対して表示する。評価装置100のユーザは、図5のテーブルによって、各粒子の移動距離を俯瞰的に把握することができる。このようにして評価装置100のユーザは、図5のテーブルに基づいて、粒子の混合状態を評価する。
図6は、ステップS40で表示されるデータセットの第3例を示す図である。ステップS40では、図6に示されるように、データセットが統計的に処理されてグラフィカル形式で表示される。図6のグラフでは、各粒子と、当該粒子に対応する移動量と、が対応付けられている。さらに図6では、各粒子を示すプロット(例えば、図6の粒子A2を示す白四角プロット)が、粒子の種類(粒子群)ごとに分類されている。表示部110は、図6に示されるグラフを評価装置100のユーザに対して表示する。評価装置100のユーザは、図6のグラフによって、各粒子の移動距離を俯瞰的に把握することができる。このようにして評価装置100のユーザは、図6のグラフに基づいて、粒子の混合状態を評価する。
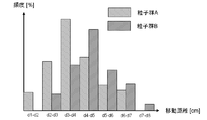
図7は、ステップS40で表示されるデータセットの第4例を示す図である。ステップS40では、図7に示されるように、データセットが統計的に処理されてグラフィカル形式で表示される。図7のグラフでは、各粒子が移動量に基づいて分類されているヒストグラムが表示されている。図7では、粒子の種類(粒子群)ごとにヒストグラムが生成されている。他の例では、複数の種類の粒子群ごとにヒストグラムが生成されてもよいし、すべての種類の粒子を含むヒストグラムが生成されてもよい。表示部110は、図7に示されるグラフを評価装置100のユーザに対して表示する。評価装置100のユーザは、図7のグラフによって、各粒子の移動距離を俯瞰的に把握することができる。このようにして評価装置100のユーザは、図7のグラフに基づいて、粒子の混合状態を評価する。
本実施形態では、以上のように統計的に処理された形式で表示されたデータセットは、混合状態情報として取り扱うことができる。このようにして、本実施形態では、攪拌容器内における粒子の混合状態を判断するための指標が提供される。
以上、本発明の実施形態について説明したが、上記の実施形態に限らず種々の変形が可能である。すなわち、本実施形態では、流体中(例えば、気体雰囲気および液体中)における粒子の混合を取り扱うことができる。たとえば、本実施形態では、気相(例えば、空気)中の粒子の混合を例に挙げて説明したが、混合の場は気相に限らず液相であってもよい。たとえば、溶媒中の粒子の混合にも適用できる。この場合、溶媒となる液体の物性として、粘性等を考慮してシミュレーションする方法を採用してもよい。
(第2の実施形態)
第1の実施形態では、粒子の移動量を、3次元空間内の実際の軌跡に沿った移動量としたが、本実施形態では、射影軌跡において当該粒子が移動した距離を移動量とする。具体的には、各粒子が第1時刻から第2時刻までに辿った軌跡を所定の平面または所定の直線に正射影させた軌跡に基づいて移動量を算出する。
第1の実施形態では、粒子の移動量を、3次元空間内の実際の軌跡に沿った移動量としたが、本実施形態では、射影軌跡において当該粒子が移動した距離を移動量とする。具体的には、各粒子が第1時刻から第2時刻までに辿った軌跡を所定の平面または所定の直線に正射影させた軌跡に基づいて移動量を算出する。
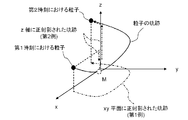
射影軌跡について、図8を用いて説明する。図8は、射影軌跡を説明するための図である。図8では、xyz直交座標系において粒子が第1時刻から第2時刻までに所定の軌跡を辿っている。第1例において、射影軌跡は、xy平面に正射影された軌跡である。第2例においては、射影軌跡は、z軸に正射影された軌跡である。なお、図8の粒子を示す座標は、座標Mにおいてzの最小値をとる。このようにして、粒子は、z軸に正射影された軌跡において、zが減少する方向に移動した後、zが増加する方向に移動している。各粒子の移動量が射影軌跡において当該粒子が移動した距離になる場合、移動量算出部106は、シミュレーションの結果に対して、図8に示される座標系を適用する。そして、移動量算出部106は、各粒子が射影軌跡において移動した距離を算出する。
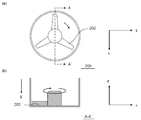
図8に示されるxyz座標系の方向は、攪拌容器との関係で決められてもよい。具体例について、図9を用いて説明する。図9(a)は、攪拌容器の一例(攪拌容器200)を示す平面図である。図9(b)は、図9(a)のA-A´における断面図である。
攪拌容器200は、羽根202を含んでいる。攪拌容器200では、羽根202は、重力加速度gと直交する方向に回転している。シミュレーション部104は、攪拌容器200のモデル化において、x軸方向、y軸方向およびz軸方向を、図9(a)および図9(b)に示されるように規定する。図9(a)および(b)では、z軸方向は、羽根202の回転軸方向に沿っている。一方、x軸およびy軸方向は、羽根202の回転面方向に沿っている。移動量算出部106は、当該座標系において、各粒子が射影軌跡において移動した距離を算出する。
本実施形態のデータセット生成部108および表示部110は、第1の実施形態のデータセット生成部108および表示部110と同様に動作する。本実施形態のデータセット生成部108は、第1の実施形態のデータセット生成部108と同様に、データセットを生成する。データセットは、各粒子と、当該粒子に対応する移動量と、を対応付けて含んでいる。本実施形態の表示部110は、第1の実施形態の表示部110と同様に、データセットを統計的に処理することで得られる混合状態情報を、評価装置100のユーザに対して表示する。ただし、本実施形態は、各粒子の移動量が射影軌跡において当該粒子が移動した距離である点について、第1の実施形態と異なる。
本実施形態では、xyz直交座標系を採用し、射影軌跡を求めたが、これに限らず極座標系を採用し、射影軌跡を求めてもよい
(第3の実施形態)
図10は、第3の実施形態に係る評価装置100の構成を示すブロック図であり、第1の実施形態の図2に対応する。本実施形態に係る評価装置100は、表示部110に代わって評価部114を有している点を除いて、第1の実施形態に係る評価装置100と同様の構成である。詳細を後述するように、評価部114は、粒子の混合状態を評価するために用いられる。
図10は、第3の実施形態に係る評価装置100の構成を示すブロック図であり、第1の実施形態の図2に対応する。本実施形態に係る評価装置100は、表示部110に代わって評価部114を有している点を除いて、第1の実施形態に係る評価装置100と同様の構成である。詳細を後述するように、評価部114は、粒子の混合状態を評価するために用いられる。
図11は、図10に示した評価部114の構成を示すブロック図である。本図に示すように、評価部114は、類似度評価部116及び散布度評価部118を有している。
類似度評価部116及び散布度評価部118は、データセット生成部108又は記憶部112から、上記したデータセットを受け取る。この場合、データセットは、一の種類の粒子の移動量の分布を示す情報及び他の種類の粒子の移動量の分布を示す情報を含んでいる(例えば、図7)。
類似度評価部116は、一の種類の粒子の移動量の分布と他の種類の粒子の移動量の分布の類似度を評価する。散布度評価部118は、一の種類の粒子の移動量の分布の散布度及び他の種類の粒子の移動量の分布の散布度を評価する。
評価部114は、上記した類似度に基づいて、一の種類の粒子と他の種類の粒子の混合状態を評価する。さらに、評価部114は、上記した散布度を考慮して、上記した混合状態を評価する。具体的には、評価部114は、一の種類の粒子の上記した散布度及び他の種類の粒子の上記した散布度のそれぞれが基準値以下である場合、上記した混合状態を評価する。
本発明者らが検討したところ、一の種類の粒子と他の種類の粒子の混合の均一性は、上記した類似度及び上記した散布度と以下の関係を有する可能性が高いことが明らかとなった。
第1に、一の種類の粒子の上記した散布度及び他の種類の粒子の上記した散布度のいずれもが低い場合、上記した類似度と上記した均一性が強い相関関係を有することが明らかとなった。言い換えると、この場合、上記した類似度が高いほど上記した均一性も高くなる傾向がある。
本発明者らが検討したところ、上記した相関関係の理由として、一の種類のいずれの粒子も他の種類のいずれの粒子もほぼ同じ距離を移動していることが可能性として挙がった。上記した散布度が低い場合、一の種類の粒子においてはいずれの粒子もほぼ同じ距離を移動している。同様に、他の種類の粒子においてはいずれの粒子もほぼ同じ距離を移動している。さらに上記した類似度が高い場合、一の種類の上記した分布と他の種類の上記した分布の重なり合いが大きい。言い換えると、一の種類の粒子も他の種類の粒子もほぼ同じ距離を移動している。このような場合、上記した均一性が高くなる可能性が高い。
第2に、一の種類の粒子の上記した散布度及び他の種類の粒子の上記した散布度のいずれか一方又は両方が高い場合、上記した類似度と上記した均一性の相関関係は弱くなることが明らかとなった。言い換えると、この場合、上記した類似度が高くなっても、上記した均一性が高くならない場合が多い。
本発明者らが検討したところ、上記した相関関係の理由として、粒子の移動距離のばらつきが上記した均一性に影響を与えていることが可能性として挙がった。上記した類似度が高い場合、一の種類の上記した分布の中心と他の種類の上記した分布の中心がほぼ同じ位置になる。この場合においても一の種類の粒子の上記した散布度が高いとき、一の種類の粒子には、上記した中心から移動量のずれた粒子がある程度の割合で含まれている。そしてこのような粒子が上記した均一性を低くしている可能性が高い。
以上によれば、一の種類の粒子の上記した散布度及び他の種類の粒子の上記した散布度のそれぞれが基準値以下である場合に、上記した均一性を上記した類似度に基づいて正確に評価することができるといえる。
図12は、粒子の移動量の分布の類似度及び粒子の移動量の分布の散布度の評価方法の一例を説明するための図である。本図(a)は、一の種類の粒子(粒子群A)の移動距離の分布(確率密度)及び他の種類の粒子(粒子群B)の移動距離の分布(確率密度)を示している。本図(b)は、粒子群Aの上記した分布の累積確率及び粒子群Bの上記した分布の累積確率を示している。なお、粒子群Aの上記した累積確率は、粒子群Aの上記した確率密度の積分によって与えられる。同様に、粒子群Bの上記した累積確率は、粒子群Bの上記した確率密度の積分によって与えられる。
本図(b)に示すように、粒子群Aの上記した分布と粒子群Bの上記した分布の類似度は、粒子群Aの上記した累積確率と粒子群Bの上記した累積確率を比較することにより、評価することができる。詳細には、粒子群Aの累積確率と粒子群Bの累積確率の差を各移動距離で算出する。そして上記した差の絶対値の最大値(コルモゴロフ-スミルノフ検定のD値)に基づいて上記した類似度を評価する。この場合、上記した最大値が小さいほど粒子群Aの上記した分布と粒子群Bの上記した分布の類似度が高いといえる。これにより、上記した最大値が所定の基準値以下であるか否かを判断することにより、粒子群Aと粒子群Bの混合状態を評価することができる。
ただし、粒子群Aの上記した分布と粒子群Bの上記した分布の類似度の評価方法は、上記した例に限定されるものではない。例えば、本図(b)に示す例では、粒子群Aの累積確率と粒子群Bの累積確率の差の平均値を算出してもよい。この場合、上記した平均値が所定の基準値以下であるか否かを判断することにより、粒子群Aと粒子群Bの混合状態を評価することができる。
本図(b)に示すように、粒子群Aの分布の散布度は、粒子群Aの上記した累積確率の傾きに基づいて評価することができる。この場合、例えば、累積確率が第1値以上第2値以下である範囲における累積確率の傾きの平均値に基づいて、散布度を評価することができる。なお、第1値及び第2値は、それぞれ、例えば、中央値(50%)未満の値(例えば、25%)及び中央値(50%)より大きい値(例えば、75%)である。他の例として、累積確率が基準確率値である位置における累積確率の傾きに基づいて、散布度を評価することができる。この場合、基準確率値は、例えば、累積確率の傾き(累積確率の一次導関数の値)が最大値をとる位置における累積確率の値であり、又は適当な特定の値(例えば、50%)である。なお、粒子群Bの分布の散布度も、上記と同様にして評価することができる。
ただし、粒子群Aの上記した分布の散布度及び粒子群Bの上記した分布の散布度の評価方法は、上記した例に限定されるものではない。例えば、本図(a)に示すように、分布の標準偏差に基づいて、散布度を評価してもよい。
以上、図面を参照して本発明の実施形態について述べたが、これらは本発明の例示であり、上記以外の様々な構成を採用することもできる。
以下、参考形態の例を付記する。
1.複数の種類の粒子が攪拌容器の内部で攪拌される状態をシミュレートする工程と、
シミュレートされた前記各粒子の第1時刻から第2時刻までの間の移動量を算出する工程と、
前記複数の種類のうちの第1種類の粒子の前記移動量の分布と前記複数の種類のうちの第2種類の粒子の前記移動量の分布の類似度を評価する工程と、
前記類似度に基づいて前記第1種類の粒子と前記第2種類の粒子の混合状態を評価する工程と、
を含む評価方法。
2.1.に記載の評価方法において、
前記類似度を評価する工程では、
前記第1種類の粒子の前記移動量の前記分布の累積確率と前記第2種類の粒子の前記移動量の前記分布の累積確率を比較することにより、前記類似度を評価する評価方法。
3.1.又は2.に記載の評価方法において、
前記第1種類の粒子の前記移動量の分布の散布度及び前記第2種類の粒子の前記移動量の分布の散布度を評価する工程をさらに含み、
前記第1種類の粒子の前記散布度及び前記第2種類の粒子の前記散布度のそれぞれが基準値以下である場合に前記第1種類の粒子と前記第2種類の粒子の混合状態を評価する評価方法。
4.複数の種類の粒子が攪拌容器の内部で攪拌される状態をシミュレートするシミュレーション部と、
シミュレートされた前記各粒子の第1時刻から第2時刻までの間の移動量を算出する移動量算出部と、
前記複数の種類のうちの第1種類の粒子の前記移動量の分布と前記複数の種類のうちの第2種類の粒子の前記移動量の分布の類似度を評価する類似度評価部と、
前記類似度に基づいて前記第1種類の粒子と前記第2種類の粒子の混合状態を評価する評価部と、
を含む評価装置。
5.コンピュータを評価装置として機能させるためのプログラムであって、
前記コンピュータに、
複数の種類の粒子が攪拌容器の内部で攪拌される状態をシミュレートする機能と、
シミュレートされた前記各粒子の第1時刻から第2時刻までの間の移動量を算出する機能と、
前記複数の種類のうちの第1種類の粒子の前記移動量の分布と前記複数の種類のうちの第2種類の粒子の前記移動量の分布の類似度を評価する機能と、
前記類似度に基づいて前記第1種類の粒子と前記第2種類の粒子の混合状態を評価する機能と、
を持たせるプログラム。
1.複数の種類の粒子が攪拌容器の内部で攪拌される状態をシミュレートする工程と、
シミュレートされた前記各粒子の第1時刻から第2時刻までの間の移動量を算出する工程と、
前記複数の種類のうちの第1種類の粒子の前記移動量の分布と前記複数の種類のうちの第2種類の粒子の前記移動量の分布の類似度を評価する工程と、
前記類似度に基づいて前記第1種類の粒子と前記第2種類の粒子の混合状態を評価する工程と、
を含む評価方法。
2.1.に記載の評価方法において、
前記類似度を評価する工程では、
前記第1種類の粒子の前記移動量の前記分布の累積確率と前記第2種類の粒子の前記移動量の前記分布の累積確率を比較することにより、前記類似度を評価する評価方法。
3.1.又は2.に記載の評価方法において、
前記第1種類の粒子の前記移動量の分布の散布度及び前記第2種類の粒子の前記移動量の分布の散布度を評価する工程をさらに含み、
前記第1種類の粒子の前記散布度及び前記第2種類の粒子の前記散布度のそれぞれが基準値以下である場合に前記第1種類の粒子と前記第2種類の粒子の混合状態を評価する評価方法。
4.複数の種類の粒子が攪拌容器の内部で攪拌される状態をシミュレートするシミュレーション部と、
シミュレートされた前記各粒子の第1時刻から第2時刻までの間の移動量を算出する移動量算出部と、
前記複数の種類のうちの第1種類の粒子の前記移動量の分布と前記複数の種類のうちの第2種類の粒子の前記移動量の分布の類似度を評価する類似度評価部と、
前記類似度に基づいて前記第1種類の粒子と前記第2種類の粒子の混合状態を評価する評価部と、
を含む評価装置。
5.コンピュータを評価装置として機能させるためのプログラムであって、
前記コンピュータに、
複数の種類の粒子が攪拌容器の内部で攪拌される状態をシミュレートする機能と、
シミュレートされた前記各粒子の第1時刻から第2時刻までの間の移動量を算出する機能と、
前記複数の種類のうちの第1種類の粒子の前記移動量の分布と前記複数の種類のうちの第2種類の粒子の前記移動量の分布の類似度を評価する機能と、
前記類似度に基づいて前記第1種類の粒子と前記第2種類の粒子の混合状態を評価する機能と、
を持たせるプログラム。
この出願は、2013年9月4日に出願された日本出願特願2013-182847号を基礎とする優先権を主張し、その開示の全てをここに取り込む。
Claims (13)
- 複数の種類の粒子が攪拌容器の内部で攪拌される状態をシミュレートする工程と、
シミュレートされた前記各粒子の第1時刻から第2時刻までの間の移動量を算出する工程と、
前記各粒子と、当該粒子に対応する前記移動量と、を対応付けて含むデータセットを生成する工程と、
前記データセットを統計的に処理された形式で表示する工程と、
を含む評価方法。 - 請求項1に記載の評価方法であって、
前記データセットを統計的に処理された形式で表示する前記工程では、前記データセットが統計的に処理されてグラフィカル形式で表示される評価方法。 - 請求項2に記載の評価方法であって、
前記データセットを統計的に処理された形式で表示する前記工程では、前記各粒子と、当該粒子に対応する前記移動量と、が対応付けられたグラフが表示される評価方法。 - 請求項3に記載の評価方法であって、
前記グラフでは、前記各粒子を示すプロットが前記粒子の種類ごとに分類されている評価方法。 - 請求項2に記載の評価方法であって、
前記データセットを統計的に処理された形式で表示する前記工程では、前記各粒子が前記移動量に基づいて分類されているヒストグラムが表示される評価方法。 - 請求項1に記載の評価方法であって、
前記データセットを統計的に処理された形式で表示する前記工程では、前記データセットが統計的に処理されてテーブル形式で表示される評価方法。 - 請求項6に記載の評価方法であって、
前記データセットを統計的に処理された形式で表示する前記工程では、前記各粒子と、当該粒子に対応する前記移動量と、が対応付けられたテーブルが表示される評価方法。 - 請求項7に記載の評価方法であって、
前記テーブルでは、前記各粒子と、当該粒子に対応する前記移動量と、を示すセルが前記粒子の種類ごとに分類されている評価方法。 - 請求項6に記載の評価方法であって、
前記データセットを統計的に処理された形式で表示する前記工程では、前記各粒子が前記移動量に基づいて分類されている度数分布表が表示される評価方法。 - 請求項1から9までのいずれか一項に記載の評価方法であって、
前記各粒子の移動量は、当該粒子が前記第1時刻から前記第2時刻までの間に前記攪拌容器の内部で移動した距離である評価方法。 - 請求項1から9までのいずれか一項に記載の評価方法であって、
前記各粒子の移動量は、当該粒子が前記第1時刻から前記第2時刻までに辿った軌跡が所定の平面または所定の直線に正射影された射影軌跡において当該粒子が移動した距離である評価方法。 - 複数の種類の粒子が攪拌容器の内部で攪拌される状態をシミュレートするシミュレーション部と、
シミュレートされた前記各粒子の第1時刻から第2時刻までの間の移動量を算出する移動量算出部と、
前記各粒子と、当該粒子に対応する前記移動量と、を対応付けて含むデータセットを生成するデータセット生成部と、
前記データセットを統計的に処理された形式で表示する表示部と、
を含む評価装置。 - コンピュータを評価装置として機能させるためのプログラムであって、
前記コンピュータに、
複数の種類の粒子が攪拌容器の内部で攪拌される状態をシミュレートする機能と、
シミュレートされた前記各粒子の第1時刻から第2時刻までの間の移動量を算出する機能と、
前記各粒子と、当該粒子に対応する前記移動量と、を対応付けて含むデータセットを生成する機能と、
前記データセットを統計的に処理された形式で表示する機能と、
を持たせるプログラム。
Applications Claiming Priority (2)
| Application Number | Priority Date | Filing Date | Title |
|---|---|---|---|
| JP2013182847 | 2013-09-04 | ||
| JP2013-182847 | 2013-09-04 |
Publications (1)
| Publication Number | Publication Date |
|---|---|
| WO2015033739A1 true WO2015033739A1 (ja) | 2015-03-12 |
Family
ID=52628222
Family Applications (1)
| Application Number | Title | Priority Date | Filing Date |
|---|---|---|---|
| PCT/JP2014/071102 Ceased WO2015033739A1 (ja) | 2013-09-04 | 2014-08-08 | 評価方法、評価装置およびプログラム |
Country Status (2)
| Country | Link |
|---|---|
| JP (1) | JP6282958B2 (ja) |
| WO (1) | WO2015033739A1 (ja) |
Cited By (2)
| Publication number | Priority date | Publication date | Assignee | Title |
|---|---|---|---|---|
| CN120995318A (zh) * | 2025-10-23 | 2025-11-21 | 福州高彪建材有限公司 | 一种融合多源数据的腻子粉颗粒度异常预警系统 |
| WO2026034094A1 (ja) * | 2024-08-08 | 2026-02-12 | 国立大学法人東北大学 | 計算方法、計算装置、プログラム、計算モデル |
Citations (4)
| Publication number | Priority date | Publication date | Assignee | Title |
|---|---|---|---|---|
| JP2000214134A (ja) * | 1998-11-17 | 2000-08-04 | Sharp Corp | 容器内粒子の挙動シミュレ―ション方法及び挙動シミュレ―ション装置並びにそのプログラム記録媒体 |
| JP2007017380A (ja) * | 2005-07-11 | 2007-01-25 | Fuji Xerox Co Ltd | 粒子シミュレーション装置及び粒子シミュレーション方法、並びにコンピュータ・プログラム |
| JP2009119433A (ja) * | 2007-11-19 | 2009-06-04 | Sumitomo Chemical Co Ltd | 回転揺動ミル装置の媒体挙動シミュレーション装置 |
| JP2013029790A (ja) * | 2011-07-29 | 2013-02-07 | Ricoh Co Ltd | トナーの製造方法及びトナー |
Family Cites Families (1)
| Publication number | Priority date | Publication date | Assignee | Title |
|---|---|---|---|---|
| JP2010079493A (ja) * | 2008-09-25 | 2010-04-08 | Fuji Xerox Co Ltd | 粒子挙動解析装置、プログラム |
-
2014
- 2014-08-08 JP JP2014163084A patent/JP6282958B2/ja active Active
- 2014-08-08 WO PCT/JP2014/071102 patent/WO2015033739A1/ja not_active Ceased
Patent Citations (4)
| Publication number | Priority date | Publication date | Assignee | Title |
|---|---|---|---|---|
| JP2000214134A (ja) * | 1998-11-17 | 2000-08-04 | Sharp Corp | 容器内粒子の挙動シミュレ―ション方法及び挙動シミュレ―ション装置並びにそのプログラム記録媒体 |
| JP2007017380A (ja) * | 2005-07-11 | 2007-01-25 | Fuji Xerox Co Ltd | 粒子シミュレーション装置及び粒子シミュレーション方法、並びにコンピュータ・プログラム |
| JP2009119433A (ja) * | 2007-11-19 | 2009-06-04 | Sumitomo Chemical Co Ltd | 回転揺動ミル装置の媒体挙動シミュレーション装置 |
| JP2013029790A (ja) * | 2011-07-29 | 2013-02-07 | Ricoh Co Ltd | トナーの製造方法及びトナー |
Cited By (4)
| Publication number | Priority date | Publication date | Assignee | Title |
|---|---|---|---|---|
| WO2026034094A1 (ja) * | 2024-08-08 | 2026-02-12 | 国立大学法人東北大学 | 計算方法、計算装置、プログラム、計算モデル |
| JP2026029598A (ja) * | 2024-08-08 | 2026-02-20 | 国立大学法人東北大学 | 計算方法、計算装置、プログラム、計算モデル |
| CN120995318A (zh) * | 2025-10-23 | 2025-11-21 | 福州高彪建材有限公司 | 一种融合多源数据的腻子粉颗粒度异常预警系统 |
| CN120995318B (zh) * | 2025-10-23 | 2026-02-06 | 福州高彪建材有限公司 | 一种融合多源数据的腻子粉颗粒度异常预警系统 |
Also Published As
| Publication number | Publication date |
|---|---|
| JP2015072679A (ja) | 2015-04-16 |
| JP6282958B2 (ja) | 2018-02-21 |
Similar Documents
| Publication | Publication Date | Title |
|---|---|---|
| Dai et al. | Simulation credibility assessment methodology with FPGA-based hardware-in-the-loop platform | |
| AU2017227323B2 (en) | Particle simulation device, particle simulation method, and particle simulation program | |
| CN111859770B (zh) | 粒子行为模拟方法以及粒子行为模拟系统 | |
| Ballu et al. | Virtual metrology laboratory for e-learning | |
| JP6617812B1 (ja) | 車体部品の感度解析方法及び装置、車体部品の材料特性決定方法 | |
| US20130238302A1 (en) | Simulation method for high polymer material | |
| US12118645B2 (en) | Generating microstructures for materials based on machine learning models | |
| US20130311155A1 (en) | Simulation method for high polymer material | |
| CN112685844B (zh) | 轴流式冷却风扇护罩圆形开口尺寸的自动计算方法 | |
| JP6282958B2 (ja) | 評価方法、評価装置およびプログラム | |
| Ramos et al. | Cargo dynamic stability in the container loading problem-a physics simulation tool approach | |
| CN119784911B (zh) | 基于物理模拟的粒子碰撞方法、装置、设备及存储介质 | |
| Lu et al. | A framework for problem standardization and algorithm comparison in multibody system | |
| CN112682340B (zh) | 轴流式冷却风扇旋转方向的自动检测方法 | |
| US20170131183A1 (en) | Device, method, and program for crash simulation | |
| CN110709914A (zh) | 交互计算机模拟站中模型的连续监控 | |
| Mondesire et al. | Physics engine benchmarking in three-dimensional virtual world simulation | |
| JP2021190060A (ja) | シミュレーション装置、シミュレーション方法、プログラム | |
| JP2017162331A (ja) | 複合材料の解析方法及び複合材料の解析用コンピュータプログラム | |
| US20250093863A1 (en) | Computing device | |
| Atoir et al. | An evaluation of complementary filter method in increasing the performance of motion tracking gloves for virtual reality games | |
| CN115859014A (zh) | 绝对定位精度的预测方法、装置、设备及存储介质 | |
| JP7810345B2 (ja) | シミュレーション装置、シミュレーション方法、プログラム | |
| CN116839632B (zh) | 一种用于测试惯性稳定平台性能的虚拟仿真装置及其方法 | |
| CN114117955B (zh) | 一种接触角确定方法、装置、电子设备及存储介质 |
Legal Events
| Date | Code | Title | Description |
|---|---|---|---|
| 121 | Ep: the epo has been informed by wipo that ep was designated in this application |
Ref document number: 14842967 Country of ref document: EP Kind code of ref document: A1 |
|
| NENP | Non-entry into the national phase |
Ref country code: DE |
|
| 122 | Ep: pct application non-entry in european phase |
Ref document number: 14842967 Country of ref document: EP Kind code of ref document: A1 |