WO2015033720A1 - 光学測定方法 - Google Patents
光学測定方法 Download PDFInfo
- Publication number
- WO2015033720A1 WO2015033720A1 PCT/JP2014/070483 JP2014070483W WO2015033720A1 WO 2015033720 A1 WO2015033720 A1 WO 2015033720A1 JP 2014070483 W JP2014070483 W JP 2014070483W WO 2015033720 A1 WO2015033720 A1 WO 2015033720A1
- Authority
- WO
- WIPO (PCT)
- Prior art keywords
- spectrum
- target substance
- amount
- optical measurement
- measurement
- Prior art date
- Legal status (The legal status is an assumption and is not a legal conclusion. Google has not performed a legal analysis and makes no representation as to the accuracy of the status listed.)
- Ceased
Links
Images


Classifications
-
- G—PHYSICS
- G01—MEASURING; TESTING
- G01N—INVESTIGATING OR ANALYSING MATERIALS BY DETERMINING THEIR CHEMICAL OR PHYSICAL PROPERTIES
- G01N21/00—Investigating or analysing materials by the use of optical means, i.e. using sub-millimetre waves, infrared, visible or ultraviolet light
- G01N21/17—Systems in which incident light is modified in accordance with the properties of the material investigated
- G01N21/25—Colour; Spectral properties, i.e. comparison of effect of material on the light at two or more different wavelengths or wavelength bands
- G01N21/31—Investigating relative effect of material at wavelengths characteristic of specific elements or molecules, e.g. atomic absorption spectrometry
- G01N21/35—Investigating relative effect of material at wavelengths characteristic of specific elements or molecules, e.g. atomic absorption spectrometry using infrared light
- G01N21/359—Investigating relative effect of material at wavelengths characteristic of specific elements or molecules, e.g. atomic absorption spectrometry using infrared light using near infrared light
Definitions
- the present invention relates to an optical measurement method, and more particularly to a method for optically measuring a measurement object including a photosynthetic microorganism.
- microalgae can produce carbohydrate energy from CO2 using light, and because they are aquatic, they can also avoid competition with food and land use. It is attracting attention as a promising biological system.
- methods for utilizing microalgae for bioenergy production include methods for obtaining ethanol by enzymatic degradation of polysaccharides produced by microalgae, and various studies have been conducted (for example, non-patents). Reference 1 to 4 etc.).
- the present invention has been made in view of the above, and an object thereof is to provide an optical measurement method capable of measuring the amount of a target substance contained in a photosynthetic microorganism by a simple operation.
- the inventors have found that a diffuse reflection spectrum or a transmission spectrum obtained by irradiating a measurement target including a photosynthetic microorganism with near infrared light is included in the photosynthetic microorganism in the measurement target. It has been found that the amount varies depending on the amount of the substance, and the present invention has been completed. It was found that the amount of the target substance contained in the photosynthetic microorganism in the measurement target can be calculated by calculating the amount of the target substance based on the obtained diffuse reflection spectrum or transmission spectrum. Further, in the above method, the measurement can be performed by a simple operation as compared with the conventional method in which the photosynthetic microorganism is crushed and the target substance is extracted and then the amount is measured.
- an optical measurement method is an optical measurement method for measuring the amount of a target substance contained in a photosynthetic microorganism, and a near-infrared light with respect to a measurement object containing the photosynthetic microorganism.
- the target substance is a polysaccharide
- the amount of the target substance can be accurately measured.
- the polysaccharide is glycogen
- the optical measurement method according to an embodiment of the present invention can be suitably used.
- the measurement object can be irradiated with near infrared light.
- the measurement object can be irradiated with near infrared light.
- the diffuse reflection spectrum or the transmission spectrum is converted into an absorption spectrum, and the amount of the target substance contained from the absorption spectrum is calculated. Since the correction related to the line can be performed, the amount of the target substance can be measured with higher accuracy.
- the amount of the target substance can be measured by calculating the amount of the target substance from the spectrum using multivariate analysis.
- the spectrum obtained in the acquisition step may be a hyperspectrum.
- the acquisition of the spectrum from a measuring object can be performed more suitably.
- an optical measurement method capable of measuring the amount of a target substance contained in a photosynthetic microorganism with a simple operation.
- FIG. 1 is a diagram illustrating a configuration of an optical measurement apparatus 1 according to the present embodiment.
- the optical measurement apparatus 1 shown in FIG. 1 irradiates a measurement object 50 placed on a measurement table 40 with near infrared light, and detects the diffuse reflection light by the detection unit 20, thereby measuring the measurement object 50.
- the measurement device includes a light source 10, a detection unit 20, an analysis unit 30, and a measurement table 40.
- the measurement object 50 to be measured by the optical measurement apparatus 1 is, for example, an aqueous solution, pellets, powder, and the like, and the measurement object 50 includes photosynthetic microorganisms.
- photosynthetic microorganisms include microalgae such as cyanobacteria, diatoms, and green algae.
- the optical measurement apparatus 1 according to the present embodiment has one of the purposes of measurement to confirm the culture state of the photosynthetic microorganism by measuring the amount of polysaccharide in the photosynthetic microorganism contained in the measurement object 50. .
- a measurement object 50 is obtained by collecting a photosynthetic microorganism on the surface of a filter paper by filtering a liquid containing the photosynthetic microorganism with a filter paper.
- the light source 10 irradiates near infrared light to a region where the measurement object 50 is disposed.
- a halogen lamp or the like can be used as the light source 10.
- An SC light source that includes a seed light source and a nonlinear medium, inputs light emitted from the seed light source to the nonlinear medium, broadens the spectrum by a nonlinear optical effect in the nonlinear medium, and outputs the spectrum as supercontinuum (SC) light. Can also be used as the light source 10.
- SC light source is used as the light source 10
- the SC light source is preferably used for measurement of the measurement object 50 containing photosynthetic microorganisms.
- the light source 10 may have a function of modulating the intensity.
- the near infrared light emitted from the light source 10 is light having a wavelength range of 800 nm to 2500 nm. In the present embodiment, it is preferable to perform measurement in a wavelength range of 1000 nm to 2400 nm.
- the detection unit 20 detects light output in the direction in which the detection unit 20 is arranged after the near infrared light emitted from the light source 10 is diffusely reflected on the surface of the measurement object 50 as a diffuse reflection spectrum. Information on the detected diffuse reflection spectrum is sent to the analysis unit 30.
- the detection unit 20 for example, an MCT detector made of mercury, cadmium and tellurium, an InGaAs detector, or the like can be used.
- the detection unit 20 may be a hyperspectral sensor that acquires a hyperspectral image.
- the hyperspectral image is an image in which one pixel is composed of N pieces of wavelength data, and includes spectral information including reflection intensity data corresponding to a plurality of wavelengths for each pixel. That is, a hyperspectral image has a three-dimensional configuration that combines two-dimensional elements as an image and elements as spectral data because of the feature that each pixel constituting the image has intensity data of multiple wavelengths. It is data.
- the hyperspectral image refers to an image composed of pixels having intensity data in at least five wavelength bands per pixel. In the following embodiment, the case where the detection unit 20 is a hyperspectral sensor will be described.
- the analysis unit 30 receives diffuse reflection spectrum information sent from the detection unit 20 and performs arithmetic processing.
- the analysis unit 30 derives an absorption spectrum, a second-order differential spectrum of the diffuse reflection spectrum, a second-order differential spectrum of the absorption spectrum, and the like. Furthermore, it is good also as a structure by which the statistical process etc. for performing the evaluation which concerns on photosynthetic microorganisms are performed in the analysis part 30.
- the detection unit 20 is a hyperspectral sensor
- spectrum information related to each pixel is sent to the analysis unit 30, so that the analysis unit 30 may perform a calculation on the spectrum information. it can.
- the measurement table 40 is a table on which food to be measured 50 is placed.
- the measurement table 40 is preferably made of a material that transmits near-infrared light emitted from the light source 10.
- a diffuse reflection spectrum or a transmission spectrum related to the measurement target is obtained by irradiating the measurement target including the photosynthetic microorganism with near infrared light.
- the acquisition process to acquire and the calculation process to calculate the amount of the target substance based on the spectrum obtained in the acquisition process are included.
- the near-infrared light L ⁇ b> 1 is irradiated from the light source 10 toward the measurement object 50.
- Near-infrared light L1 emitted from the light source 10 enters the measurement object 50.
- the light traveling in the direction of the optical path L ⁇ b> 3 reaches the detection unit 20.
- a diffuse reflection spectrum is acquired (acquisition process).
- the diffuse reflection spectrum obtained by the detection unit 20 is sent to the analysis unit 30, and the analysis unit 30 performs a process related to the calculation of the amount of the target substance (calculation step).
- a target substance contained in a photosynthetic microorganism a polysaccharide or fats and oils are mentioned, for example. Among them, it is preferably used for polysaccharides, and glycogen, which is one of the polysaccharides, can be suitably calculated from the spectrum obtained by irradiation with near infrared light.
- glycogen which is a kind of polysaccharide
- FIGS. 1-10 an example in which the content of glycogen, which is a kind of polysaccharide, is measured using an object that contains a photosynthetic microorganism as the measurement object 50 will be described with reference to FIGS.
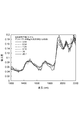
- FIG. 2 shows an absorption spectrum obtained by measuring as the measurement object 50 after partially removing water from a liquid mixed with A. platensis, which is a kind of microalgae that produces glycogen.
- the absorption spectrum shown in FIG. 2 was prepared by measuring a culture solution containing a plurality of types of photosynthetic microorganisms having different glycogen contents as a measurement object 50, and the diffuse reflection spectrum of this measurement object 50 was measured. Then, an absorption spectrum is derived from the measurement result, and the change of the peak corresponding to the glycogen content is examined.
- the measurement object 50 was prepared by the following method.
- the growing microalgae is taken out of the culture tank, and the water around the microalgae is removed by filtering with a filter paper, and the filter paper and the photosynthetic microorganisms on the filter paper are further prepared as the measurement object 50.
- the glycogen content (concentration) in the prepared measurement object 50 is 3.94, 6.04, 7.29, 8.28, 26, 26.7 (% by weight with respect to the photosynthetic microorganism), and the measurement wavelength is 1200 nm. The range was ⁇ 2200 nm.
- the absorption spectrum shown in FIG. 2 shows the average of all the pixel average absorption spectra obtained by the analysis unit 30 for the spectral data for each pixel sent from the detection unit 20 which is a hyperspectral sensor.
- FIG. 3 shows the results of examining the correspondence between the glycogen concentration measured by the conventional method and the glycogen concentration calculated based on the absorption spectrum.
- there are five measurement objects 50 (glycogen concentrations of 3.94, 6.04, 7.29, 8.28, 26, and 26.7 used for obtaining the absorption spectrum in FIG. These concentrations are obtained by conventional chemical treatment.)
- absorption spectra are obtained for each pixel, and the absorbances of peaks at wavelengths of 1630 nm, 1840 nm, and 2100 nm in each absorption spectrum are obtained.
- the results of calculating the glycogen concentration from the results are shown.
- FIG. 1 shows the results of calculating the glycogen concentration from the results.
- the horizontal axis represents the glycogen concentration obtained by chemical treatment according to the conventional method
- the vertical axis represents the glycogen concentration calculated from the absorbance of the peak of the absorption spectrum obtained by irradiating near infrared light.
- FIG. 3 shows a result obtained by plotting all the results of each pixel, performing a multiple regression analysis from the plotted data, and approximating with a linear function.
- the amount of the target substance can be calculated based on the reflection spectrum. Further, in the above method, the measurement can be performed by a simple operation as compared with the conventional method in which the photosynthetic microorganism is crushed and the target substance is extracted and then the amount is measured.
- the culture period is generally about a dozen days.
- the culture state of photosynthetic microorganisms is confirmed using the amount of glycogen as an index using the optical measurement method according to the present embodiment, the state can be confirmed almost in real time.
- feedback control of the culture conditions can be performed according to the amount of glycogen, that is, the culture status of the photosynthetic microorganisms. Can lead to a different direction.
- the measurement object 50 is irradiated with near infrared light.
- the influence of moisture in the obtained spectrum can be reduced, and the purpose can be improved with higher accuracy. It becomes possible to measure the amount of a substance.
- photosynthetic microorganisms do not die even when the surface is dried, culture is continued by returning the photosynthetic microorganisms to the culture tank, even if processing is performed to remove the moisture using filter paper and obtain the spectrum. be able to.
- the method of removing moisture is not limited to filtration using filter paper, and for example, a method is used in which a region where photosynthetic microorganisms gather in a culture tank is formed, and the photosynthetic microorganisms are taken out from the region and measured. You can also Further, the influence of moisture in the spectrum obtained by removing moisture from the measurement object 50 can be reduced. However, when it takes time to remove moisture, the time required for measuring the target substance (particularly the measurement object) The time required for 50 preparations) becomes longer.
- the diffuse reflection spectrum is converted into an absorption spectrum in the calculation step, and the amount of the target substance is calculated from the absorption spectrum.
- the amount of the target substance can be calculated with higher accuracy by using the multiple regression analysis which is one of the multivariate analyses.
- multivariate analysis that can be used in the calculation step includes principal component analysis in addition to multiple regression analysis.
- the present invention is not limited to this, and various modifications are possible.
- the configuration for calculating the amount of the target substance after converting the diffuse reflection spectrum to the absorption spectrum has been described, but the transmission spectrum is acquired instead of the diffuse reflection spectrum, and the absorption spectrum is calculated from the transmission spectrum. It may be configured to calculate the amount of the target substance.
- the evaluation was performed using the absorption spectrum.
- the amount of the target substance may be directly calculated from the diffuse reflection spectrum (or transmission spectrum).
- the wavelength range of near-infrared light emitted by the light source 10 can be changed as appropriate.
- a plurality of wavelength ranges are selected. Can also be measured.
- a more exact measurement can be performed by irradiating the near infrared light of the range of at least 100 nm before and behind the wavelength considered to have an absorption peak.
Landscapes
- Physics & Mathematics (AREA)
- Spectroscopy & Molecular Physics (AREA)
- Health & Medical Sciences (AREA)
- Life Sciences & Earth Sciences (AREA)
- Chemical & Material Sciences (AREA)
- Analytical Chemistry (AREA)
- Biochemistry (AREA)
- General Health & Medical Sciences (AREA)
- General Physics & Mathematics (AREA)
- Immunology (AREA)
- Pathology (AREA)
- Investigating Or Analysing Materials By Optical Means (AREA)
Abstract
光学測定装置1を用いた光学測定方法によれば、光合成微生物が含まれる測定対象物50に対して光源10から近赤外光を照射することで検出部20において得られた反射スペクトルに基づいて、分析部30において、目的物質の量を算出することができる。また、上記の方法では、従来のように光合成微生物を破砕して目的物質を抽出した後にその量を測定する方法と比較して簡便な操作で測定を行うことができる。
Description
本発明は、光学測定方法に関するものであり、特に、光合成微生物が含まれる測定対象物について光学的に測定する方法に関するものである。
近年、光合成微生物を利用したバイオエネルギーの生産に対する関心が高まっている。特に、微細藻類は光を利用してCO2から糖質エネルギーを生産することが可能であると共に、水生であるために食糧や土地利用との競合を回避することもできるため、バイオエネルギー生産のための有望な生体システムとして注目されている。バイオエネルギー生産に微細藻類を活用する方法としては、例えば、微細藻類が産生した多糖類を酵素分解することでエタノールを得る方法等が挙げられ、種々の検討が行われている(例えば、非特許文献1~4等参照)。
Yoshihiro Izumi, Shimpei Aikawa, Fumio Matsuda, Tomohisa Hasunuma, AkihikoKondo "Aqueous size-exclusion chromatographic method for the quantification of cyanobacterial native glycogen" Journal of Chromatography B, 930(2013) 90-97
Sang-Ho Yoo, Martin H. Spalding, Jay-lin Jane "Characterization of cyanobacterial glycogen isolated from the wild type and from a mutant lacking of branching enzyme" Carbohydrate Research 337(2002) 2195-2203
Takashi Osanai, Akira Oikawa, Miyuki Azuma, Kan Tanaka, Kazuki Saito, Masami Yokota Hirai, Masahiko Ikeuchi "Genetic Engineering of Group 2Factor SigE Widely Activates Expressions of Sugar Catabolic Genes in Synechocystis Species PCC 6803" The Journal of Biological Chemistry 286(2011) 30962-30971
Yuki Yamauchi, Yuki Kaniya, Yasuko Kaneko, Yukako Hihara "Physiological Roles of the cyAbrB Transcriptional Regulator Pair Sll0822 and Sll0359 in Synechocystis sp. strain PCC 6803"Journal of Bacteriology, 193(2011) 3702-3709
上記のようにバイオエネルギー生産に光合成微生物を適用する場合、バイオエネルギーに活用するための物質の生産量の確認を目的として、光合成微生物の培養状況を何らかの方法で把握する必要がある。しかしながら、光合成微生物の培養状況の指標となる物質(目的物質)は光合成微生物の細胞中に存在するため、細胞を破砕して目的物質を抽出した上でその量を測定する必要があった。また、目的物質を細胞から抽出するためには、種々の煩雑な作業が必要でもあった。
本発明は上記を鑑みてなされたものであり、簡便な操作で光合成微生物に含まれる目的物質の量を測定することが可能な光学測定方法を提供することを目的とする。
発明者らは、鋭意検討した結果、光合成微生物が含まれる測定対象物に対して近赤外光を照射することで得られる拡散反射スペクトル又は透過スペクトルが測定対象物中の光合成微生物に含まれる目的物質の量に応じて変化することを見出し、本願発明を完成させるに至った。得られた拡散反射スペクトル又は透過スペクトルに基づいて目的物質の量を算出することで、測定対象物中の光合成微生物に含まれる目的物質の量を算出することが可能であることを見出した。また、上記の方法では、従来のように光合成微生物を破砕して目的物質を抽出した後にその量を測定する方法と比較して簡便な操作で測定を行うことができる。
すなわち、本発明の一実施形態に係る光学測定方法は、光合成微生物に含まれる目的物質の量を測定する光学測定方法であって、前記光合成微生物が含まれる測定対象物に対して近赤外光を照射することで、当該測定対象物に係る拡散反射スペクトル又は透過スペクトルを取得する取得工程と、前記取得工程で得られたスペクトルに基づいて、前記目的物質の量を算出する算出工程と、を有することを特徴とする。
また、目的物質が多糖類である場合、目的物質の量の測定を精度よく行うことができることが確認された。さらに、多糖類はグリコーゲンである場合に本発明の一実施形態に係る光学測定方法を好適に用いることができる。
また、前記取得工程において、前記測定対象物に含まれる水分を一部除去した後に、前記測定対象物に対して近赤外光を照射する態様とすることができる。水分を一部除去した後に近赤外光を照射して拡散反射スペクトル又は透過スペクトルを取得することで、得られたスペクトルにおける水分の影響を減らすことができ、より高い精度で目的物質の量を測定することが可能となる。
また、前記算出工程において、前記拡散反射スペクトル又は透過スペクトルを吸収スペクトルに変換し、当該吸収スペクトルから含有される目的物質の量を算出する態様とすることで、吸収スペクトルへの変換の際にベースラインに係る補正を行うことができるため、より高い精度で目的物質の量を測定することが可能となる。
さらに、前記算出工程において、多変量解析を用いる態様とすることができる。このように多変量解析を用いてスペクトルから目的物質の量を算出することで、目的物質の量を測定することが可能となる。
また、前記取得工程で得られたスペクトルがハイパースペクトルである態様とすることができる。このような構成とすることで、測定対象物からのスペクトルの取得をより好適に行うことができる。
本発明によれば、簡便な操作で光合成微生物に含まれる目的物質の量を測定することが可能な光学測定方法が提供される。
以下、添付図面を参照して、本発明を実施するための形態を詳細に説明する。なお、図面の説明においては同一要素には同一符号を付し、重複する説明を省略する。
本発明の一実施形態に係る光学測定方法を実施する光学測定装置について説明する。図1は、本実施形態に係る光学測定装置1の構成を示す図である。図1に示される光学測定装置1は、測定台40上に配置された測定対象物50に近赤外光を照射し、その拡散反射光を検出部20で検出することで、測定対象物50に係る測定を行う装置であり、光源10と、検出部20と、分析部30と、測定台40と、を備える。
この光学測定装置1により測定が行われる測定対象物50は、例えば、水溶液、ペレット、粉末等であって、この測定対象物50には光合成微生物が含まれる。光合成微生物としては、例えば、藍藻(シアノバクテリア)、珪藻、緑藻等の微細藻類が挙げられる。本実施形態に係る光学測定装置1は、測定対象物50に含まれた光合成微生物における多糖類の量を測定することで、光合成微生物の培養状況を確認することを測定の目的の1つとしている。
なお、光合成微生物として挙げられる微生物は培養槽等の水中で生存するため、光合成微生物を培養槽から取り出したものを測定対象物50とすると、水分が多量に含まれる。したがって、少なくとも一部の水分を除去し、測定対象物50に含まれる水分の割合を小さくすることが好ましい。図1では、光合成微生物が含まれる液体をろ紙によって濾すことで光合成微生物がろ紙表面に回収されたものを測定対象物50としている。
光源10は、近赤外光を測定対象物50が配置される領域に対して照射する。光源10としては、ハロゲンランプ等を用いることができる。また、種光源及び非線形媒質を備え、種光源から出射される光を非線形媒質に入力し、非線形媒質中における非線形光学効果によりスペクトルを広帯域に広げてスーパーコンティニウム(SC)光として出力するSC光源を光源10として用いることもできる。SC光源を光源10として用いた場合、ハロゲンランプと比較してSC光源による加熱が低減されるため、光合成微生物が含まれる測定対象物50の測定に好適に用いられる。さらに、光源10は強度を変調する機能を有していてもよい。
なお、本実施形態において光源10が照射する近赤外光とは、波長範囲が800nm~2500nmの光である。本実施形態では、1000nm~2400nmの波長範囲で測定を行うことが好ましい。
検出部20は、光源10から照射される近赤外光が測定対象物50の表面で拡散反射された後に検出部20の配置される方向へ出力された光を拡散反射スペクトルとして検出する。検出した拡散反射スペクトルの情報は分析部30へ送られる。検出部20としては、例えば、水銀、カドミウム及びテルルからなるMCT検出器、InGaAs検出器等を用いることができる。
また、検出部20は、ハイパースペクトル画像を取得するハイパースペクトルセンサであってもよい。ハイパースペクトル画像は、一画素がN個の波長データにより構成されている画像であり、画素毎にそれぞれ複数の波長に対応した反射強度データからなるスペクトル情報が含まれている。すなわち、ハイパースペクトル画像は、画像を構成する画素毎に、それぞれ複数波長の強度データを持つという特徴から、画像としての二次元的要素と、スペクトルデータとしての要素をあわせ持った三次元的構成のデータである。なお、本実施形態では、ハイパースペクトル画像とは、1画素あたり少なくとも5つの波長帯域における強度データを保有している画素によって構成された画像のことをいう。以下の実施形態では、検出部20がハイパースペクトルセンサである場合について説明をする。
分析部30は、検出部20から送られる拡散反射スペクトルの情報を受け取り、演算処理等を行う。分析部30により、吸収スペクトルの導出、拡散反射スペクトルの2階微分スペクトルの導出、吸収スペクトルの2階微分スペクトルの導出等が行われる。さらに、光合成微生物に係る評価を行うための統計処理等が分析部30において行われる構成としてもよい。また、検出部20がハイパースペクトルセンサである場合、各画素に係るスペクトルの情報が分析部30に対して送られるので、分析部30においてこれらのスペクトル情報についての演算を行う構成とすることもができる。
測定台40は、測定対象物50となる食品を配置する台である。この測定台40は、光源10から照射する近赤外光を透過する材料からなることが好ましい。
上記の構成を有する光学測定装置1による光学測定方法には、光合成微生物が含まれる測定対象物に対して近赤外光を照射することで、当該測定対象物に係る拡散反射スペクトル又は透過スペクトルを取得する取得工程と、取得工程で得られたスペクトルに基づいて、目的物質の量を算出する算出工程と、が含まれる。具体的には、光源10から測定対象物50へ向けて近赤外光L1が照射される。光源10から照射された近赤外光L1は、測定対象物50へ入射する。測定対象物50で拡散反射した近赤外光のうち、光路L3方向に進む光は、検出部20へ到達する。検出部20では拡散反射スペクトルが取得される(取得工程)。検出部20で得られた拡散反射スペクトルは、分析部30へ送られ、分析部30において、目的物質の量の算出に係る処理が行われる(算出工程)。なお、光合成微生物に含まれる目的物質としては、例えば、多糖類又は油脂が挙げられる。その中でも多糖類に好適に用いられ、さらに、多糖類の一つであるグリコーゲンは近赤外光の照射により得られるスペクトルからその量を好適に算出することができる。
ここで、測定対象物50として光合成微生物が含まれるものを用いて、多糖類の一種であるグリコーゲンの含有量を測定した例について、図2及び図3を用いて説明する。
図2では、グリコーゲンを生成する微細藻類の一種であるA. platensisが混合された液体から水分を一部除去した後に測定対象物50として測定をすることで得られた吸収スペクトルを示している。図2に示す吸収スペクトルは、グリコーゲン含有量が異なる複数種類の光合成微生物を含む培養液をそれぞれろ過したものを測定対象物50として準備し、この測定対象物50の拡散反射スペクトルを測定した。そして測定結果から吸収スペクトルを導出し、グリコーゲン含有量に応じたピークの変化を調べたものである。測定対象物50は、具体的には以下の方法で準備した。すなわち、育成中の微細藻を培養槽から取り出し、ろ紙で濾すことで微細藻の周辺の水分を除去し、さらにろ紙とろ紙上の光合成微生物とを乾燥させたものを測定対象物50として準備した。準備した測定対象物50におけるグリコーゲン含有量(濃度)はそれぞれ3.94、6.04、7.29、8.28、26、26.7(光合成微生物に対する重量%)であり、測定波長は1200nm~2200nmの範囲とした。図2に示す吸収スペクトルは、ハイパースペクトルセンサである検出部20から送られてくる画素毎のスペクトルデータについて分析部30で平均を求めたもの、すなわち全画素平均の吸収スペクトルを示している。
図2に示すように、波長1630nm、1840nm、及び2100nm付近においてグリコーゲン濃度に応じて吸光度が大きくなるピークがあることが確認された。したがって、グリコーゲン濃度とこれらのピークにおける吸光度との対応関係を予め求めておくことで、グリコーゲン濃度が未知の試料について、近赤外光による吸収スペクトルを取得し、上記の特定の波長付近における吸光度に基づいて試料のグリコーゲン濃度を算出する構成を実現することができる。
次に、従来の方法により測定されたグリコーゲン濃度と、吸収スペクトルに基づいて算出されたグリコーゲン濃度との対応関係について検討した結果を図3に示す。具体的には、図2での吸収スペクトルの取得に用いた測定対象物50(グリコーゲン濃度が3.94、6.04、7.29、8.28、26、26.7の5種類であり、これらの濃度は従来の化学処理により求められた濃度である。)のハイパースペクトル画像を取得後、画素毎に吸収スペクトルを求め、各吸収スペクトルにおける波長1630nm、1840nm、及び2100nm付近のピークの吸光度からグリコーゲン濃度を算出した結果を示した。図3では横軸が従来の方法である化学処理により求められたグリコーゲン濃度であり、縦軸が近赤外光を照射することにより得られた吸収スペクトルのピークの吸光度から算出したグリコーゲン濃度である。図3では、各画素の結果を全てプロットした後、プロットされたデータから重回帰分析を行い、1次関数で近似をした結果を示している。
図3に示すように、化学測定により得られたグリコーゲン濃度が高い測定対象物50ほど、各画素にて得られた吸収スペクトルから算出されるグリコーゲン濃度も高くなり、化学測定により求められるグリコーゲン濃度と、吸収スペクトルから算出されるグリコーゲン濃度との間で高い相関があることが確認された。
すなわち、上記の光学測定装置1を用いた光学測定方法によれば、光合成微生物が含まれる測定対象物50に対して光源10から近赤外光を照射することで検出部20において得られた拡散反射スペクトルに基づいて目的物質の量を算出することができる。また、上記の方法では、従来のように光合成微生物を破砕して目的物質を抽出した後にその量を測定する方法と比較して簡便な操作で測定を行うことができる。
バイオエネルギーに活用するための物質の生産を目的として光合成微生物を培養する場合、培養期間は概ね十数日である。本実施形態に係る光学測定方法を用いて光合成微生物の培養状況をグリコーゲンの量を指標として確認をする場合、ほぼリアルタイムで状況の確認を行うことができる。さらに、このようにほぼリアルタイムで培養状況の確認を行うことができる場合、グリコーゲンの量、すなわち、光合成微生物の培養状況に応じて、培養条件のフィードバック制御が可能となるため、培養条件をより好適な方向へ導くことができる。
また、上記の光学測定方法では、測定対象物50に含まれる水分をろ紙を用いて一部除去した後に、測定対象物50に対して近赤外光を照射する態様とされている。このように、水分を一部除去した後に近赤外光を照射して拡散反射スペクトル又は透過スペクトルを取得することで、得られたスペクトルにおける水分の影響を減らすことができ、より高い精度で目的物質の量を測定することが可能となる。また、光合成微生物は表面を乾燥しても死滅しないことから、ろ紙を用いて水分を除去した上でスペクトルを取得する処理を行ったとしても、光合成微生物を培養槽に戻すことで培養を継続することができる。
なお、水分を除去する方法は、ろ紙を用いたろ過に限定されず、例えば培養槽内に光合成微生物が集合した領域を形成し、その領域から光合成微生物を取り出して測定を行う等の方法を用いることもできる。また、測定対象物50から水分が除去されたほうが得られたスペクトルにおける水分の影響を低減することができるが、水分の除去に時間がかかる場合、目的物質の測定に係る時間(特に測定対象物50の準備にかかる時間)が長くなる。
また、上記の光学測定方法では、算出工程において、拡散反射スペクトルを吸収スペクトルに変換し、吸収スペクトルから目的物質の量を算出する態様としている。このような態様とすることで、吸収スペクトルへの変換の際にベースライン成分の除去等のベースラインに係る補正を行うことができるため、より高い精度で目的物質の量を測定することが可能となる。
さらに、算出工程においては、多変量解析の一つである重回帰分析を用いる態様とすることで、目的物質の量をより高い精度にて目的物質の量の算出することが可能となる。なお、算出工程において用いることができる多変量解析としては、重回帰分析のほかに、主成分分析等が挙げられる。
以上、本発明における好適な実施形態を具体的に示したが、本発明はこれに限定されるものではなく、種々の変更が可能である。例えば上記実施形態では、拡散反射スペクトルを吸収スペクトル変換した後に目的物質の量を算出する構成について説明したが、拡散反射スペクトルではなく透過スペクトルを取得して、透過スペクトルから吸収スペクトルを算出して、目的物質の量を算出する構成としてもよい。
また、上記では、吸収スペクトルを用いて評価を行ったが、拡散反射スペクトル(又は透過スペクトル)から直接目的物質の量を算出する構成としてもよい。さらに、吸収スペクトル、拡散反射スペクトル、透過スペクトルのいずれかの2階微分スペクトルを求めた後にこれを用いて目的物質の量を算出する構成としてもよい。すなわち、近赤外光を照射して得られるスペクトルから目的物質の量を算出する方法については種々の手法を用いることができる。
また、上記実施形態において、光源10が照射する近赤外光の波長範囲は適宜変更することができる。例えば、特定の異物の検出や、食品中の特定の成分の成分量の測定を目的として、光源10から照射する近赤外光の波長範囲を短くすることのほか、複数の波長範囲を選択して測定することもできる。なお、波長範囲を短くする場合は、吸収ピークを有すると考えられる波長の前後少なくとも100nmの範囲の近赤外光を照射することによって、より正確な測定を行うことができる。
1…光学測定装置、10…光源、20…検出部、30…分析部、40…測定台、50…測定対象物。
Claims (7)
- 光合成微生物に含まれる目的物質の量を測定する光学測定方法であって、
前記光合成微生物が含まれる測定対象物に対して近赤外光を照射することで、当該測定対象物に係る拡散反射スペクトル又は透過スペクトルを取得する取得工程と、
前記取得工程で得られたスペクトルに基づいて、前記目的物質の量を算出する算出工程と、
を有する光学測定方法。 - 前記目的物質は多糖類である請求項1記載の光学測定方法。
- 前記多糖類はグリコーゲンである請求項2記載の光学測定方法。
- 前記取得工程において、
前記測定対象物に含まれる水分を一部除去した後に、前記測定対象物に対して近赤外光を照射する請求項1~3のいずれか一項に記載の光学測定方法。 - 前記算出工程において、
前記拡散反射スペクトル又は透過スペクトルを吸収スペクトルに変換し、当該吸収スペクトルから含有される目的物質の量を算出する請求項1~4のいずれか一項に記載の光学測定方法。 - 前記算出工程において、多変量解析を用いる請求項1~5のいずれか一項に記載の光学測定方法。
- 前記取得工程で得られたスペクトルがハイパースペクトルである請求項1~6のいずれか一項に記載の光学測定方法。
Applications Claiming Priority (2)
| Application Number | Priority Date | Filing Date | Title |
|---|---|---|---|
| JP2013-182035 | 2013-09-03 | ||
| JP2013182035A JP2015049178A (ja) | 2013-09-03 | 2013-09-03 | 光学測定方法 |
Publications (1)
| Publication Number | Publication Date |
|---|---|
| WO2015033720A1 true WO2015033720A1 (ja) | 2015-03-12 |
Family
ID=52628204
Family Applications (1)
| Application Number | Title | Priority Date | Filing Date |
|---|---|---|---|
| PCT/JP2014/070483 Ceased WO2015033720A1 (ja) | 2013-09-03 | 2014-08-04 | 光学測定方法 |
Country Status (2)
| Country | Link |
|---|---|
| JP (1) | JP2015049178A (ja) |
| WO (1) | WO2015033720A1 (ja) |
Citations (2)
| Publication number | Priority date | Publication date | Assignee | Title |
|---|---|---|---|---|
| JPH10229776A (ja) * | 1997-02-20 | 1998-09-02 | Matsushita Electric Ind Co Ltd | 貝類の健康状態判別方法 |
| JP2003075341A (ja) * | 2001-09-04 | 2003-03-12 | Japan Science & Technology Corp | 溶存・懸濁性物質濃度を近赤外分光法によって計測する方法 |
-
2013
- 2013-09-03 JP JP2013182035A patent/JP2015049178A/ja active Pending
-
2014
- 2014-08-04 WO PCT/JP2014/070483 patent/WO2015033720A1/ja not_active Ceased
Patent Citations (2)
| Publication number | Priority date | Publication date | Assignee | Title |
|---|---|---|---|---|
| JPH10229776A (ja) * | 1997-02-20 | 1998-09-02 | Matsushita Electric Ind Co Ltd | 貝類の健康状態判別方法 |
| JP2003075341A (ja) * | 2001-09-04 | 2003-03-12 | Japan Science & Technology Corp | 溶存・懸濁性物質濃度を近赤外分光法によって計測する方法 |
Non-Patent Citations (2)
| Title |
|---|
| MOCHABA F ET AL.: "A Novel and Rapid Method for the Determination of Glycogen in Pitching Yeasts", J AM SOC BREW CHEM, vol. 52, no. 4, 1994, pages 145 - 147 * |
| SHINPEI AIKAWA ET AL.: "Effect of light intensity on glycogen production and growth rate of cyanobacteria Spirulina (Arthrospira) platensis", ABSTRACTS OF THE ANNUAL MEETING OF THE SOCIETY FOR BIOTECHNOLOGY, JAPAN, 25 September 2010 (2010-09-25), pages 122 * |
Also Published As
| Publication number | Publication date |
|---|---|
| JP2015049178A (ja) | 2015-03-16 |
Similar Documents
| Publication | Publication Date | Title |
|---|---|---|
| Martens et al. | Light scattering and light absorbance separated by extended multiplicative signal correction. Application to near-infrared transmission analysis of powder mixtures | |
| Qin et al. | Line-scan hyperspectral imaging techniques for food safety and quality applications | |
| Huang et al. | Micro‐Raman spectroscopy of algae: composition analysis and fluorescence background behavior | |
| Li et al. | Identification of aged-rice adulteration based on near-infrared spectroscopy combined with partial least squares regression and characteristic wavelength variables | |
| Lu et al. | Innovative hyperspectral imaging-based techniques for quality evaluation of fruits and vegetables: A review | |
| Mahesar et al. | Analytical approaches for the assessment of free fatty acids in oils and fats | |
| Chen et al. | Predicting the anthocyanin content of wine grapes by NIR hyperspectral imaging | |
| CN108663339B (zh) | 基于光谱和图像信息融合的霉变玉米在线检测方法 | |
| CN101710067B (zh) | 一种畜肉品质检测方法 | |
| Shao et al. | Identification of pesticide varieties by detecting characteristics of Chlorella pyrenoidosa using Visible/Near infrared hyperspectral imaging and Raman microspectroscopy technology | |
| US8902423B2 (en) | Classification using multivariate optical computing | |
| Wei et al. | Microalgal detection by Raman microspectroscopy | |
| Zude et al. | Non-destructive analysis of anthocyanins in cherries by means of Lambert–Beer and multivariate regression based on spectroscopy and scatter correction using time-resolved analysis | |
| CN105203464B (zh) | 基于高光谱成像技术检测花生中油酸含量分布的方法 | |
| Sackett et al. | Snapshot prediction of carbon productivity, carbon and protein content in a Southern Ocean diatom using FTIR spectroscopy | |
| Wagner et al. | Subcommunity FTIR-spectroscopy to determine physiological cell states | |
| WO2014103715A1 (ja) | 有機物製造方法、有機物製造プロセスモニタ方法、及び有機物製造プロセスモニタ装置 | |
| Zhang et al. | Nondestructive detection of pungent and numbing compounds in spicy hotpot seasoning with hyperspectral imaging and machine learning | |
| US20250093319A1 (en) | Detecting wine characteristics from wine samples | |
| JP6115199B2 (ja) | 微細藻類の脂溶性成分含量の判断方法および微細藻類の培養方法 | |
| Solovchenko et al. | Nondestructive monitoring of carotenogenesis in Haematococcus pluvialis via whole-cell optical density spectra | |
| WO2015120144A1 (en) | Methods and systems for diagnostics | |
| WO2021010817A1 (en) | Apparatus to measure ripeness of oil palm fruitlets via real-time chlorophyll content measurement | |
| Shao et al. | Quantitative detection on metabolites of Haematococcus pluvialis by terahertz spectroscopy | |
| Chu et al. | Visible/Short-wave near-infrared hyperspectral analysis of lipid concentration and fatty acid unsaturation of Scenedesmus obliquus in situ |
Legal Events
| Date | Code | Title | Description |
|---|---|---|---|
| 121 | Ep: the epo has been informed by wipo that ep was designated in this application |
Ref document number: 14842823 Country of ref document: EP Kind code of ref document: A1 |
|
| NENP | Non-entry into the national phase |
Ref country code: DE |
|
| 122 | Ep: pct application non-entry in european phase |
Ref document number: 14842823 Country of ref document: EP Kind code of ref document: A1 |