WO2014115282A1 - 計算機システム及び計算機リソースの割当方法 - Google Patents
計算機システム及び計算機リソースの割当方法 Download PDFInfo
- Publication number
- WO2014115282A1 WO2014115282A1 PCT/JP2013/051458 JP2013051458W WO2014115282A1 WO 2014115282 A1 WO2014115282 A1 WO 2014115282A1 JP 2013051458 W JP2013051458 W JP 2013051458W WO 2014115282 A1 WO2014115282 A1 WO 2014115282A1
- Authority
- WO
- WIPO (PCT)
- Prior art keywords
- computer
- business
- resource
- change
- amount
- Prior art date
- Legal status (The legal status is an assumption and is not a legal conclusion. Google has not performed a legal analysis and makes no representation as to the accuracy of the status listed.)
- Ceased
Links
Images














Classifications
-
- G—PHYSICS
- G06—COMPUTING OR CALCULATING; COUNTING
- G06F—ELECTRIC DIGITAL DATA PROCESSING
- G06F9/00—Arrangements for program control, e.g. control units
- G06F9/06—Arrangements for program control, e.g. control units using stored programs, i.e. using an internal store of processing equipment to receive or retain programs
- G06F9/46—Multiprogramming arrangements
- G06F9/50—Allocation of resources, e.g. of the central processing unit [CPU]
- G06F9/5083—Techniques for rebalancing the load in a distributed system
Definitions
- the present invention relates to a technique for managing computer resources allocated to work executed by a computer.
- control and monitoring from a large amount of log data such as advertisement distribution based on location information of portable information terminals, location information aggregation and monitoring operations, power control and monitoring operations for information from smart meters, etc.
- the construction of IT systems as social infrastructure for performing various tasks such as forecasting is being promoted in various fields.
- a computer resource such as a server, storage, or communication band is shared by a plurality of business operations. Therefore, there is an inter-business resource management system that appropriately allocates computer resources according to each business content and load. Required.
- a policy regarding what kind of resource allocation is performed according to the business load is set, and computer resources are managed according to the policy.
- a global policy that describes the policy by stepping into the contents of the work and a static setting that sets the priority for each work and statically sets the distribution ratio of the computer resources without stepping into the work contents Policy can be broadly divided.
- Non-Patent Document 1 As the global policy, for example, “linear programming” as in Non-Patent Document 1 is known.
- Linear Programming the amount of resources allocated to each job is an input variable, and the magnitude of the business effect obtained as a result of the allocation is the objective variable.
- Resource allocation that maximizes the objective variable can be determined by using the upper limit value of the resource as the constraint of the input variable.
- examples of the static policy include “VMware (registered trademark) DRS (Distributed Resource Scheduler)” as in Non-Patent Document 2.
- VMware DRS distributed Resource Scheduler
- for each virtual machine that executes each business specify a share that indicates the priority of the business shared by the virtual machine, and preferentially allocate computer resources to virtual machines with a large share In this way, resource allocation considering the business content is realized.
- the conventional global policy has a problem that the policy description needs to be reviewed every time a new job is added, and the operation management cost of the policy increases.
- the relationship between the amount of computer resources allocated in each job and the effect on the job must be formulated (fixed processing procedure) and registered in advance.
- the relation between the amount of computer resources and the effect needs to satisfy a certain limit.
- the global policy cannot be applied when it is difficult to formulate the relationship between the amount of computer resources and the effects in a simple form such as a linear expression, such as the effect of work varies depending on the situation at the time of execution. There was a problem.
- the size of computer resource allocation is determined by the size of the share, and it is possible to take into account the decrease in the service level of the business that occurs when the computer resource allocation allocated to the business decreases. There was a problem that it was not possible.
- the present invention has been made in view of the above problems, and it is not necessary to understand the contents of the allocation plan of a plurality of computer resources, and the circumstances specific to the allocation plan of individual computer resources are taken into consideration. It aims to make possible.
- the present invention is a computer system comprising: a business computer that provides a processor and memory as computer resources; and a management computer that includes the processor and memory and manages the computer resources of one or more of the business computers,
- the management computer includes: business assignment information in which work assigned to the business computer is set in advance; resource assignment information in which the computer resource assigned to each work assigned to the business computer is set; and computer resources for each business A distribution change definition information preset as a change plan for changing the distribution of the distribution, and a task is allocated to the business computer based on the business allocation information, and the computer is allocated to the business based on the resource allocation information
- the resource allocation management unit for allocating resources and the business computer A penalty amount calculation unit that calculates a penalty amount for each change plan as an index indicating a demerit according to the amount of change in the allocation of computer resources to the business when a predetermined state for changing the distribution of resources is reached And a resource allocation determination unit that determines a change in allocation of computer resources allocated to the business by the business computer based on
- FIG. 1 is a block diagram showing an example of a computer system to which the present invention is applied.
- the management computer 1 manages a business that operates on a plurality of business computers 2 connected via the network 3 and a computer resource (hereinafter referred to as a resource) allocated to the business.
- the business computer 2 is composed of n units 2-1 to 2-n.
- the generic name of the business computer is denoted by reference numeral 2.
- the configuration of the business computer 2 is the same as that of the business computer 2-1 in FIG.
- the base station computers 2-2 and 2-n execute the distribution operation of collecting the location information of the terminal 4 and distributing the advertisement to the terminal 4 that meets a predetermined condition. Further, the base station computers 2-2 and 2-n execute a totaling operation for totalizing the position information of the terminal 4 and the attribute information (gender and age) of the user of the terminal 4. In addition, the base station computers 2-2 and 2-n detect a load on an exchange (not shown) that controls the communication of the terminal 4, and execute a monitoring task for monitoring whether or not the load exceeds a threshold value. The monitoring service notifies the center station computer 2-1 of the occurrence of an overload when the detected load on the exchange exceeds a preset threshold value.
- the center station computer 2-1 aggregates the location information and attribute information of the terminals 4 collected by the base station computers 2-2 and 2-1, and executes a totaling operation for generating visualized information such as graphs and tables. To do. Further, the center station computer 2-1 acquires load information of each base station computer 2-2, 2-1 and monitors the base station computer 2 that has exceeded a preset load threshold value to the management computer 1 Execute business.
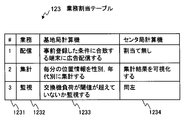
- FIG. 3 is a diagram showing an example of the business assignment table 123 held by the management computer 1.
- the resource allocation management unit 100 of the management computer 1 allocates a business to the business computer 2 that functions as a base station computer and a center station computer based on the business allocation table 123.
- the task assignment table 123 includes the identifier 1231 and the task 1232 assigned to the base station computer (1233) 2-2, 2-n and the center station computer (1234) 2-1 for the three tasks 1232 of distribution, aggregation, and monitoring. Set.
- the resource allocation management unit 100 assigns three tasks of distribution, aggregation and monitoring to the base station computers 2-2 and 2-n, and two operations of aggregation and monitoring are assigned to the center station computer 2-1.
- the management computer 1 includes a processor 11 that performs operations, a memory 12 that stores data and programs, a storage device 13 that stores data and programs, and a network adapter 14 that communicates with the network 3. .
- the processor 11 operates as a functional unit that realizes a predetermined function by operating according to a program of each functional unit.
- the processor 11 functions as the resource allocation management unit 100 by operating according to the resource allocation management program. The same applies to other programs.
- the processor 11 also operates as a functional unit that implements each of a plurality of processes executed by each program.
- a computer and a computer system are an apparatus and a system including these functional units.
- Information such as programs and tables for realizing each function of the resource allocation management unit 100 and the resource allocation determination unit 110 is stored in a storage device 13, a nonvolatile semiconductor memory, a hard disk drive, a storage device such as an SSD (Solid State Drive), or It can be stored in a computer-readable non-transitory data storage medium such as an IC card, an SD card, or a DVD.
- the resource allocation determination unit 110 determines the allocation of resources to be allocated to the business executed on each business computer 2.
- the resource allocation determination unit 110 receives a resource allocation change request reception module 111 that receives a request for changing a resource allocated to a task from the resource allocation management unit 100, and determines a resource allocation policy determination that determines a policy (change plan) for changing the resource allocated to the task.
- the business information management unit 120 manages a resource allocation change plan and calculates a penalty amount to be described later.
- the business information management unit 120 receives a plan for changing the allocation of resources to be allocated to a business, and occurs when the resource allocation change plan registration module 121 to be registered in the distribution change definition table 104 described later and the resources allocated to the business are reduced.
- a resource change penalty calculation module 122 that calculates a penalty amount of the business to be performed.
- the penalty indicates a demerit caused by a reduction in the allocation of resources to business.
- the penalty amount is calculated as described later by the management computer 1 as an index indicating the magnitude of the demerit that occurs in accordance with the resource allocation reduction amount for business.
- the business computer 2-1 includes a processor 21 that performs operations, a memory 22 that stores data and programs, a storage device 23 that stores data and programs, and a network adapter 24 that communicates with the network 3.
- the business computer 2-1 includes a processor 21 that performs operations, a memory 22 that stores data and programs, a storage device 23 that stores data and programs, and a network adapter 24 that communicates with the network 3.
- the memory 22 is loaded with tasks assigned by the individual resource allocation management unit 200 and the management computer 1 and is executed by the processor 21.
- a state is shown in which three tasks, a distribution task 211, a tabulation task 212, and a monitoring task 213 are assigned.
- the distribution work 211 is not executed, and therefore, it is indicated by a broken line in FIG.
- the processor 21 operates as a functional unit that realizes a predetermined function by operating according to a program of each functional unit.
- the processor 21 functions as the individual resource distribution management unit 200 by operating according to the individual resource distribution management program. The same applies to other programs.
- the processor 21 also operates as a functional unit that realizes each of a plurality of processes executed by each program.
- a computer and a computer system are an apparatus and a system including these functional units.
- the individual resource allocation management unit 200 manages the allocation of resources to be allocated to the business to be executed by the business computer 2 based on a command from the management computer 1.
- the individual resource allocation management unit 200 in response to a command from the management computer 1, a resource allocation change module 201 that changes the allocation of resources allocated to a task, and a resource allocation status that collects the status of allocation of resources allocated to each task A collection module 202.
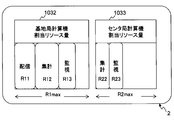
- FIG. 4A is a diagram showing an example of tasks and resources allocated to the base station computer 2-2 and the center station computer 2-1.
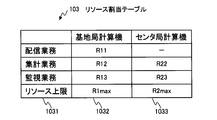
- FIG. 4B is a diagram showing an example of the resource allocation table 103 held by the management computer 1.
- the business computers 2-2 to 2-n that function as a plurality of base station computers
- the business computer 2-1 that functions as the business computer 2-2 and the center station computer will be described. .
- the resource allocation table 103 in FIG. 4B includes a type 1031 having an entry of the type of business to be executed by the business computer 2 and a resource upper limit, and an allocated resource amount 1032 of resources allocated to the business to be executed by the base station computer 2-2. And the allocated resource amount 1033 of the resources allocated to the work executed by the center station computer 2-1. Although illustration of the resources allocated to the base station computer 2-n is omitted, the number of columns may be increased for each base station computer.
- the distribution service 211 is allocated to the base station computer 2-2 with the resource amount R11
- the aggregation service 212 is allocated with the resource amount R12
- the monitoring service 213 is allocated with the resource amount R13.
- the aggregation task 212 is assigned with the resource amount R22 and the monitoring task 213 is assigned with the resource amount R23 to the center station computer 2-1.
- the resource upper limit R1max includes a resource type and an upper limit value that can be allocated to the work of the base station computer 2-2.
- the resource upper limit R2max includes the resource type and upper limit value that can be allocated to the work of the center station computer 2-1.
- FIG. 5 is a diagram showing an example in which the amount of resources used by the base station computer and the center station computer has changed.
- the resource usage 1032a of the base station computer 2-2 and the resource usage 1033a of the center station computer 2-1 manage the resource usage for each business detected by the individual resource allocation management unit 200 shown in FIG.
- the data is totaled by the computer 1.
- the resource usage amount for each job may be detected by a known or publicly known method such as an OS task manager or monitor.
- the number of terminals 4 managed by the base station computer 2-2 increases, the resource usage r11 used in the distribution service 211 for the terminals 4 increases, and the base station computer 2-2 has three services.
- An example is shown in which the total of the resource usage amounts r11, r12, r13 used in the above exceeds the upper limit value R1max of the resource amount that can be allocated by the base station computer 2-2.
- the resource usage amount used by each work can be adjusted by adjusting the resources allocated to the total work 212 or the monitoring work 213. It is necessary to keep the total above the upper limit value R1max below.
- the management computer 1 holds a preset resource allocation change plan as shown in the allocation change definition table 104 shown in FIG. 11, and the base station computers 2-2 to 2-n execute resource allocation.
- the base station computers 2-2 to 2-n execute resource allocation.
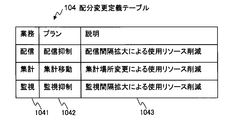
- FIG. 11 is a diagram showing an example of the distribution change definition table 104 held by the management computer 1.
- the distribution change definition table 104 includes one entry including a business 1041 for storing the name of the business, a plan 1042 for storing the resource allocation change plan, and a description 1043 for storing the contents of the change plan.
- one plan 1042 is defined for each business 1041. However, by adding an entry, a plurality of plans 1042 can be defined for one business.
- the setting of the change plan can be registered in the distribution change definition table 104 from a console (not shown) by starting the resource allocation change plan registration module 121 of the management computer 1.
- distribution suppression is set to increase the distribution interval and suppress resource usage.
- the amount of resources used decreases, but a penalty that the number of terminals 4 that can deliver advertisements decreases occurs.
- the totaling movement is set to distribute the totaling work to the center station computer 2-1 and suppress the resource usage of the base station computer 2-2. While a part of the totaling work 212 moves to the center station computer 2-1, the amount of resources used in the base station computer 2-2 decreases, but the data to be totaled is transferred to the destination center station computer 2-1. Penalties are added.
- monitoring suppression is set to increase the monitoring interval and suppress the resource usage. While the use of resources decreases due to the expansion of the monitoring interval, there is a penalty that the possibility that the detection of the occurrence of an abnormality will be delayed increases.
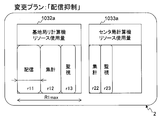
- FIG. 6 shows an example in which the management computer 1 selects distribution suppression from the change plan of the distribution change definition table 104 shown in FIG.
- FIG. 6 is a diagram showing an example in which assignment of computer resources used by the base station computer 2-2 and the center station computer 2-1 is changed.
- the resource usage 1032a of the base station computer 2-2 by executing a distribution suppression change plan that suppresses the allocation of resources allocated to the distribution business r11, the sum of the resource usages r11, r12, and r13 of the three businesses is obtained.
- the upper limit value R1max is suppressed.
- resource allocation of the base station computer 2-2 required for the distribution service 211 is reduced by thinning out the terminals 4 to be distributed as a result of restricting the resource allocation.
- the advertisement is not distributed to all the terminals 4, the quality of the distribution business 211 itself is deteriorated, and a business loss occurs. A decline in the quality of work is a penalty.
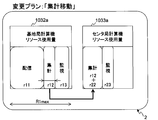
- FIG. 7 is a diagram showing an example in which a part of the totaling work 212 assigned to the base station computer 2-2 is moved to the center station computer 2-1. Reduces resources used by the base station computer 2-2 by implementing a plan to change the total movement of part of the base station computer 2-2's total work 212 to another center station computer 2-1.
- FIG. 5 shows that the management computer 1 uses a plurality of resource allocation change plans set in advance as a part of the tabulation work 212.
- FIG. 7 shows an example in which the change plan to be moved to the computer 2-1 is selected.
- the resource usage 1032a of the base station computer 2-2 by moving a part of the totaling service r12 to the center station computer 2-1 and changing the resource allocation, the three services of the base station computer 2-2 are changed.
- the sum of the resource usages r11, r12, r13 can be suppressed below the upper limit value R1max.
- FIG. 8 is a diagram showing an example in which resources used by the monitoring service 213 of the base station computer 2-2 are suppressed. As shown in FIG. 5, while the load on the base station computer 2-2 increases, the management computer 1 monitors the base station computer 2-2 from a plurality of resource allocation change plans set in advance. FIG. 8 shows an example in which a change plan that suppresses resources allocated to 213 is selected.
- FIG. 5 shows an example in which the change plan is selected.
- FIG. 9 is a sequence diagram showing an example of processing performed in the computer system.
- the management computer 1 determines a center station computer 2-1 and base station computers 2-2 to 2-n among a plurality of business computers 2.
- the management computer 1 assigns tasks to the base station computers 2-2 to 2-n and the center station computer 2-1 according to the task assignment table 123 shown in FIG. 3, and the management computer 1 uses the resource shown in FIG. 4B. It is assumed that the steps of allocating resources to the operations of the base station computers 2-2 to 2-n and the center station computer 2-1 are performed according to the allocation table 103.
- the resource allocation status management module 101 detects a business of the business computer 2 that exceeds a preset allocation amount (value of the resource allocation table 103) out of the acquired resource usage as a resource shortage.
- a predetermined threshold for example, 90%
- the resource allocation management unit 100 transmits a resource shortage notification to the resource allocation determination unit 110 (S1).
- the resource allocation determination unit 110 receives a resource shortage notification by the resource allocation change request module, and transmits to the business information management unit 120 a request to reduce the resources allocated to the business by the business computer 2 in which the resource shortage has occurred. (S2).
- the resource change penalty calculation module 122 calculates a penalty amount when the resource allocation change plan registered in the distribution change definition table 104 in FIG. 11 is executed. Then, the business information management unit 120 transmits the penalty amount calculation result to the resource allocation determination unit 110 (S3).
- the resource allocation policy determination module 112 determines the content to change the resource allocation as described later based on the calculated penalty amount for each change plan (S4).
- the individual resource allocation management unit 200 of the business computer 2 executes the resource allocation change received by the resource allocation management unit 100 of the management computer 1.
- the resource allocation can be changed based on the penalty amount for each change plan set in advance.
- step S11 the resource allocation determination unit 110 of the management computer 1 receives a resource shortage notification from the resource allocation management unit 100.
- This notification includes a value M that identifies the business computer 2 and a value R that includes the type of resource and the amount of resource used.
- the value R includes values indicating the resources R11 to R23 of the resource allocation table 103 in FIG. 4B.
- step S14 the business information management unit 120 refers to the distribution change definition table 104 to determine the penalty amount when the resource change plan registered for each business is changed with the reduction amount ⁇ R. Calculate as follows.
- step S15 the resource allocation determination unit 110 acquires the penalty amount for each change plan calculated by the business information management unit 120. Then, the resource allocation policy determination module 112 of the resource allocation determination unit 110 compares the penalty amount generated when each change plan is executed, and the change plan (or the change that minimizes the total sum of the penalty amounts of each business) Plan combination) C is determined.
- the resource allocation is changed by a predetermined reduction amount ⁇ R, and the loop of steps S13 to S18 is executed until the resource shortage is finally resolved. .
- the processing may be terminated and a warning may be output to a console (not shown) of the management computer 1.
- FIG. 12A to 12C are tables that are stored in the management computer 1, and are tables for calculating the amount of resources used in the business computer 2.
- FIG. 12A to 12C are tables that are stored in the management computer 1, and are tables for calculating the amount of resources used in the business computer 2.
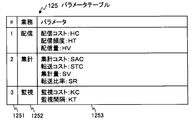
- FIG. 12A is a diagram illustrating an example of a parameter table 125 that holds a relationship between a task and a parameter in order to calculate a resource usage amount.
- the parameter table 125 includes one entry including an identifier 1251, a business 1252 that stores a business name, and a parameter 1253 that stores a parameter for calculating the resource usage.
- the distribution cost HC, the distribution frequency HT, and the distribution amount HV are used as the parameters 1253 of the distribution service 211.
- the distribution cost HC the usage rate of the processor 21 or the usage rate of the memory of the base station computer 2-2 can be used.
- the distribution frequency HT a time interval (second or the like) for transmitting an advertisement to the terminal 4 can be used.
- the distribution amount HV a data amount (number of bytes or the like) to be distributed at one time can be used.
- the aggregation cost SAC, the transfer cost STC, the aggregation amount SV, and the transfer ratio SR are used.
- the total cost SAC and the transfer cost STC the usage rate of the processor 21 or the usage rate of the memory 22 of the business computer 2 can be used.
- the total amount SV a data amount of user attribute information acquired from each business computer 2 can be used.
- the transfer ratio SR stores the ratio of data to be transferred to the center station computer 2-1. This ratio can be the transfer amount / total amount.
- the parameter table 125 is set in the parameter 1253 by the administrator or the like for each business 1252.
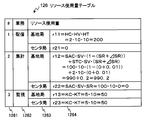
- FIG. 12B is a diagram showing an example of a resource usage table 126 that holds a calculation formula for resource usage for each business.
- the resource usage table 126 includes an identifier 1261, a business 1262 storing a business name, a type 1263 storing either the base station computer 2-2 or the center station computer 2-1, and resource usage of the business computer 2.
- One entry is composed of the resource usage 1264 that stores the calculation formula for calculating the amount.
- the resource usage r12 related to the tabulation service 212 of the base station computer 2-2 is the product of the tabulation cost SAC multiplied by the tabulation amount SV and 1-transfer ratio SR, and the product of the transfer cost STC, the tabulation amount SV, and the transfer ratio SR. Shall be added.
- the resource usage amount r22 related to the aggregation task 212 of the center station computer 2-1 is a value obtained by multiplying the aggregation cost SAC by the aggregation amount SV and the transfer ratio SR.
- the resource usage r13 related to the monitoring service 213 of the base station computer 2-2 is a value obtained by multiplying the monitoring cost KC by the monitoring interval KT.
- the resource usage r23 related to the monitoring work 213 of the center station computer 2-1 is also set to a value obtained by multiplying the monitoring cost KC by the monitoring interval KT.
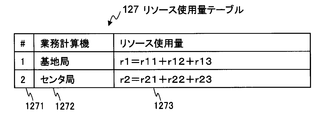
- FIG. 12C is a diagram showing an example of a resource usage table 127 that holds a calculation formula for resource usage for each business computer 2.
- the resource usage table 126 for each business computer 2 includes an identifier 1271, a business computer 1272 that stores the role of the business computer 2, and a resource usage that stores a formula for calculating the resource usage of the business computer 2. 1273 constitutes one entry.
- the resource usage r1 of the base station computer 2-2 includes the resource usage r11 of the distribution service 211 of the base station computer 2-2, the resource usage r12 of the aggregation service 212, and the resource of the monitoring service 213 shown in FIG. 12B. This is the sum of the usage amount r13.
- the resource usage r2 of the center station computer 2-1 includes the resource usage r21 of the distribution service 211 of the center station computer 2-1, the resource usage r22 of the aggregation service 212, and the resource of the monitoring service 213 shown in FIG. This is the sum of the usage amount r23.
- 13A to 12C are tables held in the management computer 1, and are tables used for calculating a penalty amount as an index when the business computer 2 changes the resource allocation.
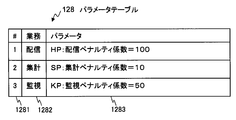
- FIG. 13A is a diagram illustrating an example of a parameter table 128 that holds a relationship between a task and a parameter in order to calculate a penalty amount.
- the parameter table 128 includes one entry including an identifier 1281, a job 1282 for storing a job name, and a parameter 1283 for storing a parameter for calculating a penalty amount.
- the parameter 1283 of the distribution service 211 is a distribution penalty coefficient HP for which a predetermined value is set
- the parameter 1283 of the total service 212 is a total penalty coefficient SP for which a predetermined value is set
- the parameter 1283 of the monitoring service 213 is This is a monitoring penalty coefficient HP for which a predetermined value is set.
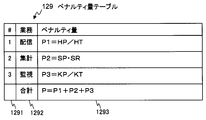
- FIG. 13B is a diagram illustrating an example of a penalty amount table 129 that holds a penalty amount calculation formula for each business.
- the penalty amount table 129 includes one entry including an identifier 1291, a task 1292 that stores a task name, and a penalty amount 1293 that stores a calculation formula for calculating the penalty amount of the business computer 2.
- the penalty amount P1 of the distribution business 211 is a value obtained by dividing the distribution penalty coefficient HP by the distribution frequency HT.
- the penalty amount P2 of the tabulation task 212 is a value obtained by multiplying the tabulation penalty coefficient SP by the transfer ratio SR.
- the penalty amount P3 of the monitoring work 213 is a value obtained by dividing the monitoring penalty coefficient KP by the monitoring interval KT.
- FIG. 14 represents a table 130 as an output example of a penalty amount calculation result when a resource reduction request is made for each change plan based on FIGS. 13A and 13B.
- the table 130 includes one entry including an identifier 1301, a plan 1302 for storing a change plan, a resource reduction request 1303 for storing a resource reduction request target, and a penalty calculation result 1304 for storing a penalty calculation result. Is done.
- the resource reduction amount ⁇ R2 for the center station computer 2-1 is 0 for the distribution service 211.
- FIG. 14 indicates that the total movement change plan cannot be handled, and indicates that the totaling work 212 of the base station computer 2-2 cannot be moved to the center station computer 2-1. This occurs, for example, when the resources of the center station computer 2-1 are tight.
- FIG. 15A is an example in which values are set in the parameter table 125 shown in FIG. 12A.
- FIG. 15B is an example in which values are set in the penalty amount parameter table 128 shown in FIG. 13A.
- FIG. 16A is an example in which values are set in the resource usage table 126 shown in FIG. 12B.
- FIG. 16B is an example in which values are set in the resource usage table 127 for each business computer 2 shown in FIG. 12C.
- the resource usage P1 1250 of the base station computer 2-2 exceeds the upper limit value R1MAX, indicating that the resource is insufficient. That is, FIGS. 16A and 16B show the resource usage before applying the resource change plan.
- FIG. 17 shows the penalty amount before making a resource reduction request in each business 1292 from the parameter values of FIGS. 15A and 15B in the penalty amount table 129 shown in FIG. 13B. This table is shown for comparison with when a resource reduction request is made.
- FIG. 18 is a diagram illustrating an example of values in the parameter change amount table 131 that holds a calculation formula for the parameter change amount in response to a resource allocation reduction request.
- the parameter change amount table 131 includes an identifier 1311, a plan 1312 that stores a resource change plan, a business name that is a target of the resource change plan, and a parameter change amount 1313 that stores a change amount calculation formula. An entry is constructed.
- the parameter change amount table 131 is managed by the business information management unit 120.
- the parameter change amount table 131 can be set when the resource allocation change plan registration module 121 receives an input from a console (not shown).
- the change plan is distribution suppression
- ⁇ SR the change amount of the transfer ratio SR
- ⁇ HT the resource reduction amount
- the change plan is monitoring suppression
- FIG. 19A is a diagram illustrating an example of a value of a resource usage table that holds a calculation formula for resource usage for each business after resource allocation is changed due to distribution suppression.
- FIG. 19A shows a resource usage table 126 when distribution suppression is selected as the resource change plan. That is, FIG. 19A shows values obtained by applying the distribution interval change amount ⁇ HT of the parameter change amount table 131 shown in FIG. 18 to the resource usage amount table 126 shown in FIG. 16A.
- the example shown in the figure shows an example in which the resource usage of the base station computer 2-2 of the distribution service 211 is reduced from 200 to 190 in FIG. 16A.
- FIG. 19B is a diagram illustrating an example of a resource usage table 127 that holds a calculation formula for resource usage for each business computer 2 after the resource allocation is changed due to distribution suppression.
- FIG. 19B shows the result of calculating the resource usages r1 and r2 of the base station computer 2-2 and the center station computer 2-1 from the resource usages r11 to r23 of FIG. 19A.
- FIG. 20 is a diagram illustrating an example of a value in the penalty amount table 129 that holds a penalty amount for each business after a change in resource allocation due to distribution suppression.
- the penalty amount table 129 in FIG. 20 is obtained by applying the change amount ⁇ HT of the distribution frequency HT in the parameter change amount table 131 in FIG.
- the total penalty amount for each business is 15.5, which is an increase of 0.5 compared to FIG.
- FIG. 21A is a diagram illustrating an example of values of the resource usage table 126 that holds the resource usage of the resource usage for each business after the resource allocation is changed by the total movement.
- FIG. 21A shows the resource usage table 126 when the total movement is selected as the resource change plan. That is, FIG. 21A shows values obtained by applying the change amount ⁇ SR of the transfer ratio SR of the parameter change amount table 131 shown in FIG. 18 to the resource usage amount table 126 shown in FIG. 16A.
- FIG. 21B is a diagram showing an example of values in the resource usage table 127 that holds the resource usage for each business computer 2 after the resource distribution is changed by the total movement.
- FIG. 21B shows the result of calculating the resource usages r1 and r2 of the base station computer 2-2 and the center station computer 2-1 from the resource usages r11 to r23 of FIG. 21A.
- the resource usage r1 of the base station computer 2-2 has decreased to 1240.2, but still exceeds the upper limit value R1max of the resource amount that the base station computer 2-2 can allocate to the business.
- the total penalty amount for each business is 15.1, which is an increase of 0.1 compared to FIG.
- FIG. 23A is a diagram illustrating an example of values of the resource usage table 126 that holds the resource usage of the resource usage for each business after the resource allocation is changed by monitoring suppression.
- FIG. 23A shows the resource usage table 126 when monitoring suppression is selected as the resource change plan.
- 23A shows values obtained by applying the monitoring interval change amount ⁇ KT of the parameter change amount table 131 shown in FIG. 18 to the resource usage amount table 126 shown in FIG. 16A.
- the resource usage of the monitoring service 213 of the base station computer 2-2 is reduced from 50 to 40 in FIG. 16A.
- FIG. 23B is a diagram illustrating an example of values in the resource usage table 127 that holds the resource usage for each business computer after the resource allocation is changed by monitoring suppression.
- FIG. 23B shows the result of calculating the resource usages r1 and r2 of the base station computer 2-2 and the center station computer 2-1 from the resource usages r11 to r23 in FIG. 23A.
- the resource usage r1 of the base station computer 2-2 has decreased to 1240, but still exceeds the upper limit value R1max of the resource amount that the base station computer 2-2 can allocate to the business.
- FIG. 24 is a diagram illustrating an example of values in the penalty amount table 129 that holds a penalty amount for each business after the resource allocation is changed by monitoring suppression.
- the penalty amount table 129 of FIG. 24 is obtained by applying the change amount ⁇ KT of the monitoring interval KT of the parameter change amount table 131 of FIG.
- the total penalty amount for each operation is 16.25, which is an increase of 1.25 compared to FIG.
- FIG. 25 is a table 130 similar to FIG. 14 showing an output example of a penalty amount calculation result when resource change is performed by executing each change plan of distribution suppression, total movement, and monitoring suppression once. Is.
- the total value of the total movement penalty amount is the smallest at 15.1, and the total penalty amount for monitoring suppression is the largest at 16.25.
- the overhead for the base station computer 2-2 to transfer the data to be aggregated to the center station computer 2-1 increases.
- the monitoring suppression there is a demerit that the chance of occurrence of a failure is reduced by increasing the monitoring interval, and the monitoring suppression penalty amount is set to be large from the viewpoint of the reliability of the computer system.
- FIG. 26A shows a resource usage amount that holds the resource usage amount of each resource usage after each change plan of distribution suppression and monitoring suppression and resource allocation change by applying multiple times (six times) of total movement. It is a figure which shows an example of the value of a table.
- FIG. 26A shows the resource usage table 126 when the total movement is executed six times as the resource change plan. That is, FIG. 26A is an example in which the change amount ⁇ SR of the transfer ratio SR of the parameter change amount table 131 shown in FIG. 18 is applied to the resource usage table 126 shown in FIG. 16A.
- FIG. 26B is a resource usage table that holds resource usage for each business computer 2 after changing distribution distribution and monitoring suppression and changing resource allocation by applying multiple times (6 times) of total migration. It is a figure which shows an example of the value of 127.
- FIG. 26B shows the result of calculating the resource usages r1 and r2 of the base station computer 2-2 and the center station computer 2-1 from the resource usages r11 to r23 of FIG. 26A.
- the resource usage r1 of the base station computer 2-2 is reduced to 1191.2
- the base station computer 2-2 is within the upper limit value R1max of the resource amount allocated to the business, and the resource shortage has been resolved. Indicates.
- FIG. 27 shows a penalty amount table 129 that holds a resource usage amount of a penalty amount for each business after a change of resource distribution by applying each change plan of distribution suppression and monitoring suppression and multiple times (six times) of total movement. It is a figure which shows an example of the value of.
- the penalty amount table 129 of FIG. 27 is obtained by applying the change amount ⁇ SR of the transfer ratio SR of the parameter change amount table 131 of FIG.
- the total penalty amount for each business is 15.6, which is an increase of 0.6 compared to Figure 17 before the total movement.
- FIG. 28 is a diagram showing an example in which the penalty amount after changing the resource allocation by applying each change plan of distribution suppression and monitoring suppression once and applying the total movement six times is displayed for each business.
- the total movement is applied six times has been described. This is due to the repetition of steps S13 to S18 in FIG. 10, and is the number of executions of the total movement until the shortage of resources is resolved.
- a business allocation table for determining a business computer 2 to be allocated for each business type. 123 (FIG. 3), a resource allocation table 103 (FIG. 4B) for allocating computer resources to tasks assigned to each business computer 2, and changes in resource allocation for each type of business when a resource shortage occurs
- the distribution change definition table 104 (FIG. 11) in which a plan is set in advance, it is possible to adjust the resource distribution of computers allocated to a plurality of business operations, and to realize the adjustment of the resource allocation that is detailed in the business content Can do.
- the distribution business 211 and the monitoring business 213 increase the processing interval to suppress the resource usage, and the totaling business 212 distributes the business. Indicated. In other words, in a business that can be distributed to other business computers 2, the business is distributed to other computers to solve the resource shortage of the base station computer 2-2. On the other hand, in the case of a business that cannot be distributed, the resource shortage is resolved by increasing the interval for executing the processing or reducing the resource usage rate.
- the allocation of the computer resources to the business is determined, and the resource allocation adjustment is adjusted between the distribution change definition table 104 in which the resource allocation change plan is set in accordance with the content of the business and the plurality of businesses. It implements using the resource allocation table 103 to perform. This makes it possible to realize resource allocation that takes into account the content and characteristics of business among a large number of unspecified businesses.
- the configuration of the computer, the processing unit, and the processing unit described in the present invention may be partially or entirely realized by dedicated hardware.
- the present invention is not limited to the above-described embodiments, and includes various modifications.
- the above-described embodiments have been described in detail for easy understanding of the present invention, and are not necessarily limited to those having all the configurations described.
Landscapes
- Engineering & Computer Science (AREA)
- Software Systems (AREA)
- Theoretical Computer Science (AREA)
- Physics & Mathematics (AREA)
- General Engineering & Computer Science (AREA)
- General Physics & Mathematics (AREA)
- Debugging And Monitoring (AREA)
- Management, Administration, Business Operations System, And Electronic Commerce (AREA)
Abstract
プロセッサとメモリを備えた管理計算機で1以上の業務用計算機の計算機リソースを管理する計算機リソースの割当方法であって、管理計算機が、前記業務用計算機に前記業務を割り当て、前記業務に前記計算機リソースを割り当て、前記業務ごとに計算機リソースの配分を変更する際のパターンを変更プランとして予め設定した配分変更定義情報を保持し、業務用計算機で計算機リソースの配分変更を行う所定の状態となったときに、業務に対する計算機リソースの割り当て変更量に応じたデメリットの大きさを示す指標として変更プラン毎にペナルティ量を算出し、変更プラン毎のペナルティ量に基づいて、業務用計算機で業務に割り当てる計算機リソースの配分の変更を決定して、前記業務用計算機に通知する。
Description
本発明は、計算機で実行する業務に割り当てる計算機リソースを管理する技術に関する。
近年、携帯情報端末の位置情報に基づく広告の配信や、位置情報の集計業務や監視業務、あるいはスマートメータからの情報を対象とした電力制御や監視業務など、大量のログデータから、制御や監視あるいは予測など様々な業務を行う社会インフラとしてのITシステムの構築が多方面で進められつつある。
上記のようなITシステムにおいては、サーバやストレージあるいは通信帯域などの計算機リソースを複数の業務で共有するため、それぞれの業務内容や負荷に応じて適切に計算機リソースを配分する業務間リソース管理システムが必須となる。業務間リソース管理システムでは、業務の負荷に応じてどのようなリソースの配分を行うかに関するポリシーを設定しておき、ポリシーに従って計算機リソースの管理が行われる。
計算機リソースの管理では、業務の内容に踏み込んでポリシーを記述する大域ポリシーと、業務内容に踏み込まずに、業務毎の優先度の設定や、計算機リソースの配分割合の静的な設定を行う静的ポリシーと、に大別することができる。
大域ポリシーは、例えば、非特許文献1のような「線形計画法」が知られている。「線形計画法」では、各業務に割当てられるリソース量を入力変数、割当ての結果として得られる業務上の効果の大きさを目的変数として、両者の関係が一次式で表現される場合に、計算機リソースの上限値を入力変数の制約として目的変数を最大化するリソースの割当てを決定する事が出来る。
一方、静的ポリシーは、例えば、非特許文献2のような「VMware(登録商標) DRS (Distributed Resource Scheduler)」を挙げることが出来る。「VMware DRS」では、個々の業務を実行する仮想マシン毎に、仮想マシンが分担する業務の優先度を示すシェアを指定し、シェアの大きい仮想マシンに対して優先的に計算機リソースを配分することで、業務の内容を考慮したリソース配分を実現する。
「情報科学辞典」、岩波書店、1990年5月25日 発行、第399頁
「VMware徹底入門」、翔泳社、2008年11月12日 発行、第273-277頁
しかしながら、上記従来の大域ポリシーでは、新たな業務が追加される度にポリシー記述全体の見直しが必要となり、ポリシーの運用管理コストが増大する、という問題があった。
また、大域ポリシーでは、各業務において割当てられた計算機リソースの量と、業務に対する効果との関係を全て定式化(処理手順の固定化)して事前に登録を行う必要があり、また、上述の解を得るためには,計算機リソースの量と効果の間の関係式が一定の制限を満たしている必要がある。そのため,実行時の状況によって業務の効果が変動するなど、計算機リソースの量と効果の関係を一次式など単純な形で定式化する事が難しい場合には、大域ポリシーを適用することが出来ない、という問題があった。
一方、上記静的ポリシーでは、シェアの大小によって計算機リソースの配分の大小が決定されてしまい、業務へ割り当てる計算機リソース配分が低下した場合に伴って発生する業務のサービスレベルの低下を考慮することが出来ない、という問題があった。
そこで、本発明では、上記問題点に鑑みてなされたもので、複数の計算機リソースの配分計画の内容を理解する必要が無く、かつ、個々の計算機リソースの配分計画に固有の事情を考慮することを可能にすることを目的とする。
本発明は、プロセッサとメモリを計算機リソースとして提供する業務用計算機と、プロセッサとメモリを備えて1以上の前記業務用計算機の計算機リソースを管理する管理計算機と、を備えた計算機システムであって、前記管理計算機は、前記業務用計算機に割り当てる業務を予め設定した業務割当情報と、前記業務用計算機に割り当てた業務のそれぞれに割り当てる前記計算機リソースを設定したリソース割当情報と、前記業務ごとに計算機リソースの配分を変更する際のパターンを変更プランとして予め設定した配分変更定義情報と、前記業務割当情報に基づいて前記業務用計算機に業務を割り当て、前記リソース割当情報に基づいて、前記業務に前記計算機リソースを割り当てるリソース配分管理部と、前記業務用計算機で計算機リソースの配分変更を行う所定の状態となったときに、前記業務に対する計算機リソースの割り当て変更量に応じたデメリットの大きさを示す指標として前記変更プラン毎にペナルティ量を算出するペナルティ量算出部と、前記変更プラン毎のペナルティ量に基づいて、前記業務用計算機で前記業務に割り当てる計算機リソースの配分変更を決定して、前記業務用計算機に通知するリソース配分決定部と、を有し、前記業務用計算機は、前記管理計算機から当該業務用計算機に割り当てられた業務と、前記管理計算機から当該業務に割り当てられた前記計算機リソースと、前記業務が使用する前記計算機リソースの使用量と、を管理する個別リソース配分管理部を有し、前記個別リソース配分管理部は、前記管理計算機で決定された前記計算機リソースの配分変更に応じて、前記業務に割り当てる前記計算機リソースを変更する。
本発明によれば、業務毎に独立した計算機リソースの配分を設定し、さらに、業務内容に踏み込んだ計算機リソースの配分変更を実現できる。
以下、本発明の一実施形態について添付図面を用いて説明する。
図1は、本発明を適用する計算機システムの一例を示すブロック図である。管理計算機1は、ネットワーク3を介して接続された複数の業務用計算機2で稼働する業務と、当該業務に割り当てる計算機リソース(以下、リソースとする)を管理する。業務用計算機2は、2-1~2-nのn台で構成される。なお、業務用計算機の総称を符号2で表す。また、業務用計算機2の構成は、図1の業務用計算機2-1と同様の構成である。
業務用計算機2は、図2で示すように、業務用計算機2-1が通信システムのセンタ局計算機2-1として機能し、業務用計算機2-2、2-nが通信システムの基地局計算機2-2、2-nとして機能する例を示す。
なお、図2は、本発明の計算機システムを通信キャリアに適用した例を示すブロック図である。基地局計算機2-2、2-nは、配下の端末4の通信を管理して、所定の条件を満たす端末4に対して広告の配信を行う。センタ局計算機2-1は、基地局計算機2-2、2-nを管理する。管理計算機1は、業務用計算機2への業務の割り当てと、業務に割り当てるリソースの配分を管理する。なお、リソースは、業務に割り当てるプロセッサのコア数や、メモリの容量、記憶デバイスの容量、ネットワークアダプタの帯域などである。なお、プロセッサ11のひとつのコアに複数の業務を割り当てる場合には、業務に割り当てるコアの処理時間(または占有時間あるいは占有率)をリソースとすることができる。
基地局計算機2-2、2-nは、端末4の位置情報を収集して所定の条件に合致する端末4へ広告を配信する配信業務を実行する。また、基地局計算機2-2,2-nは、端末4の位置情報と、端末4のユーザの属性情報(性別、年齢)を集計する集計業務を実行する。また、基地局計算機2-2、2-nは、端末4の通信を制御する交換機(図示省略)の負荷を検出し、負荷が閾値を超えたか否かを監視する監視業務を実行する。なお、監視業務は、検出した交換機の負荷が、予め設定された閾値を超えると、センタ局計算機2-1へ過負荷の発生を通知する。
センタ局計算機2-1は、各基地局計算機2-2、2-1が収集した端末4の位置情報と属性情報を集計し、グラフや表などの可視化された情報を生成する集計業務を実行する。また、センタ局計算機2-1は、各基地局計算機2-2、2-1の負荷情報を取得し、予め設定された負荷の閾値を超えた基地局計算機2を管理計算機1へ通知する監視業務を実行する。
上記のような業務の割り当ては、管理計算機1が図3の業務割当テーブル123を参照して割り当てる。図3は、管理計算機1が保持する業務割当テーブル123の一例を示す図である。管理計算機1のリソース配分管理部100は、業務割当テーブル123に基づいて基地局計算機及びセンタ局計算機として機能する業務用計算機2に業務を割り当てる。
業務割当テーブル123は、識別子1231と、配信、集計、監視の3つの業務1232について、基地局計算機(1233)2-2、2-nとセンタ局計算機(1234)2-1に割り当てる業務1232を設定する。図示の例では、リソース配分管理部100が、基地局計算機2-2、2-nに、配信、集計、監視の3つの業務を割り当て、センタ局計算機2-1に集計と監視の2つの業務を割り当てる例を示す。なお、業務割当テーブル123では、業務が増える度に、業務情報管理部120が新たなエントリを追加する。
次に、管理計算機1と業務用計算機2の構成について、図1を参照しながら説明する。まず、管理計算機1は、演算を行うプロセッサ11と、データやプログラムを格納するメモリ12と、データやプログラムを保持する記憶デバイス13と、ネットワーク3と通信を行うネットワークアダプタ14と、から構成される。
メモリ12には、リソース配分管理部100と、リソース配分決定部110と、業務情報管理部120の各機能部位がログラムとしてロードされ、プロセッサ11によって実行される。
プロセッサ11は、各機能部のプログラムに従って動作することによって、所定の機能を実現する機能部として動作する。例えば、プロセッサ11は、リソース配分管理プログラムに従って動作することでリソース配分管理部100として機能する。他のプログラムについても同様である。さらに、プロセッサ11は、各プログラムが実行する複数の処理のそれぞれを実現する機能部としても動作する。計算機及び計算機システムは、これらの機能部を含む装置及びシステムである。
リソース配分管理部100やリソース配分決定部110の各機能を実現するプログラム、テーブル等の情報は、記憶デバイス13や不揮発性半導体メモリ、ハードディスクドライブ、SSD(Solid State Drive)等の記憶デバイス、または、ICカード、SDカード、DVD等の計算機読み取り可能な非一時的データ記憶媒体に格納することができる。
リソース配分管理部100は、各業務用計算機2で実行される業務に割り当てるリソースの状態と、各業務用計算機2で実行される業務の割り当てを管理する。リソース配分管理部100は、業務に割り当てるリソースの配分を管理するリソース配分状況管理モジュール101と、業務に割り当てるリソースの配分の変更を指令するリソース配分変更指示モジュール102と、を含む。
リソース配分決定部110は、各業務用計算機2で実行される業務に割り当てるリソースの配分を決定する。リソース配分決定部110は、業務に割り当てるリソースの変更要求をリソース配分管理部100から受け付けるリソース配分変更要求受付モジュール111と、業務に割り当てるリソースを変更するポリシー(変更プラン)を決定するリソース配分方針決定モジュール112と、を含む。
業務情報管理部120は、リソース配分の変更プランの管理と、後述するペナルティ量の算出を行う。業務情報管理部120は、業務に割り当てるリソースの配分を変更するプランを受け付けて、後述の配分変更定義テーブル104に登録するリソース配分変更プラン登録モジュール121と、業務に割り当てるリソースを削減したときに発生する業務のペナルティ量を算出するリソース変更ペナルティ算出モジュール122と、を含む。ここで、ペナルティとは、業務に対するリソースの割り当て削減によって生じたデメリットを示す。そして、ペナルティ量は、業務に対するリソースの割り当て削減量に応じて発生するデメリットの大きさを示す指標として管理計算機1で後述するように算出される。
次に、業務用計算機2の一例として、図2のセンタ局計算機として機能する業務用計算機2-1の例を示す。なお、他の業務用計算機2の構成も同様である。業務用計算機2-1は、演算を行うプロセッサ21と、データやプログラムを格納するメモリ22と、データやプログラムを保持する記憶デバイス23と、ネットワーク3と通信を行うネットワークアダプタ24と、から構成される。
メモリ22には、個別リソース配分管理部200と、管理計算機1によって割り当てられた業務がロードされ、プロセッサ21によって実行される。なお、図示の例では、配信業務211と、集計業務212と、監視業務213の3つの業務が割り当てられた状態を示す。なお、図2に示すセンタ局計算機として機能する業務用計算機2-1では、配信業務211は実行されないので、図1では破線で示した。
プロセッサ21は、各機能部のプログラムに従って動作することによって、所定の機能を実現する機能部として動作する。例えば、プロセッサ21は、個別リソース配分管理プログラムに従って動作することで個別リソース配分管理部200として機能する。他のプログラムについても同様である。さらに、プロセッサ21は、各プログラムが実行する複数の処理のそれぞれを実現する機能部としても動作する。計算機及び計算機システムは、これらの機能部を含む装置及びシステムである。
個別リソース配分管理部200や各業務の各機能を実現するプログラム、テーブル等の情報は、記憶デバイス23や不揮発性半導体メモリ、ハードディスクドライブ、SSD(Solid State Drive)等の記憶デバイス、または、ICカード、SDカード、DVD等の計算機読み取り可能な非一時的データ記憶媒体に格納することができる。
個別リソース配分管理部200は、管理計算機1からの指令に基づいて、当該業務用計算機2で実行する業務に割り当てるリソースの配分を管理する。個別リソース配分管理部200は、管理計算機1からの指令に応じて、業務に割り当てるリソースの配分を変更するリソース配分変更モジュール201と、各業務に割り当てたリソースの配分の状況を収集するリソース配分状況収集モジュール202、とを含む。
なお、図1の業務用計算機2-1に割り当てられた集計業務212、監視業務213は、上述のように図3に示したとおりである。
図4Aは、基地局計算機2-2とセンタ局計算機2-1に割り当てられた業務と、リソースの一例を示す図である。図4Bは、管理計算機1が保持するリソース割当テーブル103の一例を示す図である。なお、以下の説明では、複数の基地局計算機として機能する業務用計算機2-2~2-nのうち、業務用計算機2-2とセンタ局計算機として機能する業務用計算機2-1について説明する。
図4Bのリソース割当テーブル103は、業務用計算機2で実行する業務の種類及びリソース上限のエントリを備えた種別1031と、基地局計算機2-2で実行する業務に割り当てたリソースの割当リソース量1032と、センタ局計算機2-1で実行する業務に割り当てたリソースの割当リソース量1033を示す。なお、基地局計算機2-nに割り当てるリソースについては図示を省略したが、基地局計算機毎にカラムを増やせば良い。
図示の例では、基地局計算機2-2に配信業務211をリソース量R11で割り当て、集計業務212をリソース量R12で割り当て、監視業務213をリソース量R13で割り当てる例を示す。また、センタ局計算機2-1には集計業務212をリソース量R22で割り当て、監視業務213をリソース量R23で割り当てる例を示す。リソース上限R1maxは、基地局計算機2-2の業務に割り当て可能なリソースの種類と上限値が含まれる。同様に、リソース上限R2maxには、センタ局計算機2-1の業務に割り当て可能なリソースの種類と上限値が含まれる。
図4Aは、基地局計算機2-2で実行する業務に割り当てた割当リソース量1032と、センタ局計算機2-1で実行する業務に割り当てた割当リソース量1033の初期状態(業務開始時など)を示す。図中、基地局計算機2-2で実行する配信業務にはリソース量R11が割り当てられ、集計業務にはリソース量R12が割り当てられ、監視業務にはリソース量R13が割り当てられ、基地局計算機2-2が業務に割り当てられるリソース量の上限値がR1maxで示される。
同様に、センタ局計算機2-1で実行する集計業務にはリソース量R22が割り当てられ、監視業務にはリソース量R23が割り当てられ、センタ局計算機2-1が業務に割り当てられるリソース量の上限値がR2maxで示される。
ここで、リソース量Rは、リソースの種類とリソースの量を含み、例えば、業務に割り当てるプロセッサのコア数×メモリ容量などの処理能力の指標となる値を用いることができる。
図5は、基地局計算機とセンタ局計算機が使用するリソース量が変化した一例を示す図である。基地局計算機2-2のリソース使用量1032aと、センタ局計算機2-1のリソース使用量1033aは、図1に示した、個別リソース配分管理部200が検出した業務ごとのリソース使用量を、管理計算機1で集計したものである。なお、業務ごとのリソース使用量の検出は、OSのタスクマネージャやモニタなど周知または公知の手法で検出すればよい。
図5では、基地局計算機2-2が管轄する端末4の数が増大し、端末4に対する配信業務211で使用されるリソースの使用量r11が増大し、基地局計算機2-2において3つの業務で使用されるリソース使用量r11、r12、r13の合計が、基地局計算機2-2で割り当て可能なリソース量の上限値R1maxを超えてしまった例を示す。
さらに、配信業務211は、基地局計算機2-2~2-nでのみ実施可能という制約があるため、集計業務212あるいは監視業務213へ割り当てるリソースの調整により、各業務が使用するリソース使用量の合計を、上記上限値R1maxを以下に抑える必要がある。
これに対して、管理計算機1では、図11で示す配分変更定義テーブル104のように、予め設定されたリソース配分の変更プランを保持しており、基地局計算機2-2~2-nでリソース不足が発生したときには、業務の内容に応じてリソースを変更するパターンを選択することができる。
図11は、管理計算機1が保持する配分変更定義テーブル104の一例を示す図である。配分変更定義テーブル104は、業務の名称を格納する業務1041と、リソース配分の変更プランを格納するプラン1042と、変更プランの内容を格納する説明1043からひとつのエントリが構成される。
図示の例では、業務1041毎にひとつのプラン1042を定義した例を示したが、エントリを追加することで、ひとつの業務に複数のプラン1042を定義することができる。変更プランの設定は、管理計算機1のリソース配分変更プラン登録モジュール121を起動して、図示しないコンソールから配分変更定義テーブル104に登録することができる。
図示の例では、配信業務211に対するリソース配分の変更プランとして、配信間隔を拡大してリソースの使用量を抑制する配信抑制が設定される。リソースの使用量が低下する反面、広告を配信可能な端末4の数が低下するというペナルティが発生する。
また、集計業務212に対するリソース配分の変更プランとして、集計業務をセンタ局計算機2-1に分散して、基地局計算機2-2のリソースの使用量を抑制する集計移動が設定される。集計業務212の一部がセンタ局計算機2-1へ移動することで基地局計算機2-2におけるリソースの使用量が低下する反面、移動先のセンタ局計算機2-1へ集計対象のデータを転送するオーバーヘッドが加わるというペナルティが発生する。
また、監視業務213に対するリソース配分の変更プランとして、監視間隔を拡大してリソースの使用量を抑制する監視抑制が設定される。監視間隔の拡大によってリソースの使用量が低下する反面、異常発生の検知が遅延する可能性が増えるというペナルティが発生する。
管理計算機1が、図11に示した配分変更定義テーブル104の変更プランから配信抑制を選択した例が図6である。
図6は、基地局計算機2-2とセンタ局計算機2-1が使用する計算機リソースの割り当てを変更した例を示す図である。基地局計算機2-2のリソース使用量1032aについて、配信業務r11に割り当てるリソースの配分を抑制する配信抑制の変更プランを実施することで、3つの業務のリソース使用量r11、r12、r13の和を上限値R1max以下に抑制した例である。
配信業務211では、リソースの配分を制限した結果、配信対象とする端末4を間引くことで、配信業務211で必要となる基地局計算機2-2のリソース使用量を削減する。ただし、全ての端末4に対して広告の配信が行われなくなるので、配信業務211そのものの質が低下することとなり、業務上の損失が発生する。業務の質の低下は、ペナルティとなる。
図7は、基地局計算機2-2に割り当てられた集計業務212の一部をセンタ局計算機2-1へ移動した例を示す図である。基地局計算機2-2の集計業務212の一部を他のセンタ局計算機2-1へ移動する集計移動の変更プランを実施することで、基地局計算機2-2の業務が使用するリソースを抑制した例を示す図である。図5で示したように、基地局計算機2-2の負荷が増大したのに対し、管理計算機1では、予め設定された複数のリソース配分の変更プランから、集計業務212の一部をセンタ局計算機2-1へ移動する変更プランを選択した例が図7である。
基地局計算機2-2のリソース使用量1032aについて、集計業務r12の一部をセンタ局計算機2-1に移動してリソースの配分を変更することで、基地局計算機2-2の3つの業務のリソース使用量r11、r12、r13の和を上限値R1max以下に抑制することができる。
基地局計算機2-2で実行する集計業務212の一部をセンタ局計算機2-1へ移動することで、基地局計算機2-2の集計業務212に割り当てるリソースを低減できる。しかし、基地局計算機2-2の集計業務212は、少なくともデータを収集してセンタ局計算機2-1へ転送する必要があるので、基地局計算機2-2の集計業務212に割り当てるリソースを0にすることはできない。
図8は、基地局計算機2-2の監視業務213が使用するリソースを抑制した例を示す図である。図5で示したように、基地局計算機2-2の負荷が増大したのに対し、管理計算機1では、予め設定された複数のリソース配分の変更プランから、基地局計算機2-2の監視業務213に割り当てるリソースを抑制する変更プランを選択した例が図8である。
図5で示したように、基地局計算機2-2の負荷が増大したのに対し、管理計算機1では、予め設定された複数のリソース配分の変更プランから、監視業務213に割り当てるリソースを抑制する変更プランを選択した例が図8である。
基地局計算機2-2のリソース使用量1032aについて、監視業務r13に割り当てるリソースを抑制することで、基地局計算機2-2の3つの業務のリソース使用量r11、r12、r13の和を上限値R1max以下に抑制することができる。
監視業務213に割り当てるリソースを抑制すると、交換機の監視間隔を拡大する必要があるため、交換機の過負荷などの検知が遅延する場合がある。この例では、リソースの抑制によって、交換機の状態を検知するタイミングの遅延がペナルティとなる。
図9は、計算機システムで行われる処理の一例を示すシーケンス図である。このシーケンス図の前提として、管理計算機1は図2で示したように、複数の業務用計算機2のうち、センタ局計算機2-1と基地局計算機2-2~2-nを決定するステップと、管理計算機1が、図3で示した業務割当テーブル123に従って、基地局計算機2-2~2-nとセンタ局計算機2-1に業務を割り当てるステップと、管理計算機1が、図4Bのリソース割当テーブル103に従って、基地局計算機2-2~2-nとセンタ局計算機2-1の業務にリソースを割り当てるステップと、実施しているものとする。
管理計算機1のリソース配分管理部100では、リソース配分状況管理モジュール101が、所定のタイミング(所定の周期など)で各業務用計算機2-1~2-nの個別リソース配分管理部200から、割り当てた業務についてリソースの使用状況(使用量)を取得する。
そして、リソース配分状況管理モジュール101は、取得したリソースの使用量のうち、予め設定した割当量(リソース割当テーブル103の値)を超えている業務用計算機2の業務をリソース不足として検出する。なお、リソース不足の業務の検出は、業務に割り当てたプロセッサ21の使用率(=使用量/割当量)が所定の閾値(例えば、90%)を超えていれば当該業務がリソース不足と判定してもよく、あるいは、業務に割り当てたメモリ領域の使用率が上記閾値を超えていれば当該業務がリソース不足と判定してもよい。
リソースが不足した業務が検出されるとリソース配分管理部100はリソース配分決定部110にリソース不足の通知を送信する(S1)。リソース配分決定部110は、リソース不足の通知をリソース配分変更要求モジュールで受信し、業務情報管理部120にリソース不足が発生した業務用計算機2で、業務に割り当てたリソースを削減する要求を送信する(S2)。
業務情報管理部120では、リソース変更ペナルティ算出モジュール122が、図11の配分変更定義テーブル104に登録されているリソースの割り当て変更プランを実施したときのペナルティ量を算出する。そして、業務情報管理部120は、リソース配分決定部110にペナルティ量の算出結果を送信する(S3)。
次に、リソース配分決定部110では、リソース配分方針決定モジュール112が、算出された変更プラン毎のペナルティ量に基づいて、リソースの配分を変更する内容を後述するように決定する(S4)。
そして、リソース配分方針決定モジュール112は、リソース配分管理部100にリソースの配分の変更指示を通知する(S5)。リソース配分管理部100のリソース配分変更指示モジュール102は、リソース配分決定部110から受信したリソースの配分変更を、業務用計算機2の個別リソース配分管理部200に通知する(S6)。
そして、業務用計算機2の個別リソース配分管理部200は、管理計算機1のリソース配分管理部100受信したリソースの配分変更を実施する。
上記処理により、業務用計算機2でリソースの不足が発生した場合には、予め設定された変更プラン毎のペナルティ量に基づいて、リソースの配分を変更することが可能となる。
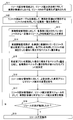
図10は、管理計算機1のリソース配分決定部110で行われるリソースの配分変更処理の一例を示すフローチャートである。この処理は、上記図9のステップS4で行われる処理である。
まず、ステップS11では、図9のステップS1で示したように、管理計算機1のリソース配分決定部110は、リソース配分管理部100からリソースが不足した通知を受信する。この通知には、業務用計算機2を特定する値Mと、不足したリソースの種類とリソース使用量を含む値Rから構成される。なお、値Rは、図4Bのリソース割当テーブル103のリソースR11~R23を指し示す値を含む。
ステップS12では、リソース配分管理部100が、リソース割当テーブル103を参照して、業務用計算機2=Mで、リソースRを使用している業務の一覧を取得する。
ステップS13では、リソース配分決定部110が、業務情報管理部120に対して、リソース不足となった業務用計算機2=Mで、予め設定した削減量ΔRのリソースを削減するよう要求する。なお、削減量ΔRは、不足したリソースに対応するもので、例えば、削減するメモリ容量、プロセッサ21のコア数あるいはプロセッサ21の占有時間などで表される。
ステップS14では、業務情報管理部120が、配分変更定義テーブル104を参照して、各業務に登録されているリソースの変更プランについて、削減量ΔRでリソースの変更を実施した場合のペナルティ量を後述するように算出する。
ステップS15では、リソース配分決定部110が業務情報管理部120で算出した変更プラン毎のペナルティ量を取得する。そして、リソース配分決定部110のリソース配分方針決定モジュール112は、各変更プランを実施した場合に発生するペナルティ量を比較して、各業務のペナルティ量の総和が最小となる変更プラン(または、変更プランの組み合わせ)Cを決定する。
ステップS16では、リソース配分決定部110が上記ステップS15で決定した変更プランCで、業務用計算機2=Mで稼働する業務に割り当てるリソースの変更をリソース配分管理部100に指令する。
ステップS17では、リソース配分管理部100のリソース配分変更指示モジュール102が、業務用計算機2=Mに対して変更プランCでリソースの割り当て変更を実施するよう指令する。
ステップS18では、リソース配分管理部100が、業務用計算機2=Mの個別リソース配分管理部200からリソースの使用量を取得する。そして、リソース配分管理部100は、変更プランCで割り当てたリソースの割り当て量と、取得したリソースの使用量の比(=使用量/割当量)が、所定の閾値以下であればリソース不足が解消したと判定する。リソース不足が解消した場合には、ステップS19に進んで処理を終了する。一方、リソース不足が解消していない場合には、ステップS13に戻ってさらに削減量ΔRでリソースを変更し、リソース不足が解消するまでステップS13~S18の処理が繰り返される。
上記の処理によってリソースが不足した業務用計算機2-Mでは、所定の削減量ΔRずつリソースの配分が変更され、最終的にリソース不足が解消されるまで上記ステップS13~S18のループが実行される。
なお、削減量ΔRずつリソースの配分を変更してもリソース不足が解消しない場合は、他の業務のリソースが過少になるのを防ぐため、ステップS13~S18のループが所定の回数に達した時点で処理を終了し、管理計算機1の図示しないコンソールなどに警告を出力するようにしても良い。
図12A~図12Cは、管理計算機1に保持されるテーブル類で、業務用計算機2で使用されるリソースの使用量を算出するためのテーブルである。
図12Aは、リソース使用量を算出するために業務とパラメータの関係を保持するパラメータテーブル125の一例を示す図である。パラメータテーブル125は、識別子1251と、業務名を格納する業務1252と、リソース使用量を算出するためのパラメータを格納するパラメータ1253とからひとつのエントリが構成される。
配信業務211のパラメータ1253は、配信コストHCと、配信頻度HTと、配信量HVを用いる。配信コストHCは、基地局計算機2-2のプロセッサ21の使用率やメモリの使用率を用いることができる。配信頻度HTは、端末4に広告を送信する時間間隔(秒など)を用いることができる。配信量HVは、1回に配信するデータ量(バイト数など)を用いることができる。
集計業務212では、集計コストSACと、転送コストSTCと、集計量SVと、転送比率SRを用いる。集計コストSAC、転送コストSTCは、業務用計算機2のプロセッサ21の使用率やメモリ22の使用率を用いることができる。集計量SVは、各業務用計算機2から取得したユーザの属性情報のデータ量を用いることができる。転送比率SRは、センタ局計算機2-1へ転送するデータの比率が格納される。この比率は、転送量/総量とすることができる。
監視業務213では、監視コストKCと、監視間隔KTと、を用いる。監視コストKCは、業務用計算機2のプロセッサ21の使用率やメモリ22の使用率を用いることができる。監視間隔KTは、監視を実行する時間間隔(秒など)を用いることができる。
上記パラメータテーブル125は、業務1252毎に、管理者などがパラメータ1253に設定する。
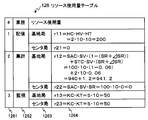
図12Bは、業務ごとにリソース使用量の計算式を保持するリソース使用量テーブル126の一例を示す図である。リソース使用量テーブル126は、識別子1261と、業務名を格納する業務1262と、基地局計算機2-2とセンタ局計算機2-1の何れかを格納する種別1263と、業務用計算機2のリソース使用量を算出する計算式を格納するリソース使用量1264とからひとつのエントリが構成される。
基地局計算機2-2の配信業務211に係るリソース使用量r11は、配信コストHCと配信頻度HT及び配信量HVの積となる。センタ局計算機2-1では配信業務211を割り当てないので、リソース使用量r21=0とする。
基地局計算機2-2の集計業務212に係るリソース使用量r12は、集計コストSACに集計量SVと1-転送比率SRを乗じた値と、転送コストSTCと集計量SV及び転送比率SRの積を加えたものとする。
一方、センタ局計算機2-1の集計業務212に係るリソース使用量r22は、集計コストSACに集計量SVと転送比率SRを乗じた値とする。
次に、基地局計算機2-2の監視業務213に係るリソース使用量r13は、監視コストKCに監視間隔KTを乗じた値とする。
一方、センタ局計算機2-1の監視業務213に係るリソース使用量r23も、監視コストKCに監視間隔KTを乗じた値とする。
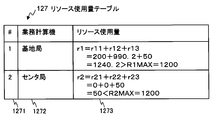
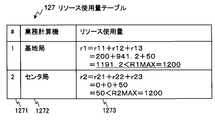
図12Cは、業務用計算機2ごとにリソース使用量の計算式を保持するリソース使用量テーブル127の一例を示す図である。業務用計算機2毎のリソース使用量テーブル126は、識別子1271と、業務用計算機2の役割を格納する業務計算機1272と、業務用計算機2のリソース使用量を算出する計算式を格納するリソース使用量1273とからひとつのエントリが構成される。
基地局計算機2-2のリソース使用量r1は、図12Bで示した基地局計算機2-2の配信業務211のリソース使用量r11と、集計業務212のリソース使用量r12と、監視業務213のリソース使用量r13の和となる。
センタ局計算機2-1のリソース使用量r2は、図12Bで示したセンタ局計算機2-1の配信業務211のリソース使用量r21と、集計業務212のリソース使用量r22と、監視業務213のリソース使用量r23の和となる。
図13A~図12Cは、管理計算機1に保持されるテーブル類で、業務用計算機2でリソースの配分変更を行う際の指標となるペナルティ量の算出に使用されるテーブルである。
図13Aは、ペナルティ量を算出するために業務とパラメータの関係を保持するパラメータテーブル128の一例を示す図である。パラメータテーブル128は、識別子1281と、業務名を格納する業務1282と、ペナルティ量を算出するためのパラメータを格納するパラメータ1283とからひとつのエントリが構成される。
配信業務211のパラメータ1283は、所定値が設定された配信ペナルティ係数HPであり、集計業務212のパラメータ1283は、所定値が設定された集計ペナルティ係数SPであり、監視業務213のパラメータ1283は、所定値が設定された監視ペナルティ係数HPである。
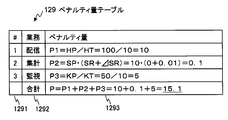
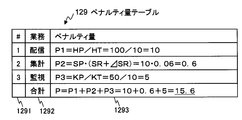
図13Bは、業務ごとにペナルティ量の計算式を保持するペナルティ量テーブル129の一例を示す図である。ペナルティ量テーブル129は、識別子1291と、業務名を格納する業務1292と、業務用計算機2のペナルティ量を算出する計算式を格納するペナルティ量1293とからひとつのエントリが構成される。
配信業務211のペナルティ量P1は、配信ペナルティ係数HPを、配信頻度HTで除した値とする。集計業務212のペナルティ量P2は、集計ペナルティ係数SPに、転送比率SRを乗じた値とする。監視業務213のペナルティ量P3は、監視ペナルティ係数KPを、監視間隔KTで除した値とする。
そして、各業務のペナルティ量の和Pが、業務用計算機2に発生するペナルティ量として算出される。
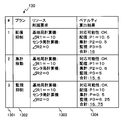
図14は、上記図13A、図13Bに基づいて、各変更プランにリソースの削減要求を行った場合のペナルティ量の計算結果の出力例をテーブル130として表現したものである。
テーブル130は、識別子1301と、変更プランを格納するプラン1302と、リソースの削減要求の対象を格納するリソース削減要求1303と、ペナルティの算出結果を格納するペナルティ算出結果1304とからひとつのエントリが構成される。
図14の配信抑制では、センタ局計算機2-1では配信業務211を実行していないため、配信業務211についてはセンタ局計算機2-1に対するリソースの削減量ΔR2は0となる。
また、図14の例では、集計移動の変更プランに対応できないことを示し、基地局計算機2-2の集計業務212を、センタ局計算機2-1に移動できないことを示す。これは、例えば、センタ局計算機2-1のリソースが逼迫しているときに生じる。
図15Aは、上記図12Aに示したパラメータテーブル125に値を設定した一例である。同じく、図15Bは、上記図13Aに示したペナルティ量のパラメータテーブル128に値を設定した一例である。
図16Aは、上記図12Bに示したリソース使用量テーブル126に値を設定した一例である。同じく、図16Bは、上記図12Cに示した業務用計算機2ごとのリソース使用量テーブル127に値を設定した一例である。この例では、基地局計算機2-2のリソース使用量P1=1250が、上限値R1MAXを超えるため、リソース不足となっていることを示す。すなわち、図16A、図16Bは、リソースの変更プランを適用する以前のリソース使用量を示している。
図17は、図13Bに示したペナルティ量テーブル129に、図15A、図15Bのパラメータの値から、各業務1292でリソースの削減要求を行う以前のペナルティ量である。なお、このテーブルはリソースの削減要求を行ったときと比較を行うために図示したものである。
図18は、リソース配分の削減要求に対するパラメータ変更量の計算式を保持するパラメータ変更量テーブル131の値の一例を示す図である。パラメータ変更量テーブル131は、識別子1311と、リソースの変更プランを格納するプラン1312と、リソースの変更プランの対象となる業務名と、変更量の計算式を格納するパラメータ変更量1313とからひとつのエントリが構成される。パラメータ変更量テーブル131は、業務情報管理部120で管理される。パラメータ変更量テーブル131は、リソース配分変更プラン登録モジュール121が図示しないコンソールから入力を受け付けることにより設定することができる。
図示の例では、リソースの削減量ΔR=-10の場合を示している。変更プランが配信抑制のとき、配信頻度HTを拡大することでリソースの削減を行うので、配信頻度HTの変更量をΔHTとし、リソースの削減量ΔR=-10のときΔHT=-0.5となる例を示す。
変更プランが集計移動のとき、転送比率SRを増大することでリソースの削減を行うので、転送比率SRの変更量をΔSRとし、リソースの削減量ΔR=-10のときΔHTは約-0.01となる例を示す。
変更プランが監視抑制のとき、監視間隔KTを拡大することでリソースの削減を行うので、監視間隔KTの変更量をΔKTとし、リソースの削減量ΔR=-10のときΔKT=-2となる例を示す。
図19Aは、配信抑制によるリソース配分の変更後で、業務ごとにリソース使用量の計算式を保持するリソース使用量テーブルの値の一例を示す図である。図19Aでは、リソースの変更プランとして配信抑制を選択したときのリソース使用量テーブル126を示す。すなわち、図19Aは、上記図16Aに示したリソース使用量テーブル126に、図18に示したパラメータ変更量テーブル131の配信間隔の変更量ΔHTを適用した値を示す。
図示の例では、配信業務211の基地局計算機2-2のリソース使用量が、図16Aの200から190に低下した例を示す。
図19Bは、配信抑制によるリソース配分の変更後で、業務用計算機2ごとにリソース使用量の計算式を保持するリソース使用量テーブル127の一例を示す図である。図19Bは、図19Aの各リソース使用量r11~r23より、基地局計算機2-2とセンタ局計算機2-1のリソース使用量r1、r2を算出した結果を示す。
図示の例では、基地局計算機2-2のリソース使用量r1が1240に低下したが、依然として基地局計算機2-2が業務に割り当てられるリソース量の上限値R1maxを超えている。
図20は、配信抑制によるリソース配分の変更後で、業務ごとにペナルティ量を保持するペナルティ量テーブル129の値の一例を示す図である。図20のペナルティ量テーブル129は、図18のパラメータ変更量テーブル131の配信頻度HTの変更量ΔHTを適用したものである。
各業務のペナルティ量の合計は15.5となり、配信抑制を行う以前の図17に比して0.5だけ増加している。
図21Aは、集計移動によるリソース配分の変更後で、業務ごとにリソース使用量のリソース使用量を保持するリソース使用量テーブル126の値の一例を示す図である。
図21Aでは、リソースの変更プランとして集計移動を選択したときのリソース使用量テーブル126を示す。すなわち、図21Aは、上記図16Aに示したリソース使用量テーブル126に、図18に示したパラメータ変更量テーブル131の転送比率SRの変更量ΔSRを適用した値を示す。
図示の例では、基地局計算機2-2の集計業務212のリソース使用量が、図16Aの1000から990.2に低下した例を示す。
図21Bは、集計移動によるリソース配分の変更後で、業務用計算機2ごとにリソース使用量を保持するリソース使用量テーブル127の値の一例を示す図である。
図21Bは、図21Aの各リソース使用量r11~r23より、基地局計算機2-2とセンタ局計算機2-1のリソース使用量r1、r2を算出した結果を示す。図示の例では、基地局計算機2-2のリソース使用量r1が1240.2に低下したが、依然として基地局計算機2-2が業務に割り当てられるリソース量の上限値R1maxを超えている。
図22は、集計移動によるリソース配分の変更後で、業務ごとにペナルティ量を保持するペナルティ量テーブル129の値の一例を示す図である。図22のペナルティ量テーブル129は、図18のパラメータ変更量テーブル131の転送比率SRの変更量ΔSRを適用したものである。
各業務のペナルティ量の合計は15.1となり、集計移動を行う以前の図17に比して0.1だけ増加している。
図23Aは、監視抑制によるリソース配分の変更後で、業務ごとにリソース使用量のリソース使用量を保持するリソース使用量テーブル126の値の一例を示す図である。
図23Aでは、リソースの変更プランとして監視抑制を選択したときのリソース使用量テーブル126を示す。すなわち、図23Aは、上記図16Aに示したリソース使用量テーブル126に、図18に示したパラメータ変更量テーブル131の監視間隔の変更量ΔKTを適用した値を示す。
図示の例では、基地局計算機2-2の監視業務213のリソース使用量が、図16Aの50から40に低下した例を示す。
図23Bは、監視抑制によるリソース配分の変更後で、業務用計算機ごとにリソース使用量を保持するリソース使用量テーブル127の値の一例を示す図である。
図23Bは、図23Aの各リソース使用量r11~r23より、基地局計算機2-2とセンタ局計算機2-1のリソース使用量r1、r2を算出した結果を示す。図示の例では、基地局計算機2-2のリソース使用量r1が1240に低下したが、依然として基地局計算機2-2が業務に割り当てられるリソース量の上限値R1maxを超えている。
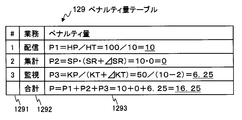
図24は、監視抑制によるリソース配分の変更後で、業務ごとにペナルティ量を保持するペナルティ量テーブル129の値の一例を示す図である。図24のペナルティ量テーブル129は、図18のパラメータ変更量テーブル131の監視間隔KTの変更量ΔKTを適用したものである。
各業務のペナルティ量の合計は16.25となり、監視抑制を行う以前の図17に比して1.25だけ増加している。
図25は、配信抑制、集計移動、監視抑制の各変更プランを一回実施してリソースの削減を行った場合のペナルティ量の計算結果の出力例を、図14と同様のテーブル130として表現したものである。
図25の例では、配信抑制、集計移動、監視抑制の3つの変更プランのそれぞれについて、リソースの削減量ΔR1=-10としたときのペナルティ量を算出した結果を示す。
3つの変更プランの中で、集計移動のペナルティ量の合計値が15.1と最も小さく、監視抑制のペナルティ量の合計が16.25と最も大きい。ペナルティ量が大きいほど、リソースの削減量に比して、デメリットも増大することになる。
例えば、集計移動では、基地局計算機2-2がセンタ局計算機2-1へ集計対象のデータを転送するオーバーヘッドが増える、というデメリットが生じる。これに対して、監視抑制では、監視間隔の拡大によって、障害発生の機会が低減するというデメリットが生じ、計算機システムの信頼性という観点から、監視抑制のペナルティ量が大きくなるよう設定される。
図26Aは、配信抑制、監視抑制の各変更プランと、集計移動の複数回(6回)の適用によるリソース配分の変更後で、業務ごとにリソース使用量のリソース使用量を保持するリソース使用量テーブルの値の一例を示す図である。
図26Aでは、リソースの変更プランとして集計移動を6回実行したときのリソース使用量テーブル126を示す。すなわち、図26Aは、上記図16Aに示したリソース使用量テーブル126に、図18に示したパラメータ変更量テーブル131の転送比率SRの変更量ΔSRを適用した例である。
図示の例では、基地局計算機2-2の集計業務212のリソース使用量が、図16Aの1000から941.2に低下した例を示す。
図26Bは、配信抑制、監視抑制の各変更プランと、集計移動の複数回(6回)の適用によるリソース配分の変更後で、業務用計算機2ごとにリソース使用量を保持するリソース使用量テーブル127の値の一例を示す図である。
図26Bは、図26Aの各リソース使用量r11~r23より、基地局計算機2-2とセンタ局計算機2-1のリソース使用量r1、r2を算出した結果を示す。図示の例では、基地局計算機2-2のリソース使用量r1が1191.2に低下し、基地局計算機2-2が業務に割り当てられるリソース量の上限値R1max以内となり、リソース不足を解消したことを示す。
図27は、配信抑制、監視抑制の各変更プランと、集計移動の複数回(6回)の適用によるリソース配分の変更後で、業務ごとにペナルティ量のリソース使用量を保持するペナルティ量テーブル129の値の一例を示す図である。図27のペナルティ量テーブル129は、図18のパラメータ変更量テーブル131の転送比率SRの変更量ΔSRを適用したものである。
各業務のペナルティ量の合計は15.6となり、集計移動を行う以前の図17に比して0.6だけ増加している。
図28は、配信抑制、監視抑制の各変更プランを各1回適用し、集計移動を6回適用してリソース配分を変更した後のペナルティ量を業務ごとに表示した例を示す図である。図25で示したように、リソースの削減量ΔR1=-10のときに、最もペナルティ量(P2=0.1)が小さい集計移動を6回適用することで、集計移動のペナルティ量の増分をP2=0.6に抑えながら、図26Bで示したように、基地局計算機2-2のリソース不足を解消することができる。これにより、ペナルティ量の総和が最小となる変更プランにより、リソース配分を変更して基地局計算機2-2のリソース不足を解消することが可能となる。なお、上記では集計移動を6回適用した例を示したが、これは図10のステップS13~S18の繰り返しによるもので、リソース不足が解消するまでの集計移動の実行回数である。
<まとめ>
以上のように本発明は、計算機のリソースを複数の業務で共有し、各業務毎にリソースの割当量を決定する計算機システムにおいて、業務の種類毎に割り当てる業務用計算機2を決定する業務割当テーブル123(図3)と、業務用計算機2毎に割り当てられた業務へ計算機のリソースを配分するリソース割当テーブル103(図4B)と、リソース不足が発生したときに業務の種類ごとにリソース配分の変更プランを予め設定した配分変更定義テーブル104(図11)とを、備えることで、複数の業務に割り当てる計算機のリソース配分を調整し、かつ、業務の内容に踏み込んだリソース配分の調整を実現することができる。業務の内容に踏み込んだ調整の例として、上記実施例では、配信業務211と監視業務213では、処理の間隔を拡大してリソース使用量を抑制し、集計業務212では、業務を分散する例を示した。すなわち、他の業務用計算機2に分散可能な業務では、他の計算機に業務を分散して基地局計算機2-2のリソース不足を解消する。一方、分散できない業務の場合には、処理を実行する間隔の拡大やリソースの使用率の低減などによりリソース不足を解消する。
以上のように本発明は、計算機のリソースを複数の業務で共有し、各業務毎にリソースの割当量を決定する計算機システムにおいて、業務の種類毎に割り当てる業務用計算機2を決定する業務割当テーブル123(図3)と、業務用計算機2毎に割り当てられた業務へ計算機のリソースを配分するリソース割当テーブル103(図4B)と、リソース不足が発生したときに業務の種類ごとにリソース配分の変更プランを予め設定した配分変更定義テーブル104(図11)とを、備えることで、複数の業務に割り当てる計算機のリソース配分を調整し、かつ、業務の内容に踏み込んだリソース配分の調整を実現することができる。業務の内容に踏み込んだ調整の例として、上記実施例では、配信業務211と監視業務213では、処理の間隔を拡大してリソース使用量を抑制し、集計業務212では、業務を分散する例を示した。すなわち、他の業務用計算機2に分散可能な業務では、他の計算機に業務を分散して基地局計算機2-2のリソース不足を解消する。一方、分散できない業務の場合には、処理を実行する間隔の拡大やリソースの使用率の低減などによりリソース不足を解消する。
さらに、本発明の計算機システムでは、リソース配分の削減を行う際に、業務に対するリソースの割り当て削減量に応じてデメリットの大きさを示す指標としてペナルティ量を演算し、ペナルティ量が最小となる変更プランによって基地局計算機2-2のリソース不足を解消することができる。
このように、本発明では、計算機のリソースを業務に割り当てる配分の決定を、業務の内容に踏み込んだリソース配分の変更プランを設定した配分変更定義テーブル104と、複数の業務間でリソース配分を調整するリソース割当テーブル103を用いて実施する。これにより、業務の内容や特性に踏み込んだリソースの配分を、不特定多数の業務間においても実現することができる。
また、上記実施例では、基地局計算機2-2のリソースが不足したときに、リソース配分の変更を実施する例を示したが、基地局計算機2-2~2-nまたはセンタ局計算機2-1でリソース配分の変更が必要となったときにリソース配分の変更を実施すれば良い。リソース配分の変更が必要となったときとしては、基地局計算機2-2~2-nのリソースが余剰になったとき、あるいは、基地局計算機2-2~2-nに新たな業務を割り当てるときなどである。
なお、本発明において説明した計算機等の構成、処理部及び処理手段等は、それらの一部又は全部を、専用のハードウェアによって実現してもよい。
また、本実施例で例示した種々のソフトウェアは、電磁的、電子的及び光学式等の種々の記録媒体(例えば、非一時的な記憶媒体)に格納可能であり、インターネット等の通信網を通じて、コンピュータにダウンロード可能である。
また、本発明は上記した実施例に限定されるものではなく、様々な変形例が含まれる。例えば、上記した実施例は本発明をわかりやすく説明するために詳細に説明したものであり、必ずしも説明した全ての構成を備えるものに限定されるものではない。
Claims (10)
- プロセッサとメモリを計算機リソースとして提供する業務用計算機と、
プロセッサとメモリを備えて1以上の前記業務用計算機の計算機リソースを管理する管理計算機と、を備えた計算機システムであって、
前記管理計算機は、
前記業務用計算機に割り当てる業務を予め設定した業務割当情報と、
前記業務用計算機に割り当てた業務のそれぞれに割り当てる前記計算機リソースを設定したリソース割当情報と、
前記業務ごとに計算機リソースの配分を変更する際のパターンを変更プランとして予め設定した配分変更定義情報と、
前記業務割当情報に基づいて前記業務用計算機に業務を割り当て、前記リソース割当情報に基づいて、前記業務に前記計算機リソースを割り当てるリソース配分管理部と、
前記業務用計算機で計算機リソースの配分変更を行う所定の状態となったときに、前記業務に対する計算機リソースの割り当て変更量に応じたデメリットの大きさを示す指標として前記変更プラン毎にペナルティ量を算出するペナルティ量算出部と、
前記変更プラン毎のペナルティ量に基づいて、前記業務用計算機で前記業務に割り当てる計算機リソースの配分変更を決定して、前記業務用計算機に通知するリソース配分決定部と、を有し、
前記業務用計算機は、
前記管理計算機から当該業務用計算機に割り当てられた業務と、前記管理計算機から当該業務に割り当てられた前記計算機リソースと、前記業務が使用する前記計算機リソースの使用量と、を管理する個別リソース配分管理部を有し、
前記個別リソース配分管理部は、
前記管理計算機で決定された前記計算機リソースの配分変更に応じて、前記業務に割り当てる前記計算機リソースを変更することを特徴とする計算機システム。 - 請求項1に記載の計算機システムであって、
前記リソース配分管理部は、
前記業務用計算機から前記業務が使用する計算機リソースの使用量を取得し、前記使用量が当該業務に割り当てた前記計算機リソースを超えているときには、リソース不足の業務が発生したことを判定することを特徴とする計算機システム。 - 請求項2に記載の計算機システムであって、
前記ペナルティ量算出部は、
前記業務用計算機で計算機リソースの配分変更を行う所定の状態として、前記リソース不足の業務が発生したときに、前記業務に対する計算機リソースの割り当て変更量に応じたデメリットの大きさを示す指標として前記変更プラン毎にペナルティ量を算出することを特徴とする計算機システム。 - 請求項3に記載の計算機システムであって、
前記リソース配分決定部は、
前記業務用計算機で提供可能な前記計算機リソースの上限以内で、当該ペナルティ量の和が最小となる前記変更プランまたは変更プランの組み合わせを選択することを特徴とする計算機システム。 - 請求項1に記載の計算機システムであって、
前記配分変更定義情報は、
前記業務用計算機に割り当てた業務の一部を他の業務用計算機に移動する変更プランを含むことを特徴とする計算機システム。 - プロセッサとメモリを計算機リソースとして提供する業務用計算機と、プロセッサとメモリを備えた管理計算機で1以上の前記業務用計算機の計算機リソースを管理する計算機リソースの割当方法であって、
前記管理計算機が、前記業務用計算機に割り当てる業務を予め設定した業務割当情報に基づいて、前記業務用計算機に前記業務を割り当てる第1のステップと、
前記管理計算機が、前記業務用計算機に割り当てた業務のそれぞれに割り当てる前記計算機リソースを設定したリソース割当情報に基づいて、前記業務に前記計算機リソースを割り当てる第2のステップと、
前記管理計算機が、前記業務ごとに計算機リソースの配分を変更する際のパターンを変更プランとして予め設定した配分変更定義情報を保持する第3のステップと、
前記管理計算機が、前記業務用計算機で計算機リソースの配分変更を行う所定の状態となったときに、前記業務に対する計算機リソースの割り当て変更量に応じたデメリットの大きさを示す指標として前記変更プラン毎にペナルティ量を算出する第4のステップと、
前記管理計算機が、前記変更プラン毎のペナルティ量に基づいて、前記業務用計算機で前記業務に割り当てる計算機リソースの配分の変更を決定して、前記業務用計算機に通知する第5のステップと、
前記業務用計算機が、前記管理計算機から当該業務用計算機に割り当てられた業務と、前記管理計算機から当該業務に割り当てられた前記計算機リソースと、前記業務が使用する前記計算機リソースの使用量と、を管理し、前記管理計算機で決定された前記計算機リソースの配分変更に応じて、前記業務に割り当てる前記計算機リソースを変更する第6のステップと、
を含むことを特徴とする計算機リソースの割当方法。 - 請求項6に記載の計算機リソースの割当方法であって、
前記第4のステップは、
前記管理計算機が、前記業務用計算機から前記業務が使用する計算機リソースの使用量を取得し、前記使用量が当該業務に割り当てた前記計算機リソースを超えているときには、リソース不足の業務が発生したことを判定して、前記業務用計算機で計算機リソースの配分変更を行う所定の状態とすることを特徴とする計算機リソースの割当方法。 - 請求項7に記載の計算機リソースの割当方法であって、
前記第4のステップは、
前記管理計算機が、前記業務用計算機で計算機リソースの配分変更を行う所定の状態として、前記リソース不足の業務が発生したときに、前記業務に対する計算機リソースの割り当て変更量に応じたデメリットの大きさを示す指標として前記変更プラン毎にペナルティ量を算出することを特徴とする計算機リソースの割当方法。 - 請求項8に記載の計算機リソースの割当方法であって、
前記第5のステップは、
前記管理計算機が、前記業務用計算機で提供可能な前記計算機リソースの上限以内で、当該ペナルティ量の和が最小となる前記変更プランまたは変更プランの組み合わせを選択することを特徴とする計算機リソースの割当方法。 - 請求項6に記載の計算機リソースの割当方法であって、
前記配分変更定義情報は、
前記業務用計算機に割り当てた業務の一部を他の業務用計算機に移動する変更プランを含むことを特徴とする計算機リソースの割当方法。
Priority Applications (2)
| Application Number | Priority Date | Filing Date | Title |
|---|---|---|---|
| JP2014558367A JP6059259B2 (ja) | 2013-01-24 | 2013-01-24 | 計算機システム及び計算機リソースの割当方法 |
| PCT/JP2013/051458 WO2014115282A1 (ja) | 2013-01-24 | 2013-01-24 | 計算機システム及び計算機リソースの割当方法 |
Applications Claiming Priority (1)
| Application Number | Priority Date | Filing Date | Title |
|---|---|---|---|
| PCT/JP2013/051458 WO2014115282A1 (ja) | 2013-01-24 | 2013-01-24 | 計算機システム及び計算機リソースの割当方法 |
Publications (1)
| Publication Number | Publication Date |
|---|---|
| WO2014115282A1 true WO2014115282A1 (ja) | 2014-07-31 |
Family
ID=51227098
Family Applications (1)
| Application Number | Title | Priority Date | Filing Date |
|---|---|---|---|
| PCT/JP2013/051458 Ceased WO2014115282A1 (ja) | 2013-01-24 | 2013-01-24 | 計算機システム及び計算機リソースの割当方法 |
Country Status (2)
| Country | Link |
|---|---|
| JP (1) | JP6059259B2 (ja) |
| WO (1) | WO2014115282A1 (ja) |
Cited By (2)
| Publication number | Priority date | Publication date | Assignee | Title |
|---|---|---|---|---|
| JP2017111505A (ja) * | 2015-12-14 | 2017-06-22 | 三菱重工業株式会社 | 計算機リソースの最適化システム、および、計算機リソースの最適化方法 |
| WO2019187209A1 (ja) * | 2018-03-30 | 2019-10-03 | 日本電気株式会社 | 運用管理装置、方法及び非一時的なコンピュータ可読媒体 |
Citations (3)
| Publication number | Priority date | Publication date | Assignee | Title |
|---|---|---|---|---|
| JPH0496141A (ja) * | 1990-08-08 | 1992-03-27 | Nec Corp | 2資源システムスケジューリング方式 |
| JP2007249445A (ja) * | 2006-03-15 | 2007-09-27 | Hitachi Ltd | クラスタシステムの負荷分散制御方法およびその装置 |
| JP2011258119A (ja) * | 2010-06-11 | 2011-12-22 | Hitachi Ltd | クラスタ構成管理方法、管理装置及びプログラム |
Family Cites Families (1)
| Publication number | Priority date | Publication date | Assignee | Title |
|---|---|---|---|---|
| JP2008249445A (ja) * | 2007-03-30 | 2008-10-16 | Hitachi-Ge Nuclear Energy Ltd | 密封容器内の放射線計測方法 |
-
2013
- 2013-01-24 WO PCT/JP2013/051458 patent/WO2014115282A1/ja not_active Ceased
- 2013-01-24 JP JP2014558367A patent/JP6059259B2/ja not_active Expired - Fee Related
Patent Citations (3)
| Publication number | Priority date | Publication date | Assignee | Title |
|---|---|---|---|---|
| JPH0496141A (ja) * | 1990-08-08 | 1992-03-27 | Nec Corp | 2資源システムスケジューリング方式 |
| JP2007249445A (ja) * | 2006-03-15 | 2007-09-27 | Hitachi Ltd | クラスタシステムの負荷分散制御方法およびその装置 |
| JP2011258119A (ja) * | 2010-06-11 | 2011-12-22 | Hitachi Ltd | クラスタ構成管理方法、管理装置及びプログラム |
Cited By (5)
| Publication number | Priority date | Publication date | Assignee | Title |
|---|---|---|---|---|
| JP2017111505A (ja) * | 2015-12-14 | 2017-06-22 | 三菱重工業株式会社 | 計算機リソースの最適化システム、および、計算機リソースの最適化方法 |
| WO2019187209A1 (ja) * | 2018-03-30 | 2019-10-03 | 日本電気株式会社 | 運用管理装置、方法及び非一時的なコンピュータ可読媒体 |
| JPWO2019187209A1 (ja) * | 2018-03-30 | 2021-02-12 | 日本電気株式会社 | 運用管理装置、方法及びプログラム |
| JP7060083B2 (ja) | 2018-03-30 | 2022-04-26 | 日本電気株式会社 | 運用管理装置、方法及びプログラム |
| US12093734B2 (en) | 2018-03-30 | 2024-09-17 | Nec Corporation | Operation management apparatus, method, and non-transitory computer readable medium |
Also Published As
| Publication number | Publication date |
|---|---|
| JP6059259B2 (ja) | 2017-01-11 |
| JPWO2014115282A1 (ja) | 2017-01-26 |
Similar Documents
| Publication | Publication Date | Title |
|---|---|---|
| US9602423B2 (en) | Systems, methods, and devices for dynamic resource monitoring and allocation in a cluster system | |
| EP3238054B1 (en) | Cpu overprovisioning and cloud compute workload scheduling mechanism | |
| JP5939740B2 (ja) | 動的にリソースを割り当てる方法、システム及びプログラム | |
| CN102958166B (zh) | 一种资源分配方法及资源管理平台 | |
| EP3281359B1 (en) | Application driven and adaptive unified resource management for data centers with multi-resource schedulable unit (mrsu) | |
| EP3274859B1 (en) | Cluster computing service assurance apparatus and method | |
| US20150309828A1 (en) | Hypervisor manager for virtual machine management | |
| RU2697700C2 (ru) | Равноправное разделение системных ресурсов в исполнении рабочего процесса | |
| US10108459B2 (en) | System and method to dynamically allocate varying processing capacity entitlements based on workload importance | |
| KR101471749B1 (ko) | 클라우드 서비스의 가상자원 할당을 위한 퍼지 로직 기반의 자원평가 장치 및 방법 | |
| JP2011258119A (ja) | クラスタ構成管理方法、管理装置及びプログラム | |
| Song et al. | A two-stage approach for task and resource management in multimedia cloud environment | |
| US20170339069A1 (en) | Allocating Cloud Computing Resources In A Cloud Computing Environment | |
| WO2016041446A1 (zh) | 一种资源分配方法、装置及设备 | |
| US20120233313A1 (en) | Shared scaling server system | |
| WO2013082742A1 (zh) | 资源调度方法、装置和系统 | |
| JP5616523B2 (ja) | 情報処理システム | |
| CN114116173A (zh) | 动态调整任务分配的方法、装置和系统 | |
| CN111443870A (zh) | 一种数据处理的方法、设备及存储介质 | |
| US10643193B2 (en) | Dynamic workload capping | |
| Pandya et al. | Dynamic resource allocation techniques in cloud computing | |
| JP6059259B2 (ja) | 計算機システム及び計算機リソースの割当方法 | |
| US9213575B2 (en) | Methods and systems for energy management in a virtualized data center | |
| CN115454588A (zh) | 线程池数据处理方法及装置、存储介质、处理器 | |
| JP6191361B2 (ja) | 情報処理システム、情報処理システムの制御方法及び制御プログラム |
Legal Events
| Date | Code | Title | Description |
|---|---|---|---|
| 121 | Ep: the epo has been informed by wipo that ep was designated in this application |
Ref document number: 13872994 Country of ref document: EP Kind code of ref document: A1 |
|
| ENP | Entry into the national phase |
Ref document number: 2014558367 Country of ref document: JP Kind code of ref document: A |
|
| NENP | Non-entry into the national phase |
Ref country code: DE |
|
| 122 | Ep: pct application non-entry in european phase |
Ref document number: 13872994 Country of ref document: EP Kind code of ref document: A1 |