WO2014046355A1 - 풍력터빈의 파워커브 모니터링을 위한 파워커브 리미트 자동 산출 방법 - Google Patents
풍력터빈의 파워커브 모니터링을 위한 파워커브 리미트 자동 산출 방법 Download PDFInfo
- Publication number
- WO2014046355A1 WO2014046355A1 PCT/KR2013/001874 KR2013001874W WO2014046355A1 WO 2014046355 A1 WO2014046355 A1 WO 2014046355A1 KR 2013001874 W KR2013001874 W KR 2013001874W WO 2014046355 A1 WO2014046355 A1 WO 2014046355A1
- Authority
- WO
- WIPO (PCT)
- Prior art keywords
- power curve
- limit
- power
- monitoring
- wind turbine
- Prior art date
- Legal status (The legal status is an assumption and is not a legal conclusion. Google has not performed a legal analysis and makes no representation as to the accuracy of the status listed.)
- Ceased
Links
Images





Classifications
-
- F—MECHANICAL ENGINEERING; LIGHTING; HEATING; WEAPONS; BLASTING
- F03—MACHINES OR ENGINES FOR LIQUIDS; WIND, SPRING, OR WEIGHT MOTORS; PRODUCING MECHANICAL POWER OR A REACTIVE PROPULSIVE THRUST, NOT OTHERWISE PROVIDED FOR
- F03D—WIND MOTORS
- F03D7/00—Controlling wind motors
-
- F—MECHANICAL ENGINEERING; LIGHTING; HEATING; WEAPONS; BLASTING
- F03—MACHINES OR ENGINES FOR LIQUIDS; WIND, SPRING, OR WEIGHT MOTORS; PRODUCING MECHANICAL POWER OR A REACTIVE PROPULSIVE THRUST, NOT OTHERWISE PROVIDED FOR
- F03D—WIND MOTORS
- F03D17/00—Monitoring or testing of wind motors, e.g. diagnostics
-
- F—MECHANICAL ENGINEERING; LIGHTING; HEATING; WEAPONS; BLASTING
- F03—MACHINES OR ENGINES FOR LIQUIDS; WIND, SPRING, OR WEIGHT MOTORS; PRODUCING MECHANICAL POWER OR A REACTIVE PROPULSIVE THRUST, NOT OTHERWISE PROVIDED FOR
- F03D—WIND MOTORS
- F03D7/00—Controlling wind motors
- F03D7/02—Controlling wind motors the wind motors having rotation axis substantially parallel to the air flow entering the rotor
-
- F—MECHANICAL ENGINEERING; LIGHTING; HEATING; WEAPONS; BLASTING
- F03—MACHINES OR ENGINES FOR LIQUIDS; WIND, SPRING, OR WEIGHT MOTORS; PRODUCING MECHANICAL POWER OR A REACTIVE PROPULSIVE THRUST, NOT OTHERWISE PROVIDED FOR
- F03D—WIND MOTORS
- F03D7/00—Controlling wind motors
- F03D7/02—Controlling wind motors the wind motors having rotation axis substantially parallel to the air flow entering the rotor
- F03D7/022—Adjusting aerodynamic properties of the blades
- F03D7/0224—Adjusting blade pitch
-
- F—MECHANICAL ENGINEERING; LIGHTING; HEATING; WEAPONS; BLASTING
- F03—MACHINES OR ENGINES FOR LIQUIDS; WIND, SPRING, OR WEIGHT MOTORS; PRODUCING MECHANICAL POWER OR A REACTIVE PROPULSIVE THRUST, NOT OTHERWISE PROVIDED FOR
- F03D—WIND MOTORS
- F03D80/00—Details, components or accessories not provided for in groups F03D1/00 - F03D17/00
- F03D80/40—Ice detection; De-icing means
-
- F—MECHANICAL ENGINEERING; LIGHTING; HEATING; WEAPONS; BLASTING
- F03—MACHINES OR ENGINES FOR LIQUIDS; WIND, SPRING, OR WEIGHT MOTORS; PRODUCING MECHANICAL POWER OR A REACTIVE PROPULSIVE THRUST, NOT OTHERWISE PROVIDED FOR
- F03D—WIND MOTORS
- F03D9/00—Adaptations of wind motors for special use; Combinations of wind motors with apparatus driven thereby; Wind motors specially adapted for installation in particular locations
- F03D9/20—Wind motors characterised by the driven apparatus
- F03D9/25—Wind motors characterised by the driven apparatus the apparatus being an electrical generator
- F03D9/255—Wind motors characterised by the driven apparatus the apparatus being an electrical generator connected to electrical distribution networks; Arrangements therefor
- F03D9/257—Wind motors characterised by the driven apparatus the apparatus being an electrical generator connected to electrical distribution networks; Arrangements therefor the wind motor being part of a wind farm
-
- G—PHYSICS
- G06—COMPUTING OR CALCULATING; COUNTING
- G06Q—INFORMATION AND COMMUNICATION TECHNOLOGY [ICT] SPECIALLY ADAPTED FOR ADMINISTRATIVE, COMMERCIAL, FINANCIAL, MANAGERIAL OR SUPERVISORY PURPOSES; SYSTEMS OR METHODS SPECIALLY ADAPTED FOR ADMINISTRATIVE, COMMERCIAL, FINANCIAL, MANAGERIAL OR SUPERVISORY PURPOSES, NOT OTHERWISE PROVIDED FOR
- G06Q50/00—Information and communication technology [ICT] specially adapted for implementation of business processes of specific business sectors, e.g. utilities or tourism
- G06Q50/10—Services
-
- Y—GENERAL TAGGING OF NEW TECHNOLOGICAL DEVELOPMENTS; GENERAL TAGGING OF CROSS-SECTIONAL TECHNOLOGIES SPANNING OVER SEVERAL SECTIONS OF THE IPC; TECHNICAL SUBJECTS COVERED BY FORMER USPC CROSS-REFERENCE ART COLLECTIONS [XRACs] AND DIGESTS
- Y02—TECHNOLOGIES OR APPLICATIONS FOR MITIGATION OR ADAPTATION AGAINST CLIMATE CHANGE
- Y02E—REDUCTION OF GREENHOUSE GAS [GHG] EMISSIONS, RELATED TO ENERGY GENERATION, TRANSMISSION OR DISTRIBUTION
- Y02E10/00—Energy generation through renewable energy sources
- Y02E10/70—Wind energy
- Y02E10/72—Wind turbines with rotation axis in wind direction
Definitions
- the present invention relates to a method for automatically calculating a power curve limit for power curve monitoring of a wind turbine, and more particularly, fault data included in a plurality of wind speed-power data measured in a wind turbine.
- the present invention relates to a method for automatically calculating a power curve limit for power curve monitoring of a wind turbine, which excludes and automatically calculates an optimal power curve limit for power curve monitoring.
- SCADA supervisory control and data acquisition
- CMS condition monitoring system
- SCADA system for the operation of wind farms is a computer-based system that performs the control of wind turbines remotely and collects data to analyze and report the performance of wind turbines in conjunction with controllers of wind turbines. Performs Control, Monitoring, Analysis, and Reporting.
- the SCADA system Since the SCADA system was developed with a focus on the overall operation of the wind farm, the focus is on monitoring the current operating status of individual turbines. In other words, the SCADA system focuses on collecting and analyzing representative characteristic values of each component, especially temperature and pressure values, in addition to turbine operation information for monitoring each wind turbine.
- the SCADA system focuses on the monitoring of the turbine's current operating status, while the condition monitoring system (CMS) monitors, analyzes, and predicts the condition of wind turbine components more closely, thereby preventing the occurrence of wind turbine abnormalities.
- CMS condition monitoring system
- the condition monitoring system is divided into blade condition monitoring, component vibration condition monitoring, and oil condition monitoring based system according to its monitoring area, and diagnoses abnormality by using various advanced analysis techniques.
- the status monitoring system is divided into the monitoring, analysis, and reporting functions, but is different from the SCADA system in terms of monitoring area and analysis and prediction technique.
- the power curve that graphs the output of the wind turbine to the wind speed input is the official performance indicator of the wind turbine, which should be guaranteed by the turbine manufacturer, and is representative of the turbine performance in terms of the overall system of the wind turbine.
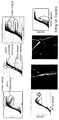
- FIG. 1 is a view showing the types of power curves according to various abnormal cases appearing in a power turbine of a general wind power generation.
- the monitoring method based on the power curve in the wind turbine condition monitoring has received the same attention as the condition monitoring system, but despite the importance, the research on the power curve monitoring technique is still active. not.
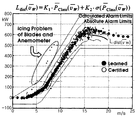
- FIG. 2 is a diagram illustrating an example of setting a power curve limit measured in ISET according to a conventional power curve monitoring technique.
- the German Institute for Solar Energy Supply Technology classifies the average value data of the output measured for 5 minutes into bins of 0.5m / s wind speed, and averages and standard values for each bin. There was a case study of setting the alarm limit by finding the deviation.
- the method proposed by the ISET is designed to increase the distance between upper and lower limits as the wind speed increases above the rated wind speed so as to be suitable for a stall-control turbine selected as an application target. It is difficult to apply to the pitch control method that is the mainstream of large wind turbines.
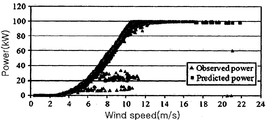
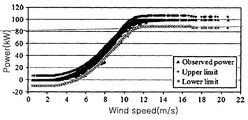
- FIGS. 3A and 3B are diagrams showing examples of setting power curve limits measured in an intelligent system lab according to a conventional power curve monitoring technique.
- representative power curve monitoring techniques include a data mining algorithm at the Intelligent Systems Lab (Professor Andrew Kusiak) of the University of Iowa. There is an example developed using Non-Parametric modeling technique.
- a common problem in applying the above-described power curve monitoring techniques is that only normal data without abnormal data should be used as input to the power curve limit setting algorithm.
- an irregular energy source such as wind power
- the present invention has been made to improve the above-mentioned problems. Even if the wind speed-power data measured in the wind turbine includes a large number of abnormal data in addition to the normal data, the power curve limit for power curve monitoring can be automatically calculated.
- the purpose of the present invention is to provide an automatic power curve limit calculation method for power curve monitoring of a wind turbine, which enables to set an optimum power curve limit.
- a method for automatically calculating a power curve limit for power curve monitoring of a wind turbine the first step of classifying the input data of wind power generation through the variable speed bin (Variable Speed Bin), power A second step of calculating a power average value and a standard deviation for each bin with respect to the classified input data; a third step of the power curve estimator estimating a power curve with respect to the calculated power average value for each bin; And a fourth step of searching for the correct power curve limit while moving the power curve, and a fifth step of setting the data included in the correct power curve limit as new input data.
- Variable Speed Bin variable speed bin
- the input data classifier is a rate-power data of the input data based on the speed bin
- Bin Width 1 / Total algorithm loop iterations in m / sec
- the power curve estimator uses the calculated average value of the power of each bin as an input of interpolation, and estimates the power curve using the interpolation method, wherein the interpolation method is a cubic B-spline Spline) interpolation method.
- the limit search unit searches for the correct power curve limit while moving the power curve left / right and up / down.
- the limit search unit uses the power curve
- the limit search unit uses the power curve
- the data determining unit receives the standard deviation value of the power for each bin calculated by the power calculating unit and calculates an average value, and the data determining unit calculates the average value of the calculated standard deviation and the previous algorithm loop. Comparing the average value of the previous standard deviations to determine whether the change amount of the average value is smaller than the end determination constant of the power curve limit calculation algorithm, and if the change amount of the average value is smaller than the end determination constant of the power curve limit calculation algorithm, If it is determined that the correct power curve limit has been calculated, the execution of the entire algorithm loop is terminated, and if the change amount of the average value is greater than the end determination constant of the power curve calculation algorithm, the new input data set in the fifth step is used. Half the entire algorithm loop from step 1 from step 1 And the step further comprises.
- the power curve monitoring technique can be easily applied to the field by automatically calculating the power curve limit by using the optimum limit search function through the estimation and the movement of the power curve. When it occurs, it can be quickly recognized and countermeasured to maximize the operational efficiency, reliability and economic efficiency of the wind farm.
- the automatic power curve limit calculation algorithm according to the present invention can be utilized as a core monitoring algorithm of the SCADA system or condition monitoring system (CMS) for the operation and maintenance of wind farms.
- CMS condition monitoring system
- FIG. 1 is a view showing the type of power curve according to various abnormal cases appearing in a typical wind turbine, respectively.
- FIG. 2 is a diagram illustrating an example of setting a power curve limit measured in ISET according to a conventional power curve monitoring technique.
- 3A and 3B are diagrams showing examples of setting power curve limits measured in an intelligent system laboratory according to a conventional power curve monitoring technique.
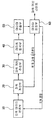
- FIG. 4 is a diagram illustrating an apparatus configuration for implementing a method for automatically calculating a power curve limit for power curve monitoring of a wind turbine according to an embodiment of the present invention.
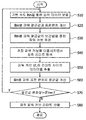
- FIG. 5 is a flowchart illustrating an operation of a method for automatically calculating a power curve limit for power curve monitoring of a wind turbine according to an embodiment of the present invention.
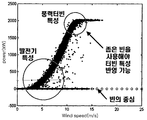
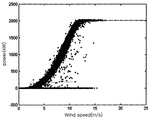
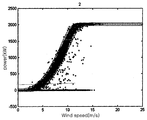
- FIG. 6 is a graph showing the output characteristics of the wind turbine according to the wind speed as input data of the wind power generation in the automatic power curve limit calculation method for monitoring the power curve of the wind turbine according to an embodiment of the present invention.
- FIG. 7 is a graph illustrating an average calculated value of power for each bin classified for input data in a power curve limit automatic calculation method for power curve monitoring of a wind turbine according to an embodiment of the present invention.
- FIG. 8 is a graph illustrating a state of estimating a power curve by using interpolation in an automatic power curve limit calculation method for power curve monitoring of a wind turbine according to an embodiment of the present invention.
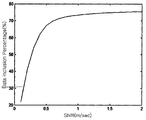
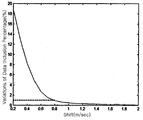
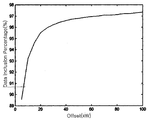
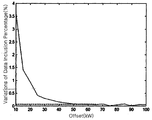
- 9A and 9B illustrate a percentage and a change amount of data existing in upper / lower power curve limits for each left / right moving distance in a method for automatically calculating power curve limits for power curve monitoring of a wind turbine according to an embodiment of the present invention. It is a graph figure respectively.
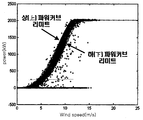
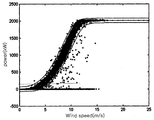
- FIG. 10 is a graph illustrating an optimum upper / lower power curve limit obtained by searching for left / right movement of a power curve in a method for automatically calculating power curve limits for power curve monitoring of a wind turbine according to an embodiment of the present invention. .
- 11A and 11B illustrate the percentage and change amount of data existing in the upper / lower power curve limit for each up / down moving distance in the automatic power curve limit calculation method for power curve monitoring of a wind turbine according to an embodiment of the present invention. It is a graph figure respectively.
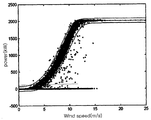
- FIG. 12 is a graph showing the optimum upper / lower power curve limit obtained through the up / down movement search of the power curve limit in the power curve limit automatic calculation method for monitoring the power curve of the wind turbine according to an embodiment of the present invention Drawing.
- FIG. 13 is a graph illustrating newly selected input data according to an automatic calculation algorithm of a power curve limit in a method of automatically calculating a power curve limit for power curve monitoring of a wind turbine according to an embodiment of the present invention.
- 14A to 14D are graphs each showing an example of an operation according to the number of loops of an automatic calculation algorithm of a power curve limit in a method of automatically calculating a power curve limit for power curve monitoring of a wind turbine according to an embodiment of the present invention.
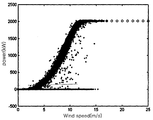
- FIG. 15 is a graph illustrating a state of input data including a plurality of abnormal data in a method for automatically calculating a power curve limit for power curve monitoring of a wind turbine according to an embodiment of the present invention.
- 16A to 16E are calculated according to the number of loops of the automatic calculation algorithm of the power curve limit by applying the input data of FIG. 15 in the method for automatically calculating the power curve limit for power curve monitoring of a wind turbine according to an embodiment of the present invention. It is a graph drawing which showed each embodiment.
- FIG. 4 is a diagram illustrating an apparatus configuration for implementing a method for automatically calculating a power curve limit for power curve monitoring of a wind turbine according to an embodiment of the present invention.
- an apparatus for implementing a method for automatically calculating a power curve limit for power curve monitoring of a wind turbine includes an input data classifier 10, a power calculator 20, and a power source. And a curve estimating unit 30, a limit search unit 40, a data extracting unit 50, and a data determining unit 60.
- the input data classifying unit 10 classifies each input data input according to wind power using a variable speed bin, which calculates an average value and standard deviation of power for each bin. For classifying the measured velocity-power data using specific measurement means.
- the power calculator 20 calculates and calculates an average value and a standard deviation of input data of power for each bin classified by the input data classifier 10, and the average value is then estimated by a power curve through interpolation. The standard deviation value is then used to determine whether to terminate the entire algorithm loop.
- the power curve estimator 30 is for estimating a power curve by using an interpolation method by receiving an average value of input data for each bin calculated by the power calculator 20.
- the limit search unit 40 is to exclude the fault data included in the input data while moving the power curve estimated through the power curve estimator 30 to the left / right and up / down, respectively. .
- the data extractor 50 extracts data within the power curve limit from which abnormal data is excluded through power curve left / right and up / down movement search of the limit search unit 40 as new input data.
- the data determination unit 60 obtains an average value of standard deviation values of power for each bin calculated by the power calculation unit 20, targeting new input data extracted through the data extraction unit 50. It is to determine whether to terminate the entire algorithm loop or to repeat the entire algorithm loop by comparing with the average value of the standard deviation calculated in the previous algorithm loop.
- FIG. 5 is a flowchart illustrating an operation of a method for automatically calculating a power curve limit for power curve monitoring of a wind turbine according to an embodiment of the present invention.
- the input data classifying unit 10 classifies the input data measured through specific measuring means according to the wind power generation through the variable speed bin (S10).
- FIG. 6 is a graph showing the output characteristics of the wind turbine according to the wind speed as input data of the wind power generation in the automatic power curve limit calculation method for monitoring the power curve of the wind turbine according to an embodiment of the present invention.
- the input data classifying unit 10 is configured to prepare the calculation of the average value and standard deviation of the power for each bin for input data classification, and the speed bin with respect to the measured speed-power data.
- the width of the velocity bin is determined according to Equation 1 below.
- the first width starts at 1 m / sec and then repeats 1/2 m / sec, 1/3 m / sec as the loop of the entire algorithm is repeated. Gradually, the bin becomes narrower.
- variable speed bins The reason for using variable speed bins is that first, since a large amount of abnormal data may be included in the input data at first, a wider bin is used to reduce the influence of the abnormal data as much as possible.
- Fig. 6 at low wind speed, the characteristics of the generator dominates the characteristics of the whole system, but the output increases slowly.However, from the vicinity of the rated wind speed, the characteristics of the wind turbine by the pitch control dominate the overall system characteristics. Adjusted. Therefore, in order to reflect the characteristics of such a wind turbine control, it is necessary to use a narrower bin.
- the power calculation unit 20 calculates an average value and a standard deviation for the input data of the classified bin powers, respectively (S20), in which the average values of the bin powers are then added to the power curve weight. It is used as an input value of power curve estimation through interpolation in the government unit 30, and is used for determining whether the standard deviation values of the vacant powers are to be terminated in the data determination unit 60 later.
- FIG. 7 is a graph illustrating an average calculated value of power for each bin classified for input data in a power curve limit automatic calculation method for power curve monitoring of a wind turbine according to an embodiment of the present invention.
- the power calculator 20 calculates an average value of input data of power for each bin classified through the input data classifier 10, and thus the average value is displayed at the center of the bin. It can be seen that.
- the power curve estimator 30 inputs an average value of the power of each bin calculated by the power calculator 20 as a third process and estimates the power curve by using interpolation (S30).
- FIG. 8 is a graph illustrating a state of estimating a power curve by using interpolation in an automatic power curve limit calculation method for power curve monitoring of a wind turbine according to an embodiment of the present invention.
- the power curve estimator 30 shows a state of estimating power curves by using a cubic B-spline interpolation method having excellent performance among interpolation methods.
- the third-order B-spline interpolation method is applied as an interpolation method for estimating a power curve, but the present invention is not limited thereto, and various interpolation methods currently disclosed can be applied.
- the limit search unit 40 is the fourth process to move the estimated power curve to the left / right and up / down, respectively, and to exclude the ideal data as much as possible so as to include only the normal data as much as possible.
- Search for the power curve limit (S40) That is, by excluding the abnormal data as much as possible from the existing input data, only the normal data is selected as new input data of the algorithm loop afterwards.
- FIG. 10 is a graph showing each, and FIG. 10 is an optimum upper / lower power curve obtained by searching for left / right movement of a power curve in a power curve limit automatic calculation method for monitoring a power curve of a wind turbine according to an embodiment of the present invention. It is a graph drawing showing a limit.
- the limit search unit 40 moves the power curves obtained through the estimation function to the left and right, respectively, and includes the best upper and lower optimal data.
- the power curve limit is searched.
- the upper and lower power curve limits indicate power curve limits which will be positioned above and below the estimated power curve, respectively.
- the limit search unit 40 determines whether the optimum upper and lower power curve limit is determined by whether or not to satisfy the inequality, such as the following equation (2), when the inequality of the equation (2) Repeatedly move the power curve left / right by ⁇ V.
- the inequality such as the following equation (2)
- 0.1 m / sec was used as ⁇ V.
- FIG. 11A and 11B illustrate the percentage of data existing in the upper / lower power curve limit for each up / down moving distance in the automatic power curve limit calculation method for power curve monitoring of a wind turbine according to an embodiment of the present invention.
- Figure 12 is a graph showing the amount of change, respectively,
- Figure 12 is an optimal image obtained through the up / down movement search of the power curve limit in the automatic calculation of the power curve limit for power curve monitoring of the wind turbine according to an embodiment of the present invention It is a graph which shows the / low power curve limit.
- the limit search unit 40 moves the upper and lower power curve limits obtained in FIG. 10 up and down, respectively, and includes only the best upper and lower normal data as much as possible. Search for the lower power curve limit.
- the limit search unit 40 determines whether or not the optimum upper and lower power curve limit is obtained at this stage by whether the inequality of Equation 4 below is satisfied, and Equation 4 below.
- the power curve is repeatedly moved up and down by ⁇ P until the inequality is satisfied. In FIG. 12, 5 kW was used as ⁇ P.
- i represents the number of iterations of the limit search algorithm
- PDL is defined in the same manner as in Equation 3
- ⁇ offset has been determined to determine the optimum upper and lower power curve limit at this stage.
- 0.05% was used in FIGS. 11A, 11B, and 12 below.
- the left / right movement search for the power curve limit is first performed, and then the up / down movement search is subsequently performed, but the order is not limited, the reverse order is optimal It is also possible to search for upper and lower power curve limits.
- the data extracting unit 50 uses only the data existing in the upper and lower power curve limits as the new input data for the upper and lower power curve limits set to exclude the abnormal data from the input data. It is extracted (S50).
- FIG. 13 is a graph illustrating newly selected input data according to an automatic calculation algorithm of a power curve limit in a method of automatically calculating a power curve limit for power curve monitoring of a wind turbine according to an embodiment of the present invention.
- the data determination unit 60 is a process for determining the end of the entire algorithm loop for the input data newly extracted from the data extraction unit 50, the empty stars calculated by the power calculation unit 20
- the average value of the standard deviation is calculated by receiving the standard deviation value of the power (S60).
- the data determination unit 60 After calculating the average value of the standard deviation, the data determination unit 60 compares the average value of the standard deviation currently calculated with the average value of the previous standard deviation calculated in the previous algorithm loop, and the change amount of the average value is a power curve. It is determined whether or not it is larger than "a loop " which is an end determination constant of the calculation algorithm (S80).
- k (k>1) represents the number of iterations of the entire algorithm loop
- a loop is a constant for determining whether to end the entire algorithm loop for automatic calculation of the power curve limit. 1 was used.
- the limit search unit 40 searches. While calculating the upper and lower power curve limits obtained through the optimal (that is, accurate) power curve limits, the entire algorithm loop is terminated (S80).
- the data extraction unit Using the new input data extracted in step 50), the entire algorithm loop is performed again by starting again from the process of classifying the input data through the variable speed bin in the step S10.
- 14a to 14d are graphs each showing an exemplary embodiment according to the number of loops of an automatic calculation algorithm of the power curve limit in the method of automatically calculating the power curve limit for power curve monitoring of a wind turbine according to an embodiment of the present invention. Drawing.
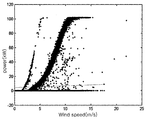
- FIG. 15 is a graph illustrating a state of input data including a plurality of abnormal data in a method for automatically calculating a power curve limit for power curve monitoring of a wind turbine according to an embodiment of the present invention
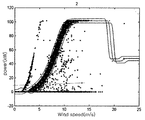
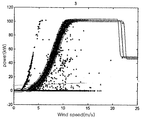
- FIGS. 16A to 16E illustrate In the method for automatically calculating the power curve limit for power curve monitoring of a wind turbine according to an embodiment of the present invention, a graph showing an exemplary embodiment calculated according to the number of loops of the automatic calculation algorithm of the power curve limit by applying the input data of FIG. 15. Drawing.
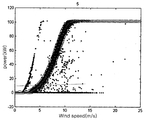
- the data shown in FIG. 15 illustrates input data of another MW wind turbine, and it can be observed that a large number of abnormal data are included in comparison with the input data shown in FIG. 6.
- the algorithm is terminated when the entire algorithm loop is repeated five times as a result of the application of the algorithm according to the present invention to the input data of FIG. You can see that it calculates the power curve limit.
Landscapes
- Engineering & Computer Science (AREA)
- Combustion & Propulsion (AREA)
- Life Sciences & Earth Sciences (AREA)
- General Engineering & Computer Science (AREA)
- Mechanical Engineering (AREA)
- Chemical & Material Sciences (AREA)
- Sustainable Energy (AREA)
- Sustainable Development (AREA)
- Business, Economics & Management (AREA)
- Tourism & Hospitality (AREA)
- Physics & Mathematics (AREA)
- Marketing (AREA)
- General Physics & Mathematics (AREA)
- Strategic Management (AREA)
- General Business, Economics & Management (AREA)
- Theoretical Computer Science (AREA)
- Primary Health Care (AREA)
- Health & Medical Sciences (AREA)
- Human Resources & Organizations (AREA)
- General Health & Medical Sciences (AREA)
- Economics (AREA)
- Fluid Mechanics (AREA)
- Power Engineering (AREA)
- Wind Motors (AREA)
Abstract
Description


Claims (9)
- 입력 데이터 분류부가 가변 속도 빈(Variable Speed Bin)을 통해 풍력발전의 입력 데이터를 분류하는 제1단계;파워 계산부가 상기 분류된 입력 데이터에 대해 빈 별로 파워 평균값과 표준편차를 계산하는 제2단계;파워커브 추정부가 상기 계산된 빈 별 파워 평균값에 대한 파워 커브를 추정하는 제3단계;리미트 탐색부가 상기 추정된 파워 커브를 이동시키면서 정확한 파워 커브 리미트를 탐색하는 제4단계; 및데이터 추출부가 상기 정확한 파워커브 리미트 내에 포함된 데이터를 신규의 입력 데이터로 설정하는 제5단계를 포함하는 것을 특징으로 하는 풍력터빈의 파워커브 모니터링을 위한 파워커브 리미트 자동 산출 방법.
- 제 1 항에 있어서,상기 제1단계에서, 상기 입력 데이터 분류부는 상기 입력 데이터의 속도-파워 데이터를 속도 빈을 기준으로,빈 폭(Bin Width) = 1 / 전체 알고리즘 루프 반복 횟수 (단위 : m/sec)(단, 상기 "전체 알고리즘 반복 횟수"는 상기 제1단계로부터 제5단계의 알고리즘 루프에 대한 수행 횟수에 해당됨)와 같이 속도 빈의 폭에 따라 결정하는 것을 특징으로 하는 풍력터빈의 파워커브 모니터링을 위한 파워커브 리미트 자동 산출 방법.
- 제 1 항에 있어서,상기 제3단계에서, 상기 파워커브 추정부는 상기 계산된 빈 별 파워의 평균값을 보간법의 입력으로 사용하고, 상기 보간법을 이용하여 파워커브를 추정하는 것을 특징으로 하는 풍력터빈의 파워커브 모니터링을 위한 파워커브 리미트 자동 산출 방법.
- 제 3 항에 있어서,상기 제3단계에서, 상기 보간법은 3차 B-스플라인(Cubic B-Spline) 보간법인 것을 특징으로 하는 풍력터빈의 파워커브 모니터링을 위한 파워커브 리미트 자동 산출 방법.
- 제 1 항에 있어서,상기 제4단계에서, 상기 리미트 탐색부는 상기 파워커브를 좌/우 및 상/하로 이동시키면서 정확한 파워커브 리미트를 탐색하는 것을 특징으로 하는 풍력터빈의 파워커브 모니터링을 위한 파워커브 리미트 자동 산출 방법.
- 제 5 항에 있어서,상기 제4단계에서, 상기 리미트 탐색부는 상기 파워 커브를,
 (단, 상기 "i"는 리미트 탐색 알고리즘의 반복 횟수이고, 상기 "βshift"는 현 단계에서 최적의 상, 하 파워커브 리미트를 결정했는지 여부를 판단하는 상수이며, 상기 "PDL"의 단위는 %로 정의됨)의 부등식이 만족할때까지 반복적으로 ΔV만큼 좌/우로 이동시키는 것을 특징으로 하는 풍력터빈의 파워커브 모니터링을 위한 파워커브 리미트 자동 산출 방법.
 - 제 5 항에 있어서,상기 제4단계에서, 상기 리미트 탐색부는 상기 파워 커브를,
 (단, 상기 "i"는 리미트 탐색 알고리즘의 반복 횟수이고, 상기 "PDL"의 단위는 %로 정의되며, 상기 "γoffset"은 정확한 상, 하 파워커브 리미트를 결정했는지의 여부를 판단하는 상수에 해당됨)의 부등식이 만족할때까지 반복적으로 ΔP만큼 상/하로 이동시키는 것을 특징으로 하는 풍력터빈의 파워커브 모니터링을 위한 파워커브 리미트 자동 산출 방법.
 - 제 6 항 또는 제 7 항에 있어서,상기 제4단계에서, 상기 "PDL"은,
 와 같이 정의되는 것을 특징으로 하는 풍력터빈의 파워커브 모니터링을 위한 파워커브 리미트 자동 산출 방법.
 - 제 1 항에 있어서,상기 제5단계 이후에, 데이터 판정부가 상기 파워 계산부에서 계산된 빈 별 파워의 표준편차 값을 입력받아 평균값을 계산하는 단계,상기 데이터 판정부가 상기 계산된 표준편차의 평균값과 이전 알고리즘 루프에서 계산된 이전 표준편차의 평균값을 비교하여, 상기 평균값의 변화량이 파워 커브 산출 알고리즘의 종료 판단 상수보다 작은 지를 판단하는 단계 및,상기 평균값의 변화량이 파워 커브 산출 알고리즘의 종료 판단 상수보다 작으면, 정확한 파워커브 리미트를 산출한 것으로 판단하여 전체 알고리즘 루프의 실행을 종료하고, 상기 평균값의 변화량이 파워 커브 산출 알고리즘의 종료 판단 상수보다 크면, 상기 제 5단계에서 설정된 신규의 입력 데이터를 이용하여 상기 제1단계로부터 상기 제5단계의 전체 알고리즘 루프를 반복하는 단계를 더 포함하는 것을 특징으로 하는 풍력터빈의 파워커브 모니터링을 위한 파워커브 리미트 자동 산출 방법.
Priority Applications (3)
| Application Number | Priority Date | Filing Date | Title |
|---|---|---|---|
| DE112013004526.5T DE112013004526T5 (de) | 2012-09-18 | 2013-03-08 | Verfahren zum automatischen berechnen der Leistungskurvenbegrenzung zur Leistungskurvenüberwachung einer Windturbine |
| US14/418,922 US9664176B2 (en) | 2012-09-18 | 2013-03-08 | Method of automatically calculating power curve limit for power curve monitoring of wind turbine |
| CN201380040504.XA CN104520581B (zh) | 2012-09-18 | 2013-03-08 | 自动计算用于风力涡轮机的功率曲线监测的功率曲线界限的方法 |
Applications Claiming Priority (2)
| Application Number | Priority Date | Filing Date | Title |
|---|---|---|---|
| KR1020120103396A KR101425016B1 (ko) | 2012-09-18 | 2012-09-18 | 풍력터빈의 파워커브 모니터링을 위한 파워커브 리미트 자동 산출 방법 |
| KR10-2012-0103396 | 2012-09-18 |
Publications (1)
| Publication Number | Publication Date |
|---|---|
| WO2014046355A1 true WO2014046355A1 (ko) | 2014-03-27 |
Family
ID=50341630
Family Applications (1)
| Application Number | Title | Priority Date | Filing Date |
|---|---|---|---|
| PCT/KR2013/001874 Ceased WO2014046355A1 (ko) | 2012-09-18 | 2013-03-08 | 풍력터빈의 파워커브 모니터링을 위한 파워커브 리미트 자동 산출 방법 |
Country Status (5)
| Country | Link |
|---|---|
| US (1) | US9664176B2 (ko) |
| KR (1) | KR101425016B1 (ko) |
| CN (1) | CN104520581B (ko) |
| DE (1) | DE112013004526T5 (ko) |
| WO (1) | WO2014046355A1 (ko) |
Cited By (4)
| Publication number | Priority date | Publication date | Assignee | Title |
|---|---|---|---|---|
| US10487804B2 (en) | 2015-03-11 | 2019-11-26 | General Electric Company | Systems and methods for validating wind farm performance improvements |
| CN110892151A (zh) * | 2017-06-07 | 2020-03-17 | 维斯塔斯风力系统集团公司 | 风力涡轮机可用电力的自适应估计 |
| CN112032003A (zh) * | 2020-09-01 | 2020-12-04 | 浙江运达风电股份有限公司 | 一种大型风电机组运行性能监测方法 |
| CN114033631A (zh) * | 2021-11-08 | 2022-02-11 | 浙江运达风电股份有限公司 | 一种风电机组风能利用系数在线辨识方法 |
Families Citing this family (16)
| Publication number | Priority date | Publication date | Assignee | Title |
|---|---|---|---|---|
| CN105134484A (zh) * | 2015-07-28 | 2015-12-09 | 国家电网公司 | 风电功率异常数据点的识别方法 |
| EP3464891B1 (en) | 2016-06-07 | 2022-01-19 | Vestas Wind Systems A/S | Adaptive control of a wind turbine by detecting a change in performance |
| US11220996B2 (en) | 2016-06-30 | 2022-01-11 | Vestas Wind Systems A/S | Control method for a wind turbine |
| US10644511B2 (en) * | 2017-11-06 | 2020-05-05 | Caterpillar Inc. | Multi-engine optimizer zone strategy |
| CN110334310B (zh) * | 2019-07-01 | 2023-04-07 | 北京源清慧虹信息科技有限公司 | 一种风机功率曲线的确定方法及确定装置 |
| CN113007019B (zh) * | 2019-12-19 | 2022-10-18 | 新疆金风科技股份有限公司 | 控制器、控制系统以及风力发电机组 |
| US11378063B2 (en) * | 2020-02-21 | 2022-07-05 | General Electric Company | System and method for detecting turbine underperformance and operation anomaly |
| CN112065668A (zh) * | 2020-09-08 | 2020-12-11 | 沈阳工业大学 | 一种风电机组状态异常评估方法及系统 |
| CN112267972B (zh) * | 2020-10-22 | 2023-05-05 | 华能国际电力股份有限公司 | 一种风电机组功率曲线异常智能判定方法 |
| CN112598539B (zh) * | 2020-12-28 | 2024-01-30 | 徐工汉云技术股份有限公司 | 一种风力发电机组风功率曲线优化计算及异常值检测方法 |
| CN112819288B (zh) * | 2021-01-08 | 2023-04-07 | 西安热工研究院有限公司 | 一种计算热电联产机组供热煤耗和供电煤耗的方法 |
| CN112784215B (zh) * | 2021-01-21 | 2022-04-15 | 中国三峡新能源(集团)股份有限公司 | 基于实时功率遥测量的风电场理论发电量计算方法 |
| US12435700B2 (en) * | 2021-12-14 | 2025-10-07 | City University Of Hong Kong | Wind turbine performance determination and control |
| CN114971313A (zh) * | 2022-05-31 | 2022-08-30 | 西安热工研究院有限公司 | 一种风电机组功率曲线拟合方法 |
| KR102674314B1 (ko) * | 2022-08-04 | 2024-06-11 | 한국전력공사 | 풍력 발전 단지 단기 이벤트 검출 장치 및 그 방법 |
| CN115945570A (zh) * | 2023-01-06 | 2023-04-11 | 上汽通用五菱汽车股份有限公司 | 一种自动判断冲压零件成形质量的方法及系统 |
Citations (3)
| Publication number | Priority date | Publication date | Assignee | Title |
|---|---|---|---|---|
| US20090033313A1 (en) * | 2007-08-02 | 2009-02-05 | Nordex Energy Gmbh | Method and apparatus for determining a characteristic curve for an electric variable of a wind energy plant |
| US20090299780A1 (en) * | 2008-05-29 | 2009-12-03 | Abhinanda Sarkar | Method and apparatus for determining and/or providing power output information of wind turbine farms |
| KR20120095710A (ko) * | 2011-02-21 | 2012-08-29 | 삼성중공업 주식회사 | 풍력발전기의 나셀 풍속 보정 시스템 및 그 방법 |
Family Cites Families (12)
| Publication number | Priority date | Publication date | Assignee | Title |
|---|---|---|---|---|
| US4525633A (en) * | 1982-09-28 | 1985-06-25 | Grumman Aerospace Corporation | Wind turbine maximum power tracking device |
| US6600240B2 (en) * | 1997-08-08 | 2003-07-29 | General Electric Company | Variable speed wind turbine generator |
| DE10357292B4 (de) * | 2003-12-05 | 2006-02-02 | Voith Turbo Gmbh & Co. Kg | Verfahren für die Steuerung eines Antriebsstrangs für eine Strömungskraftmaschine mit Drehzahlführung, Kraftstoßreduktion und Kurzzeitenergiespeicherung |
| US7228235B2 (en) * | 2005-02-01 | 2007-06-05 | Windlogics, Inc. | System and method for enhanced measure-correlate-predict for a wind farm location |
| US7420289B2 (en) | 2006-12-06 | 2008-09-02 | General Electric Company | Method for predicting a power curve for a wind turbine |
| US7823437B2 (en) * | 2007-06-18 | 2010-11-02 | General Electric Company | Anemometer calibration method and wind turbine |
| KR20100031897A (ko) | 2008-09-16 | 2010-03-25 | 두원공과대학산학협력단 | 풍력발전기의 모니터링 장치 |
| US8441138B2 (en) * | 2009-05-07 | 2013-05-14 | Vestas Wind Systems A/S | Wind turbine |
| DK2444659T3 (en) * | 2010-10-19 | 2016-10-03 | Siemens Ag | A method and system for adjusting an output parameter of a wind turbine |
| US20120104753A1 (en) * | 2010-10-29 | 2012-05-03 | Mitsubishi Heavy Industries, Ltd. | Control system of wind power generator, wind farm, and method for controlling wind power generator |
| DE102011101897A1 (de) * | 2011-05-18 | 2012-11-22 | Nordex Energy Gmbh | Verfahren zum Betreiben einer Windenergieanlage |
| US8258643B2 (en) * | 2011-10-11 | 2012-09-04 | General Electric Company | Method and system for control of wind turbines |
-
2012
- 2012-09-18 KR KR1020120103396A patent/KR101425016B1/ko active Active
-
2013
- 2013-03-08 WO PCT/KR2013/001874 patent/WO2014046355A1/ko not_active Ceased
- 2013-03-08 US US14/418,922 patent/US9664176B2/en active Active
- 2013-03-08 DE DE112013004526.5T patent/DE112013004526T5/de active Pending
- 2013-03-08 CN CN201380040504.XA patent/CN104520581B/zh active Active
Patent Citations (3)
| Publication number | Priority date | Publication date | Assignee | Title |
|---|---|---|---|---|
| US20090033313A1 (en) * | 2007-08-02 | 2009-02-05 | Nordex Energy Gmbh | Method and apparatus for determining a characteristic curve for an electric variable of a wind energy plant |
| US20090299780A1 (en) * | 2008-05-29 | 2009-12-03 | Abhinanda Sarkar | Method and apparatus for determining and/or providing power output information of wind turbine farms |
| KR20120095710A (ko) * | 2011-02-21 | 2012-08-29 | 삼성중공업 주식회사 | 풍력발전기의 나셀 풍속 보정 시스템 및 그 방법 |
Non-Patent Citations (2)
| Title |
|---|
| KUSIAK, ANDREW ET AL.: "Models for monitoring wind farm power", RENEWABLE ENERGY, vol. 34, no. 3, 2009, pages 583 - 590 * |
| VERMA, ANOOP PRAKASH: "Performance monitoring of wind turbines : a data- mining approach", DISSERTATION, July 2012 (2012-07-01), UNIVERSITY OF IOWA, pages 139 - 166 * |
Cited By (6)
| Publication number | Priority date | Publication date | Assignee | Title |
|---|---|---|---|---|
| US10487804B2 (en) | 2015-03-11 | 2019-11-26 | General Electric Company | Systems and methods for validating wind farm performance improvements |
| CN110892151A (zh) * | 2017-06-07 | 2020-03-17 | 维斯塔斯风力系统集团公司 | 风力涡轮机可用电力的自适应估计 |
| US11365718B2 (en) | 2017-06-07 | 2022-06-21 | Vestas Wind Systems A/S | Adaptive estimation of available power for wind turbine |
| CN112032003A (zh) * | 2020-09-01 | 2020-12-04 | 浙江运达风电股份有限公司 | 一种大型风电机组运行性能监测方法 |
| CN112032003B (zh) * | 2020-09-01 | 2021-08-17 | 浙江运达风电股份有限公司 | 一种大型风电机组运行性能监测方法 |
| CN114033631A (zh) * | 2021-11-08 | 2022-02-11 | 浙江运达风电股份有限公司 | 一种风电机组风能利用系数在线辨识方法 |
Also Published As
| Publication number | Publication date |
|---|---|
| US9664176B2 (en) | 2017-05-30 |
| US20150198144A1 (en) | 2015-07-16 |
| CN104520581A (zh) | 2015-04-15 |
| DE112013004526T5 (de) | 2015-06-18 |
| KR101425016B1 (ko) | 2014-08-01 |
| KR20140036813A (ko) | 2014-03-26 |
| CN104520581B (zh) | 2017-12-15 |
Similar Documents
| Publication | Publication Date | Title |
|---|---|---|
| WO2014046355A1 (ko) | 풍력터빈의 파워커브 모니터링을 위한 파워커브 리미트 자동 산출 방법 | |
| WO2017191872A1 (ko) | 플랜트 이상 감지 방법 및 시스템 | |
| CN119210337A (zh) | 光伏电站智能监测与故障诊断系统及方法 | |
| CN116753114B (zh) | 一种基于大数据的风电场数据管控方法及系统 | |
| KR20160073945A (ko) | 풍력플랜트 관리 시스템 및 그 방법 | |
| KR102618658B1 (ko) | 에너지 하베스팅을 이용한 수배전반 시스템 및 방법 | |
| KR20160017681A (ko) | 풍력플랜트 관리 시스템 및 그 방법 | |
| CN102721924A (zh) | 风力发电机组的故障预警方法 | |
| WO2022203294A1 (en) | Prediction method and systems of wind turbine load and life-time based on vibration data | |
| CN110067708B (zh) | 一种使用功率曲线识别偏航对风不正的方法 | |
| CN117149498B (zh) | 一种电厂故障诊断方法及系统 | |
| WO2022222507A1 (zh) | 一种mlpe光伏系统及其mlpe设备检测方法 | |
| Dong et al. | Fault diagnosis and classification in photovoltaic systems using scada data | |
| Punitha | IoT‐Powered Robust Anomaly Detection and CNN‐Enabled Predictive Maintenance to Enhance Solar PV System Performance | |
| CN117154945A (zh) | 基于云计算技术的变配电站智能监测方法 | |
| US11339763B2 (en) | Method for windmill farm monitoring | |
| CN107505511A (zh) | 直流支撑电容的生命周期预测方法、装置及系统 | |
| CN119146017B (zh) | 一种风力发电机组故障诊断系统 | |
| Sun et al. | Wind turbine anomaly detection using normal behavior models based on SCADA data | |
| CN118365315B (zh) | 基于多源数据分析的配电房故障运维管理方法 | |
| CN120106812A (zh) | 一种基于无线通信的ai服务器远程售后维保服务系统 | |
| CN118071327B (zh) | 一种光伏电站汇流监测的智慧电气运维系统 | |
| CN117596758B (zh) | 新能源智慧工厂ba自控系统的故障诊断方法及系统 | |
| Szabo et al. | Condition monitoring for detecting the malfunction of industrial machines | |
| CN119167098A (zh) | 一种水轮发电机组的智能远程监控方法与系统 |
Legal Events
| Date | Code | Title | Description |
|---|---|---|---|
| 121 | Ep: the epo has been informed by wipo that ep was designated in this application |
Ref document number: 13838868 Country of ref document: EP Kind code of ref document: A1 |
|
| WWE | Wipo information: entry into national phase |
Ref document number: 14418922 Country of ref document: US |
|
| WWE | Wipo information: entry into national phase |
Ref document number: 1120130045265 Country of ref document: DE Ref document number: 112013004526 Country of ref document: DE |
|
| 32PN | Ep: public notification in the ep bulletin as address of the adressee cannot be established |
Free format text: NOTING OF LOSS OF RIGHTS PURSUANT TO RULE 112(1) EPC (EPO FORM 1205N DATED 15/07/2015) |
|
| 122 | Ep: pct application non-entry in european phase |
Ref document number: 13838868 Country of ref document: EP Kind code of ref document: A1 |