WO2014010519A1 - 色度測定条件算出方法、色度測定方法、色度測定条件算出装置及び色度測定装置 - Google Patents
色度測定条件算出方法、色度測定方法、色度測定条件算出装置及び色度測定装置 Download PDFInfo
- Publication number
- WO2014010519A1 WO2014010519A1 PCT/JP2013/068469 JP2013068469W WO2014010519A1 WO 2014010519 A1 WO2014010519 A1 WO 2014010519A1 JP 2013068469 W JP2013068469 W JP 2013068469W WO 2014010519 A1 WO2014010519 A1 WO 2014010519A1
- Authority
- WO
- WIPO (PCT)
- Prior art keywords
- measurement
- chromaticity
- dot width
- area
- error
- Prior art date
- Legal status (The legal status is an assumption and is not a legal conclusion. Google has not performed a legal analysis and makes no representation as to the accuracy of the status listed.)
- Ceased
Links
Images










Classifications
-
- H—ELECTRICITY
- H04—ELECTRIC COMMUNICATION TECHNIQUE
- H04N—PICTORIAL COMMUNICATION, e.g. TELEVISION
- H04N17/00—Diagnosis, testing or measuring for television systems or their details
- H04N17/02—Diagnosis, testing or measuring for television systems or their details for colour television signals
-
- G—PHYSICS
- G09—EDUCATION; CRYPTOGRAPHY; DISPLAY; ADVERTISING; SEALS
- G09G—ARRANGEMENTS OR CIRCUITS FOR CONTROL OF INDICATING DEVICES USING STATIC MEANS TO PRESENT VARIABLE INFORMATION
- G09G3/00—Control arrangements or circuits, of interest only in connection with visual indicators other than cathode-ray tubes
- G09G3/006—Electronic inspection or testing of displays and display drivers, e.g. of LED or LCD displays
-
- G—PHYSICS
- G09—EDUCATION; CRYPTOGRAPHY; DISPLAY; ADVERTISING; SEALS
- G09G—ARRANGEMENTS OR CIRCUITS FOR CONTROL OF INDICATING DEVICES USING STATIC MEANS TO PRESENT VARIABLE INFORMATION
- G09G3/00—Control arrangements or circuits, of interest only in connection with visual indicators other than cathode-ray tubes
- G09G3/20—Control arrangements or circuits, of interest only in connection with visual indicators other than cathode-ray tubes for presentation of an assembly of a number of characters, e.g. a page, by composing the assembly by combination of individual elements arranged in a matrix no fixed position being assigned to or needed to be assigned to the individual characters or partial characters
- G09G3/34—Control arrangements or circuits, of interest only in connection with visual indicators other than cathode-ray tubes for presentation of an assembly of a number of characters, e.g. a page, by composing the assembly by combination of individual elements arranged in a matrix no fixed position being assigned to or needed to be assigned to the individual characters or partial characters by control of light from an independent source
- G09G3/36—Control arrangements or circuits, of interest only in connection with visual indicators other than cathode-ray tubes for presentation of an assembly of a number of characters, e.g. a page, by composing the assembly by combination of individual elements arranged in a matrix no fixed position being assigned to or needed to be assigned to the individual characters or partial characters by control of light from an independent source using liquid crystals
- G09G3/3607—Control arrangements or circuits, of interest only in connection with visual indicators other than cathode-ray tubes for presentation of an assembly of a number of characters, e.g. a page, by composing the assembly by combination of individual elements arranged in a matrix no fixed position being assigned to or needed to be assigned to the individual characters or partial characters by control of light from an independent source using liquid crystals for displaying colours or for displaying grey scales with a specific pixel layout, e.g. using sub-pixels
-
- G—PHYSICS
- G09—EDUCATION; CRYPTOGRAPHY; DISPLAY; ADVERTISING; SEALS
- G09G—ARRANGEMENTS OR CIRCUITS FOR CONTROL OF INDICATING DEVICES USING STATIC MEANS TO PRESENT VARIABLE INFORMATION
- G09G2320/00—Control of display operating conditions
- G09G2320/02—Improving the quality of display appearance
- G09G2320/0242—Compensation of deficiencies in the appearance of colours
-
- G—PHYSICS
- G09—EDUCATION; CRYPTOGRAPHY; DISPLAY; ADVERTISING; SEALS
- G09G—ARRANGEMENTS OR CIRCUITS FOR CONTROL OF INDICATING DEVICES USING STATIC MEANS TO PRESENT VARIABLE INFORMATION
- G09G2360/00—Aspects of the architecture of display systems
- G09G2360/14—Detecting light within display terminals, e.g. using a single or a plurality of photosensors
- G09G2360/145—Detecting light within display terminals, e.g. using a single or a plurality of photosensors the light originating from the display screen
Definitions
- the present invention relates to a chromaticity measurement condition calculation method, a chromaticity measurement method, a chromaticity measurement condition calculation apparatus, and a chromaticity measurement apparatus.
- Patent Document 1 discloses the following color display device evaluation method.
- an evaluation point chromaticity of an evaluation point which is an arbitrary point on a display screen image obtained by imaging a display screen of a color display device, and an average chromaticity in a limited range around the evaluation point are obtained.
- a numerical value corresponding to the amount exceeding the threshold is set as the evaluation value of the evaluation point.
- the evaluation method of the color display device is obtained by obtaining evaluation values at a plurality of evaluation points of the display screen image and setting the total value of the plurality of evaluation values as the color unevenness value of the entire display screen of the color display device.
- the pixels of red (hereinafter also referred to as “R”), green (hereinafter also referred to as “G”), and blue (hereinafter also referred to as “B”) pixels When the dot size becomes large and the optical characteristics are evaluated, if a sufficiently wide range is not measured, the area ratio of the R pixel, the area ratio of the G pixel, and the area ratio of the B pixel in the optical measurement range A difference occurs between the two and a measurement error of chromaticity occurs.
- the chromaticity error since the chromaticity error is not taken into consideration, it is difficult to accurately measure chromaticity when the screen is enlarged, and chromaticity is evaluated with high accuracy. There is a problem that can not be.
- the present invention has been made in view of the above problems, and a chromaticity measurement condition calculation method, a chromaticity measurement method, a chromaticity measurement condition calculation apparatus, and a chromaticity measurement that can accurately evaluate chromaticity. It is an object to provide an apparatus.
- the present invention has been made in view of the above circumstances, and one aspect of the present invention is the size of the measurement area of the chromaticity measuring device that measures the dot width of the color display device and the chromaticity of the color display device.
- the dot width ratio which is a ratio with the corresponding value, is a value determined according to a desired chromaticity error, and based on the dot width ratio, between the color display device and the chromaticity measuring device.
- a chromaticity measurement condition calculation method comprising a measurement distance determination procedure for determining a measurement distance which is a distance.
- the dot width ratio is an allowable value determined in accordance with the desired chromaticity error
- the chromaticity measurement apparatus includes: It is determined based on an allowable value of an area error for each color of pixels included in the measurement range.
- a dot width ratio that is a ratio between a dot width of a color display device and a value corresponding to a size of a measurement region of a chromaticity measurement device that measures the chromaticity of the color display device is A measurement distance determination procedure for determining a measurement distance which is a value determined according to a desired chromaticity error and which is a distance between the color display device and the chromaticity measurement device based on the dot width ratio And a measurement procedure in which the chromaticity measurement device measures the chromaticity of the color display device from a position that is separated from the color display device by the measurement distance.
- one aspect of the present invention is the red color displayed on the color display device with the center of the measurement region measured by the chromaticity measurement device before the measurement procedure. It further has a setting procedure for setting near the center of the pixel or near the boundary between the green and blue pixels.
- a dot width ratio that is a ratio between a dot width of a color display device and a value corresponding to a size of a measurement region of a chromaticity measurement device that measures the chromaticity of the color display device is
- a measurement distance determination unit that determines a measurement distance that is a value determined according to a desired chromaticity error and is a distance between the color display device and the chromaticity measurement device based on the dot width ratio
- a chromaticity measurement condition calculating apparatus comprising:
- One aspect of the present invention is a chromaticity measuring device including the chromaticity measuring condition calculating device described above.
- chromaticity can be evaluated with high accuracy.
- FIG. 6 is an example of an area error diagram and a chromaticity error diagram when the dot width measurement radius ratio t is 25;
- FIG. 6 is an example of an area error diagram and a chromaticity error diagram when the dot width measurement radius ratio t is 30;
- It is a schematic block diagram which shows the structure of the chromaticity measuring apparatus which is a modification.
- FIG. 1 is a diagram illustrating an example of the relationship between chromaticity error and area error.
- the chromaticity error is an amount of chromaticity deviation from a desired chromaticity.
- the area error is an area obtained by reducing the area of the measurement range for measuring chromaticity to a fraction of the number of colors (for example, one third for RGB three colors) and the area sum of pixels of a certain color included in the measurement range. Is the ratio of the difference.
- the vertical axis represents chromaticity error ⁇ x or ⁇ y
- the horizontal axis represents area error.
- the area sum of the B pixels in the optical measurement range changes as indicated by the horizontal axis in the figure, and the area sum of the R pixels and the area sum of the G pixels are opposite to the area sum of the B pixels.
- a graph G10 showing how the chromaticity changes in the vicinity of a white color temperature of 10000 K when it changes.
- the area sum of the B pixel changes in the positive direction
- the area sum of the R pixel and the area sum of the G pixel change in the negative direction.
- the amount of change in the area sum of the R pixels and the area sum of the G pixels is the same.
- the chromaticity x changes by 0.0006
- the chromaticity y changes by 0.001.
- the distance from the liquid crystal module to the optical measuring device is 400 mm to 500 mm which is the minimum measuring distance (for example, 350 mm) + ⁇ ( ⁇ is a coefficient) in the optical measuring device.
- the dot width of the 40 type display device is about 150 ⁇ m
- the dot width of the 52 type display device is about 200 ⁇ m
- the dot width of the 80 type display device is about 300 ⁇ m.
- the dot width is the length of the short side of the dot of each of the RGB pixels constituting the pixel.
- the values of chromaticity x and y may be discussed up to the order of 0.001, and the measurement error is preferably 0.001 or less, for example. Since the area error where both the chromaticity errors ⁇ x and ⁇ y shown in FIG. 1 are 0.001 or less is about 0.58%, for example, the area error is preferably 0.58% or less. In the circular measurement range, the areas of the dots of each color are all equal when the center position of the measurement range (measurement center position) is at the end (boundary) or the center of the dot.
- dot width be w
- radius of measurement range (hereinafter referred to as measurement radius) be r
- dot width measurement radius ratio t be defined as r / w. That is, the dot width measurement radius ratio t is the ratio of the measurement radius r to the dot width w.
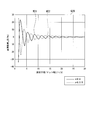
- FIG. 2 is a graph G20 showing an example of the relationship of the area error ⁇ s to the dot width measurement radius ratio t. In FIG. 2, a curve showing the relationship of the area error ⁇ s to the dot width measurement radius ratio t is shown for each measurement center position of the optical measuring instrument.
- FIG. 2 is a graph G20 showing an example of the relationship of the area error ⁇ s to the dot width measurement radius ratio t.
- the vertical bands of the R, G, and B pixels are repeated in the order of R pixels, G pixels, and B pixels such as R, G, B, R, G,. This is a calculated value when arranged in the horizontal direction, and it is assumed that the width of each dot is the same length.
- x indicates the horizontal position when the dots of the RGB pixels are arranged in the horizontal direction.
- x 0 indicates the end of the dot, and
- x 0.5 indicates the center position in the dot short side direction.
- FIG. 2 shows a curve W21 showing the relationship of the area error ⁇ s to the dot width measurement radius ratio t when the measurement center position of the optical measuring device is located at the end of the dot of the G pixel. Also shown is a curve W22 showing the relationship between the area error ⁇ s and the dot width measurement radius ratio t when the measurement center position of the optical measuring device is located in the center of the R pixel in the short dot direction.
- the area error ⁇ s decreases while oscillating.
- the area error of each pixel of RGB within the measurement range changes depending on the dot width measurement radius ratio t or the position of the center of the light beam emitted from the optical measuring device.
- the dot width measurement radius ratio t changes depending on the measurement radius r.
- the measurement radius r is a measurement distance which is a distance from the display device to be measured to the optical measurement device under a condition where the angle of the light beam emitted from the optical measurement device (hereinafter referred to as measurement angle) is constant.
- measurement angle the angle of the light beam emitted from the optical measurement device
- the area error ⁇ s becomes large, which causes a problem in evaluating the chromaticity distribution of the screen.
- the measurement distance which is the distance from the display device to be measured to the optical measurement instrument, is not changed, and the optical measurement instrument has a chromaticity distribution of the screen, etc. at about 400 mm to 500 mm. Was evaluated.
- FIG. 3 is a schematic block diagram showing the configuration of the chromaticity measurement system 1 that measures chromaticity at the measurement distance l calculated by the chromaticity measurement condition calculation device 30 (see FIG. 6) in the first embodiment.
- the chromaticity measurement system 1 includes a color display device 10 and a chromaticity measurement device 20.
- a measurement distance l that is a distance between the color display device 10 and the chromaticity measurement device 20 is set to a measurement distance l calculated by a chromaticity measurement condition calculation device 30 described later.
- the color display device 10 displays an image in which vertical bands of RGB pixels as shown in FIG. 4 to be described later are repeatedly arranged in the order of R, G, and B from the left.
- the color display device 10 is, for example, a liquid crystal television using a liquid crystal panel and an LED backlight.
- the chromaticity measuring device 20 captures the image displayed on the color display device 10 at a predetermined measurement angle (for example, 2 degrees). For example, when the measurement angle is 2 degrees and the measurement distance l is 350 mm, the imaging range (that is, the measurement range) is a circle having a measurement diameter (diameter) of 10 mm.
- the chromaticity measuring apparatus 20 measures chromaticity from the captured image obtained by imaging.
- the chromaticity measuring device 20 is, for example, a spectroradiometer.
- FIG. 4 is an example of an image displayed on the color display device 10 during chromaticity measurement.
- an image G40 in which vertical bands of RGB pixels are repeatedly arranged in the order of R, G, and B from the left is shown. It is shown that the width of the vertical band of each color is w. Further, a semicircle G41 corresponding to half of the imaging range is shown.
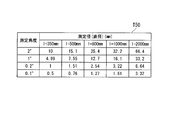
- FIG. 5 is a table T50 showing an example of a measurement diameter (diameter) when a measurement angle and a measurement distance l are given.
- the measurement diameter (diameter) for each measurement distance l is shown.
- the measurement diameter is 15.1 mm
- the measurement distance l is 800 mm
- the measurement diameter Is 25.4 mm when the measurement distance l is 1000 mm
- the measurement diameter is 32.2 mm
- the measurement diameter is 66.4 mm.
- the measurement diameter increases as the measurement distance l increases.
- the measurement diameter increases as the measurement angle increases.
- FIG. 6 is a schematic block diagram showing the configuration of the chromaticity measurement condition calculation device 30 in the first embodiment.
- the chromaticity measurement condition calculation device 30 includes an input unit 31, a storage unit 32, and a control unit 33.
- the input unit 31 receives input from the user.
- the input unit 31 receives the measurement angle of the chromaticity measuring device 20 that measures the chromaticity of the color display device 10.
- the input unit 31 receives the dot width w of the color display device 10.
- the input unit 31 receives dot width measurement radius ratio information indicating a ratio t between the dot width w of the color display device 10 and the measurement radius r of the chromaticity measurement device 20.
- the input unit 31 outputs the input information (for example, measurement angle information indicating the measurement angle, dot width information indicating the dot width w, and dot width measurement radius ratio information) to the control unit 33.
- control unit 33 stores the measurement angle information, the dot width information, and the dot width measurement radius ratio information input from the input unit 31 in the primary storage unit 38 included in the control unit 33, and then stores the dot width information and the dot width.
- the measurement radius ratio information is stored in the storage unit 32.
- the storage unit 32 may hold measurement angle information, dot width information, and dot width measurement radius ratio information in advance.
- control unit 33 calculates a measurement distance l that is a distance between the color display device 10 and the chromaticity measurement device 20.
- the control unit 33 includes a measurement angle acquisition unit 34, a dot width acquisition unit 35, a ratio acquisition unit 36, a measurement distance determination unit 37, and a primary storage unit 38.
- the measurement angle acquisition unit 34 acquires the measurement angle of the chromaticity measuring device 20. Specifically, for example, the measurement angle acquisition unit 34 reads the measurement angle information from the storage unit 32 to acquire the measurement angle. The measurement angle acquisition unit 34 outputs the acquired measurement angle information to the measurement distance determination unit 37.
- the dot width acquisition unit 35 acquires the dot width w of the color display device 10. Specifically, for example, the dot width acquisition unit 35 reads the dot width information from the storage unit 32 to acquire the dot width w. The dot width acquisition unit 35 outputs the acquired dot width information to the measurement distance determination unit 37.
- the ratio acquisition unit 36 acquires a dot width ratio that is a ratio between the dot width w and the length corresponding to the size of the measurement region.
- the length corresponding to the size of the measurement region is, for example, the measurement radius r
- the dot width measurement radius ratio t is used as an example of the dot width ratio.
- the length corresponding to the size of the measurement area may be the diameter of the measurement range.
- the ratio acquisition unit 36 reads the dot width measurement radius ratio information from the storage unit 32 to acquire the dot width measurement radius ratio information. Then, the ratio acquisition unit 36 outputs the acquired specific dot width measurement radius ratio information to the measurement distance determination unit 37.
- the measurement distance determination unit 37 is a distance between the chromaticity measurement device 20 and the color display device 10 based on the dot width ratio (for example, dot width measurement radius ratio t), the dot width w, and the measurement angle r.
- the measurement distance l is determined. Specifically, for example, the measurement distance determination unit 37 determines that the dot width measurement radius ratio t is an area error (for example, 0.58%) determined according to a desired chromaticity error (for example, 0.001).
- the measurement distance l is determined based on a value that is equal to or greater than a threshold value (for example, 30) determined to satisfy the above, the dot width w, and the measurement angle.
- the measurement distance determining unit 37 determines the dot width measurement radius ratio t. A value that is 30 or more is used.
- the chromaticity measurement condition calculation device 30 can set the chromaticity error caused by the area ratio of each of the RGB pixels included in the measurement range to a predetermined range (for example, about 0.001 or less). Therefore, the chromaticity measuring device 20 can measure chromaticity with high accuracy.
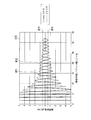
- FIG. 7 is a diagram illustrating an example of the relationship between the area error ⁇ s and the dot width measurement radius ratio t.
- the graph G70 in FIG. 7 shows a curve W71 showing an example of the relationship between the area error ⁇ s and the dot width measurement radius ratio t when the measurement center position of the chromaticity measuring device 20 is located at the end of the G pixel.
- a curve W72 showing an example of the relationship between the area error ⁇ s and the dot width measurement radius ratio t when the measurement center position of the chromaticity measuring device 20 is located at the center of the R pixel is shown.
- the straight line W73 is a straight line with an area error of 0.058%.
- the straight line W74 is a straight line with an area error of ⁇ 0.058%.
- the area error ⁇ s indicated by the curve W71 and the area error ⁇ s indicated by the curve W72 are within the area error range between the straight line W73 and the straight line W74. From this, when the dot width measurement radius ratio t is 30 or more, the area error ⁇ s is 0.058 or less regardless of the measurement center position of the chromaticity measuring apparatus 20.
- FIG. 8 is a diagram showing an example of the relationship between the measurement distance l and the dot width w when the dot width measurement radius ratio t is 30.
- the vertical axis represents the measurement distance l and the horizontal axis represents the dot width w.
- a polygonal line W81 indicating the relationship between the measurement distance l and the dot width w when the dot width measurement radius ratio t is 30 is shown. It is shown.
- the measurement distance determining unit 37 shows the measurement distance l for a certain dot width w as shown in FIG.
- it may be set to a point on the broken line W81 that is not less than the minimum necessary distance corresponding to the dot width w.
- the storage unit 32 holds a plurality of sets of dot width w and minimum required distance representing points on the polygonal line 81 in FIG.
- the measurement distance determination unit 37 reads the minimum required distance corresponding to the dot width w acquired by the dot width acquisition unit 35 from the storage unit 32, and determines the measurement distance l so as to be equal to or greater than the read minimum required distance. To do.
- the chromaticity measuring apparatus 20 can reduce the area error to 0.58% or less, and the chromaticity error for both the chromaticity x and y is about 0.001 or less. be able to.
- the chromaticity measurement condition calculation device 30 can set the chromaticity error within a predetermined range (for example, about 0.001 or less), and thus the chromaticity measurement device 20 accurately measures the chromaticity. can do.
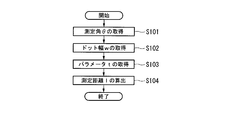
- FIG. 9 is a flowchart illustrating an example of a process flow of the chromaticity measurement condition calculation device 30 according to the first embodiment.
- the measurement angle acquisition unit 34 acquires the measurement angle ⁇ (step S101).
- the dot width acquisition unit 35 acquires the dot width w (step S102).
- the ratio acquisition unit 36 acquires the dot width measurement radius ratio t (step S103).
- the measurement distance determination unit 37 calculates the measurement distance l based on the measurement angle ⁇ , the dot width w, and the dot width measurement radius ratio t (step S104). Above, the process of this flowchart is complete
- the measurement distance determination unit 37 in the chromaticity measurement condition calculation device 30 in the first embodiment is determined so that the dot width measurement radius ratio t satisfies the area error determined according to the desired chromaticity error.
- the measurement distance l is determined based on a value that is equal to or greater than the threshold value.
- the chromaticity measurement condition calculation device 30 can reduce the area error and can reduce the chromaticity error to a desired chromaticity error or less.
- the chromaticity measuring device 20 can measure the chromaticity with high accuracy, and therefore can evaluate the chromaticity with high accuracy.
- the first embodiment can be summarized as a ratio between the dot width w of the color display device 10 and a value corresponding to the size of the measurement region of the chromaticity measurement device 20 that measures the chromaticity of the color display device 10.
- the dot width ratio is a value determined according to a desired chromaticity error.
- the dot width ratio is an allowable value determined according to a desired chromaticity error, and is based on an allowable value of an area error for each color of pixels included in the measurement range of the chromaticity measuring device 20. Is decided.
- the measurement distance determination unit 37 determines the measurement distance l that is the distance between the chromaticity measurement device 20 and the color display device 10 based on the dot width ratio.
- the chromaticity measurement condition calculation device 30 can set the chromaticity error caused by the area ratio of each of the RGB pixels included in the measurement range to a predetermined range.
- the chromaticity measuring device 20 can measure the chromaticity with high accuracy, and therefore can evaluate the chromaticity with high accuracy.
- the measurement distance l In order to set the dot width measurement radius ratio t to 30 or more, for example, in a module having a dot width of 300 ⁇ m (equivalent to 80 type FHD), the measurement distance l needs to be 1100 mm or more. As described above, the measurement distance l increases as the module size increases. The dot area error in the measurement area with respect to the dot width measurement radius ratio t decreases as a whole while oscillating as the dot width measurement radius ratio t increases.
- the chromaticity measurement condition calculation device 30b in the present embodiment extracts in advance the dot width measurement radius ratio t in which the area error is small during the vibration, and based on the value of the dot width measurement radius ratio t, The measurement distance l is determined. Thereby, the chromaticity measurement condition calculation device 30b can reduce the measurement error while shortening the measurement distance l.
- FIG. 10 is a schematic block diagram illustrating a configuration of a chromaticity measurement condition calculation device 30b according to the second embodiment. Elements common to those in FIG. 6 are denoted by the same reference numerals, and detailed description thereof is omitted.
- the configuration of the chromaticity measurement condition calculation device 30b in FIG. 10 is different from the configuration of the chromaticity measurement condition calculation device 30 in FIG. 6 in that the storage unit 32 is the storage unit 32b and the ratio acquisition unit 36 of the control unit 33 is the control unit. The ratio acquisition unit 36b of 33b is changed.
- the storage unit 32b has the same function as the storage unit 32, but dot width measurement radius ratio information indicating the dot width measurement radius ratio t determined to satisfy the area error determined according to the desired chromaticity error. Is different in that it holds.
- dot width measurement radius ratio t when the area error ⁇ s becomes 0 at a point on the curve W71 is 1.81.
- the storage unit 32b holds, for example, information indicating 1.81 that is the dot width measurement radius ratio t when the above-described area error ⁇ s becomes zero.
- the ratio acquisition unit 36b acquires the dot width measurement radius ratio information by reading the information from the storage unit 32b. Then, the ratio acquisition unit 36 b outputs the acquired dot width measurement radius ratio information to the measurement distance determination unit 37. Thereby, the measurement distance determination unit 37 determines the measurement distance l based on the dot width w, the measurement angle, and the dot width measurement radius ratio information acquired by the ratio acquisition unit 36b. Then, by setting the distance between the color display device 10 and the chromaticity measurement device 20 to the determined measurement distance l, the dot width measurement radius ratio t becomes one of the above. Accordingly, the chromaticity measurement condition calculation device 30b can set the area error ⁇ s to 0% and can set the chromaticity error to 0. Therefore, the chromaticity measurement condition calculation device 30b can suppress the chromaticity error even at a short measurement distance l.
- FIG. 11 is a table T120 regarding the dot width measurement radius ratio t in which the area of the R pixel, the area of the G pixel, and the area of the B pixel are all equal.
- the dot width measurement radius ratio t shown in the table of FIG. 11 is a dot width measurement radius ratio t in which the area of the R pixel, the area of the G pixel, and the area of the B pixel are all equal.
- the maximum area error is the dot width measurement radius ratio t.
- the R pixel for the area of 1/3 of the area of the measurement range hereinafter referred to as measurement area
- G This is the area ratio when the area ratio of the B pixel or the B pixel is maximized.
- the measurement center with 0% error is the center position of the measurement range when the area of the R pixel, the area of the G pixel, and the area of the B pixel are all equal at the dot width measurement radius ratio t. is there.
- the Dot boundary means that the center position of the measurement range is an end of a dot of an R pixel, a G pixel, or a B pixel.
- the center of the dot means that the center position of the measurement range is the center of the dot of the R pixel, the G pixel, or the B pixel.
- the maximum values of the area errors are all 5% or less. Further, the maximum value of the area error tends to decrease as the dot width measurement radius ratio t value increases. For example, when the area error is 0.058% or less, the dot width measurement radius ratio t of 9.34 or more is selected from the dot width measurement radius ratio t values shown in FIG.
- the measurement radius ratio t may be stored in advance in the storage unit 32b. Accordingly, the area error can be 0.058% or less regardless of the center position of the measurement range, and the chromaticity error can be 0.001 or less.
- the chromaticity measurement condition calculation device 30b allows the area error to be 0.058% or less without depending on the center position of the measurement range, and is the smallest dot width measurement radius ratio among the dot width measurement radius ratios t. Use t. Therefore, the chromaticity measurement condition calculation device 30b can calculate the shortest measurement distance l among the chromaticity errors that can be 0.001 or less without depending on the center position of the measurement range.
- FIG. 12 is a diagram illustrating an example of an area error when the dot width measurement radius ratio t is 1.81.
- the vertical axis represents the area ratio of the R, G, or B pixels to the area of 1/3 of the measurement area
- the horizontal axis represents the relative measurement center position.
- a curve W121 indicating the area ratio of the R pixel to the area of 1/3 of the measurement area is shown.
- a curve W122 indicating the area ratio of the G pixel to the area of 1/3 of the measurement area
- a curve W123 indicating the area ratio of the B pixel to the area of 1/3 of the measurement area is shown.
- a measurement position value of 0 means the position of the left end toward the R pixel.
- the measurement position 0.5 means the center position of the R pixel.
- a measurement position value of 1 means a position at the right end toward the R pixel and at the left end toward the G pixel.
- a measurement position value of 1.5 means the center position of the G pixel.
- the value of the measurement position of 2 means the position of the right end toward the G pixel and the left end toward the B pixel.
- a measurement position value of 2.5 means the center position of the B pixel.
- a measurement position value of 3 means the rightmost position toward the B pixel.
- Curves W121, W122, and W123 are shown to have a maximum value of 4.3% when the measurement position value is 0.5, 1.5, or 2.5, respectively. Further, the curve W121 shows that the value of the measurement position is 1.28 or 2.73, and the minimum value is -4.6%. Further, the curve W122 shows that the value of the measurement position is 0.73 or 2.28 and takes the minimum value -4.6%. Further, the curve W123 indicates that the value of the measurement position is 0.28 or 1.73 and takes the minimum value -4.6%. As described above, the area error when the dot width measurement radius ratio t is 1.81 is the maximum error in the positive direction is 4.3% and the minimum error in the negative direction is -4.6%.
- the ratio acquisition unit 36b of the chromaticity measurement condition calculation device 30b in the second embodiment stores the dot width measurement radius ratio t determined so as to satisfy the area error determined according to the desired chromaticity error. Obtained from the unit 32b. Then, the measurement distance determination unit 37 determines the measurement distance l based on the dot width measurement radius ratio t, the dot width w, and the measurement angle ⁇ acquired by the ratio acquisition unit 36b. Thereby, the chromaticity measurement condition calculation device 30b has a dot width smaller than that of the first embodiment as the dot width measurement radius ratio t determined so as to satisfy the area error determined according to the desired chromaticity error. The measurement radius ratio t can be taken.
- the chromaticity measurement condition calculation device 30b can reduce the measurement radius r, and thus can shorten the measurement distance l. Further, the chromaticity measurement condition calculation device 30b can satisfy the area error by using the dot width measurement radius ratio t, and can achieve a desired chromaticity error. As described above, the chromaticity measuring device 20 can accurately evaluate the chromaticity with a short measurement distance l.
- FIG. 13 is another example of a table relating to the dot width measurement radius ratio t.
- the table T131 of FIG. 11 shows the dot width measurement radius ratio t, the maximum area error when the measurement center position is changed at the dot width measurement radius ratio t, and the dot width measurement radius ratio t.
- a set of a measurement center position in which the area of the R pixel, the area of the G pixel, and the area of the B pixel are all equal is shown.
- the table T132 in FIG. 13 includes a dot width measurement radius ratio t where the maximum area error is the same when the measurement center position is 0 and when the measurement center position is 0.5, and the dot width measurement radius ratio. A pair with the maximum value of the area error when the measurement center position is shaken at t is shown.
- the dot width measurement radius ratio t in the table T132 the area of the R pixel, the area of the G pixel, and the area of the B pixel are different areas.
- the table T131 of FIG. 13 when the dot width measurement radius ratio t is 1.89, the area error is 7.9% in the positive direction and ⁇ 5.8% in the negative direction.
- the table T132 of FIG. 13 when the dot width measurement radius ratio t is 1.84, the area error is 3.7% in the positive direction and ⁇ 5.0% in the negative direction.
- the table T132 has a positive direction compared to the table T131. The maximum area error is small in the negative direction.
- the area error of the i-th row (i is an index positive integer) of the table T110 in FIG. 11 is similar to the area error of the same i-th row of the table T132.
- the value between the dot width measurement radius ratio t in the i-th row (i is a positive integer) in the table T110 in FIG. 11 and the dot width measurement radius ratio t in the same i-th row in the table T132 (hereinafter referred to as an intermediate
- the area error in the dot width measurement radius ratio t) is similar to the dot width measurement radius ratio t in the i-th row (i is an index positive integer) of the table T110.
- the dot width measurement radius ratio t is a value from 1.81 to 1.84, the area errors are similar.
- the measurement distance determination unit 37 may set the measurement distance l by using the above-described intermediate dot width measurement radius ratio t as the dot width measurement radius ratio t.
- the storage unit 32b only needs to store information indicating the intermediate dot width measurement radius ratio t.
- the ratio acquisition unit 36b may read information indicating the intermediate dot width measurement radius ratio t from the storage unit 32b.
- the area error is reduced. Almost unchanged. For this reason, since the area error can be contained within a predetermined area error range, the chromaticity error can be contained within a predetermined error range. Further, even if there is an error in the actual measurement distance l and the measurement radius r varies and the dot width measurement radius ratio t slightly changes, the area error hardly changes. For this reason, since the area error can be contained within a predetermined area error range, the chromaticity error can be contained within a predetermined error range. As a result, the chromaticity measuring device 20 can accurately measure the chromaticity.
- the dot width measurement radius ratio t is changed in accordance with the shape of the boundary between the RGB pixels of the color display device 10 or the shape of the black mask (non-display element portion) of the color display device 10. t is also acceptable.
- the chromaticity measurement condition calculation device 30 can further reduce the area error and the chromaticity error.
- the storage unit 32b holds any one of the dot width measurement radius ratios t when the area error ⁇ s is 0, but is not limited thereto, and holds at least one dot width measurement radius ratio t. It only has to be. In that case, the ratio acquisition unit 36b may select and read the smallest dot width measurement radius ratio t among the dot width measurement radius ratios t stored in the storage unit 32b. Thus, when the smallest dot width measurement radius ratio t is selected, the chromaticity measurement condition calculation device 30b inevitably has the shortest measurement distance l because the measurement radius r is the smallest. As a result, the chromaticity measurement condition calculation device 30b can shorten the measurement distance l in the selectable dot width measurement radius ratio t.
- the storage unit 32b holds any one of the dot width measurement radius ratios t when the area error ⁇ s is 0, but the area error ⁇ s is in a predetermined range (for example, ⁇ 0.058%). It is sufficient that at least one dot width measurement radius ratio t is maintained.
- the predetermined range is determined so as to satisfy a desired chromaticity error. Accordingly, the chromaticity measurement condition calculation device 30b can set the area error ⁇ s within a predetermined range, and can satisfy a desired chromaticity error.
- the center of the measurement area (measurement center position) measured by the chromaticity measuring device 20 is displayed on the color display device 10. It may be set near the center of the red pixel or near the boundary between the green and blue pixels.
- the vicinity of the center of the red pixel is a range up to a position away from the center of the red pixel by a predetermined distance.
- the vicinity of the boundary between the green and blue pixels is a range from a boundary between the green and blue pixels to a position separated by a predetermined distance.
- the measurement center position is adjusted near the center of the red pixel displayed on the color display device 10 or near the boundary between the green and blue pixels as follows. First, the measurement angle of the chromaticity measuring device 20 is reduced, and the diameter of the spot projected on the color display device 10 by the light emitted from the chromaticity measuring device 20 is reduced. Then, the chromaticity measuring device 20 is moved so that the spot diameter is near the center of the red pixel or near the boundary between the green and blue pixels.
- the position of the chromaticity measuring device 20 may be moved by a person or a device. The object to be moved is not limited to the chromaticity measuring device 20, and the color display device 10 may be moved, or both the chromaticity measuring device 20 and the color display device 10 may be moved.
- the chromaticity error can be reduced by setting the measurement center position near the center of the red pixel displayed on the color display device 10 or near the boundary between the green and blue pixels.
- the reason why the chromaticity error can be reduced will be described with reference to FIGS.
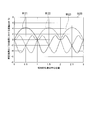
- FIG. 14 is an example of an area error diagram and a chromaticity error diagram when the dot width measurement radius ratio t is 25.
- the area error diagram G141 in the same figure, for each of the R pixel, the G pixel, and the B pixel, a curve W142 showing the relationship between the area ratio with respect to 1/3 of the measurement area and the relative measurement center position, 143 and 144 are shown respectively.
- the vertical axis of the area error chart G141 is the area ratio to the area of 1/3 of the measurement area, and the horizontal axis is the relative measurement center position.
- the definition of the relative measurement center position is the same as that in FIG.
- a curve W146 showing the relationship between the chromaticity change ⁇ x of the chromaticity x and the relative measurement center position is shown.
- a curve W147 showing the relationship between the chromaticity change ⁇ y of chromaticity y and the relative measurement center position is shown.
- the vertical axis represents the chromaticity change
- the horizontal axis represents the relative measurement center position.
- both the chromaticity change ⁇ x and the chromaticity change ⁇ y are relatively small. Both values fall within the range of -0.001 to 0.001.
- the relative measurement center position is 2, that is, the boundary between the G pixel and the B pixel is the measurement center, both the chromaticity change ⁇ x and the chromaticity change ⁇ y are relatively small as indicated by the region R149. These values are both in the range of -0.001 to 0.001.
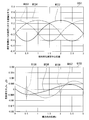
- FIG. 15 is an example of an area error diagram and a chromaticity error diagram when the dot width measurement radius ratio t is 30.
- the area error chart G141 in the same figure, for each of the R pixel, the G pixel, and the B pixel, a curve W152 showing the relationship between the area ratio to the area of 1/3 of the measurement area and the relative measurement center position, 153 and 154 are shown respectively.
- the vertical axis of the area error chart G151 is the area ratio to the area of 1/3 of the measurement area, and the horizontal axis is the relative measurement center position.
- the definition of the relative measurement center position is the same as that in FIG.
- the chromaticity error diagram G155 shows a curve W156 showing the relationship between the chromaticity change ⁇ x of the chromaticity x and the relative measurement center position.
- a curve W157 showing the relationship between the chromaticity change ⁇ y of chromaticity y and the relative measurement center position is shown.
- the vertical axis of the chromaticity error diagram G155 is the chromaticity change, and the horizontal axis is the relative measurement center position.
- the relative measurement center position is 0.5, that is, the center position of the R pixel is the measurement center, the chromaticity change ⁇ x and the chromaticity change ⁇ y are relatively small as indicated by the region R158. Both values fall within the range of -0.0005 to 0.0005.
- the relative measurement center position is 2, that is, the boundary between the G pixel and the B pixel is the measurement center, both the chromaticity change ⁇ x and the chromaticity change ⁇ y are relatively small as indicated by the region R149. These values are both in the range of -0.0005 to 0.0005.
- the measurement center position where the area of G and the area of B are equal is the center of the R pixel or the boundary between the G pixel and the B pixel. is there.
- the chromaticity error diagram G145 in FIG. 14 and the chromaticity error diagram G155 in FIG. 15 the chromaticity change ⁇ x and the chromaticity change ⁇ y at the center of the R pixel or the boundary between the G pixel and the B pixel. Both are relatively small.
- the chromaticity change ⁇ y is about ⁇ 0.0012. .
- the relative measurement center position is 0.5, that is, the measurement center position is located at the center of the R pixel, the chromaticity change ⁇ y is about 0.0001, so the measurement center position is directed toward the R pixel. Therefore, the chromaticity change ⁇ y is smaller than that at the left end.
- the chromaticity error can be reduced by setting the measurement center position of the chromaticity measuring device 20 to the center of the red pixel or the boundary between the green and blue pixels.
- the dot width measurement radius ratio t is set to 30 or more as an example.
- the chromaticity error can be obtained by aligning the center of the R pixel or the boundary between the G pixel and the B pixel with the measurement center position. Therefore, when the center of the R pixel or the boundary between the G pixel and the B pixel is set to the measurement center position, for example, the dot width measurement radius ratio t may be 25 or more.
- the chromaticity measurement device 20 and the chromaticity measurement condition calculation device (30 or 30b) have been described as separate devices.
- the measurement condition calculation device (30 or 30b) may be included.
- a chromaticity measuring device 20b including the chromaticity measuring condition calculating device 30 according to the first embodiment will be described with reference to FIG.
- FIG. 16 is a schematic block diagram illustrating a configuration of a chromaticity measuring apparatus 20b which is a modification.
- the chromaticity measurement device 20b includes a control unit 21, a display unit 22, and a chromaticity measurement condition calculation device 30.
- the control unit 21 causes the chromaticity measurement condition calculation device 30 to calculate the measurement distance l.
- the measurement distance l is requested to the chromaticity measurement condition calculation device 30.
- the chromaticity measurement condition calculation device 30 calculates the measurement distance l in response to the request, and outputs measurement distance information indicating the calculated measurement distance l to the chromaticity measurement condition calculation device 30.
- the control unit 21 causes the display unit 22 to display the measurement distance information input from the chromaticity measurement condition calculation device 30.
- the chromaticity measuring device 20b as a modification may be configured to include the chromaticity measuring condition calculating device 30b in the second embodiment instead of the chromaticity measuring condition calculating device 30 in the first embodiment. .
- a program for executing each process of the chromaticity measurement condition calculation device (30 or 30b) or the chromaticity measurement device 20b of the present embodiment is recorded on a computer-readable recording medium, and is recorded on the recording medium.
- the above-described various processes relating to the chromaticity measurement condition calculation device (30 or 30b) or the chromaticity measurement device 20b may be performed by causing the computer system to read and execute the program.
- the “computer system” referred to here may include an OS and hardware such as peripheral devices. Further, the “computer system” includes a homepage providing environment (or display environment) if a WWW system is used.
- the “computer-readable recording medium” means a flexible disk, a magneto-optical disk, a ROM, a writable nonvolatile memory such as a flash memory, a portable medium such as a CD-ROM, a hard disk built in a computer system, etc. This is a storage device.
- the “computer-readable recording medium” refers to a volatile memory (for example, DRAM (Dynamic) in a computer system serving as a server or a client when a program is transmitted via a network such as the Internet or a communication line such as a telephone line. Random Access Memory)), etc. that hold a program for a certain period of time.
- the program may be transmitted from a computer system storing the program in a storage device or the like to another computer system via a transmission medium or by a transmission wave in the transmission medium.
- the “transmission medium” for transmitting the program refers to a medium having a function of transmitting information, such as a network (communication network) such as the Internet or a communication line (communication line) such as a telephone line.
- the program may be for realizing a part of the functions described above. Furthermore, what can implement
- chromaticity can be evaluated with high accuracy.
Landscapes
- Engineering & Computer Science (AREA)
- Physics & Mathematics (AREA)
- Theoretical Computer Science (AREA)
- General Physics & Mathematics (AREA)
- Computer Hardware Design (AREA)
- General Health & Medical Sciences (AREA)
- Chemical & Material Sciences (AREA)
- Crystallography & Structural Chemistry (AREA)
- Signal Processing (AREA)
- Multimedia (AREA)
- Health & Medical Sciences (AREA)
- Biomedical Technology (AREA)
- Spectrometry And Color Measurement (AREA)
Abstract
この色度測定条件算出方法は、カラー表示装置のドット幅とカラー表示装置の色度を測定する色度測定装置の測定領域の大きさに応じた値との比であるドット幅比が、所望の色度誤差に応じて決められた値であり、上記ドット幅比に基づいて、カラー表示装置と色度測定装置との間の距離である測定距離を決定する測定距離決定手順を有する。
Description
本発明は、色度測定条件算出方法、色度測定方法、色度測定条件算出装置及び色度測定装置に関する。
本願は、2012年7月11日に、日本に出願された特願2012-155681号に基づき優先権を主張し、その内容をここに援用する。
本願は、2012年7月11日に、日本に出願された特願2012-155681号に基づき優先権を主張し、その内容をここに援用する。
従来から、カラーディスプレイ装置の画像の色むら、輝度むらについて評価する方法が開発されている。例えば、特許文献1には、以下のカラーディスプレイ装置の評価方法が開示されている。まず、カラーディスプレイ装置の表示画面を撮像した表示画面画像上の任意の点である評価点の評価点色度と、その評価点の周囲の限定された範囲における周囲平均色度とを求める。そして、これら評価点色度と周囲平均色度との差が予め設定された閾値を越える場合にその超えた量に応じた数値をその評価点の評価値とする。そして、上記表示画面画像の複数の評価点において評価値を求めてそれら複数の評価値の合計値をカラーディスプレイ装置の表示画面全体の色むら値とするカラーディスプレイ装置の評価方法である。
ここで、画面の大型化に伴って、赤(以下、「R」ともいう)の画素、緑(以下、「G」ともいう)の画素、青(以下、「B」ともいう)の画素のドットのサイズも大きくなり、光学特性を評価するときに、十分に広い範囲を測定しなければ光学測定範囲内に占めるRの画素の面積割合、Gの画素の面積割合、Bの画素の面積割合の間に差が生じ、色度の測定誤差が発生する。特許文献1の評価方法では、上記色度誤差については、考慮されていないので、画面が大型化した場合に、精度良く色度の測定することが困難であり、色度を高精度で評価することができないという問題がある。
そこで本発明は、上記問題に鑑みてなされたものであり、精度良く色度を評価することを可能とする色度測定条件算出方法、色度測定方法、色度測定条件算出装置及び色度測定装置を提供することを課題とする。
(1)本発明は前記事情に鑑みなされたもので、本発明の一態様は、カラー表示装置のドット幅と前記カラー表示装置の色度を測定する色度測定装置の測定領域の大きさに応じた値との比であるドット幅比が、所望の色度誤差に応じて決められた値であり、前記ドット幅比に基づいて、前記カラー表示装置と前記色度測定装置との間の距離である測定距離を決定する測定距離決定手順を有することを特徴とする色度測定条件算出方法である。
(2)上記に記載の色度測定条件算出方法において、本発明の一態様は、前記ドット幅比は、前記所望の色度誤差に応じて決められる許容値であって前記色度測定装置の測定範囲に含まれる画素の色毎の面積誤差の許容値に基づいて決められていることを特徴とする。
(3)本発明の一態様は、カラー表示装置のドット幅と前記カラー表示装置の色度を測定する色度測定装置の測定領域の大きさに応じた値との比であるドット幅比が、所望の色度誤差に応じて決められた値であり、前記ドット幅比に基づいて、前記カラー表示装置と前記色度測定装置との間の距離である測定距離を決定する測定距離決定手順と、前記色度測定装置が、前記カラー表示装置から前記測定距離だけ離れた位置から前記カラー表示装置の色度を測定する測定手順と、を有することを特徴とする色度測定方法である。
(4)上記に記載の色度測定方法において、本発明の一態様は、前記測定手順の前に、前記色度測定装置が測定する測定領域の中心を、前記カラー表示装置に表示された赤の画素の中央付近、または緑と青の画素の境目付近に設定する設定手順を更に有することを特徴とする。
(5)本発明の一態様は、カラー表示装置のドット幅と前記カラー表示装置の色度を測定する色度測定装置の測定領域の大きさに応じた値との比であるドット幅比が、所望の色度誤差に応じて決められた値であり、前記ドット幅比に基づいて、前記カラー表示装置と前記色度測定装置との間の距離である測定距離を決定する測定距離決定部を備えることを特徴とする色度測定条件算出装置である。
(6)本発明の一態様は、上記に記載の色度測定条件算出装置を備えることを特徴とする色度測定装置である。
本発明によれば、精度良く色度を評価することができる。
<第1の実施形態>
以下、本発明の実施形態について、図面を参照して詳細に説明する。図1は、色度誤差と面積誤差との関係の一例を示す図である。ここで、色度誤差とは、所望の色度からの色度のずれ量である。面積誤差とは、色度を測定する測定範囲の面積を色数分の1(例えば、RGB3色の場合、3分の1)にした面積と、測定範囲に含まれるある色の画素の面積和との差分の割合である。同図において、縦軸は色度誤差ΔxまたはΔy、横軸は面積誤差である。
以下、本発明の実施形態について、図面を参照して詳細に説明する。図1は、色度誤差と面積誤差との関係の一例を示す図である。ここで、色度誤差とは、所望の色度からの色度のずれ量である。面積誤差とは、色度を測定する測定範囲の面積を色数分の1(例えば、RGB3色の場合、3分の1)にした面積と、測定範囲に含まれるある色の画素の面積和との差分の割合である。同図において、縦軸は色度誤差ΔxまたはΔy、横軸は面積誤差である。
図1は、光学測定範囲に占めるBの画素の面積和が図の横軸のように変化し、Rの画素の面積和とGの画素の面積和がBの画素の面積和と逆方向に変化したときに、白の色温度10000K付近で色度がどのように変化するかを示すグラフG10の一例である。例えば、Bの画素の面積和がプラス方向に変化した場合は、Rの画素の面積和及びGの画素の面積和はマイナス方向に変化する。ただし、Rの画素の面積和とGの画素の面積和の変化量は同一であるものとする。例えば、面積が0.58%変化すると、色度xは0.0006、色度yは0.001変化する。
従来の液晶モジュールの光学評価では、液晶モジュールから光学測定器までの距離は、光学測定器における最小測定距離(例えば350mm)+α(αは係数)の400mm~500mmである。ここで、40型の表示装置のドット(画素)幅は、約150μm、52型の表示装置のドット幅は、約200μm、80型の表示装置のドット幅は、約300μmである。ここでドット幅は、画素を構成するRGBそれぞれの画素のドットの短辺側の長さである。
このように、画面の大型化に伴って、ドット幅の大きさが大きくなるので、従来、測定誤差を少なくするためには測定距離を長くする必要があった。しかし、十分長い測定距離をとれれば問題ないが、測定環境の制約(測定部屋の広さ等)により、測定距離はできる限り短くしたい場合がある。また、色度x、yの値は、0.001の桁まで議論することがあり、測定誤差は、例えば、0.001以下が望ましい。図1に示す色度誤差Δx、Δyがともに0.001以下となる面積誤差は約0.58%であるので、例えば、面積誤差は0.58%以下が好ましい。
なお、円形の測定範囲にて、各色のドットの面積が全て等しくなるのは、測定範囲の中心の位置(測定中心位置)が、ドットの端(境目)または中央のときである。
なお、円形の測定範囲にて、各色のドットの面積が全て等しくなるのは、測定範囲の中心の位置(測定中心位置)が、ドットの端(境目)または中央のときである。
ドット幅をw、測定範囲の半径(以下、測定半径という)をrとして、ドット幅測定半径比tをr/wと定義する。すなわちドット幅測定半径比tは、ドット幅wに対する測定半径rの比である。
図2は、ドット幅測定半径比tに対する面積誤差Δsの関係の一例を示すグラフG20である。図2において、光学測定器の測定中心位置毎に、ドット幅測定半径比tに対する面積誤差Δsの関係を示す曲線が示されている。ここで、図2の例は、RGBそれぞれの画素の縦の帯が、R、G、B、R、G、・・・というようにRの画素、Gの画素、Bの画素の順で繰り返し横方向に並んだ場合の計算値であり、各ドットの幅は、同じ長さであることを前提としている。図2のxは、RGBの画素のドットが、横方向に並んでいる場合の横方向の位置を示す。x=0はドットの端、x=0.5はドット短辺方向の中央の位置を示す。
図2は、ドット幅測定半径比tに対する面積誤差Δsの関係の一例を示すグラフG20である。図2において、光学測定器の測定中心位置毎に、ドット幅測定半径比tに対する面積誤差Δsの関係を示す曲線が示されている。ここで、図2の例は、RGBそれぞれの画素の縦の帯が、R、G、B、R、G、・・・というようにRの画素、Gの画素、Bの画素の順で繰り返し横方向に並んだ場合の計算値であり、各ドットの幅は、同じ長さであることを前提としている。図2のxは、RGBの画素のドットが、横方向に並んでいる場合の横方向の位置を示す。x=0はドットの端、x=0.5はドット短辺方向の中央の位置を示す。
例えば、x=0:Gは、光学測定器の測定中心位置がGの画素のドットの端に位置することを意味する。x=0.5:Rは、光学測定器の測定中心位置がRの画素のドット短辺方向の中央に位置することを意味する。図2において、光学測定器の測定中心位置がGの画素のドットの端に位置する場合の、ドット幅測定半径比tに対する面積誤差Δsの関係を示す曲線W21が示されている。また、光学測定器の測定中心位置がRの画素のドット短辺方向の中央に位置する場合のドット幅測定半径比tに対する面積誤差Δsの関係を示す曲線W22が示されている。
同図において、ドット幅測定半径比tが大きくなるに連れて、面積誤差Δsは振動しながら小さくなっている。同図のように、ドット幅測定半径比tまたは光学測定器が出射する光線の中心の位置に依存して、測定範囲内のRGBそれぞれの画素の面積誤差が変化する。ある表示装置においてドット幅wが一定であるとすると、ドット幅測定半径比tは測定半径rに依存して変化する。ここで、測定半径rは、光学測定器が出射する光線の角度(以下、測定角度という)が一定の条件の下では、測定の対象となる表示装置から光学測定器までの距離である測定距離が大きくなるほど、測定半径rが大きくなる。すなわち、測定距離を離すことにより、面積誤差Δsを小さくすることができる。
測定距離によっては、面積誤差Δsが大きくなり、画面の色度分布等を評価する上で問題となる。従来の測定では、画面サイズによらず、測定の対象となる表示装置から光学測定器までの距離である測定距離を変えず、400mm~500mm程度にて、光学測定器は画面の色度分布等を評価していた。
図3は、第1の実施形態における色度測定条件算出装置30(図6参照)が算出した測定距離lで色度を計測する色度測定システム1の構成を示す概略ブロック図である。図3において、色度測定システム1は、カラー表示装置10と、色度測定装置20とを備える。同図において、カラー表示装置10と色度測定装置20との距離である測定距離lは、後述する色度測定条件算出装置30が算出した測定距離lに設定されている。
カラー表示装置10は、例えば、後述する図4に示すようなRGBそれぞれの画素の縦の帯が、向かって左からR、G、Bの順に繰り返し並んでいる画像を表示する。カラー表示装置10は、例えば、液晶パネルとLEDバックライトとを用いた液晶テレビである。
色度測定装置20は、予め決められた測定角度(例えば、2度)で、カラー表示装置10に表示された上記画像を撮像する。例えば、測定角度が2度で、測定距離lが350mmの場合、撮像範囲(すなわち測定範囲)は測定径(直径)が10mmの円である。そして、色度測定装置20は、撮像することで得られた撮像画像から色度を測定する。色度測定装置20は、例えば、分光放射計である。
色度測定装置20は、予め決められた測定角度(例えば、2度)で、カラー表示装置10に表示された上記画像を撮像する。例えば、測定角度が2度で、測定距離lが350mmの場合、撮像範囲(すなわち測定範囲)は測定径(直径)が10mmの円である。そして、色度測定装置20は、撮像することで得られた撮像画像から色度を測定する。色度測定装置20は、例えば、分光放射計である。
図4は、色度測定の際にカラー表示装置10に表示される画像の一例である。同図において、RGBそれぞれの画素の縦の帯が、向かって左からR、G、Bの順で繰り返し並んでいる画像G40が示されている。それぞれの色の縦の帯の横幅がwであることが示されている。また、撮像範囲のうちの半分に相当する半円G41が示されている。
図5は、測定角度と測定距離lが与えられたときの測定径(直径)の一例を示すテーブルT50である。測定角度それぞれに対して、測定距離l毎の測定径(直径)が示されている。例えば、測定角度が2度の場合、測定距離lが350mmの場合、測定径が10mmで、測定距離lが500mmの場合、測定径が15.1mmで、測定距離lが800mmの場合、測定径が25.4mmで、測定距離lが1000mmの場合、測定径が32.2mmで、測定距離lが2000mmの場合、測定径が66.4mmであることが示されている。このように同じ測定角度の場合、測定距離lが長くなるほど測定径が大きくなる。また、同じ測定距離lの場合、測定角度が大きくなるほど測定径が大きくなる。
図6は、第1の実施形態における色度測定条件算出装置30の構成を示す概略ブロック図である。色度測定条件算出装置30は、入力部31と、記憶部32と、制御部33とを備える。入力部31は、ユーザからの入力を受け付ける。例えば、入力部31は、カラー表示装置10の色度を測定する色度測定装置20の測定角度を受け付ける。また、例えば、入力部31は、カラー表示装置10のドット幅wを受け付ける。また、例えば、入力部31は、カラー表示装置10のドット幅wと色度測定装置20の測定半径rとの比tを示すドット幅測定半径比情報を受け付ける。入力部31は、入力された情報(例えば、測定角度を示す測定角度情報、ドット幅wを示すドット幅情報、ドット幅測定半径比情報)を制御部33へ出力する。
制御部33は、例えば、入力部31から入力された測定角度情報、ドット幅情報及びドット幅測定半径比情報を制御部33が備える一次記憶部38に記憶してから、ドット幅情報及びドット幅測定半径比情報を記憶部32に記憶させる。なお、記憶部32は、測定角度情報、ドット幅情報及びドット幅測定半径比情報を予め保持してもよい。
また、制御部33は、カラー表示装置10と色度測定装置20との間の距離である測定距離lを算出する。ここで、制御部33は、測定角度取得部34と、ドット幅取得部35と、比取得部36と、測定距離決定部37と、一次記憶部38とを備える。測定角度取得部34は、色度測定装置20の測定角度を取得する。具体的には、例えば、測定角度取得部34は、測定角度情報を記憶部32から読み出すことで測定角度を取得する。測定角度取得部34は、取得した測定角度情報を測定距離決定部37に出力する。
ドット幅取得部35は、カラー表示装置10のドット幅wを取得する。具体的には、例えば、ドット幅取得部35は、記憶部32からドット幅情報を読み出すことでドット幅wを取得する。ドット幅取得部35は、取得したドット幅情報を測定距離決定部37へ出力する。
比取得部36は、ドット幅wと測定領域の大きさに応じた長さとの比であるドット幅比を取得する。ここで本実施形態において、測定領域の大きさに応じた長さは、一例として測定半径rとし、ドット幅比の一例としてドット幅測定半径比tを用いることとする。なお、測定領域の大きさに応じた長さは、測定範囲の直径であってもよい。比取得部36は、例えば、ドット幅測定半径比情報を記憶部32から読み出すことで上記ドット幅測定半径比情報を取得する。そして、比取得部36は、取得した比ドット幅測定半径比情報を測定距離決定部37へ出力する。
測定距離決定部37は、ドット幅比(例えば、ドット幅測定半径比t)とドット幅wと測定角度rとに基づいて、色度測定装置20とカラー表示装置10との間の距離である測定距離lを決定する。具体的には、例えば、測定距離決定部37は、ドット幅測定半径比tが、所望の色度誤差(例えば、0.001)に応じて決められた面積誤差(例えば、0.58%)を満たすように決められた閾値(例えば、30)以上となる値とドット幅wと測定角度とに基づいて、測定距離lを決定する。
ここで、例えば、色度測定装置20のドット幅wは既知であるので、ドット幅測定半径比tと色度測定装置20が測定時に使用する測定角θとが与えられていることを前提とする。その場合、測定距離決定部37は、例えば、そのドット幅wとそのドット幅測定半径比tと測定角θとを取得し、l=t×w/tanθの式に従って、測定距離lを算出する。ここで、ドット幅wが200μm(52型のFull Hivision Display:FHD相当)以上のカラー表示装置10において、例えば、閾値の値が30の場合、測定距離決定部37は、ドット幅測定半径比tが30以上となる値を用いる。
これにより、ドット幅測定半径比tが30以上となることにより、後述する図7に示すように面積誤差が0.58%以下となり、色度誤差を色度x、y共に約0.001以下とすることができる。これにより、色度測定条件算出装置30は、測定範囲に含まれるRGBそれぞれの画素の面積比に起因する色度誤差を予め決められた範囲(例えば、約0.001以下)にすることができるので、色度測定装置20は、精度よく色度を測定することができる。
図7は、面積誤差Δsとドット幅測定半径比tとの関係の一例を示す図である。図7のグラフG70には、色度測定装置20の測定中心位置がGの画素の端に位置する場合の、面積誤差Δsとドット幅測定半径比tとの関係の一例を示す曲線W71が示されている。
同様に、色度測定装置20の測定中心位置がRの画素の中心に位置する場合の、面積誤差Δsとドット幅測定半径比tとの関係の一例を示す曲線W72が示されている。直線W73は、面積誤差が0.058%である直線である。直線W74は、面積誤差が-0.058%である直線である。ドット幅測定半径比tが30以上の場合、曲線W71が示す面積誤差Δsも曲線W72が示す面積誤差Δsも、直線W73と直線W74の間の面積誤差範囲に収まっている。このことから、ドット幅測定半径比tが30以上の場合、色度測定装置20の測定中心位置に寄らず面積誤差Δsが0.058以下である。
同様に、色度測定装置20の測定中心位置がRの画素の中心に位置する場合の、面積誤差Δsとドット幅測定半径比tとの関係の一例を示す曲線W72が示されている。直線W73は、面積誤差が0.058%である直線である。直線W74は、面積誤差が-0.058%である直線である。ドット幅測定半径比tが30以上の場合、曲線W71が示す面積誤差Δsも曲線W72が示す面積誤差Δsも、直線W73と直線W74の間の面積誤差範囲に収まっている。このことから、ドット幅測定半径比tが30以上の場合、色度測定装置20の測定中心位置に寄らず面積誤差Δsが0.058以下である。
図8は、ドット幅測定半径比tが30となる場合の測定距離lとドット幅wとの関係の一例を示す図である。図8において、縦軸が測定距離lで横軸がドット幅wである。図8のグラフG80において、色度測定装置20の測定角度が1度である場合に、ドット幅測定半径比tが30となる場合の測定距離lとドット幅wとの関係を示す折れ線W81が示されている。
例えば、色度測定装置20がドット幅wに対する最低必要距離が、図8のように与えられている場合、測定距離決定部37は、あるドット幅wに対する測定距離lを、図8に示された折れ線W81上の点であってそのドット幅wに対応する最低必要距離以上に設定してもよい。その場合、例えば、記憶部32は図8の折れ線81上の点を表わすドット幅wと最低必要距離の組を複数保持している。そして、測定距離決定部37は、例えば、ドット幅取得部35が取得したドット幅wに対応する最低必要距離を記憶部32から読み出し、読み出した最低必要距離以上になるように測定距離lを決定する。
色度測定装置20は、このように測定距離lを設定することで、面積誤差が0.58%以下とすることができ、色度誤差を色度x、y共に約0.001以下とすることができる。これにより、色度測定条件算出装置30は、色度誤差を予め決められた範囲(例えば、約0.001以下)にすることができるので、色度測定装置20は、精度よく色度を測定することができる。
図9は、第1の実施形態における色度測定条件算出装置30の処理の流れの一例を示すフローチャートである。まず、測定角度取得部34は、測定角度θを取得する(ステップS101)。次に、ドット幅取得部35は、ドット幅wを取得する(ステップS102)。次に、比取得部36は、ドット幅測定半径比tを取得する(ステップS103)。次に、測定距離決定部37は、測定角度θとドット幅wとドット幅測定半径比tとに基づいて、測定距離lを算出する(ステップS104)。以上で、本フローチャートの処理を終了する。
以上、第1の実施形態における色度測定条件算出装置30における測定距離決定部37は、ドット幅測定半径比tが、所望の色度誤差に応じて決められた面積誤差を満たすように決められた閾値以上になる値に基づいて、測定距離lを決定する。これにより、色度測定条件算出装置30は、ドット幅測定半径比tが閾値以上になるので、面積誤差が低くなり、色度誤差を所望の色度誤差以下にすることができる。その結果、色度測定装置20は、精度よく色度を測定することができるので、精度良く色度を評価できる。
以上、第1の実施形態についてまとめると、カラー表示装置10のドット幅wとカラー表示装置10の色度を測定する色度測定装置20の測定領域の大きさに応じた値との比であるドット幅比が、所望の色度誤差に応じて決められた値である。ここで、詳細には、ドット幅比は、所望の色度誤差に応じて決められる許容値であって色度測定装置20の測定範囲に含まれる画素の色毎の面積誤差の許容値に基づいて決められている。そして、測定距離決定部37は、ドット幅比に基づいて、色度測定装置20とカラー表示装置10との間の距離である測定距離lを決定する。これにより、色度測定条件算出装置30は、測定範囲に含まれるRGBそれぞれの画素の面積比に起因する色度誤差を予め決められた範囲にすることができる。その結果、色度測定装置20は、精度よく色度を測定することができるので、精度良く色度を評価できる。
<第2の実施形態>
続いて、第2の実施形態について説明する。ドット幅測定半径比tを30以上とするには、例えば、300μmのドット幅(80型FHD相当)のモジュールでは測定距離lを1100mm以上にする必要がある。このように、モジュールの大型化に伴い測定距離lも長くなる。ドット幅測定半径比tに対する測定エリアに占めるドットの面積誤差は、ドット幅測定半径比tが大きくなるに連れて振動しながら全体的に小さくなっていく。そのため、本実施形態における色度測定条件算出装置30bは、その振動中で面積誤差が小さくなるドット幅測定半径比tを予め抽出しておき、そのドット幅測定半径比tの値に基づいて、測定距離lを決定する。これにより、色度測定条件算出装置30bは、測定距離lを短くしながら測定誤差を小さくすることができる。
続いて、第2の実施形態について説明する。ドット幅測定半径比tを30以上とするには、例えば、300μmのドット幅(80型FHD相当)のモジュールでは測定距離lを1100mm以上にする必要がある。このように、モジュールの大型化に伴い測定距離lも長くなる。ドット幅測定半径比tに対する測定エリアに占めるドットの面積誤差は、ドット幅測定半径比tが大きくなるに連れて振動しながら全体的に小さくなっていく。そのため、本実施形態における色度測定条件算出装置30bは、その振動中で面積誤差が小さくなるドット幅測定半径比tを予め抽出しておき、そのドット幅測定半径比tの値に基づいて、測定距離lを決定する。これにより、色度測定条件算出装置30bは、測定距離lを短くしながら測定誤差を小さくすることができる。
第2の実施形態における色度測定条件算出装置30bが算出した測定距離lで色度を計測する色度測定システム1の構成は、図3で示された構成と同様であるので、その説明を省略する。
図10は、第2の実施形態における色度測定条件算出装置30bの構成を示す概略ブロック図である。図6と共通する要素には同一の符号を付し、その具体的な説明を省略する。図10の色度測定条件算出装置30bの構成は、図6の色度測定条件算出装置30の構成に対して、記憶部32が記憶部32bに、制御部33の比取得部36が制御部33bの比取得部36bに変更されたものとなっている。
図10は、第2の実施形態における色度測定条件算出装置30bの構成を示す概略ブロック図である。図6と共通する要素には同一の符号を付し、その具体的な説明を省略する。図10の色度測定条件算出装置30bの構成は、図6の色度測定条件算出装置30の構成に対して、記憶部32が記憶部32bに、制御部33の比取得部36が制御部33bの比取得部36bに変更されたものとなっている。
記憶部32bは、記憶部32と同様の機能を有するが、所望の色度誤差に応じて決められた面積誤差を満たすように決められたドット幅測定半径比tを示すドット幅測定半径比情報を保持している点が異なる。ここで、例えば、図7において、曲線W71上の点で面積誤差Δsが0になる場合のドット幅測定半径比tの一例は、1.81である。記憶部32bは、例えば、上述した面積誤差Δsが0になる場合のドット幅測定半径比tである1.81を示す情報を保持する。
比取得部36bは、例えば、そのドット幅測定半径比情報を記憶部32bから読み出すことで取得する。そして、比取得部36bは、取得したドット幅測定半径比情報を測定距離決定部37に出力する。これにより、測定距離決定部37は、ドット幅wと測定角度と比取得部36bが取得したドット幅測定半径比情報とに基づいて測定距離lを決定する。
そして、カラー表示装置10と色度測定装置20と間の距離を決定した測定距離lにすることで、ドット幅測定半径比tが上記のいずれかになる。これにより、色度測定条件算出装置30bは、面積誤差Δsを0%にすることができ、色度誤差を0にすることができる。それゆえ、色度測定条件算出装置30bは、短い測定距離lでも色度誤差を抑えることができる。
そして、カラー表示装置10と色度測定装置20と間の距離を決定した測定距離lにすることで、ドット幅測定半径比tが上記のいずれかになる。これにより、色度測定条件算出装置30bは、面積誤差Δsを0%にすることができ、色度誤差を0にすることができる。それゆえ、色度測定条件算出装置30bは、短い測定距離lでも色度誤差を抑えることができる。
図11は、Rの画素の面積とGの画素の面積とBの画素の面積が三つとも等しくなるドット幅測定半径比tに関するテーブルT120である。
図11のテーブルに示されたドット幅測定半径比tは、Rの画素の面積とGの画素の面積とBの画素の面積が三つとも等しくなるドット幅測定半径比tである。面積誤差の最大値は、そのドット幅測定半径比tで、測定エリアの中心位置を動かした場合に、測定範囲の面積(以下、測定面積という)の1/3の面積に対するRの画素、Gの画素またはBの画素の面積比率が最大となるときの面積比率である。また、誤差0%の測定中心とは、そのドット幅測定半径比tでRの画素の面積とGの画素の面積とBの画素の面積が三つとも等しくなる場合の測定範囲の中心位置である。ここで、Dot境は、測定範囲の中心位置がRの画素、Gの画素またはBの画素のドットの端であることを意味する。また、Dot中央は、測定範囲の中心位置がRの画素、Gの画素またはBの画素のドットの中央であることを意味する。
図11のテーブルに示されたドット幅測定半径比tは、Rの画素の面積とGの画素の面積とBの画素の面積が三つとも等しくなるドット幅測定半径比tである。面積誤差の最大値は、そのドット幅測定半径比tで、測定エリアの中心位置を動かした場合に、測定範囲の面積(以下、測定面積という)の1/3の面積に対するRの画素、Gの画素またはBの画素の面積比率が最大となるときの面積比率である。また、誤差0%の測定中心とは、そのドット幅測定半径比tでRの画素の面積とGの画素の面積とBの画素の面積が三つとも等しくなる場合の測定範囲の中心位置である。ここで、Dot境は、測定範囲の中心位置がRの画素、Gの画素またはBの画素のドットの端であることを意味する。また、Dot中央は、測定範囲の中心位置がRの画素、Gの画素またはBの画素のドットの中央であることを意味する。
図11に示されたドット幅測定半径比t値の時には、面積誤差の最大値が全て5%以下である。また、ドット幅測定半径比t値が大きくなるほど、面積誤差の最大値が小さくなる傾向にある。例えば、面積誤差を0.058%以下にする場合、図11に示されたドット幅測定半径比t値のうち9.34以上のドット幅測定半径比tを選択されて、選択されたドット幅測定半径比tが予め記憶部32bに記憶されていればよい。これにより、測定範囲の中心位置に寄らず、面積誤差を0.058%以下にすることができるので、色度誤差を0.001以下にすることができる。
また、面積誤差を0.058%以下にしつつ測定距離lをなるべく短くする場合、ドット幅測定半径比tとして9.34が選択されて、選択されたドット幅測定半径比tが予め記憶部32bに記憶されていればよい。これにより、色度測定条件算出装置30bは、測定範囲の中心位置に寄らずに面積誤差を0.058%以下にすることができるドット幅測定半径比tのうちで最も小さいドット幅測定半径比tを用いる。そのため、色度測定条件算出装置30bは、測定範囲の中心位置に寄らずに色度誤差を0.001以下にできる中で最も短い測定距離lを算出することができる。
図12を用いて面積誤差の最大値について説明する。図12は、ドット幅測定半径比tが1.81の場合の面積誤差の一例を示す図である。同図において、縦軸は測定面積の1/3の面積に対するR、G、又はBの画素の面積比率であり、横軸は相対的な測定中心位置である。同図において、測定面積の1/3の面積に対するRの画素の面積比率を示す曲線W121が示されている。また、測定面積の1/3の面積に対するGの画素の面積比率を示す曲線W122が示されている。また、測定面積の1/3の面積に対するBの画素の面積比率を示す曲線W123が示されている。
ここで、Rの画素、Gの画素、Bの画素が向かって左からカラー表示装置10に表示されていることを前提にする。そして、測定位置の値が0というのは、Rの画素の向かって左端の位置を意味する。測定位置0.5はRの画素の中央の位置を意味する。また、測定位置の値が1というのは、Rの画素の向かって右端でかつGの画素の向かって左端の位置を意味する。また、測定位置の値が1.5というのは、Gの画素の中央の位置を意味する。また、測定位置の値が2というのは、Gの画素の向かって右端でかつBの画素の向かって左端の位置を意味する。また、測定位置の値が2.5というのは、Bの画素の中央の位置を意味する。測定位置の値が3というのは、Bの画素の向かって右端の位置を意味する。
曲線W121、W122またはW123は、それぞれ測定位置の値が0.5、1.5または2.5で最大値4.3%を取ることが示されている。また、曲線W121は、測定位置の値が1.28または2.73で最小値-4.6%を取ることが示されている。また、曲線W122は、測定位置の値が0.73または2.28で最小値-4.6%を取ることが示されている。また、曲線W123は、測定位置の値が0.28または1.73で最小値-4.6%を取ることが示されている。以上により、ドット幅測定半径比tが1.81の場合の面積誤差は、プラス方向の最大誤差が4.3%で、マイナス方向の最小誤差が-4.6%である。これらの値は、図11のドット幅測定半径比tが1.81の場合の面積誤差と同一である。このように、相対的な測定中心位置に応じて、測定面積の1/3の面積に対するRの画素、Gの画素またはBの画素の面積比率が変化する。
以上、第2の実施形態における色度測定条件算出装置30bの比取得部36bは、所望の色度誤差に応じて決められた面積誤差を満たすように決められたドット幅測定半径比tを記憶部32bから取得する。そして、測定距離決定部37は、比取得部36bが取得したドット幅測定半径比tとドット幅wと測定角度θとに基づいて、測定距離lを決定する。これにより、色度測定条件算出装置30bは、所望の色度誤差に応じて決められた面積誤差を満たすように決められたドット幅測定半径比tとして、第1の実施形態よりも小さなドット幅測定半径比tを取ることができる。そのため、色度測定条件算出装置30bは、測定半径rを小さくすることができるので、測定距離lを短くすることができる。また、色度測定条件算出装置30bは、このドット幅測定半径比tを用いることで、上記面積誤差を満たすことができ、所望の色度誤差を達成することができる。以上により、色度測定装置20は、短い測定距離lで、精度良く色度を評価することができる。
<第2の実施形態の変形例>
続いて、第2の実施形態の変形例について説明する。図13のテーブルT131に示すように、図11のテーブルT110で示したドット幅測定半径比t以外のドット幅測定半径比tにてRの画素の面積とGの画素の面積とBの画素の面積の三つが全て等しくなる測定中心位置が存在する。しかし、図13のテーブルT131では、測定中心位置を横方向へずらしたときの面積誤差の最大値が図11のテーブルT110に比べて大きくなる。
続いて、第2の実施形態の変形例について説明する。図13のテーブルT131に示すように、図11のテーブルT110で示したドット幅測定半径比t以外のドット幅測定半径比tにてRの画素の面積とGの画素の面積とBの画素の面積の三つが全て等しくなる測定中心位置が存在する。しかし、図13のテーブルT131では、測定中心位置を横方向へずらしたときの面積誤差の最大値が図11のテーブルT110に比べて大きくなる。
図13は、ドット幅測定半径比tに関するテーブルの他の例である。同図のテーブルT131には、ドット幅測定半径比tと、そのドット幅測定半径比tで測定中心位置を変化させたときの面積誤差の最大値と、そのドット幅測定半径比tのときに、Rの画素の面積とGの画素の面積とBの画素の面積の三つが全て等しくなる測定中心位置との組が示されている。
図13のテーブルT132には、測定中心位置が0のときと、測定中心位置が0.5のときで面積誤差の最大値が同じとなるドット幅測定半径比tと、そのドット幅測定半径比tで測定中心位置を振ったときの面積誤差の最大値との組が示されている。テーブルT132のドット幅測定半径比tでは、Rの画素の面積、Gの画素の面積、Bの画素の面積それぞれが異なる面積である。
図13のテーブルT131において、ドット幅測定半径比tが1.89の場合、面積誤差はプラス方向に7.9%、マイナス方向に-5.8%である。図13のテーブルT132において、ドット幅測定半径比tが1.84の場合、面積誤差はプラス方向に3.7%、マイナス方向に-5.0%である。このように、テーブルT131とテーブルT132との間で、ドット幅測定半径比tの値が一番近い同士で面積誤差の最大値を比べると、テーブルT132では、テーブルT131に比べて、プラス方向、マイナス方向ともに面積誤差の最大値が小さい。
一方、図11のテーブルT110のi行目(iはインデックスで正の整数)の面積誤差と、テーブルT132の同じi行目における面積誤差は類似している。図11のテーブルT110のi行目(iはインデックスで正の整数)のドット幅測定半径比tとテーブルT132の同じi行目におけるドット幅測定半径比tとの間の値(以下、中間のドット幅測定半径比tという)における面積誤差は、テーブルT110のi行目(iはインデックスで正の整数)のドット幅測定半径比tと類似する。例えば、ドット幅測定半径比tが1.81から1.84までの値では、面積誤差が類似する。
以上により、測定距離決定部37は、上記の中間のドット幅測定半径比tをドット幅測定半径比tとして用いることで、測定距離lを設定してもよい。その場合、記憶部32bには、上記中間のドット幅測定半径比tを示す情報が記憶されていればよい。そして、比取得部36bがその中間のドット幅測定半径比tを示す情報を記憶部32bから読み出せばよい。
このようにすることで、実際の測定中心位置に誤差があっても、例えば、測定中心位置がRの画素の向かって左端とRの画素の中央との間で変動する限りは、面積誤差がほとんど変わらない。このため、面積誤差を予め決められた面積誤差範囲内に収めることができるので、色度誤差を予め決められた誤差範囲に収めることができる。
また、実際の測定距離lに誤差があり、測定半径rが変動してドット幅測定半径比tが多少変化しても、面積誤差がほとんど変わらない。このため、面積誤差を予め決められた面積誤差範囲内に収めることができるので、色度誤差を予め決められた誤差範囲に収めることができる。その結果、色度測定装置20は、色度を精度良く測定することができる。
また、実際の測定距離lに誤差があり、測定半径rが変動してドット幅測定半径比tが多少変化しても、面積誤差がほとんど変わらない。このため、面積誤差を予め決められた面積誤差範囲内に収めることができるので、色度誤差を予め決められた誤差範囲に収めることができる。その結果、色度測定装置20は、色度を精度良く測定することができる。
なお、実際にはカラー表示装置10のRGBそれぞれの画素の境界の形状や、カラー表示装置10のブラックマスク(非表示の素子の部分)の形状に合わせて、ドット幅測定半径比tを変更しtもよい。これにより、色度測定条件算出装置30は、面積誤差をより小さくして、色度誤差をより小さくすることができる。
なお、記憶部32bは、面積誤差Δsが0になる場合のドット幅測定半径比tのうちいずれか一つを保持したが、これに限らず、少なくとも一つのドット幅測定半径比tを保持していればよい。その場合、比取得部36bは、記憶部32bに記憶されているドット幅測定半径比tのうち最も小さいドット幅測定半径比tを選択して読み出してもよい。これにより、色度測定条件算出装置30bは、最も小さいドット幅測定半径比tを選択した場合、測定半径rが最も小さくなるので、必然的に測定距離lが最も短くなる。その結果、色度測定条件算出装置30bは、選択できるドット幅測定半径比tの中で、測定距離lを短くすることができる。
また、記憶部32bは、面積誤差Δsが0になる場合のドット幅測定半径比tのうちいずれか一つを保持したが、面積誤差Δsが予め決められた範囲(例えば、±0.058%以内)となる場合のドット幅測定半径比tを少なくとも一つ保持していればよい。ここで、予め決められた範囲は、所望の色度誤差を満たすように決められている。
これにより、色度測定条件算出装置30bは、面積誤差Δsを予め決められた範囲にすることができるので、所望の色度誤差を満たすようにすることができる。
これにより、色度測定条件算出装置30bは、面積誤差Δsを予め決められた範囲にすることができるので、所望の色度誤差を満たすようにすることができる。
<第1の実施形態と第2の実施形態に共通する変形例>
第1の実施形態と第2の実施形態において、色度測定装置20が測定する前に、色度測定装置20が測定する測定領域の中心(測定中心位置)を、カラー表示装置10に表示された赤の画素の中央付近または、緑と青の画素の境目付近に設定してもよい。ここで、赤の画素の中央付近とは、赤の画素の中央から予め決められた距離だけ離れた位置までの範囲である。緑と青の画素の境目付近とは、緑と青の画素の境目から予め決められた距離だけ離れた位置までの範囲である。
第1の実施形態と第2の実施形態において、色度測定装置20が測定する前に、色度測定装置20が測定する測定領域の中心(測定中心位置)を、カラー表示装置10に表示された赤の画素の中央付近または、緑と青の画素の境目付近に設定してもよい。ここで、赤の画素の中央付近とは、赤の画素の中央から予め決められた距離だけ離れた位置までの範囲である。緑と青の画素の境目付近とは、緑と青の画素の境目から予め決められた距離だけ離れた位置までの範囲である。
例えば、以下のようにして、測定中心位置を、カラー表示装置10に表示された赤の画素の中央付近または、緑と青の画素の境目付近に調整する。まず、色度測定装置20の測定角度を小さくして、色度測定装置20が出射する光がカラー表示装置10に投影されるスポットの径を小さくする。そして、スポットの径が赤の画素の中央付近または、緑と青の画素の境目付近になるように、色度測定装置20を動かす。ここで、色度測定装置20の位置を動かすのは、人であっても装置であってもよい。なお、動かす対象は色度測定装置20に限らず、カラー表示装置10を動かしてもよいし、色度測定装置20とカラー表示装置10とを両方動かしてもよい。
これにより、測定中心位置をカラー表示装置10に表示された赤の画素の中央付近または、緑と青の画素の境目付近にすることで、色度誤差を小さくすることができる。以下、色度誤差を小さくすることができる理由について、図14と図15を用いて説明する。
図14は、ドット幅測定半径比tが25の場合の面積誤差図と色度誤差図の一例である。同図における面積誤差図G141には、Rの画素、Gの画素、Bの画素それぞれについて、測定面積の1/3の面積に対する面積比率と相対的な測定中心位置との関係を示す曲線W142、143、144がそれぞれ示されている。面積誤差図G141の縦軸は測定面積の1/3の面積に対する面積比率で、横軸は相対的な測定中心位置である。面積誤差図G141と、色度誤差図G145において、相対的な測定中心位置の定義は、図12と同一である。
また、色度誤差図G145には、色度xの色度変化分Δxと相対的な測定中心位置との関係を示す曲線W146が示されている。同様に、色度yの色度変化分Δyと相対的な測定中心位置との関係を示す曲線W147が示されている。色度誤差図G145の縦軸は色度変化分で、横軸は相対的な測定中心位置である。
相対的な測定中心位置が0.5すなわちRの画素の中央の位置を測定中心とする場合、領域R148が示すように、色度変化分Δx、色度変化分Δyともに相対的に小さく、それらの値はともに-0.001から0.001の範囲に収まっている。また、相対的な測定中心位置が2すなわちGの画素とBの画素の境目を測定中心とする場合、領域R149が示すように、色度変化分Δx、色度変化分Δyともに相対的に小さく、それらの値はともに-0.001から0.001の範囲に収まっている。
図15は、ドット幅測定半径比tが30の場合の面積誤差図と色度誤差図の一例である。
同図における面積誤差図G141には、Rの画素、Gの画素、Bの画素それぞれについて、測定面積の1/3の面積に対する面積比率と相対的な測定中心位置との関係を示す曲線W152、153、154がそれぞれ示されている。面積誤差図G151の縦軸は測定面積の1/3の面積に対する面積比率で、横軸は相対的な測定中心位置である。面積誤差図G151と、色度誤差図G155において、相対的な測定中心位置の定義は、図12と同一である。
同図における面積誤差図G141には、Rの画素、Gの画素、Bの画素それぞれについて、測定面積の1/3の面積に対する面積比率と相対的な測定中心位置との関係を示す曲線W152、153、154がそれぞれ示されている。面積誤差図G151の縦軸は測定面積の1/3の面積に対する面積比率で、横軸は相対的な測定中心位置である。面積誤差図G151と、色度誤差図G155において、相対的な測定中心位置の定義は、図12と同一である。
また、色度誤差図G155には、色度xの色度変化分Δxと相対的な測定中心位置との関係を示す曲線W156が示されている。同様に、色度yの色度変化分Δyと相対的な測定中心位置との関係を示す曲線W157が示されている。色度誤差図G155の縦軸は色度変化分で、横軸は相対的な測定中心位置である。
相対的な測定中心位置が0.5すなわちRの画素の中央の位置を測定中心とする場合、領域R158が示すように、色度変化分Δx、色度変化分Δyともに相対的に小さく、それらの値はともに-0.0005から0.0005の範囲に収まっている。また、相対的な測定中心位置が2すなわちGの画素とBの画素の境目を測定中心とする場合、領域R149が示すように、色度変化分Δx、色度変化分Δyともに相対的に小さく、それらの値はともに-0.0005から0.0005の範囲に収まっている。
図14の面積誤差図G141及び図15の面積誤差図G151を参照すると、Gの面積とBの面積が等しくなる測定中心位置は、Rの画素の中央またはGの画素とBの画素の境目である。図14の色度誤差図G145及び図15の色度誤差図G155を参照すると、このRの画素の中央またはGの画素とBの画素の境目で、色度変化分Δx、色度変化分Δyともに相対的に小さくなっている。例えば、図14の色度誤差図G145において、相対的な測定中心位置が0すなわち測定中心位置がRの画素の向かって左端に位置する場合、色度変化分Δyは約-0.0012である。一方、相対的な測定中心位置が0.5すなわち測定中心位置がRの画素の中央に位置する場合、色度変化分Δyは約0.0001であるので、測定中心位置がRの画素の向かって左端に位置する場合よりも色度変化分Δyが小さくなっている。以上により、色度測定装置20の測定中心位置を、赤の画素の中央、または緑と青の画素の境目にすることで、色度誤差を小さくすることができる。
なお、第1の実施形態では、一例としてドット幅測定半径比tを30以上としたが、Rの画素の中央またはGの画素とBの画素の境目を測定中心位置に合わせることで色度誤差を小さくできるので、Rの画素の中央またはGの画素とBの画素の境目を測定中心位置にする場合、例えば、ドット幅測定半径比tを25以上としてもよい。
また、第1の実施形態と第2の実施形態では、色度測定装置20と色度測定条件算出装置(30または30b)とを別々の装置として説明したが、色度測定装置20が色度測定条件算出装置(30または30b)を備える構成であってもよい。その変形の一例として、第1の実施形態における色度測定条件算出装置30を備える色度測定装置20bについて図16を用いて説明する。
図16は、変形例である色度測定装置20bの構成を示す概略ブロック図である。色度測定装置20bは、制御部21と、表示部22と、色度測定条件算出装置30とを備える。
制御部21は、色度測定条件算出装置30に測定距離lを算出させる。具体的には、例えば、色度測定条件算出装置30に対して測定距離lを要求する。色度測定条件算出装置30は、例えば、その要求に応じて測定距離lを算出し、算出した測定距離lを示す測定距離情報を色度測定条件算出装置30に出力する。
制御部21は、色度測定条件算出装置30に測定距離lを算出させる。具体的には、例えば、色度測定条件算出装置30に対して測定距離lを要求する。色度測定条件算出装置30は、例えば、その要求に応じて測定距離lを算出し、算出した測定距離lを示す測定距離情報を色度測定条件算出装置30に出力する。
制御部21は、色度測定条件算出装置30から入力された測定距離情報を表示部22に表示させる。
なお、変形例である色度測定装置20bは、第1の実施形態における色度測定条件算出装置30ではなく、第2の実施形態における色度測定条件算出装置30bを備える構成であってもよい。
なお、変形例である色度測定装置20bは、第1の実施形態における色度測定条件算出装置30ではなく、第2の実施形態における色度測定条件算出装置30bを備える構成であってもよい。
また、本実施形態の色度測定条件算出装置(30または30b)または色度測定装置20bの各処理を実行するためのプログラムをコンピュータ読み取り可能な記録媒体に記録して、当該記録媒体に記録されたプログラムをコンピュータシステムに読み込ませ、実行することにより、色度測定条件算出装置(30または30b)または色度測定装置20bに係る上述した種々の処理を行ってもよい。
なお、ここでいう「コンピュータシステム」とは、OSや周辺機器等のハードウェアを含むものであってもよい。また、「コンピュータシステム」は、WWWシステムを利用している場合であれば、ホームページ提供環境(あるいは表示環境)も含むものとする。また、「コンピュータ読み取り可能な記録媒体」とは、フレキシブルディスク、光磁気ディスク、ROM、フラッシュメモリ等の書き込み可能な不揮発性メモリ、CD-ROM等の可搬媒体、コンピュータシステムに内蔵されるハードディスク等の記憶装置のことをいう。
さらに「コンピュータ読み取り可能な記録媒体」とは、インターネット等のネットワークや電話回線等の通信回線を介してプログラムが送信された場合のサーバやクライアントとなるコンピュータシステム内部の揮発性メモリ(例えばDRAM(Dynamic Random Access Memory))のように、一定時間プログラムを保持しているものも含むものとする。また、上記プログラムは、このプログラムを記憶装置等に格納したコンピュータシステムから、伝送媒体を介して、あるいは、伝送媒体中の伝送波により他のコンピュータシステムに伝送されてもよい。ここで、プログラムを伝送する「伝送媒体」は、インターネット等のネットワーク(通信網)や電話回線等の通信回線(通信線)のように情報を伝送する機能を有する媒体のことをいう。また、上記プログラムは、前述した機能の一部を実現するためのものであっても良い。さらに、前述した機能をコンピュータシステムにすでに記録されているプログラムとの組み合わせで実現できるもの、いわゆる差分ファイル(差分プログラム)であっても良い。
以上、本発明の実施形態について図面を参照して詳述したが、具体的な構成はこの実施形態に限られるものではなく、この発明の要旨を逸脱しない範囲の設計等も含まれる。
本発明のいくつかの態様における色度測定条件算出方法によれば、精度良く色度を評価することができる。
1 色度測定システム
10 カラー表示装置
20 色度測定装置
21 制御部
22 表示部
30 色度測定条件算出装置
31 入力部
32、32b 記憶部
33 制御部
34 測定角度取得部
35 ドット幅取得部
36、36b 比取得部
37 測定距離決定部
38 一時記憶部
10 カラー表示装置
20 色度測定装置
21 制御部
22 表示部
30 色度測定条件算出装置
31 入力部
32、32b 記憶部
33 制御部
34 測定角度取得部
35 ドット幅取得部
36、36b 比取得部
37 測定距離決定部
38 一時記憶部
Claims (6)
- カラー表示装置のドット幅と前記カラー表示装置の色度を測定する色度測定装置の測定領域の大きさに応じた値との比であるドット幅比が、所望の色度誤差に応じて決められた値であり、
前記ドット幅比に基づいて、前記カラー表示装置と前記色度測定装置との間の距離である測定距離を決定する測定距離決定手順を有することを特徴とする色度測定条件算出方法。 - 前記ドット幅比は、前記所望の色度誤差に応じて決められる許容値であって前記色度測定装置の測定範囲に含まれる画素の色毎の面積誤差の許容値に基づいて決められていることを特徴とする請求項1に記載の色度測定条件算出方法。
- カラー表示装置のドット幅と前記カラー表示装置の色度を測定する色度測定装置の測定領域の大きさに応じた値との比であるドット幅比が、所望の色度誤差に応じて決められた値であり、
前記ドット幅比に基づいて、前記カラー表示装置と前記色度測定装置との間の距離である測定距離を決定する測定距離決定手順と、
前記色度測定装置が、前記カラー表示装置から前記測定距離だけ離れた位置から前記カラー表示装置の色度を測定する測定手順と、
を有することを特徴とする色度測定方法。 - 前記測定手順の前に、前記色度測定装置が測定する測定領域の中心を、前記カラー表示装置に表示された赤の画素の中央付近、または緑と青の画素の境目付近に設定する設定手順を更に有することを特徴とする請求項3に記載の色度測定方法。
- カラー表示装置のドット幅と前記カラー表示装置の色度を測定する色度測定装置の測定領域の大きさに応じた値との比であるドット幅比が、所望の色度誤差に応じて決められた値であり、前記ドット幅比に基づいて、前記カラー表示装置と前記色度測定装置との間の距離である測定距離を決定する測定距離決定部を備えることを特徴とする色度測定条件算出装置。
- 請求項5に記載の色度測定条件算出装置を備えることを特徴とする色度測定装置。
Applications Claiming Priority (2)
| Application Number | Priority Date | Filing Date | Title |
|---|---|---|---|
| JP2012155681 | 2012-07-11 | ||
| JP2012-155681 | 2012-07-11 |
Publications (1)
| Publication Number | Publication Date |
|---|---|
| WO2014010519A1 true WO2014010519A1 (ja) | 2014-01-16 |
Family
ID=49915976
Family Applications (1)
| Application Number | Title | Priority Date | Filing Date |
|---|---|---|---|
| PCT/JP2013/068469 Ceased WO2014010519A1 (ja) | 2012-07-11 | 2013-07-05 | 色度測定条件算出方法、色度測定方法、色度測定条件算出装置及び色度測定装置 |
Country Status (1)
| Country | Link |
|---|---|
| WO (1) | WO2014010519A1 (ja) |
Cited By (1)
| Publication number | Priority date | Publication date | Assignee | Title |
|---|---|---|---|---|
| CN114046882A (zh) * | 2021-12-07 | 2022-02-15 | 亮风台(上海)信息科技有限公司 | 一种获取光学设备的颜色测试信息的方法与设备 |
Citations (5)
| Publication number | Priority date | Publication date | Assignee | Title |
|---|---|---|---|---|
| JP2005318460A (ja) * | 2004-04-30 | 2005-11-10 | Fuji Xerox Co Ltd | プロファイル作成装置およびプログラム |
| JP2006349835A (ja) * | 2005-06-14 | 2006-12-28 | Dainippon Printing Co Ltd | カラーモニタのキャリブレーション方法、カラーモニタのキャリブレーションプログラム及びカラーモニタのカラーマネジメントシステム等 |
| JP2007093466A (ja) * | 2005-09-29 | 2007-04-12 | Fujifilm Corp | カラー画像表示装置の評価支援方法及びその装置並びに評価支援プログラム |
| JP2008528341A (ja) * | 2005-02-02 | 2008-07-31 | デラウェア・キャピタル・フォーメーション・インク | 画像内カラー計測を用いたウェブ印刷機のカラー制御 |
| JP2012244555A (ja) * | 2011-05-23 | 2012-12-10 | Sharp Corp | 測色位置決定方法および表示装置 |
-
2013
- 2013-07-05 WO PCT/JP2013/068469 patent/WO2014010519A1/ja not_active Ceased
Patent Citations (5)
| Publication number | Priority date | Publication date | Assignee | Title |
|---|---|---|---|---|
| JP2005318460A (ja) * | 2004-04-30 | 2005-11-10 | Fuji Xerox Co Ltd | プロファイル作成装置およびプログラム |
| JP2008528341A (ja) * | 2005-02-02 | 2008-07-31 | デラウェア・キャピタル・フォーメーション・インク | 画像内カラー計測を用いたウェブ印刷機のカラー制御 |
| JP2006349835A (ja) * | 2005-06-14 | 2006-12-28 | Dainippon Printing Co Ltd | カラーモニタのキャリブレーション方法、カラーモニタのキャリブレーションプログラム及びカラーモニタのカラーマネジメントシステム等 |
| JP2007093466A (ja) * | 2005-09-29 | 2007-04-12 | Fujifilm Corp | カラー画像表示装置の評価支援方法及びその装置並びに評価支援プログラム |
| JP2012244555A (ja) * | 2011-05-23 | 2012-12-10 | Sharp Corp | 測色位置決定方法および表示装置 |
Cited By (1)
| Publication number | Priority date | Publication date | Assignee | Title |
|---|---|---|---|---|
| CN114046882A (zh) * | 2021-12-07 | 2022-02-15 | 亮风台(上海)信息科技有限公司 | 一种获取光学设备的颜色测试信息的方法与设备 |
Similar Documents
| Publication | Publication Date | Title |
|---|---|---|
| CN112567736B (zh) | 用于显示设备的次网格校准的方法和系统 | |
| JP7660348B2 (ja) | 投影システム及びその映像均一度補償方法 | |
| US9317939B2 (en) | Method and device for image conversion from RGB signals to RGBW signals | |
| CN105427788B (zh) | 自动校调显示装置亮度和色度的方法及系统 | |
| US9886881B2 (en) | Method and device for image conversion from RGB signals into RGBW signals | |
| JP4651647B2 (ja) | 新しい色温度点を見付ける方法及びその装置 | |
| CN113495709B (zh) | 色彩校正方法、ap芯片、终端和存储介质 | |
| WO2018113611A1 (zh) | 液晶显示器件 | |
| US10819885B2 (en) | Gamma value tuning method and device of display panel | |
| US20150138222A1 (en) | Image processing device and multi-projection system | |
| KR20180050054A (ko) | 전지 장치, 디스플레이 장치 및 그의 제어 방법 | |
| US20200033595A1 (en) | Method and system for calibrating a wearable heads-up display having multiple exit pupils | |
| US9161000B2 (en) | Light parameter measurement method and device, screen adjustment method and electronic device | |
| CN101163253B (zh) | 寻找新色温点的方法及其装置 | |
| EP3139598B1 (en) | Wearable projection device and projection method | |
| US9508317B2 (en) | Display evaluation device, display evaluation method, and non-transitory computer readable medium | |
| US9666162B2 (en) | Method and apparatus for converting image from RGB signals to RGBY signals | |
| JP2015119344A (ja) | 撮像素子の感度分布の測定装置及びその制御方法、画像表示装置のキャリブレーション装置及びその制御方法 | |
| WO2014010519A1 (ja) | 色度測定条件算出方法、色度測定方法、色度測定条件算出装置及び色度測定装置 | |
| CN110896466B (zh) | 一种显示装置的白平衡调整方法及系统 | |
| CN118411962B (zh) | 电子显示设备色域校正方法、装置及设备 | |
| US20170289517A1 (en) | Method and display system for adjusting output image of display | |
| WO2019011327A1 (zh) | 采用rgb叠加防vr设备色散的方法及电子设备 | |
| CN118414576A (zh) | 显示面板的调节方法、装置、电子设备和存储介质 | |
| JP2011053397A (ja) | 画像表示装置および画像調整方法 |
Legal Events
| Date | Code | Title | Description |
|---|---|---|---|
| 121 | Ep: the epo has been informed by wipo that ep was designated in this application |
Ref document number: 13816940 Country of ref document: EP Kind code of ref document: A1 |
|
| NENP | Non-entry into the national phase |
Ref country code: DE |
|
| 122 | Ep: pct application non-entry in european phase |
Ref document number: 13816940 Country of ref document: EP Kind code of ref document: A1 |
|
| NENP | Non-entry into the national phase |
Ref country code: JP |