WO2014010071A1 - データ分析支援方法及びシステム - Google Patents
データ分析支援方法及びシステム Download PDFInfo
- Publication number
- WO2014010071A1 WO2014010071A1 PCT/JP2012/067887 JP2012067887W WO2014010071A1 WO 2014010071 A1 WO2014010071 A1 WO 2014010071A1 JP 2012067887 W JP2012067887 W JP 2012067887W WO 2014010071 A1 WO2014010071 A1 WO 2014010071A1
- Authority
- WO
- WIPO (PCT)
- Prior art keywords
- template
- data
- processing
- analysis support
- function
- Prior art date
Links
Images


Classifications
-
- G—PHYSICS
- G06—COMPUTING; CALCULATING OR COUNTING
- G06Q—INFORMATION AND COMMUNICATION TECHNOLOGY [ICT] SPECIALLY ADAPTED FOR ADMINISTRATIVE, COMMERCIAL, FINANCIAL, MANAGERIAL OR SUPERVISORY PURPOSES; SYSTEMS OR METHODS SPECIALLY ADAPTED FOR ADMINISTRATIVE, COMMERCIAL, FINANCIAL, MANAGERIAL OR SUPERVISORY PURPOSES, NOT OTHERWISE PROVIDED FOR
- G06Q10/00—Administration; Management
- G06Q10/06—Resources, workflows, human or project management; Enterprise or organisation planning; Enterprise or organisation modelling
Definitions
- the present invention relates to a data analysis support method and system for supporting data analysis, and more particularly to analysis support technology when analysis target data and data processing are not fixed.
- Patent Literature 1 describes that an analysis procedure detected on the computer side is recorded in a database of a management server, and the recorded analysis procedure is shared and reused by a third party.
- Patent Document 2 provides an optimized process definition, in other words, reusing an existing process and creating a new process by using an existing process context and a new executable process. Presenting is disclosed.
- past analysis procedures can be reproduced with a technique in which analysis procedures are recorded and reused by editing or restructuring.
- editing the past analysis procedure it is possible to partially reuse and perform a new analysis.
- the editing makes it impossible to reproduce the part after the edited part, the technology that automatically changes other processes or presents candidates for changing other processes, It has been demanded.
- An object of the present invention is to provide a data analysis support capable of solving the above-described problems, editing past analysis procedures, automatically changing other processes, or presenting candidates for changing other processes. It is to provide a method and system.
- a data analysis support method using a computer wherein the computer performs input data creation processing on the extracted data to create analysis target data
- a data analysis support method for performing data analysis support work by executing a data processing function for performing data processing on the data to generate processing result data and a data visualization function for performing visualization processing on the data for visualization.
- the data analysis support system includes a storage unit that stores a template database that accumulates a plurality of templates, and a processing unit that executes the templates.
- a storage unit that stores a template database that accumulates a plurality of templates
- a processing unit that executes the templates.
- a data analysis support system configured to perform data analysis support work by executing a visualization function.
- FIG. 10 is a diagram illustrating in detail the contents of S907 of FIG.
- FIG. 16 is a diagram detailing the process of S1504 of FIG. 15 according to the second embodiment. It is a flowchart which shows an example of the procedure of the operation
- FIG. 19 is a diagram illustrating in detail the contents of S1807 in FIG.
- FIG. 19 is a diagram illustrating in detail the contents of S1807 in FIG. 18 according to the second embodiment, and is a flowchart illustrating an example of a procedure of operation 4.
- FIG. 19 is a diagram illustrating in detail the contents of S1807 in FIG. 18 according to the second embodiment, and is a flowchart illustrating an example of a procedure of operation 4. It is a figure which shows the specific example of the operation
- FIG. 23 is a diagram detailing the process of S2204 of FIG. 22 according to a third embodiment. It is a flowchart which shows an example of the procedure of the operation
- FIG. 23 is a diagram detailing the process of S2204 of FIG. 22 according to a third embodiment. It is a flowchart which shows an example of the procedure of the operation
- FIG. 26 is a diagram illustrating in detail the contents of S2512 of FIG. 25 according to the third embodiment, and is a flowchart showing an example of a procedure of operation 4.
- FIG. 26 is a diagram illustrating in detail the contents of S2512 of FIG. 25 according to the third embodiment, and is a flowchart showing an example of a procedure of operation 4.
- FIG. 26 is a diagram illustrating in detail the contents of S2512 of FIG. 25 according to the third embodiment, and is a flowchart showing an example of a procedure of operation 4. It is a figure which shows the specific example of the operation
- a data creation function for creating analysis target data is a data creation work or data creation unit
- a data processing function for performing data processing on analysis target data and creating process result data is a data processing work or data processing unit
- a data visualization function that performs a visualization process on the processing result data may be referred to as a data visualization operation or a data visualization unit.
- FIG. 1 is a block diagram of a configuration example of the analysis support system according to the present embodiment.
- the system shown in FIG. 1 includes a computer 101, a display 102 that functions as a display unit, an input device 103, and a database (DB) 104.
- the computer 101 and the DB 104 are connected to each other via the network 105.
- the computer 101 is used when the user 100 performs analysis work. Furthermore, various functions related to the analysis work are provided, logs at the time of function execution are collected, and templates 100 are extracted and recommended according to the situation to support the user 100's analysis work.
- the computer 101 is assumed to be a general PC (Personal Computer).
- the computer 101 includes a processor serving as a central processing unit (CPU) (not shown), a memory serving as a storage unit, and an interface serving as an interface unit.
- the processor executes various processes by processing a program stored in the memory.
- the memory stores a program and data for executing processing. Interfaces include those connected to the input device 103 such as a keyboard and mouse, those connected to the display 102, and those connected to the DB 104 etc. via the network 105.
- the DB 104 is a database that holds various data such as information related to companies, various statistical data, time series data such as sensors, and Web access logs. As shown in FIG. 1, the DB 104 may be configured to be stored in an external storage device (not shown) and connected to the computer 101 via the network 105, or to be included in the computer 101. It may be configured.
- the computer 101 includes an input data creation unit 110, a data processing unit 120, a data visualization unit 130, a log recording unit 140, a log DB 141, a template execution unit 150, a template processing unit 160, a template recommendation unit 170, and a template DB 180.
- the input data creation unit 110, the data processing unit 120, the data visualization unit 130, the log recording unit 140, the log DB 141, the template execution unit 150, the template processing unit 160, the template recommendation unit 170, and the template DB 180 are, for example, programs that are stored in the memory.
- the log DB 141 and the template DB 180 indicate a template database of logs, respectively, and are accumulated in a memory that is a storage unit in the omitted PC.
- the input data creation unit 110 extracts necessary data from the DB 104 in accordance with an instruction from the user 100 or the template execution unit 150, and creates analysis target data by performing input data creation processing on the extracted data.
- the data processing unit 120 performs data processing on the analysis target data created by the input data creation unit 110 according to an instruction from the user 100 or the template execution unit 150, and creates processing result data.
- the data visualization unit 130 performs a visualization process on the processing result data created by the data processing unit 120 according to an instruction from the user 100 or the template execution unit 150 to visualize the data.
- the log recording unit 140 records each process of the input data creation unit 110, the data processing unit 120, and the data visualization unit 130 in the log DB 141.
- the template execution unit 150 takes out a template from the template DB 180 according to an instruction from the user 100, and instructs the input data creation unit 110, the data processing unit 120, and the data visualization unit 130 according to the contents of the template to execute analysis processing.
- the template processing unit 160 extracts information related to parameters from the template, and determines whether the template can be executed on the analysis target data created by the input data creation unit 110 and the processing result data created by the data processing unit 120. .
- the template recommendation unit 170 extracts a template from the template DB 180 based on a predetermined criterion and presents the template to the user 100. Also, the analysis target data created by the input data creation unit 110 and the processing result created by the data processing unit 120. A template applicable to the data is extracted from the template DB 180 and presented to the user 100.
- the user 100 performs operation 1 “creates analysis target data by extracting necessary data from the DB and applies input data generation processing to the extracted data”, operation 2 “data processing on analysis target data.
- the process is performed in the order of “Create processing result data”, work 3 “visualize and visualize the processing result data”, and work 4 “restart from work 1”.
- FIG. 2 is a flowchart showing an example of the procedure of the operation 1 of the first embodiment.
- the processor extracts a template that can be executed by the input data creation unit 110 from the template DB 180 according to the standard specified by the template recommendation unit 170, and registers it in the list Li (S201).
- the standard is a template recently used by the user 100, a template frequently used by all users, a template frequently used by a specific user other than the user 100, a template frequently used by a department, or a template frequently used in the past.
- Means the recommended standard for templates such as
- FIG. 3A is a diagram illustrating an example of a template data structure and a template.
- the template shown here assumes the same structure for the input data creation unit, the data processing unit, and the data visualization unit, but may have a different structure as long as it can be executed by each unit.
- the upper part of the figure shows the data structure of the template, and the lower part of the figure shows an example of the template.
- the data structure of the template is composed of parameters, process names, and arguments, as shown in the item name, and the data with the contents shown in the figure is described.
- the analysis work is not supported by the template, and the normal analysis work is performed by a GUI (Graphical User Interface) operation or the like (S205).
- GUI Graphic User Interface
- the analysis target data created as a result is defined as Da.
- the processing contents executed by the log recording unit 140 in the input data creation unit 110 are recorded and registered in the log DB 141 (S206, S207).
- a log regarding the executed template is also recorded and registered in the log DB 141 (S207).
- Fig. 3C shows the log data structure and an example of the log at the top and bottom, respectively.
- 3D shows an example of the data structure of the template log and an example of the template log.
- the template log structure items include time, process type, template name, parameter value, input data string name, output data string name, and visualization result diagram.
- FIG. 3E shows a display example of the visualization result diagram on the display screen of the display 102
- FIG. 3F shows a display example of the parameter change dialog on the display screen.
- the template recommendation unit 170 extracts templates that can be applied to the analysis target data Da output as a result of the processing of the input data creation unit and can be executed by the data processing unit 120 from the template DB 180 and register them in the list Ld. (S208). The contents of S208 will be described later in detail with reference to FIG.
- FIGS. 4A and 4B are diagrams showing a specific example of the operation 1 of the first embodiment.
- the content of the selection template Ti is “integrate the two specified tables with the specified column as the key column and change the key column name to the specified value”
- the selection template Ti is An example of the analysis target data Da created as a result of the execution will be shown.
- FIG. 4A is an example of the template Ti.
- parameter 1 is type E (other) and value is “table 1”
- parameter 2 is type E (other) and value is “table 2”
- parameter 3 is The type is N (column name), the value is “column A”
- the parameter 4 is type N (column name), the value is “column X”
- the parameter 5 is type E (other) and the value is “KEY”. is there.
- the processing performed by Ti uses parameters 1 to 5 as arguments, “integrates the two specified tables (parameters 1 and 2) and the two specified columns (parameter 3 and parameter 4) as key columns, and specifies the specified value. “Change the key column name to (parameter 5)”.
- FIG. 4B is a diagram illustrating an image of “table integration”.
- the processing that can be executed by the input data creation unit 110 is not limited to the “table integration” shown in FIG. 4A and FIG. 4B, but a plurality of processing that can be implemented in SQL, programming language, etc. such as filtering and character string replacement.
- FIG. 5 is a flowchart detailing the process of S208 shown in the flowchart of FIG.
- All logs whose processing type is “for data processing” are extracted from the template log and registered in the list L2.
- An empty list Ld is prepared.
- the column name list of the analysis target data Da is set to C1 (S501).
- the input data string name list C2 is acquired from the K2th log of L2, and if it is C2 ⁇ C1, the K2th template of L2 is added to the list Ld.
- This process is executed for all elements of L2 (S503 to S507).
- the above is the description of the procedure of the operation 1 in the present embodiment.
- FIG. 6 is a flowchart illustrating an example of the procedure of the work 2 of the first embodiment.
- the data processing template list Ld created in S208 is displayed on the display (S601).
- a display example on the display 102 is the same as that shown in FIG. 3A.
- the template execution unit 150 executes the template Td for the data processing unit (S602, S603).
- FIG. 3B is a diagram illustrating an example of a template data structure and a template.
- the template shown here assumes the same structure for the input data creation unit, the data processing unit, and the data visualization unit, but may have a different structure as long as it can be executed by each unit.
- the analysis work is not supported by the template, and the normal analysis work by the GUI operation or the like is performed (S604).
- the process result data created as a result is defined as Dr.
- the processing contents executed by the data processing unit 120 by the log recording unit 140 are recorded and registered in the log DB 141 (S605, S606).
- a template is selected in S603, a log relating to the executed template is also recorded and registered in the log DB 141 (S606).
- FIG. 3C shows an example of the log data structure and log.
- FIG. 3D shows an example of the data structure of the template log and the template log. If the process has not been completed normally, the problem location is displayed on the display, and the process ends (S605, S220).
- templates that can be applied to the processing result data Dr output from the template DB 180 by the template recommendation unit 170 as a result of the processing of the data processing unit and that can be executed by the data visualization unit 130 are extracted and registered in the list Lv (S607). ). The contents of S607 will be described in detail with reference to FIG.
- FIG. 7 is a diagram showing a specific example of the operation 2 of the first embodiment.
- an example of the processing result data Dr created as a result of executing the selection template Td when the content of the selection template Td is “count the number of occurrences of elements in the designated column” is shown.
- FIG. 7A is an example of the template Td.
- parameter 1 has a type of N (column name) and a value of “KEY”.
- the process performed at Td is performed by “counting the number of occurrences of elements in the designated column (parameter 1)” with the parameter 1 as an argument.
- FIG. 7B is a diagram illustrating an image of “counting the number of appearances of elements”.
- the processing that can be executed by the data processing unit is not limited to “counting the number of occurrences of elements” shown in FIG. 7, but can be realized by SQL, programming language, etc. such as filtering, character string replacement, four arithmetic operations, and statistical operations. Targeting a combination of multiple processes.
- FIG. 8 is a diagram illustrating in detail the processing of S607 in the flowchart of FIG.
- All logs whose processing type is “for visualization” are extracted from the template log and registered in the list L2.
- An empty list Lv is prepared.
- the column name list of the processing result data Dr is set to C1 (S801).
- the input data string name list C2 is acquired from the K2th log of L2, and when it is C2 ⁇ C1, the K2th template of L2 is added to the list Lv. This process is executed for all elements of L2 (S803 to S807).
- the above is the description of the procedure of the work 2 in the present embodiment.
- FIG. 9 is a flowchart showing an example of the procedure of the operation 3 in the first embodiment.
- a visualization example of each template included in the data visualization template lists Lv and Lv created in S607 is displayed on the display (S901). Examples of display on the display 102 are shown in FIGS. 3A and 3E.
- 310 indicates a list of Lvs
- 311 displays the visualization result of this data visualization template in the past when the template name displayed in 310 is selected.
- FIG. 3B is a diagram illustrating an example of a template data structure and a template.
- the template shown here assumes the same structure for the input data creation unit, the data processing unit, and the data visualization unit, but may have a different structure as long as it can be executed by each unit.
- the analysis work is not supported by the template, and the normal analysis work by the GUI operation or the like is performed (S904).
- the analysis process instructed in S903 or S904 and executed by the data visualization unit 130 is completed normally, the visualization result is displayed on the display 102.
- the processing contents executed by the data visualization unit 130 by the log recording unit 140 are recorded and registered in the log DB 141 (S905, S906).
- a template is selected in S903
- a log regarding the executed template is also recorded and registered in the log DB 141 (S906).
- FIG. 3C shows an example of the log data structure and log.
- FIG. 3D shows an example of the data structure of the template log and the template log.
- FIG. 10A and FIG. 10B are diagrams showing a specific example of the operation 3 of the first embodiment.
- an example of visualization created as a result of executing the selection template Tv when the content of the selection template Tv is “display the specified column as a bar graph and use the specified column as an item name on the horizontal axis”. Indicates.
- FIG. 10A is an example of the template Tv.
- parameter 1 has type N (column name) and value “number of occurrences of elements”
- parameter 2 has type N (column name) and value “KEY”. It is.
- the process performed in Tv is performed by using “parameters 1 and 2 as arguments” and “display the designated column (parameter 1) as a bar graph and designate the designated column (parameter 2) as the item name on the horizontal axis”.
- FIG. 10B is a diagram illustrating an image of a “bar graph”.
- the processing that can be executed by the data visualization unit is not limited to “display the specified column as a bar graph and use the specified column as the item name on the horizontal axis” shown in FIG.
- the target is a combination of multiple processes that can be implemented in a language or the like.
- FIG. 11 is a diagram for explaining in detail the contents of S907 in the flowchart of FIG. 9, and is a flowchart showing an example of the procedure of the operation 4 in the first embodiment.
- the parameter of the template Ti for the input data creation unit is changed, or the template Ti for the input data creation unit is selected again (S1101, S1102).
- the process proceeds to S201. Since this process is as described above, it is omitted here.
- the template processing unit 160 extracts the parameter from Ti and displays the parameter list on the display (S1103).
- a parameter to be changed is selected by the user 100, a parameter editing window is displayed on the display, the parameter changed by the user 100 and its value are acquired, and input data creation reflecting the changed parameter is created.
- the template Ti for the copy is executed (S1104 to S1107).
- FIG. 3F An example of the parameter editing window is shown in FIG. 3F.
- 301 is a parameter name
- 302 is a value candidate
- 303 is the value selected in 302
- the user 100 may adopt this value or edit this value. Also good.
- the value candidates displayed in 302 are automatically acquired. For example, when the parameter type is “T”, an accessible table name list is displayed in 302.
- the analysis target data created as a result is defined as Da. Further, the processing contents executed by the log recording unit 140 in the input data creation unit 110 are recorded and registered in the log DB 141 (S1108, S1109). Further, a log relating to the executed template Ti is also recorded and registered in the log DB 141 (S1109).
- FIG. 3C shows an example of the log data structure and log.
- FIG. 3D shows an example of the data structure of the template log and the template log. If the process has not been completed normally, the problem location is displayed on the display, and the process ends (S1108, S220).
- the template processing unit 160 determines whether or not Td can be executed on the analysis target data Da, and when the Td can be executed from the determination result, the template execution unit 150 executes Td (S1110, S1111 and S1113).
- Td Td (S1110, S1111 and S1113). The contents of S1110 will be described in detail with reference to FIG.
- the log recording unit 140 records the processing content executed by the data processing unit 120 and registers it in the log DB 141 (S1114, S1115). Further, a log related to the executed template Td is also recorded and registered in the log DB 141 (S1115).
- FIG. 3C shows an example of the log data structure and log.
- FIG. 3D shows an example of the data structure of the template log and the template log.
- the template recommendation unit 170 extracts a template for the data processing unit applicable to the analysis target data Da and registers it in the list Ld (S1112). The process proceeds to S601.
- the template processing unit 160 determines whether or not Tv can be executed on the processing result data Dr. If Tv can be executed from the determination result, the template execution unit 150 executes Tv (S1116, S1117, S1119). The contents of S1116 will be described in detail with reference to FIG.
- FIG. 3C shows an example of the log data structure and log.
- FIG. 3D shows an example of the data structure of the template log and the template log.
- the template recommendation unit 170 extracts a template for the data visualization unit applicable to the processing result data Dr and registers it in the list Lv (S1118). , The process proceeds to S901.
- FIG. 12 is a diagram detailing the processing of S1110.
- the template processing unit 160 extracts all the logs that have executed the template Td for the data processing unit from the template log, and registers them in the list L2 (S1201).
- the input data string name list C2 is acquired from the K2 log of L2, and if C2 ⁇ C1, the determination result is “executable”, the parameter given to Td is set as the parameter value of the K2 log of L2, and the process ends. To do. This process is executed for all elements of L2 (S1203 to S1207), and if the determination result does not become “executable”, the determination result is determined to be “unexecutable” (S1203, S1208).
- FIG. 13 is a diagram detailing the processing of S1116.
- the template processing unit 160 extracts all the logs executed by the template Tv for the data visualization unit from the template log, and registers them in the list L2 (S1301).
- the input data string name list C2 is acquired from the K2 log of L2, and when it is C21C1, the determination result is “executable”, the parameter given to Tv is set as the parameter value of the K2 log of L2, and the process ends. To do.
- This process is executed for all elements of L2 (S1303 to S1307), and if the determination result does not become “executable”, the determination result is set to “unexecutable” and ends (S1303, S1308).
- FIGS. 14A to 4F are diagrams showing specific examples of the operation 4 in the first embodiment.
- the input data creation process is performed using “column A” and “column X” as key columns.
- the parameter 3 of the template Ti for the input data creation unit is changed to “column C”
- the parameter 4 is changed to “column Z”
- “column C” and “column Z” are changed to key columns.
- the data processing and visualization processing are executed using the templates Td and Tv.
- FIG. 14A in S1103 to S1106, the parameter 3 of the template Ti for the input data creation unit is changed to “column C” and the parameter 4 is changed to “column Z”, respectively.
- the parameter 3 of the template Ti for the input data creation unit is changed to “column C” and the parameter 4 is changed to “column Z”, respectively.
- FIG. 14B is a diagram showing an image of “table integration”.
- FIG. 14C is an example of the selection template Td.
- the selected template Td can be applied to the analysis target data Da as a result of executing the template Ti, no parameter change or the like is performed.
- FIG. 14D is a diagram illustrating an image of “counting the number of appearances of elements”.
- FIG. 14E is an example of the template Tv.
- the template Tv can be applied to the processing result data Dr as a result of the execution of the template Td, so that no parameter change or the like is performed.
- FIG. 14F is a diagram illustrating an image of a “bar graph”.
- the user 100 performs operation 1 “creates analysis target data by extracting necessary data from the DB 104 and performing input data creation processing on the extracted data”, Assuming a scenario where the analysis work is performed in the order of operation 2 “process data on analysis target data and create processing result data”, operation 3 “visualize processing result data by visualization”, operation 4 “restart from operation 1”
- the second embodiment is an embodiment of a data analysis support system that assumes a scene in which analysis work is performed in the order of work 2, work 1, work 3, and work 4.
- FIG. 15 is a flowchart illustrating an example of the procedure of the work 2 according to the second embodiment.
- a template that can be executed by the data processing unit 120 is extracted from the template DB 180 according to the specified standard by the template recommendation unit 170 and registered in the list Ld (S1501).
- the standard specified here is a template recently used by the user 100, a template frequently used by all users, a template frequently used by a specific user other than the user 100, a template frequently used by each department, and the past period It means a template that is often used for.
- the extracted list Ld is displayed on the display 102 (S1502).
- a display example on the display 102 is shown in FIG. 3A.
- an input data creation template that can create analysis target data necessary for execution of the data processing template Td for which the template recommendation unit has been selected is extracted and registered in the list Li (S1503, S1504). .
- FIG. 17 is a flowchart illustrating an example of the procedure of the operation 1 according to the second embodiment.
- the input data creation template list Li created in S1504 is displayed on the display (S1701).
- a display example on the display 102 is the same as that shown in FIG. 3A.
- the template execution unit 150 executes the template Ti for the input data creation unit (S1702, S1703).
- FIG. 3B is a diagram illustrating an example of a template data structure and a template.
- the template shown here assumes the same structure for the input data creation unit, the data processing unit, and the data visualization unit, but may have a different structure as long as it can be executed by each unit.
- the analysis work is not supported by the template, and the normal analysis work by the GUI operation or the like is performed (S1704).
- the analysis target data created as a result is defined as Da.
- the log recording unit 140 records the processing content executed by the input data creation unit 110 and registers it in the log DB 141 (S1705, S1706). If a template is selected in S1703, a log related to the executed template is also recorded and registered in the log DB 141 (S1706).
- FIG. 3C shows an example of the log data structure and log.
- FIG. 3D shows an example of the data structure of the template log and the template log. If the process is not completed normally, the problem location is displayed on the display, and the process ends (S1705, S220).
- FIG. 3B is a diagram illustrating an example of a template data structure and a template.
- the template shown here assumes the same structure for the input data creation unit, the data processing unit, and the data visualization unit, but may have a different structure as long as it can be executed by each unit.
- the log recording unit 140 records the processing content executed by the data processing unit 120 and registers it in the log DB 141 (S1708, S1709). Further, a log relating to the executed template is also recorded and registered in the log DB 141 (S1709).
- FIG. 3C shows an example of the log data structure and log.
- FIG. 3D shows an example of the data structure of the template log and the template log. If the process has not been completed normally, the problem location is displayed on the display, and the process ends (S1708, S220).
- templates that can be applied to the processing result data Dr output by the template recommendation unit 170 as a result of the processing of the data processing unit and can be executed by the data visualization unit 130 are extracted from the template DB 180 and registered in the list Lv (S1710). ). The contents of S1710 are the same as S607.
- FIG. 18 is a flowchart showing an example of the procedure of the operation 3 in the second embodiment.
- FIG. 3B is a diagram illustrating an example of a template data structure and a template.
- the template shown here assumes the same structure for the input data creation unit, the data processing unit, and the data visualization unit, but may have a different structure as long as it can be executed by each unit.
- the analysis work is not supported by the template, and the normal analysis work by the GUI operation or the like is performed (S1804).
- the analysis process instructed in S1803 or S1804 and executed by the data visualization unit 130 is completed normally, the visualization result is displayed on the display 102.
- the processing contents executed by the data recording unit 130 by the log recording unit 140 are recorded and registered in the log DB 141 (S1805, S1806). If a template is selected in S1803, a log regarding the executed template is also recorded and registered in the log DB 141 (S1806).
- FIG. 3C shows an example of the log data structure and log.
- FIG. 3D shows an example of the data structure of the template log and the template log. If the process has not been completed normally, the problem location is displayed on the display, and the process ends (S1805, S220).
- FIGS 19-19 20A, and 20B are diagrams illustrating the details of S1807, and are a flowchart illustrating an example of the procedure of the operation 4 of the second embodiment.
- the template recommendation unit 170 extracts a template that can be executed by the data processing unit 120 from the template DB 180 according to the specified standard, presents it to the user 100, and selects the user 100.
- the process proceeds to S1903 (S1902).
- the standard specified here is a template recently used by the user 100, a template frequently used by all users, a template frequently used by a specific user other than the user 100, a template frequently used by each department, and the past period It means a template that is often used for.
- the template processing unit 160 extracts parameters from Td and displays a parameter list on the display (S1903).
- the parameter and the value changed by the user 100 are acquired, and the process proceeds to S2001 (S1904, S1905).
- An example of a parameter editing window is shown in FIG. 3F.
- the value candidates displayed in 302 of FIG. 3F are automatically obtained from data Da obtained as a result of the execution of Ti according to the selected parameter.
- the column name list of the analysis target data Da is set to C0, and the parameter and argument values of the type “N” are extracted from the template Td for the data processing unit and registered in the column name list C2 (S2001, S2002).
- the K1th template of L1 is set as TK1.
- Steps 1 to K3 of TK1 are executed, and the column name list of the data created as a result is set as C3 '.
- the template execution unit 150 executes the template Ti for the input data creation unit (S1907, S1909).
- the log recording unit 140 records the processing content executed by the input data creation unit 110 and registers it in the log DB 141 (S1910, S1911).
- the template Ti is executed in S1909, a log relating to the executed template is also recorded and registered in the log DB 141 (S1911). If the process is not completed normally, the problem location is displayed on the display, and the process ends (S1910, S220).
- the template execution unit 150 executes Td (S1912).
- Td The processing result data created as a result is set to Dr.
- the processing contents executed by the data processing unit 120 by the log recording unit 140 are recorded and registered in the log DB 141 (S1913, S1914).
- a log related to the executed template Td is also recorded and registered in the log DB 141 (S1914). If the process has not been completed normally, the problem location is displayed on the display, and the process ends (S1913, S220).
- the template processing unit 160 determines whether or not Tv can be executed on the processing result data Dr. If the Tv can be executed from the determination result, the template execution unit 150 executes Tv (S1915, S1916, S1917). The contents of S1915 are omitted here because they are already described in FIG.
- the visualization result is displayed on the display.
- the processing contents executed by the log recording unit 140 in the data visualization unit 130 are recorded and registered in the log DB 141 (S1918, S1919).
- a log related to the executed template Tv is also recorded and registered in the log DB 141 (S1919). If the process has not been completed normally, the problem location is displayed on the display, and the process ends (S1918, S220).
- the template recommendation unit 170 extracts a template for the data visualization unit applicable to the processing result data Dr, registers it in the list Lv, and proceeds to S1801 (S1920).
- 21A to 21F are diagrams showing specific examples of the operation 4 in the second embodiment.
- data processing is performed as “count the number of elements”, but in the example of FIG. 21, the data processing unit in S1902 to S1906 Select the template Td for “Cross tabulation of specified two columns”, set parameter 1 as “KEY”, parameter 2 as “column A”, and execute data processing and visualization processing using templates Ti and Tv Assume a scene to do.
- FIG. 21A is an example of the template Td.
- the parameter 1 has the type N (column name) and the value “KEY”
- the parameter 2 has the type N (column name) and the value “column A”.
- the process performed at Td uses “parameters 1 and 2 as arguments” to perform “cross tabulation of specified two columns (parameter 1 and parameter 2)”.
- FIG. 21B is a diagram showing an image of “cross tabulation”.
- FIG. 21C is an example of the template Ti.
- the change of the template Td does not affect the template Ti, so the parameter is not changed.
- FIG. 21D is a diagram showing an image of “table integration”.
- FIG. 21E is an example of the template Tv.
- an applicable template Tv is extracted along with the change of the processing result data Dr.
- FIG. 21E shows a case where the extracted Tv content is “display two specified columns as a bar graph and use the specified columns as item names on the horizontal axis”, and
- FIG. 21F shows an image of the “bar graph”. is there.
- the user 100 operates the operation 1 “extracts necessary data from the DB 104 and creates the analysis target data by performing input data generation processing on the extracted data”, operation 2 “data in the analysis target data.
- operation 1 extracts necessary data from the DB 104 and creates the analysis target data by performing input data generation processing on the extracted data
- operation 2 data in the analysis target data.
- processing “create processing result data” operation 3 “visualize processing result data and visualize”, and operation 4 “restart from operation 1”, operation 3, operation 2, operation 1, and operation 4 It is the Example supposing the scene which performs the analysis work by.
- FIG. 22 is a flowchart showing an example of the procedure of the operation 3 in the third embodiment.
- the template recommendation unit 170 extracts a template that can be executed by the input data creation unit 110 from the template DB 180 according to the specified standard, and registers it in the list Lv (S2201).
- the standard specified here is a template recently used by the user 100, a template frequently used by all users, a template frequently used by a specific user other than the user 100, a template frequently used by each department, and the past period It means a template that is often used for.
- a visualization example of each template included in the extracted lists Lv and Lv is displayed on the display 102 (S2202). Examples of display on the display 102 are shown in FIGS. 3A and 3E.
- a data processing template that can create processing result data necessary for executing the visualization template Tv for which the template recommendation unit has been selected is extracted and registered in the list Ld (S2203, S2204).
- FIG. 24 is a flowchart showing an example of the procedure of the work 2 in the third embodiment.
- the data processing template list Ld created in S2204 is displayed on the display (S2401).
- a display example on the display 102 is the same as that shown in FIG. 3A.
- the template recommendation unit extracts an input data creation template that can create analysis target data necessary for executing the data processing template Td for which the template recommendation unit has been selected, and registers it in the list Li ( S2403).
- the contents of S2403 are the same as S1504.
- FIG. 25 is a flowchart illustrating an example of the procedure of the operation 1 according to the third embodiment.
- the input data creation template list Li created in S2403 is displayed on the display (S2501).
- a display example on the display 102 is the same as that shown in FIG. 3A.
- the template execution unit 150 executes the template Ti for the input data creation unit (S2502, S2503).
- FIG. 3B is a diagram illustrating an example of a template data structure and a template.
- the template shown here assumes the same structure for the input data creation unit, the data processing unit, and the data visualization unit, but may have a different structure as long as it can be executed by each unit.
- the analysis target data created as a result is defined as Da. Further, the processing contents executed by the log recording unit 140 in the input data creation unit 110 are recorded and registered in the log DB 141 (S2504, S2505). Further, a log relating to the executed template is also recorded and registered in the log DB 141 (S2505).
- FIG. 3C shows an example of the log data structure and log.
- FIG. 3D shows an example of the data structure of the template log and the template log. If the process has not been completed normally, the problem location is displayed on the display, and the process ends (S2504, S220).
- FIG. 3B is a diagram illustrating an example of a template data structure and a template.
- the template shown here assumes the same structure for the input data creation unit, the data processing unit, and the data visualization unit, but may have a different structure as long as it can be executed by each unit.
- the process result data created as a result is defined as Dr.
- the processing contents executed by the data processing unit 120 by the log recording unit 140 are recorded and registered in the log DB 141 (S2507, S2508).
- a log relating to the executed template is also recorded and registered in the log DB 141 (S2508).
- FIG. 3C shows an example of the log data structure and log.
- FIG. 3D shows an example of the data structure of the template log and the template log. If the process has not been completed normally, the problem location is displayed on the display, and the process ends (S2507, S220).
- the template execution unit 150 executes the template Tv for the data visualization unit (S2509).
- the analysis process executed by the data visualization unit 130 is completed normally, the visualization result is displayed on the display 102.
- the processing contents executed by the data visualization unit 130 by the log recording unit 140 are recorded and registered in the log DB 141 (S2510, S2511).
- a log relating to the executed template is also recorded and registered in the log DB 141 (S2511). If the process has not been completed normally, the problem location is displayed on the display, and the process ends (S2510, S220).
- FIGS. 26A to 26D are diagrams for explaining the contents of S2512 in detail, and are flowcharts showing an example of the procedure of the operation 4 of the third embodiment.
- the template recommendation unit 170 extracts a template that can be executed by the data visualization unit 130 from the template DB 180 according to the specified standard, presents it to the user 100, and selects the user 100.
- the process proceeds to S2603 (S2602).
- the standard specified here is a template recently used by the user 100, a template frequently used by all users, a template frequently used by a specific user other than the user 100, a template frequently used by each department, and the past period It means a template that is often used for.
- the template processing unit 160 extracts parameters from Tv and displays a parameter list on the display (S2603).
- a parameter editing window is displayed on the display, the parameter and its value changed by the user 100 are acquired, and the process proceeds to S2701 (S2604, S2605).
- An example of a parameter editing window is shown in FIG. 3F.
- the candidate values displayed in 302 of FIG. 3F are automatically obtained from data Dr obtained as a result of the execution of Td according to the selected parameter.
- the column name list of the processing result data Dr is set to C0, and the parameter and argument values of the type “N” are extracted from the template Tv for the data visualization unit and registered in the column name list C2 (S2701 and S2702).
- the K1th template of L1 is set as TK1.
- Steps 1 to K3 of TK1 are executed, and the column name list of the data created as a result is set as C3 '.
- the K1th template of L1 is set as TK1.
- Steps 1 to K3 of TK1 are executed, and the column name list of the data created as a result is set as C3 '.
- the template execution unit 150 executes the template Ti for the input data creation unit (S2608, S2610).
- the log recording unit 140 records the processing content executed by the input data creation unit 110 and registers it in the log DB 141 (S2611, S2612).
- the template Ti is executed in S2610, a log related to the executed template is also recorded and registered in the log DB 141 (S2612). If the process is not completed normally, the problem location is displayed on the display, and the process ends (S2611, S220).
- the template execution unit 150 executes Td (S2613).
- the log recording unit 140 records the processing content executed by the data processing unit 120 and registers it in the log DB 141 (S2614, S2615). Further, a log related to the executed template Td is also recorded and registered in the log DB 141 (S2615). If the process has not been completed normally, the problem location is displayed on the display, and the process ends (S2614, S220).
- the template execution unit 150 executes Tv (S2616).
- Tv When the visualization process executed by the data visualization unit 130 is completed normally, the visualization result is displayed on the display.
- the processing content executed by the data recording unit 130 by the log recording unit 140 is recorded and registered in the log DB 141 (S2617, S2618).
- a log related to the executed template Tv is also recorded and registered in the log DB 141 (S2618). If the process has not been completed normally, the problem location is displayed on the display, and the process ends (S2617, S220).
- FIGS. 27A and 27B are diagrams showing a specific example of the operation 4 in the third embodiment.
- visualization is performed as “display the designated column as a bar graph and use the designated column as the item name on the horizontal axis”.
- the template Tv for the data visualization unit is selected as “display the designated column as a pie chart and use the designated column as the item name”, and set parameter 1 It is assumed that “number of occurrences of elements”, parameter 2 is “KEY”, and input data creation processing and data processing are executed using templates Ti and Td.
- FIG. 27A is an example of the template Tv.
- parameter 1 has type N (column name) and value “number of occurrences of elements”
- parameter 2 has type N (column name) and value “KEY”. It is.
- the process performed in Tv is “display the designated column (parameter 1) as a pie chart and use the designated column (parameter 2) as an item name” with parameters 1 and 2 as arguments.
- FIG. 21B is a diagram showing an image of a “pie graph”. Since the processes using the templates Ti and Td are the same as those shown in FIGS. 4 and 7, they are omitted here.
- the analysis process visualization process can be changed, and the input data creation process and the data process change accompanying the change in the visualization process can be supported using the template.
- the input data creation process and the data process change accompanying the change in the visualization process can be supported using the template.
- the user 100 operates the work 1 “extracts necessary data from the DB 104 and creates the analysis target data by performing the input data creation processing on the extracted data”, the work 2 “data in the analysis target data.
- work 3 visualize processing result data and visualize
- work 4 redo from work 1
- a template that can be executed by the data visualization unit 130 is extracted from the template DB 180 in accordance with the specified standard by the template recommendation unit 170 and registered in the list Lv (S2801).
- the standard specified here is a template recently used by the user 100, a template frequently used by all users, a template frequently used by a specific user other than the user 100, a template frequently used by each department, and the past period It means a template that is often used for.
- a visualization example of each template included in the extracted lists Lv and Lv is displayed on the display 102 (S2802). Examples of display on the display 102 are shown in FIGS. 3A and 3E.
- the template recommendation unit extracts all input data creation templates executed immediately before the visualization template Tv selected from the template log, registers them in the list Li, and displays Li on the display ( S2803 to S2805).
- Ti is executed (S2806, S2807).
- the template recommendation unit 170 extracts all data processing templates between Ti and Tv from the template log, registers them in the list Ld, and displays Ld on the display (S2808, S2809).
- Td When the data processing template Td is selected, it is selected whether to change the Td parameter (S2810, S2811).
- the template processing unit 170 extracts the parameter from Td and displays the parameter list on the display (S2812).
- a parameter editing window is displayed on the display (S2813, S2814).
- Td is executed (S2815, S2816). If the parameter is not changed, Td is executed (S2816).
- An example of a parameter editing window is shown in FIG. 3F.
- the candidate values displayed at 302 in FIG. 3F are automatically obtained from data obtained as a result of the execution of Ti according to the selected parameter.
- the template processing unit 170 extracts parameters from Tv and displays a parameter list on the display (S2817). If a parameter is selected, a parameter editing window is displayed on the display (S2818). An example of a parameter editing window is shown in FIG. 3F.
- the value candidates displayed in 302 of FIG. 3F are automatically obtained from data obtained as a result of the execution of Td according to the selected parameter.
- Tv When the parameter editing is completed, Tv is executed, the visualization result is displayed on the display, and the log recording unit 140 records the processing contents respectively executed by the input data creation unit 110, the data processing unit 120, and the data visualization unit 130, and logs Register in the DB 141 (S2820 to S2822).
- the input data creation template is selected.
- the analysis work is not supported by the template, and a normal analysis work by a GUI operation or the like may be performed. .
- the Ti parameter can be changed.
- the subsequent processing is the same as in the first embodiment.
- the data processing template is selected.
- the analysis work is not supported by the template, and a normal analysis work such as a GUI operation may be performed.
- the analysis work can be started from the visualization result of the analysis work. That is, input data creation processing necessary for realizing the visualization result and construction of the data processing can be supported using the template, so that it is possible to reduce the labor of analysis of the user 100. .
- the user 100 operates the work 1 “extracts necessary data from the DB 104 and creates the analysis target data by performing the input data creation processing on the extracted data”, the work 2 “data in the analysis target data. Create processing result data by performing processing ”, operation 3“ visualize processing result data by visualization ”, and operation 4“ restart from operation 1 ”in the order of operation 1, operation 3, operation 2, and operation 4. It is the Example supposing the scene which performs analysis work.
- FIG. 29 is a flowchart showing an example of the procedure of the fifth embodiment.
- a template that can be executed by the input data creation unit 110 is extracted from the template DB 180 according to the specified standard by the template recommendation unit 170 and registered in the list Li.
- all data visualization templates executed immediately after the input data creation template included in Li are extracted from the template log and registered in the list Le (S2901).
- the standard specified here is a template recently used by the user 100, a template frequently used by all users, a template frequently used by a specific user other than the user 100, a template frequently used by each department, and the past period It means a template that is often used for.
- the extracted list Li is displayed on the display 102.
- the visualization result diagram of the data visualization template corresponding to the selected template is extracted from Le and displayed on the display (S2902).
- a display example on the display 102 is shown in FIG.
- 3001 is a list of Li
- 3002 displays a visualization result of a data visualization template executed immediately after executing this input data creation template in the past.
- the selected template Ti is executed (S2903, S2904).
- the template recommendation unit extracts all the data visualization templates executed immediately after the input data creation template Ti selected from the template log, registers it in the list Lv, and displays Lv on the display (S2905, S2906).
- the template recommendation unit 170 extracts all data processing templates between Ti and Tv from the template log, registers them in the list Ld, and displays Ld on the display (S2907, FIG. 28B). S2808, S2809). Since the subsequent processing procedures have already been described with reference to FIG. 28B, they are omitted.
- the analysis result that realizes the user's analysis result image by presenting the data to be analyzed and the figure that can be visualized using the data is presented.
- Implementation becomes possible. That is, input data creation processing necessary for realizing the visualization result and construction of the data processing can be supported using the template, so that it is possible to reduce the labor of analysis of the user 100. .
- a part of the configuration of one embodiment can be replaced with the configuration of another embodiment, and the configuration of another embodiment can be added to the configuration of one embodiment. Further, it is possible to add, delete, and replace other configurations for a part of the configuration of each embodiment.
- each of the above-described configurations, functions, processing units, and the like may be realized by hardware, for example, by designing them with an integrated circuit, or a program that realizes part or all of them. It goes without saying that it may be realized by software by creating the above.
Landscapes
- Engineering & Computer Science (AREA)
- Business, Economics & Management (AREA)
- Human Resources & Organizations (AREA)
- Strategic Management (AREA)
- Economics (AREA)
- Entrepreneurship & Innovation (AREA)
- Educational Administration (AREA)
- Game Theory and Decision Science (AREA)
- Development Economics (AREA)
- Marketing (AREA)
- Operations Research (AREA)
- Quality & Reliability (AREA)
- Tourism & Hospitality (AREA)
- Physics & Mathematics (AREA)
- General Business, Economics & Management (AREA)
- General Physics & Mathematics (AREA)
- Theoretical Computer Science (AREA)
- User Interface Of Digital Computer (AREA)
- Management, Administration, Business Operations System, And Electronic Commerce (AREA)
Abstract
分析対象データやデータに対する分析処理や可視化処理が固定ではない場合には、試行錯誤のたびに,分析対象データを作り変え、分析処理、可視化処理を変更しなければならない。分析対象データの編集や再構築により、その部分より後の部分は再現不可能となるため、編集が他の処理を自動的に変更、あるいは他の処理を変更するための候補を提示する。システムを構成する計算機は、利用者に対して次作業を推奨できるテンプレート推奨機能を実行するテンプレート推奨部、各種のテンプレートを実行できるテンプレート実行機能を実行するテンプレート実行部を備える。
Description
本発明は、データ分析を支援するデータ分析支援方法及びシステムに係り、特に分析対象データやデータに対する処理が固定で無い場合の分析支援技術に関する。
業務システムなどから蓄積される企業内の膨大なデータを、蓄積、分析、加工して、企業の意思決定に活用するビジネスインテリジェンスという手法がある。この手法は、複数のデータベース(DB)を横断し、多種、大量のデータを高速に分析可能である。この手法は、高速化のために、高度に構造化された分析対象データを分析の目的に応じて予め構築する必要があり、分析内容と必要なデータが決まっている定型分析に強い。
一方、分析対象データやデータに対する分析処理や可視化処理が固定ではない場合には、試行錯誤のたびに,分析対象データを作り変えると共に、分析処理、可視化処理を変更しなければならない。このようなデータ分析に関連する背景技術として、特許文献1や特許文献2がある。特許文献1には、コンピュータ側で検知した分析手順を管理サーバのデータベースに記録し、記録した分析手順を第三者が共有・再利用することが記載されている。また、特許文献2には、最適化されたプロセス定義を提供すること、言い換えると、既存プロセスを再利用し、新しいプロセスを作る際に、既存プロセス前後関係を利用し、実行可能な新しいプロセスを提示することが開示されている。
上述の背景技術に見るように、分析手順を記録し、編集や再構築することにより再利用する技術では、過去の分析手順の再現は可能である。また過去の分析手順を編集することにより、部分的に再利用し、新たな分析を行うことも可能である。しかしその編集により、編集した部分より後の部分は再現不可能となるため、その編集が他の処理を自動的に変更、あるいは他の処理を変更するための候補を提示するような技術が、求められている。
本発明の目的は、上記の課題を解決し、過去の分析手順を編集し、他の処理を自動的に変更、或いは他の処理を変更するための候補を提示することが可能なデータ分析支援方法及びシステムを提供することにある。
本発明においては、上記の目的を達成するため、計算機を用いたデータ分析支援方法であって、計算機は、抽出したデータに入力データ作成処理を施すことにより分析対象データを作成する入力データ作成機能と、データにデータ処理を施し処理結果データを作成するデータ処理機能と、データに可視化処理を施し可視化するデータ可視化機能を実行することによりデータ分析支援の作業を行うデータ分析支援方法を提供する。
また、本発明においては、上記の目的を達成するため、データ分析支援システムであって、複数のテンプレートを蓄積するテンプレートデータベースを記憶する記憶部と、テンプレートを実行する処理部とを備え、処理部は、データに入力データ作成処理を施すことにより分析対象データを作成する入力データ作成機能と、データにデータ処理を施し処理結果データを作成するデータ処理機能と、データに可視化処理を施し可視化するデータ可視化機能を実行することによりデータ分析支援の作業を行う構成のデータ分析支援システムを提供する。
本発明によれば、利用者の分析作業に要する手間を削減することが可能となる。
以下、本発明のデータ分析支援方法、及び装置の各種の実施の形態について、図面を参照しながら説明する。なお、本明細書において、計算機等が実現する各種の機能を、作業或いは部と称する場合がある。例えば、分析対象データを作成するデータ作成機能を、データ作成作業、或いはデータ作成部、分析対象データにデータ処理を施し処理結果データを作成するデータ処理機能を、データ処理作業、或いはデータ処理部、処理結果データに可視化処理を施すデータ可視化機能をデータ可視化作業、或いはデータ可視化部等と呼ぶ場合がある。
図1は、本実施例の分析支援システムの一構成例のブロック図である。同図のシステムは、計算機101、表示部として機能するディスプレイ102、入力装置103、及びデータベース(DB)104を備える。計算機101、DB104は、ネットワーク105を介して互いに接続される。
計算機101は、利用者100が分析作業を行う際に利用する。さらに、分析作業に関わる種々の機能を提供し、機能実行時のログを収集し、テンプレートを状況に合わせて抽出・推奨することにより利用者100の分析作業を支援する。
計算機101は、一般的なPC(Personal Computer)が想定されている。計算機101は、図示を省略した中央処理部(Central Processing Unit:CPU)となるプロセッサ、記憶部であるメモリ、及びインターフェース部であるインターフェースを備える。プロセッサは、メモリに記憶されたプログラムを処理することによって、各種処理を実行する。メモリは、処理を実行するためのプログラム、及びデータを記憶する。インターフェースとしては、キーボード、マウスなどの入力装置103に接続するもの、ディスプレイ102に接続するもの、ネットワーク105を介して、DB104などに接続するもの、などを備える。
DB104は、例えば、企業に関わる情報、各種統計データ、センサ等の時系列データ、Webアクセスログなどの各種データを保持するデータベースである。DB104は、図1に見るように、図示を省略した外部のストレージ装置に格納され、ネットワーク105を介して計算機101に接続されるように構成してもよいし、計算機101内に含まれるように構成してもよい。
計算機101は、入力データ作成部110、データ処理部120、データ可視化部130、ログ記録部140、ログDB141、テンプレート実行部150、テンプレート処理部160、テンプレート推奨部170、テンプレートDB180を備える。入力データ作成部110、データ処理部120、データ可視化部130、ログ記録部140、ログDB141、テンプレート実行部150、テンプレート処理部160、テンプレート推奨部170、テンプレートDB180は例えば、プログラムであってメモリに記憶され、プロセッサによって実行される機能ブロックである。ログDB141、テンプレートDB180は、それぞれログの、テンプレートのデータベースを示し、省略されたPC内の記憶部であるメモリに蓄積される。
入力データ作成部110は、利用者100あるいはテンプレート実行部150の指示によりDB104から必要なデータを抽出し、抽出したデータに入力データ作成処理を施すことにより、分析対象データを作成する。
データ処理部120は、利用者100あるいはテンプレート実行部150の指示により、入力データ作成部110が作成した分析対象データにデータ処理を施し、処理結果データを作成する。
データ可視化部130は、利用者100あるいはテンプレート実行部150の指示により、データ処理部120が作成した処理結果データに可視化処理を施し、可視化する。
ログ記録部140は、入力データ作成部110、データ処理部120、データ可視化部130の各処理をログDB141に記録する。
テンプレート実行部150は、利用者100の指示により、テンプレートDB180からテンプレートを取り出し、テンプレートの内容に従って入力データ作成部110、データ処理部120、データ可視化部130に指示し、分析処理を実行する。
テンプレート処理部160は、テンプレートからパラメータに関わる情報の抽出、入力データ作成部110が作成した分析対象データやデータ処理部120が作成した処理結果データに対してテンプレートが実行可能かどうかの判定を行う。
テンプレート推奨部170は、予め定められた基準でテンプレートDB180からテンプレートを抽出し、利用者100に提示する、また、入力データ作成部110が作成した分析対象データやデータ処理部120が作成した処理結果データに対して適用可能なテンプレートをテンプレートDB180から抽出し、利用者100に提示する。
次に、第一の実施例の分析支援システムの計算機101での処理について、具体例を参照しながら説明する。本実施例では、利用者100が、作業1「DBから必要なデータを抽出し、抽出したデータに入力データ作成処理を施すことにより分析対象データを作成」、作業2「分析対象データにデータ処理を施し処理結果データを作成」、作業3「処理結果データに可視化処理を施し可視化」、作業4「作業1からやり直す」という順番で分析作業を行う場面を想定する。
図2は、第一の実施例の上記作業1の手順の一例を示すフローチャートである。
まず、プロセッサは、テンプレート推奨部170が指定された基準に従い、テンプレートDB180から入力データ作成部110で実行できるテンプレートを抽出し、リストLiに登録する(S201)。ここで基準とは、最近利用者100が使ったテンプレート、全利用者がよく使うテンプレート、利用者100以外の特定の利用者がよく使うテンプレート、部署別によく使われるテンプレート、過去この時期によく使われたテンプレート、などのテンプレートの推奨基準を意味する。
まず、プロセッサは、テンプレート推奨部170が指定された基準に従い、テンプレートDB180から入力データ作成部110で実行できるテンプレートを抽出し、リストLiに登録する(S201)。ここで基準とは、最近利用者100が使ったテンプレート、全利用者がよく使うテンプレート、利用者100以外の特定の利用者がよく使うテンプレート、部署別によく使われるテンプレート、過去この時期によく使われたテンプレート、などのテンプレートの推奨基準を意味する。
次に、抽出したリストLiを表示部であるディスプレイ102に表示する(S202)。ディスプレイ102への表示例を図3Aに示す。利用者100がテンプレートTiを選択した場合、テンプレート実行部150が入力データ作成部用のテンプレートTiを実行する(S203、S204)。図3Bはテンプレートのデータ構造、及びテンプレートの一例を示す図である。ここで示すテンプレートは、入力データ作成部用、データ処理部用、データ可視化部用で同じ構造を想定しているが、各部で実行可能であれば異なる構造であっても構わない。同図の上段は、テンプレートのデータ構造を、同図の下段は、テンプレートの一例を示している。同図の上段に見るように、テンプレートのデータ構造は、その項目名に見るように、パラメータ、処理名、引数からなり、図示する内容のデータが記載される。
利用者100がテンプレートを選択しなかった場合は、テンプレートによる分析作業の支援は行わず、GUI(Graphical User Interface)操作などによる通常の分析作業を実施する(S205)。S204やS205で指示され、入力データ作成部110で実行された入力データ作成処理が正常に終了した場合、その結果作成される分析対象データをDaとする。またログ記録部140が入力データ作成部110で実行した処理内容を記録し、ログDB141に登録する(S206、S207)。また、S204でテンプレートを選択した場合、実行したテンプレートに関するログも併せて記録し、ログDB141に登録する(S207)。
図3Cの上段、下段にそれぞれログのデータ構造及びログの一例を示す。同図のログ構造に見るように、項目名としてデータ列名、時刻、処理名、引数がある。また、図3Dの上段、下段にそれぞれテンプレートログのデータ構造及びテンプレートログの一例を示す。テンプレートログ構造の項目としては、図示の通り、時刻、処理種別、テンプレート名、パラメータ値、入力データ列名、出力データ列名、可視化結果図がある。図3Eには、可視化結果図のディスプレイ102の表示画面上の表示例を、図3Fにはパラメータ変更用のダイアログの表示画面上の表示例を示したが、これら図3E、図3Fについては後で詳述する。図2の作業1の処理フローチャートに戻り、正常に終了しなかった場合は、ディスプレイ102に問題発生箇所を表示し、終了する(S206、S220)。
さらに、テンプレートDB180からテンプレート推奨部170が入力データ作成部の処理の結果出力される分析対象データDaに適用可能であり、かつデータ処理部120で実行可能なテンプレートを抽出し、リストLdに登録する(S208)。S208の内容については後で図5を用いて詳述する。
図4A、図4Bは、第一の実施例の作業1の具体例を示す図である。具体例としては、選択テンプレートTiの内容が、「指定された二つのテーブルを、指定した列をキー列として統合し、指定した値にキー列名を変更する」の場合に、選択テンプレートTiを実行した結果作成される分析対象データDaの一例を示す。
図4Aは、テンプレートTiの例である。この例でのTiのパラメータは5つあり、パラメータ1は、種別がE(その他)で値が「テーブル1」、パラメータ2は種別がE(その他)で値が「テーブル2」、パラメータ3は種別がN(列名)で値が「列A」、パラメータ4は種別がN(列名)で値が「列X」、パラメータ5は、種別がE(その他)で値が「KEY」である。Tiで行う処理はパラメータ1~5を引数として、「指定された2つのテーブル(パラメータ1,2)を、指定した2つの列(パラメータ3、パラメータ4)をキー列として統合し、指定した値(パラメータ5)にキー列名を変更する」を行う。図4Bは「テーブル統合」のイメージを示す図である。
入力データ作成部110で実行可能な処理は図4A、図4Bで示した「テーブル統合」に限ったものではなく、フィルタリングや文字列の置換などSQLやプログラミング言語等で実現可能な処理を複数組み合わせたものを対象とする。
図5は、図2のフローチャートで示したS208の処理について詳述するフローチャート図である。
まず、テンプレートログから処理種別が「データ処理用」であるログを全て抽出し、リストL2に登録する。空のリストLdを用意する。分析対象データDaの列名リストをC1とする(S501)。L2の要素数をN2、 K2=0とする(S502)。L2のK2番目のログから入力データ列名リストC2を取得し、C2⊆C1である場合、リストLdにL2のK2番目のテンプレートを追加する。この処理をL2の要素全てに実行する(S503~S507)。以上が、本実施例における作業1の手順の説明である。
まず、テンプレートログから処理種別が「データ処理用」であるログを全て抽出し、リストL2に登録する。空のリストLdを用意する。分析対象データDaの列名リストをC1とする(S501)。L2の要素数をN2、 K2=0とする(S502)。L2のK2番目のログから入力データ列名リストC2を取得し、C2⊆C1である場合、リストLdにL2のK2番目のテンプレートを追加する。この処理をL2の要素全てに実行する(S503~S507)。以上が、本実施例における作業1の手順の説明である。
図6は、第一の実施例の作業2の手順の一例を示すフローチャートである。
まず、ディスプレイにS208で作成したデータ処理テンプレートリストLdを表示する(S601)。ディスプレイ102への表示例は図3Aに示すものと同様である。利用者100がテンプレートを選択した場合、テンプレート実行部150がデータ処理部用のテンプレートTdを実行する(S602、S603)。図3Bはテンプレートのデータ構造及びテンプレートの一例を示す図である。ここで示すテンプレートは、入力データ作成部用、データ処理部用、データ可視化部用で同じ構造を想定しているが、各部で実行可能であれば異なる構造であっても構わない。
まず、ディスプレイにS208で作成したデータ処理テンプレートリストLdを表示する(S601)。ディスプレイ102への表示例は図3Aに示すものと同様である。利用者100がテンプレートを選択した場合、テンプレート実行部150がデータ処理部用のテンプレートTdを実行する(S602、S603)。図3Bはテンプレートのデータ構造及びテンプレートの一例を示す図である。ここで示すテンプレートは、入力データ作成部用、データ処理部用、データ可視化部用で同じ構造を想定しているが、各部で実行可能であれば異なる構造であっても構わない。
利用者100がテンプレートを選択しなかった場合は、テンプレートによる分析作業の支援は行わず、GUI操作などによる通常の分析作業を実施する(S604)。S603やS604で指示され、データ処理部120で実行された分析処理が正常に終了した場合、その結果作成される処理結果データをDrとする。また、ログ記録部140がデータ処理部120で実行した処理内容を記録し、ログDB141に登録する(S605、S606)。また、S603でテンプレートを選択した場合、実行したテンプレートに関するログも併せて記録し、ログDB141に登録する(S606)。図3Cにログのデータ構造及びログの一例を示す。図3Dにテンプレートログのデータ構造及びテンプレートログの一例を示す。正常に終了しなかった場合、ディスプレイに問題発生箇所を表示し、終了する(S605、S220)。
さらに、テンプレートDB180からテンプレート推奨部170がデータ処理部の処理の結果出力される処理結果データDrに適用可能でありかつデータ可視化部130で実行可能なテンプレートを抽出し、リストLvに登録する(S607)。S607の内容については図8で詳述する。
図7は、第一の実施例の前記作業2の具体例を示す図である。具体例としては、選択テンプレートTdの内容が「指定した列の要素の出現数を数える」の場合に、選択テンプレートTdを実行した結果作成される処理結果データDrの一例を示す。
図7Aは、テンプレートTdの例である。この例でのTdのパラメータは1つあり、パラメータ1は、種別がN(列名)で値が「KEY」である。Tdで行う処理はパラメータ1を引数として、「指定した列(パラメータ1)の要素の出現数を数える」を行う。図7Bは「要素の出現数を数える」のイメージを示す図である。
データ処理部で実行可能な処理は図7で示した「要素の出現数を数える」に限ったものではなく、フィルタリングや文字列の置換、四則演算、統計演算などSQLやプログラミング言語等で実現可能な処理を複数組み合わせたものを対象とする。
図8は、図6のフローチャート中のS607の処理について詳述する図である。
まず、テンプレートログから処理種別が「可視化用」であるログを全て抽出し、リストL2に登録する。空のリストLvを用意する。処理結果データDrの列名リストをC1とする(S801)。L2の要素数をN2、 K2=0とする(S802)。L2のK2番目のログから入力データ列名リストC2を取得し、C2⊆C1である場合、リストLvにL2のK2番目のテンプレートを追加する。この処理をL2の要素全てに実行する(S803~S807)。以上が、本実施例における作業2の手順の説明である。
まず、テンプレートログから処理種別が「可視化用」であるログを全て抽出し、リストL2に登録する。空のリストLvを用意する。処理結果データDrの列名リストをC1とする(S801)。L2の要素数をN2、 K2=0とする(S802)。L2のK2番目のログから入力データ列名リストC2を取得し、C2⊆C1である場合、リストLvにL2のK2番目のテンプレートを追加する。この処理をL2の要素全てに実行する(S803~S807)。以上が、本実施例における作業2の手順の説明である。
図9は、第一の実施例の前記作業3の手順の一例を示すフローチャートである。
まず、ディスプレイにS607で作成したデータ可視化テンプレートリストLv及びLvに含まれる各テンプレートの可視化例を表示する(S901)。ディスプレイ102への表示例を図3A、図3Eに示す。図3Eの310はLvの一覧、311には、310に表示されているテンプレート名を選択すると過去にこのデータ可視化テンプレートの可視化結果が表示される。
まず、ディスプレイにS607で作成したデータ可視化テンプレートリストLv及びLvに含まれる各テンプレートの可視化例を表示する(S901)。ディスプレイ102への表示例を図3A、図3Eに示す。図3Eの310はLvの一覧、311には、310に表示されているテンプレート名を選択すると過去にこのデータ可視化テンプレートの可視化結果が表示される。
利用者100がテンプレートを選択した場合、テンプレート実行部150がデータ可視化部用のテンプレートTvを実行する(S902、S903)。図3Bはテンプレートのデータ構造及びテンプレートの一例を示す図である。ここで示すテンプレートは、入力データ作成部用、データ処理部用、データ可視化部用で同じ構造を想定しているが、各部で実行可能であれば異なる構造であっても構わない。
利用者100がテンプレートを選択しなかった場合は、テンプレートによる分析作業の支援は行わず、GUI操作などによる通常の分析作業を実施する(S904)。S903やS904で指示され、データ可視化部130で実行された分析処理が正常に終了した場合、可視化結果をディスプレイ102に表示する。また、ログ記録部140がデータ可視化部130で実行した処理内容を記録し、ログDB141に登録する(S905、S906)。また、S903でテンプレートを選択した場合、実行したテンプレートに関するログも併せて記録し、ログDB141に登録する(S906)。図3Cにログのデータ構造及びログの一例を示す。図3Dにテンプレートログのデータ構造及びテンプレートログの一例を示す。正常に終了しなかった場合、ディスプレイに問題発生箇所を表示し、終了する(S905、S220)。
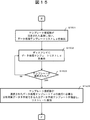
さらに、可視化結果が利用者100の所望のものではなかった場合、利用者100が前記作業1~3の処理を改変して再実行する(S907)。S907の内容については図11で詳述する。
図10A、図10Bは、第一の実施例の前記作業3の具体例を示す図である。具体例としては、選択テンプレートTvの内容が「指定した列を棒グラフで表示し、指定した列を横軸の項目名とする」の場合に、選択テンプレートTvを実行した結果作成される可視化の一例を示す。
図10Aは、テンプレートTvの例である。この例でのTvのパラメータは2つあり、パラメータ1は、種別がN(列名)で値が「要素の出現数」、パラメータ2は、種別がN(列名)で値が「KEY」である。Tvで行う処理はパラメータ1、2を引数として、「指定した列(パラメータ1)を棒グラフで表示し、指定した列(パラメータ2)を横軸の項目名とする」を行う。図10Bは「棒グラフ」のイメージを示す図である。
データ可視化部で実行可能な処理は図10で示した「指定した列を棒グラフで表示し、指定した列を横軸の項目名とする」に限ったものではなく、グラフ化、アニメーション、などプログラミング言語等で実現可能な処理を複数組み合わせたものを対象とする。
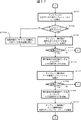
図11は、図9のフローチャートのS907の内容について詳述する図であり、第一の実施例の前記作業4の手順の一例を示すフローチャートである。
まず、入力データ作成部用のテンプレートTiのパラメータを変更するか、入力データ作成部用のテンプレートTiを選択しなおすか、選択する(S1101,S1102)。入力データ作成部用のテンプレートTiを選択しなおす場合、S201に進む。この処理については前述の通りであるため、ここでは割愛する。
まず、入力データ作成部用のテンプレートTiのパラメータを変更するか、入力データ作成部用のテンプレートTiを選択しなおすか、選択する(S1101,S1102)。入力データ作成部用のテンプレートTiを選択しなおす場合、S201に進む。この処理については前述の通りであるため、ここでは割愛する。
入力データ作成部用のテンプレートTiのパラメータを変更する場合、テンプレート処理部160が Tiからパラメータを抽出し、ディスプレイにパラメータ一覧を表示する(S1103)。利用者100により変更するパラメータが選択された場合、ディスプレイにパラメータ編集用のウィンドウを表示し、利用者100により変更されたパラメータ及びその値を取得し、変更されたパラメータを反映させた入力データ作成部用のテンプレートTiを実行する(S1104~S1107)。
パラメータ編集用のウィンドウの一例を図3Fに示す。図3Fの301にはパラメータ名、302には値の候補、303には、302で選択された値が表示され、利用者100はこの値を採用してもよいし、この値を編集してもよい。302に表示される値の候補は、自動的に取得される。例えば、パラメータの種別が「T」である場合、アクセス可能なテーブル名一覧が302に表示される。
入力データ作成部110で実行された入力データ作成処理が正常に終了した場合、その結果作成される分析対象データをDaとする。またログ記録部140が入力データ作成部110で実行した処理内容を記録し、ログDB141に登録する(S1108、S1109)。また、実行したテンプレートTiに関するログも併せて記録し、ログDB141に登録する(S1109)。図3Cにログのデータ構造及びログの一例を示す。図3Dにテンプレートログのデータ構造及びテンプレートログの一例を示す。正常に終了しなかった場合、ディスプレイに問題発生箇所を表示し、終了する(S1108、S220)。
さらに、テンプレート処理部160が分析対象データDaに対してTdが実行可能かどうか判定し、判定結果からTdが実行可能な場合、テンプレート実行部150がTdを実行する(S1110、S1111、S1113)。S1110の内容については図12で詳述する。
データ処理部120で実行されたデータ処理が正常に終了した場合、その結果作成される処理結果データをDrとする。またログ記録部140がデータ処理部120で実行した処理内容を記録し、ログDB141に登録する(S1114、S1115)。また、実行したテンプレートTdに関するログも併せて記録し、ログDB141に登録する(S1115)。図3Cにログのデータ構造及びログの一例を示す。図3Dにテンプレートログのデータ構造及びテンプレートログの一例を示す。
S1111で実行不可能である場合、またはS1114で正常終了しなかった場合、テンプレート推奨部170が分析対象データDaに適用可能なデータ処理部用のテンプレートを抽出し、リストLdに登録し(S1112)、S601に進む。
さらに、テンプレート処理部160が処理結果データDrに対してTvが実行可能かどうか判定し、判定結果からTvが実行可能な場合、テンプレート実行部150がTvを実行する(S1116、S1117、S1119)。S1116の内容については図13で詳述する。
データ可視化部130で実行された可視化処理が正常に終了した場合、可視化結果をディスプレイに表示する。またログ記録部140がデータ可視化部130で実行した処理内容を記録し、ログDB141に登録する(S1120、S1121)。また、実行したテンプレートTvに関するログも併せて記録し、ログDB141に登録する(S1121)。図3Cにログのデータ構造及びログの一例を示す。図3Dにテンプレートログのデータ構造及びテンプレートログの一例を示す。
S1117で実行不可能である場合、またはS1120で正常終了しなかった場合、テンプレート推奨部170が処理結果データDrに適用可能なデータ可視化部用のテンプレートを抽出し、リストLvに登録し(S1118)、S901に進む。
図12は、S1110の処理について詳述する図である。
まず、テンプレート処理部160が、テンプレートログからデータ処理部用のテンプレートTdを実行したログを全て抽出し、リストL2に登録する(S1201)。L2の要素数をN2、K2=0とする、分析対象データDaの列名リストをC1とする(S1202)。L2のK2番目のログから入力データ列名リストC2を取得し、C2⊆C1である場合、判定結果を「実行可能」とし、Tdに与えるパラメータをL2のK2番目のログのパラメータ値として、終了する。この処理をL2の要素全てに実行し(S1203~S1207)、判定結果が「実行可能」にならない場合、判定結果を「実行不可能」として終了する(S1203、S1208)。
図13は、S1116の処理について詳述する図である。
まず、テンプレート処理部160が、テンプレートログからデータ可視化部用のテンプレートTvを実行したログを全て抽出し、リストL2に登録する(S1301)。L2の要素数をN2、K2=0とする、処理結果データDrの列名リストをC1とする(S1302)。L2のK2番目のログから入力データ列名リストC2を取得し、C2⊆C1である場合、判定結果を「実行可能」とし、Tvに与えるパラメータをL2のK2番目のログのパラメータ値として、終了する。この処理をL2の要素全てに実行し(S1303~S1307)、判定結果が「実行可能」にならない場合、判定結果を「実行不可能」として終了する(S1303、S1308)。
図14A~図4Fは、第一の実施例の前記作業4の具体例を示す図である。具体例としては、図4、図7、図10の作業1~作業3の分析処理では、「列A」及び「列X」をキー列として入力データ作成処理を行ったが、図14A~図4Fの例ではS1103~S1105で入力データ作成部用のテンプレートTiのパラメータ3を「列C」に、パラメータ4を「列Z」にそれぞれ変更し、「列C」及び「列Z」をキー列として入力データ作成処理を行った場合に、テンプレートTd、Tvを用いてデータ処理、可視化処理を実行する場面を想定する。
図14Aは、S1103~S1106で入力データ作成部用のテンプレートTiのパラメータ3を「列C」に、パラメータ4を「列Z」にそれぞれ変更し「指定された2つのテーブル(パラメータ1,2)を、指定した2つの列(パラメータ3、パラメータ4)をキー列として統合し、指定した値(パラメータ5)にキー列名を変更する」を行う。図14Bは「テーブル統合」のイメージを示す図である。
図14Cは、選択テンプレートTdの例である。この例では選択テンプレートTdはテンプレートTiの実行の結果の分析対象データDaに適用可能であるため、パラメータの変更などは行わない。図14Dは「要素の出現数を数える」のイメージを示す図である。
図14Eは、テンプレートTvの例である。この例ではテンプレートTvはテンプレートTdの実行の結果の処理結果データDrに適用可能であるため、パラメータの変更などは行わない。図14Fは「棒グラフ」のイメージを示す図である。
以上説明した第一の実施例によれば、分析作業の入力データ作成処理の変更が可能となり、また入力データ作成処理の変更に伴う、データ処理、可視化処理の変更もテンプレートを用いて支援することが可能となるため、利用者100の分析作業の手間を削減することが可能となる。
以上説明した第一の実施例では、具体例としては、利用者100が作業1「DB104から必要なデータを抽出し、抽出したデータに入力データ作成処理を施すことにより分析対象データを作成」、作業2「分析対象データにデータ処理を施し処理結果データを作成」、作業3「処理結果データに可視化処理を施し可視化」、作業4「作業1からやり直す」という順番で分析作業を行う場面を想定したが、第二の実施例では、作業2、作業1、作業3、作業4の順番で分析作業を行う場面を想定したデータ分析支援システムの実施例である。
図15は、第二の実施例の、前記作業2の手順の一例を示すフローチャートである。
まず、テンプレート推奨部170が指定された基準に従い、テンプレートDB180からデータ処理部120で実行できるテンプレートを抽出し、リストLdに登録する(S1501)。ここで指定された基準とは、最近利用者100が使ったテンプレート、全利用者がよく使うテンプレート、利用者100以外の特定の利用者がよく使うテンプレート、部署別によく使われるテンプレート、過去この時期によく使われたテンプレート、などを意味する。
まず、テンプレート推奨部170が指定された基準に従い、テンプレートDB180からデータ処理部120で実行できるテンプレートを抽出し、リストLdに登録する(S1501)。ここで指定された基準とは、最近利用者100が使ったテンプレート、全利用者がよく使うテンプレート、利用者100以外の特定の利用者がよく使うテンプレート、部署別によく使われるテンプレート、過去この時期によく使われたテンプレート、などを意味する。
次に、抽出したリストLdをディスプレイ102に表示する(S1502)。ディスプレイ102への表示例を図3Aに示す。利用者100がテンプレートを選択した場合、テンプレート推奨部が選択されたデータ処理テンプレートTdの実行に必要な分析対象データを作成できる入力データ作成テンプレートを抽出し、リストLiに登録する(S1503,S1504)。
図16はS1504の処理を詳述する図である。
テンプレートログからTdを実行したログを全て抽出しL1とする。テンプレートログから処理種別が「入力データ作成用」であるログを全て抽出し、L2とする。空のリストをLiとする(S1601)。L1の要素数をN1、L2の要素数をN2、K1=0、K2=0とする(S1602)。L1のK1番目のログから入力データ列名リストC1を取得する(S1603)。L2のK2番目のログから出力データ列名リストC2取得し、C2⊆C1である場合、リストLiにL2のK2番目のテンプレートを追加する。この処理をL1及びL2の要素全てに実行する(S1603~S1610)。
テンプレートログからTdを実行したログを全て抽出しL1とする。テンプレートログから処理種別が「入力データ作成用」であるログを全て抽出し、L2とする。空のリストをLiとする(S1601)。L1の要素数をN1、L2の要素数をN2、K1=0、K2=0とする(S1602)。L1のK1番目のログから入力データ列名リストC1を取得する(S1603)。L2のK2番目のログから出力データ列名リストC2取得し、C2⊆C1である場合、リストLiにL2のK2番目のテンプレートを追加する。この処理をL1及びL2の要素全てに実行する(S1603~S1610)。
図17は、第二の実施例の前記作業1の手順の一例を示すフローチャートである。
まず、ディスプレイにS1504で作成した入力データ作成テンプレートリストLiを表示する(S1701)。ディスプレイ102への表示例は図3Aに示すものと同様である。利用者100がテンプレートを選択した場合、テンプレート実行部150が入力データ作成部用のテンプレートTiを実行する(S1702、S1703)。図3Bはテンプレートのデータ構造及びテンプレートの一例を示す図である。ここで示すテンプレートは、入力データ作成部用、データ処理部用、データ可視化部用で同じ構造を想定しているが、各部で実行可能であれば異なる構造であっても構わない。
まず、ディスプレイにS1504で作成した入力データ作成テンプレートリストLiを表示する(S1701)。ディスプレイ102への表示例は図3Aに示すものと同様である。利用者100がテンプレートを選択した場合、テンプレート実行部150が入力データ作成部用のテンプレートTiを実行する(S1702、S1703)。図3Bはテンプレートのデータ構造及びテンプレートの一例を示す図である。ここで示すテンプレートは、入力データ作成部用、データ処理部用、データ可視化部用で同じ構造を想定しているが、各部で実行可能であれば異なる構造であっても構わない。
利用者100がテンプレートを選択しなかった場合は、テンプレートによる分析作業の支援は行わず、GUI操作などによる通常の分析作業を実施する(S1704)。S1703やS1704で指示され、入力データ作成部110で実行された入力データ作成処理が正常に終了した場合、その結果作成される分析対象データをDaとする。また、ログ記録部140が入力データ作成部110で実行した処理内容を記録し、ログDB141に登録する(S1705、S1706)。また、S1703でテンプレートを選択した場合、実行したテンプレートに関するログも併せて記録し、ログDB141に登録する(S1706)。図3Cにログのデータ構造及びログの一例を示す。図3Dにテンプレートログのデータ構造及びテンプレートログの一例を示す。正常に終了しなかった場合、ディスプレイに問題発生箇所を表示し、終了する(S1705、S220)。
次に、テンプレート実行部150がデータ処理部用のテンプレートTdを実行する(S1707)。図3Bはテンプレートのデータ構造及びテンプレートの一例を示す図である。ここで示すテンプレートは、入力データ作成部用、データ処理部用、データ可視化部用で同じ構造を想定しているが、各部で実行可能であれば異なる構造であっても構わない。
データ処理部120で実行された分析処理が正常に終了した場合、その結果作成される処理結果データをDrとする。また、ログ記録部140がデータ処理部120で実行した処理内容を記録し、ログDB141に登録する(S1708、S1709)。また、実行したテンプレートに関するログも併せて記録し、ログDB141に登録する(S1709)。図3Cにログのデータ構造及びログの一例を示す。図3Dにテンプレートログのデータ構造及びテンプレートログの一例を示す。正常に終了しなかった場合、ディスプレイに問題発生箇所を表示し、終了する(S1708、S220)。
さらに、テンプレートDB180からテンプレート推奨部170がデータ処理部の処理の結果出力される処理結果データDrに適用可能でありかつデータ可視化部130で実行可能なテンプレートを抽出し、リストLvに登録する(S1710)。S1710の内容についてはS607と同様である。
図18は、第二の実施例の前記作業3の手順の一例を示すフローチャートである。
まず、ディスプレイにS1710で作成した可視化テンプレートリストLv及びLvに含まれる各テンプレートの可視化例を表示する(S1801)。ディスプレイ102への表示例は図3A、3Eに示すものと同様である。利用者100がテンプレートを選択した場合、テンプレート実行部150がデータ可視化部用のテンプレートTvを実行する(S1802、S1803)。図3Bはテンプレートのデータ構造及びテンプレートの一例を示す図である。ここで示すテンプレートは、入力データ作成部用、データ処理部用、データ可視化部用で同じ構造を想定しているが、各部で実行可能であれば異なる構造であっても構わない。
利用者100がテンプレートを選択しなかった場合は、テンプレートによる分析作業の支援は行わず、GUI操作などによる通常の分析作業を実施する(S1804)。S1803やS1804で指示され、データ可視化部130で実行された分析処理が正常に終了した場合、可視化結果をディスプレイ102に表示する。また、ログ記録部140がデータ可視化部130で実行した処理内容を記録し、ログDB141に登録する(S1805、S1806)。また、S1803でテンプレートを選択した場合、実行したテンプレートに関するログも併せて記録し、ログDB141に登録する(S1806)。図3Cにログのデータ構造及びログの一例を示す。図3Dにテンプレートログのデータ構造及びテンプレートログの一例を示す。正常に終了しなかった場合、ディスプレイに問題発生箇所を表示し、終了する(S1805、S220)。
さらに、可視化結果が利用者100の所望のものではなかった場合、前記作業1~3の処理を改変して再実行する(S1807)。S1807の内容については図19で詳述する。
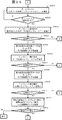
図19、図20A、図20Bは、S1807の内容について詳述する図であり、第二の実施例の前記作業4の手順の一例を示すフローチャートである。
まず、データ処理部用のテンプレートTdを変更するかどうか、選択する(S1901)。データ処理部用のテンプレートTdを変更する場合、テンプレート推奨部170が指定された基準に従い、テンプレートDB180からデータ処理部120で実行できるテンプレートを抽出し、利用者100に提示し、利用者100の選択を受けて、S1903に進む(S1902)。ここで指定された基準とは、最近利用者100が使ったテンプレート、全利用者がよく使うテンプレート、利用者100以外の特定の利用者がよく使うテンプレート、部署別によく使われるテンプレート、過去この時期によく使われたテンプレート、などを意味する。
まず、データ処理部用のテンプレートTdを変更するかどうか、選択する(S1901)。データ処理部用のテンプレートTdを変更する場合、テンプレート推奨部170が指定された基準に従い、テンプレートDB180からデータ処理部120で実行できるテンプレートを抽出し、利用者100に提示し、利用者100の選択を受けて、S1903に進む(S1902)。ここで指定された基準とは、最近利用者100が使ったテンプレート、全利用者がよく使うテンプレート、利用者100以外の特定の利用者がよく使うテンプレート、部署別によく使われるテンプレート、過去この時期によく使われたテンプレート、などを意味する。
次に、テンプレート処理部160が Tdからパラメータを抽出し、ディスプレイにパラメータ一覧を表示する(S1903)。利用者100によりパラメータが変更された場合、利用者100により変更されたパラメータ及びその値を取得し、S2001に進む(S1904、S1905)。パラメータ編集用のウィンドウの一例を図3Fに示す。図3Fの302に表示される値の候補は、選択されたパラメータに応じてTiの実行の結果得られるデータDaなどから自動的に入手する。
次に、分析対象データDaの列名リストをC0とし、データ処理部用のテンプレートTdから種別が「N」であるパラメータ及び引数の値を取り出し列名リストC2に登録する(S2001、S2002)。C2⊆C0の場合、S1907に進む(S2003)。C2⊆C0ではない場合、Tiの行数をR0、K0=0とする(S2004)。
Tiの1~K0行目までを実行し、その結果作成されるデータの列名リストをC0’とし、C2⊆C0 ’である場合、TiのK0行目までをTiとし、S1907に進む。この処理をK0=R0になるまで続け、K0=R0となったらS2010に進む(S2005~S2009)。
次に、テンプレートログから処理種別が「入力データ作成用」であるログを全て抽出し、リストL1に登録する(S2010)。L1の要素数をN1、K1=0とする(S2011)。L1のK1番目のログから出力データ列名リストC1取得し、C2⊆C1の場合、L1のK1番目のテンプレートをTiとし、S1907に進む。この処理をK1=R1になるまで続け、K1=R1となったらS2017に進む(S2012~S2016)。
次に、L1の要素数をN1、K1=0とする(S2017)。L1のK1番目のテンプレートをTK1とする。TK1の行数をR3、K3=0とする。TK1の1~K3行目までを実行し、その結果作成されるデータの列名リストをC3’とする。C2⊆C3 ’の場合、TiのK3行目までをTiとし、S1907に進む。この処理をTK1の全行とL1の全要素に適用し、K1=N1となった場合、Tiを空にし、S1907に進む(S2018~S2025)。
次に、Tiが空の場合、テンプレートによる分析作業の支援は行わず、GUI操作などによる通常の分析作業を実施する(S1907、S1908)。Tiが空ではない場合、テンプレート実行部150が入力データ作成部用のテンプレートTiを実行する(S1907、S1909)。S1908やS1909で指示され、入力データ作成部110で実行された入力データ作成処理が正常に終了した場合、ログ記録部140が入力データ作成部110で実行した処理内容を記録し、ログDB141に登録する(S1910、S1911)。また、S1909でテンプレートTiを実行した場合、実行したテンプレートに関するログも併せて記録し、ログDB141に登録する(S1911)。正常に終了しなかった場合、ディスプレイに問題発生箇所を表示し、終了する(S1910、S220)。
テンプレート実行部150がTdを実行する(S1912)。データ処理部120で実行されたデータ処理が正常に終了した場合、その結果作成される処理結果データをDrとする。またログ記録部140がデータ処理部120で実行した処理内容を記録し、ログDB141に登録する(S1913、S1914)。また、実行したテンプレートTdに関するログも併せて記録し、ログDB141に登録する(S1914)。正常に終了しなかった場合、ディスプレイに問題発生箇所を表示し、終了する(S1913、S220)。
さらに、テンプレート処理部160が処理結果データDrに対してTvが実行可能かどうか判定し、判定結果からTvが実行可能な場合、テンプレート実行部150がTvを実行する(S1915、S1916、S1917)。S1915の内容については図13で既述のためここでは割愛する。
データ可視化部130で実行された可視化処理が正常に終了した場合、可視化結果をディスプレイに表示する。またログ記録部140がデータ可視化部130で実行した処理内容を記録し、ログDB141に登録する(S1918、S1919)。また、実行したテンプレートTvに関するログも併せて記録し、ログDB141に登録する(S1919)。正常に終了しなかった場合、ディスプレイに問題発生箇所を表示し、終了する(S1918、S220)。
S1916で実行不可能である場合、テンプレート推奨部170が処理結果データDrに適用可能なデータ可視化部用のテンプレートを抽出し、リストLvに登録しS1801に進む(S1920)。
図21A~図21Fは、第二の実施例の前記作業4の具体例を示す図である。具体例としては、図4、図7、図10の作業1~作業3の分析処理では、「要素数を数える」としてデータ処理を行ったが、図21の例ではS1902~S1906でデータ処理部用のテンプレートTdを「指定した二列のクロス集計を行う」を選択し、パラメータ1を「KEY」、パラメータ2を「列A」とし、テンプレートTi、Tvを用いてデータ処理、可視化処理を実行する場面を想定する。
図21Aは、テンプレートTdの例である。この例でのTdのパラメータは2つあり、パラメータ1は、種別がN(列名)で値が「KEY」、パラメータ2は、種別がN(列名)で値が「列A」である。Tdで行う処理はパラメータ1、2を引数として、「指定した二列(パラメータ1、パラメータ2)のクロス集計を行う」を行う。図21Bは「クロス集計」のイメージを示す図である。
図21Cは、テンプレートTiの例である。テンプレートTdの変更では、テンプレートTiに影響が無いためパラメータの変更などは行わない。図21Dは「テーブル統合」のイメージを示す図である。
図21Eは、テンプレートTvの例である。この例では処理結果データDrの変更に伴い、適用可能なテンプレートTvを抽出する。図21Eは抽出されたTvの内容が「指定した2列を棒グラフで表示し、指定した列を横軸の項目名とする」の場合を示し、図21Fは「棒グラフ」のイメージを示す図である。
以上説明した第二の実施例によれば、分析作業のデータ処理の変更が可能となり、またデータ処理の変更に伴う、入力データ作成処理、可視化処理の変更もテンプレートを用いて支援することが可能となるため、利用者100の分析作業の手間を削減することが可能となる。
第一の実施例では、利用者100が作業1「DB104から必要なデータを抽出し、抽出したデータに入力データ作成処理を施すことにより分析対象データを作成」、作業2「分析対象データにデータ処理を施し処理結果データを作成」、作業3「処理結果データに可視化処理を施し可視化」、作業4「作業1からやり直す」を実行する際、作業3、作業2、作業1、作業4の順番で分析作業を行う場面を想定した実施例である。
図22は、第三の実施例の前記作業3の手順の一例を示すフローチャートである。
まず、テンプレート推奨部170が指定された基準に従い、テンプレートDB180から入力データ作成部110で実行できるテンプレートを抽出し、リストLvに登録する(S2201)。ここで指定された基準とは、最近利用者100が使ったテンプレート、全利用者がよく使うテンプレート、利用者100以外の特定の利用者がよく使うテンプレート、部署別によく使われるテンプレート、過去この時期によく使われたテンプレート、などを意味する。
まず、テンプレート推奨部170が指定された基準に従い、テンプレートDB180から入力データ作成部110で実行できるテンプレートを抽出し、リストLvに登録する(S2201)。ここで指定された基準とは、最近利用者100が使ったテンプレート、全利用者がよく使うテンプレート、利用者100以外の特定の利用者がよく使うテンプレート、部署別によく使われるテンプレート、過去この時期によく使われたテンプレート、などを意味する。
次に、抽出したリストLv及びLvに含まれる各テンプレートの可視化例をディスプレイ102に表示する(S2202)。ディスプレイ102への表示例を図3A、図3Eに示す。利用者100がテンプレートを選択した場合、テンプレート推奨部が選択された可視化テンプレートTvの実行に必要な処理結果データを作成できるデータ処理テンプレートを抽出しリストLdに登録する(S2203,S2204)。
図23はS2204の処理を詳述する図である。
テンプレート処理部がテンプレートログからTvを実行したログを全て抽出しL1とする。テンプレートログから処理種別が「データ処理用」であるログを全て抽出し、L2とする。空のリストをLdとする(S2301)。L1の要素数をN1、L2の要素数をN2、K1=0、K2=0とする(S2302)。L1のK1番目のログから入力データ列名リストC1を取得する(S2303)。L2のK2番目のログから出力データ列名リストC2取得し、C2⊆C1である場合、リストLdにL2のK2番目のテンプレートを追加する。この処理をL1及びL2の要素全てに実行する(S2303~S2310)。
テンプレート処理部がテンプレートログからTvを実行したログを全て抽出しL1とする。テンプレートログから処理種別が「データ処理用」であるログを全て抽出し、L2とする。空のリストをLdとする(S2301)。L1の要素数をN1、L2の要素数をN2、K1=0、K2=0とする(S2302)。L1のK1番目のログから入力データ列名リストC1を取得する(S2303)。L2のK2番目のログから出力データ列名リストC2取得し、C2⊆C1である場合、リストLdにL2のK2番目のテンプレートを追加する。この処理をL1及びL2の要素全てに実行する(S2303~S2310)。
図24は、第三の実施例の前記作業2の手順の一例を示すフローチャートである。
まず、ディスプレイにS2204で作成したデータ処理テンプレートリストLdを表示する(S2401)。ディスプレイ102への表示例は図3Aに示すものと同様である。利用者100がテンプレートを選択した場合、テンプレート推奨部がテンプレート推奨部が選択されたデータ処理テンプレートTdの実行に必要な分析対象データを作成できる入力データ作成テンプレートを抽出し、リストLiに登録する(S2403)。S2403の内容についてはS1504と同様である。
まず、ディスプレイにS2204で作成したデータ処理テンプレートリストLdを表示する(S2401)。ディスプレイ102への表示例は図3Aに示すものと同様である。利用者100がテンプレートを選択した場合、テンプレート推奨部がテンプレート推奨部が選択されたデータ処理テンプレートTdの実行に必要な分析対象データを作成できる入力データ作成テンプレートを抽出し、リストLiに登録する(S2403)。S2403の内容についてはS1504と同様である。
図25は、第三の実施例の前記作業1の手順の一例を示すフローチャートである。
まず、ディスプレイにS2403で作成した入力データ作成テンプレートリストLiを表示する(S2501)。ディスプレイ102への表示例は図3Aに示すものと同様である。利用者100がテンプレートを選択した場合、テンプレート実行部150が入力データ作成部用のテンプレートTiを実行する(S2502、S2503)。図3Bはテンプレートのデータ構造及びテンプレートの一例を示す図である。ここで示すテンプレートは、入力データ作成部用、データ処理部用、データ可視化部用で同じ構造を想定しているが、各部で実行可能であれば異なる構造であっても構わない。
まず、ディスプレイにS2403で作成した入力データ作成テンプレートリストLiを表示する(S2501)。ディスプレイ102への表示例は図3Aに示すものと同様である。利用者100がテンプレートを選択した場合、テンプレート実行部150が入力データ作成部用のテンプレートTiを実行する(S2502、S2503)。図3Bはテンプレートのデータ構造及びテンプレートの一例を示す図である。ここで示すテンプレートは、入力データ作成部用、データ処理部用、データ可視化部用で同じ構造を想定しているが、各部で実行可能であれば異なる構造であっても構わない。
入力データ作成部110で実行された入力データ作成処理が正常に終了した場合、その結果作成される分析対象データをDaとする。また、ログ記録部140が入力データ作成部110で実行した処理内容を記録し、ログDB141に登録する(S2504、S2505)。また、実行したテンプレートに関するログも併せて記録し、ログDB141に登録する(S2505)。図3Cにログのデータ構造及びログの一例を示す。図3Dにテンプレートログのデータ構造及びテンプレートログの一例を示す。正常に終了しなかった場合、ディスプレイに問題発生箇所を表示し、終了する(S2504、S220)。
次に、テンプレート実行部150がデータ処理部用のテンプレートTdを実行する(S2506)。図3Bはテンプレートのデータ構造及びテンプレートの一例を示す図である。ここで示すテンプレートは、入力データ作成部用、データ処理部用、データ可視化部用で同じ構造を想定しているが、各部で実行可能であれば異なる構造であっても構わない。
データ処理部120で実行された分析処理が正常に終了した場合、その結果作成される処理結果データをDrとする。また、ログ記録部140がデータ処理部120で実行した処理内容を記録し、ログDB141に登録する(S2507、S2508)。また、実行したテンプレートに関するログも併せて記録し、ログDB141に登録する(S2508)。図3Cにログのデータ構造及びログの一例を示す。図3Dにテンプレートログのデータ構造及びテンプレートログの一例を示す。正常に終了しなかった場合、ディスプレイに問題発生箇所を表示し、終了する(S2507、S220)。
次に、テンプレート実行部150がデータ可視化部用のテンプレートTvを実行する(S2509)。データ可視化部130で実行された分析処理が正常に終了した場合、可視化結果をディスプレイ102に表示する。また、ログ記録部140がデータ可視化部130で実行した処理内容を記録し、ログDB141に登録する(S2510、S2511)。また、実行したテンプレートに関するログも併せて記録し、ログDB141に登録する(S2511)。正常に終了しなかった場合、ディスプレイに問題発生箇所を表示し、終了する(S2510、S220)。
さらに、可視化結果が利用者100の所望のものではなかった場合、前記作業1~3の処理を改変して再実行する(S2512)。S2512の内容については図26A~図26Dで詳述する。
図26A~図26Dは、S2512の内容について詳述する図であり、第三の実施例の前記作業4の手順の一例を示すフローチャートである。
まず、データ可視化部用のテンプレートTvを変更するかどうか、選択する(S2601)。データ可視化部用のテンプレートTvを変更する場合、テンプレート推奨部170が指定された基準に従い、テンプレートDB180からデータ可視化部130で実行できるテンプレートを抽出し、利用者100に提示し、利用者100の選択を受けて、S2603に進む(S2602)。ここで指定された基準とは、最近利用者100が使ったテンプレート、全利用者がよく使うテンプレート、利用者100以外の特定の利用者がよく使うテンプレート、部署別によく使われるテンプレート、過去この時期によく使われたテンプレート、などを意味する。
まず、データ可視化部用のテンプレートTvを変更するかどうか、選択する(S2601)。データ可視化部用のテンプレートTvを変更する場合、テンプレート推奨部170が指定された基準に従い、テンプレートDB180からデータ可視化部130で実行できるテンプレートを抽出し、利用者100に提示し、利用者100の選択を受けて、S2603に進む(S2602)。ここで指定された基準とは、最近利用者100が使ったテンプレート、全利用者がよく使うテンプレート、利用者100以外の特定の利用者がよく使うテンプレート、部署別によく使われるテンプレート、過去この時期によく使われたテンプレート、などを意味する。
次に、テンプレート処理部160が Tvからパラメータを抽出し、ディスプレイにパラメータ一覧を表示する(S2603)。利用者100によりパラメータが選択された場合、ディスプレイにパラメータ編集用のウィンドウを表示し、利用者100により変更されたパラメータ及びその値を取得し、S2701に進む(S2604、S2605)。パラメータ編集用のウィンドウの一例を図3Fに示す。図3Fの302に表示される値の候補は、選択されたパラメータに応じてTdの実行の結果得られるデータDrなどから自動的に入手する。
次に、処理結果データDrの列名リストをC0とし、データ可視化部用のテンプレートTvから種別が「N」であるパラメータ及び引数の値を取り出し列名リストC2に登録する(S2701、S2702)。C2⊆C0の場合、S2607に進む(S2703)。C2⊆C0ではない場合、Tdの行数をR0、K0=0とする(S2704)。
Tdの1~K0行目までを実行し、その結果作成されるデータの列名リストをC0’とし、C2⊆C0 ’である場合、TdのK0行目までをTdとし、S2607に進む。この処理をK0=R0になるまで続け、K0=R0となったらS2710に進む(S2705~S2709)。
次に、テンプレートログから処理種別が「データ処理用」であるログを全て抽出し、リストL1に登録する(S2710)。L1の要素数をN1、K1=0とする(S2711)。L1のK1番目のログから出力データ列名リストC1取得し、C2⊆C1の場合、L1のK1番目のテンプレートをTiとし、S2607に進む。この処理をK1=R1になるまで続け、K1=R1となったらS2717に進む(S2712~S2716)。
次に、L1の要素数をN1、K1=0とする(S2717)。L1のK1番目のテンプレートをTK1とする。TK1の行数をR3、K3=0とする。TK1の1~K3行目までを実行し、その結果作成されるデータの列名リストをC3’とする。C2⊆C3 ’の場合、TiのK3行目までをTiとし、S2607に進む。この処理をTK1の全行とL1の全要素に適用し、K1=N1となった場合、Tdを空にし、S2607に進む(S2718~S2725)。
次に、Tdが空の場合、ディスプレイに問題発生箇所を表示し、終了する(S2507、S220)。Tdが空ではない場合、S2001に進む(S2507)。
分析対象データDaの列名リストをC0とし、データ処理部用のテンプレートTdから種別が「N」であるパラメータ及び引数の値を取り出し列名リストC2に登録する(S2001、S2002)。C2⊆C0の場合、S2608に進む(S2003)。C2⊆C0ではない場合、Tiの行数をR0、K0=0とする(S2004)。
分析対象データDaの列名リストをC0とし、データ処理部用のテンプレートTdから種別が「N」であるパラメータ及び引数の値を取り出し列名リストC2に登録する(S2001、S2002)。C2⊆C0の場合、S2608に進む(S2003)。C2⊆C0ではない場合、Tiの行数をR0、K0=0とする(S2004)。
Tiの1~K0行目までを実行し、その結果作成されるデータの列名リストをC0’とし、C2⊆C0 ’である場合、TiのK0行目までをTiとし、S1907に進む。この処理をK0=R0になるまで続け、K0=R0となったらS2010に進む(S2005~S2009)。
次に、テンプレートログから処理種別が「入力データ作成用」であるログを全て抽出し、リストL1に登録する(S2010)。L1の要素数をN1、K1=0とする(S2011)。L1のK1番目のログから出力データ列名リストC1取得し、C2⊆C1の場合、L1のK1番目のテンプレートをTiとし、S2608に進む。この処理をK1=R1になるまで続け、K1=R1となったらS2017に進む(S2012~S2016)。
次に、L1の要素数をN1、K1=0とする(S2017)。L1のK1番目のテンプレートをTK1とする。TK1の行数をR3、K3=0とする。TK1の1~K3行目までを実行し、その結果作成されるデータの列名リストをC3’とする。C2⊆C3 ’の場合、TiのK3行目までをTiとし、S2608に進む。この処理をTK1の全行とL1の全要素に適用し、K1=N1となった場合、Tiを空にし、S2608に進む(S2018~S2025)。
次に、Tiが空の場合、テンプレートによる分析作業の支援は行わず、GUI操作などによる通常の分析作業を実施する(S2608、S2609)。Tiが空ではない場合、テンプレート実行部150が入力データ作成部用のテンプレートTiを実行する(S2608、S2610)。S2609やS2610で指示され、入力データ作成部110で実行された入力データ作成処理が正常に終了した場合、ログ記録部140が入力データ作成部110で実行した処理内容を記録し、ログDB141に登録する(S2611、S2612)。また、S2610でテンプレートTiを実行した場合、実行したテンプレートに関するログも併せて記録し、ログDB141に登録する(S2612)。正常に終了しなかった場合、ディスプレイに問題発生箇所を表示し、終了する(S2611、S220)。
次に、テンプレート実行部150がTdを実行する(S2613)。データ処理部120で実行されたデータ処理が正常に終了した場合、ログ記録部140がデータ処理部120で実行した処理内容を記録し、ログDB141に登録する(S2614、S2615)。また、実行したテンプレートTdに関するログも併せて記録し、ログDB141に登録する(S2615)。正常に終了しなかった場合、ディスプレイに問題発生箇所を表示し、終了する(S2614、S220)。
次に、テンプレート実行部150がTvを実行する(S2616)。データ可視化部130で実行された可視化処理が正常に終了した場合、可視化結果をディスプレイに表示する。またログ記録部140がデータ可視化部130で実行した処理内容を記録し、ログDB141に登録する(S2617、S2618)。また、実行したテンプレートTvに関するログも併せて記録し、ログDB141に登録する(S2618)。正常に終了しなかった場合、ディスプレイに問題発生箇所を表示し、終了する(S2617、S220)。
図27A、図27Bは、第三の実施例の前記作業4の具体例を示す図である。具体例としては、図4、図7、図10の作業1~作業3の分析処理では、「指定した列を棒グラフで表示し、指定した列を横軸の項目名とする」として可視化を行ったが、図27A、図27Bの例ではS2602~S2606でデータ可視化部用のテンプレートTvを「指定した列を円グラフで表示し、指定した列を項目名とする」を選択し、パラメータ1を「要素の出現数」、パラメータ2を「KEY」とし、テンプレートTi、Tdを用いて入力データ作成処理、データ処理を実行する場面を想定する。
図27Aは、テンプレートTvの例である。この例でのTvのパラメータは2つあり、パラメータ1は、種別がN(列名)で値が「要素の出現数」、パラメータ2は、種別がN(列名)で値が「KEY」である。Tvで行う処理はパラメータ1、2を引数として、「指定した列(パラメータ1)を円グラフで表示し、指定した列(パラメータ2)を項目名とする」である。図21Bは「円グラフ」のイメージを示す図である。テンプレートTi及びTdによる処理それぞれ図4、図7と同様のため、ここでは割愛する。
第三の実施例によれば、分析作業の可視化処理の変更が可能となり、また可視化処理の変更に伴う、入力データ作成処理、データ処理の変更もテンプレートを用いて支援することが可能となるため、利用者100の分析作業の手間を削減することが可能となる。
第四の実施例では、利用者100が作業1「DB104から必要なデータを抽出し、抽出したデータに入力データ作成処理を施すことにより分析対象データを作成」、作業2「分析対象データにデータ処理を施し処理結果データを作成」、作業3「処理結果データに可視化処理を施し可視化」、作業4「作業1からやり直す」を実行する際、作業3、作業1、作業2、作業4の順番で分析作業を行う場面を想定した実施例である。
図28A、図28Bは第四の実施例の手順の一例を示すフローチャートである。
まず、テンプレート推奨部170が指定された基準に従い、テンプレートDB180からデータ可視化部130で実行できるテンプレートを抽出し、リストLvに登録する(S2801)。ここで指定された基準とは、最近利用者100が使ったテンプレート、全利用者がよく使うテンプレート、利用者100以外の特定の利用者がよく使うテンプレート、部署別によく使われるテンプレート、過去この時期によく使われたテンプレート、などを意味する。
まず、テンプレート推奨部170が指定された基準に従い、テンプレートDB180からデータ可視化部130で実行できるテンプレートを抽出し、リストLvに登録する(S2801)。ここで指定された基準とは、最近利用者100が使ったテンプレート、全利用者がよく使うテンプレート、利用者100以外の特定の利用者がよく使うテンプレート、部署別によく使われるテンプレート、過去この時期によく使われたテンプレート、などを意味する。
次に、抽出したリストLv及びLvに含まれる各テンプレートの可視化例をディスプレイ102に表示する(S2802)。ディスプレイ102への表示例を図3A、図3Eに示す。利用者100がテンプレートを選択した場合、テンプレート推奨部がテンプレートログから選択された可視化テンプレートTvの直前に実行した入力データ作成テンプレートを全て抽出し、リストLiに登録し、ディスプレイにLiを表示する(S2803~S2805)。入力データ作成用テンプレートTiが選択された場合、Tiを実行する(S2806、S2807)。テンプレート推奨部170がテンプレートログからTiとTvの間にあるデータ処理テンプレートを全て抽出し、リストLdに登録し、ディスプレイにLdを表示する(S2808、S2809)。
データ処理用テンプレートTdが選択された場合、Tdのパラメータを変更するかどうか選択する(S2810、S2811)。パラメータを変更する場合、テンプレート処理部170がTdからパラメータを抽出し、ディスプレイにパラメータ一覧を表示する(S2812)。パラメータが選択された場合、ディスプレイにパラメータ編集用のウィンドウを表示する(S2813、S2814)。パラメータ編集が終了した場合、Tdを実行する(S2815、S2816)。パラメータ変更をしない場合、Tdを実行する(S2816)。パラメータ編集用のウィンドウの例は図3Fに示す。図3Fの302に表示される値の候補は、選択されたパラメータに応じてTiの実行の結果得られるデータなどから自動的に入手する。
次に、Tdのパラメータ変更や可視化のための要素の変更のために、Tvのパラメータを変更する。テンプレート処理部170がTvからパラメータを抽出し、ディスプレイにパラメータ一覧を表示する(S2817)。パラメータが選択された場合、ディスプレイにパラメータ編集用のウィンドウを表示する(S2818)。パラメータ編集用のウィンドウの例は図3Fに示す。図3Fの302に表示される値の候補は、選択されたパラメータに応じてTdの実行の結果得られるデータなどから自動的に入手する。
パラメータ編集が終了した場合Tvを実行し、可視化結果をディスプレイに表示し、ログ記録部140が入力データ作成部110、データ処理部120、データ可視化部130でそれぞれ実行した処理内容を記録し、ログDB141に登録する(S2820~S2822)。
S2804~S2806では、入力データ作成用テンプレートを選択しているが、図2のS205のように、テンプレートによる分析作業の支援は行わず、GUI操作などによる通常の分析作業を実施しても構わない。
S2806で入力データ作成用テンプレートTiを選択した後、Tiのパラメータ変更が可能であるが、その場合、それ以降の処理は実施例1と同様となる。
S2807~S2809では、データ処理用テンプレートを選択しているが、図6のS604のように、テンプレートによる分析作業の支援は行わず、GUI操作などによる通常の分析作業を実施しても構わない。
第四の実施例によれば、分析作業の可視化結果から分析作業の開始が可能となる。つまり可視化結果を実現するために必要な入力データ作成処理、データ処理の構築をテンプレートを利用して支援することが可能となるため、利用者100の分析作業の手間を削減することが可能となる。
第五の実施例では、利用者100が作業1「DB104から必要なデータを抽出し、抽出したデータに入力データ作成処理を施すことにより分析対象データを作成」、作業2「分析対象データにデータ処理を施し処理結果データを作成」、作業3「処理結果データに可視化処理を施し可視化」、作業4「作業1からやり直す」という作業を、作業1、作業3、作業2、作業4の順番で分析作業を行う場面を想定した実施例である。
図29は第五の実施例の手順の一例を示すフローチャートである。
まず、テンプレート推奨部170が指定された基準に従い、テンプレートDB180から入力データ作成部110で実行できるテンプレートを抽出し、リストLiに登録する。また、テンプレートログからLiに含まれる入力データ作成テンプレートの直後に実行されているデータ可視化テンプレートを全て抽出し、リストLeに登録する(S2901)。ここで指定された基準とは、最近利用者100が使ったテンプレート、全利用者がよく使うテンプレート、利用者100以外の特定の利用者がよく使うテンプレート、部署別によく使われるテンプレート、過去この時期によく使われたテンプレート、などを意味する。
まず、テンプレート推奨部170が指定された基準に従い、テンプレートDB180から入力データ作成部110で実行できるテンプレートを抽出し、リストLiに登録する。また、テンプレートログからLiに含まれる入力データ作成テンプレートの直後に実行されているデータ可視化テンプレートを全て抽出し、リストLeに登録する(S2901)。ここで指定された基準とは、最近利用者100が使ったテンプレート、全利用者がよく使うテンプレート、利用者100以外の特定の利用者がよく使うテンプレート、部署別によく使われるテンプレート、過去この時期によく使われたテンプレート、などを意味する。
次に、抽出したリストLiをディスプレイ102に表示する。このとき、ユーザの操作によりLiからテンプレートが選択された場合、選択されたテンプレートに対応するデータ可視化テンプレートの可視化結果図をLeから抽出し、ディスプレイに表示する(S2902)。ディスプレイ102への表示例を図30に示す。3001はLiの一覧、3002には、3001に表示されているテンプレート名を選択すると過去にこの入力データ作成テンプレートを実行した直後に実行されたデータ可視化テンプレートの可視化結果が表示される。
利用者100がテンプレートを選択した場合、選択されたテンプレートTiを実行する(S2903,S2904).テンプレート推奨部がテンプレートログから選択された入力データ作成テンプレートTiの直後に実行したデータ可視化テンプレートを全て抽出し、リストLvに登録し、ディスプレイにLvを表示する(S2905,S2906)。データ可視化テンプレートTvが選択された場合、テンプレート推奨部170がテンプレートログからTiとTvの間にあるデータ処理テンプレートを全て抽出し、リストLdに登録し、ディスプレイにLdを表示する(S2907、図28BのS2808,S2809)。
これ以降の処理手順は、図28Bで説明済みであるため、割愛する。
これ以降の処理手順は、図28Bで説明済みであるため、割愛する。
第五の実施例によれば、分析作業を開始する際に、分析の対象としたいデータと、そのデータを用いて可視化可能な図を提示することにより、ユーザの分析結果イメージを実現する分析の実施が可能となる。つまり可視化結果を実現するために必要な入力データ作成処理、データ処理の構築をテンプレートを利用して支援することが可能となるため、利用者100の分析作業の手間を削減することが可能となる。
なお、本発明は上記した実施例に限定されるものではなく、様々な変形例が含まれる。例えば、上記した実施例は本発明のより良い理解のために詳細に説明したのであり、必ずしも説明の全ての構成を備えるものに限定されものではない。
また、ある実施例の構成の一部を他の実施例の構成に置き換えることが可能であり、また、ある実施例の構成に他の実施例の構成を加えることが可能である。また、各実施例の構成の一部について、他の構成の追加・削除・置換をすることが可能である。
更に、上述した各構成、機能、処理部等は、それらの一部又は全部を、例えば集積回路で設計する等によりハードウェアで実現しても良いし、それらの一部又は全部を実現するプログラムを作成することによりソフトウェアで実現しても良いことは言うまでもない。
100 利用者
101 計算機
102 ディスプレイ
103 入力装置
104 データベース(DB)
110 入力データ作成部
120 データ処理部
130 データ可視化部
140 ログ記録部
141 ログDB
150 テンプレート実行部
160 テンプレート処理部
170 テンプレート推奨部
180 テンプレートDB
301 パラメータ名
302 値の候補
303 選択された値
310、3001 テンプレートリスト一覧
311、3002 可視化結果
101 計算機
102 ディスプレイ
103 入力装置
104 データベース(DB)
110 入力データ作成部
120 データ処理部
130 データ可視化部
140 ログ記録部
141 ログDB
150 テンプレート実行部
160 テンプレート処理部
170 テンプレート推奨部
180 テンプレートDB
301 パラメータ名
302 値の候補
303 選択された値
310、3001 テンプレートリスト一覧
311、3002 可視化結果
Claims (15)
- 計算機を用いたデータ分析支援方法であって、
前記計算機は、
データに入力データ作成処理を施すことにより分析対象データを作成する入力データ作成機能と、データにデータ処理を施し処理結果データを作成するデータ処理機能と、データに可視化処理を施し可視化するデータ可視化機能を実行することによりデータ分析支援の作業を行う
ことを特徴とするデータ分析支援方法。 - 請求項1に記載のデータ分析支援方法であって、
前記計算機は、
前記入力データ作成機能、前記データ処理機能、或いは前記データ可視化機能を実行するためのテンプレートを蓄積するテンプレートデータベースを利用し、
利用者に対して次作業についてのテンプレートを推奨するテンプレート推奨機能と、前記テンプレートを実行するテンプレート実行機能を実行する
ことを特徴とするデータ分析支援方法。 - 請求項2に記載のデータ分析支援方法であって、
前記計算機は
利用者が部分的に変更した前記テンプレートに対して、前記テンプレート推奨機能を用いて、前記テンプレートデータベースに蓄積されたテンプレートの中から、適用可能なテンプレートを推奨する
ことを特徴とするデータ分析支援方法。 - 請求項2に記載のデータ分析支援方法であって、
前記計算機は、
前記テンプレート実行機能により、前記入力データ作成機能、前記データ処理機能、前記データ可視化機能を用いて、前記テンプレートを実行する
ことを特徴とするデータ分析支援方法。 - 請求項2に記載のデータ分析支援方法であって、
前記計算機は、
指定された基準に従い、前記テンプレート推奨機能を実行して得られた入力データ作成テンプレートのリストから、選択された前記入力データ作成テンプレートを、前記テンプレート実行機能により実行する
ことを特徴とするデータ分析支援方法。 - 請求項2に記載のデータ分析支援方法であって、
前記計算機は、
指定された基準に従い、前記テンプレート推奨機能を実行して得られたデータ処理テンプレートのリストから、選択された前記データ処理テンプレートの実行に必要な前記分析対象データを作成できる、前記入力データ作成テンプレートを抽出する
ことを特徴とするデータ分析支援方法。 - 請求項2に記載のデータ分析支援方法であって、
前記計算機は、
指定された基準に従い、前記テンプレート推奨機能を実行して得られたデータ可視化テンプレートリストから、選択された前記データ可視化テンプレートの実行に必要な前記処理結果データを作成できる、前記データ処理テンプレートを抽出する
ことを特徴とするデータ分析支援方法。 - 請求項2に記載のデータ分析支援方法であって、
前記計算機は、
指定された基準に従い、前記テンプレート推奨機能を実行して得られたデータ可視化テンプレートリストから、選択された前記データ可視化テンプレートの直前に実行された入力データ作成テンプレートを抽出して得られた入力データ作成テンプレートリストから、選択された前記入力データ作成テンプレートを、前記テンプレート実行機能により実行する
ことを特徴とするデータ分析支援方法。 - 請求項2に記載のデータ分析支援方法であって、
前記計算機は、
指定された基準に従い、前記テンプレート推奨機能を実行して抽出した入力データ作成テンプレートリストから、選択された前記入力データ作成テンプレートの直後に実行されたデータ可視化テンプレートを抽出して得られたデータ可視化テンプレートリストから、選択された前記データ可視化テンプレートと、選択された前記入力データ作成テンプレートとの間で実行されたデータ処理テンプレートを抽出して得られるデータ処理テンプレートリストから、選択された前記データ処理テンプレートを、前記テンプレート実行機能により実行する
ことを特徴とするデータ分析支援方法。 - データ分析支援システムであって、
複数のテンプレートを蓄積するテンプレートデータベースを記憶する記憶部と、
前記テンプレートを実行する処理部とを備え、
前記処理部は、
データに入力データ作成処理を施すことにより分析対象データを作成する入力データ作成機能と、データにデータ処理を施し処理結果データを作成するデータ処理機能と、データに可視化処理を施し可視化するデータ可視化機能を実行することによりデータ分析支援の作業を行う
ことを特徴とするデータ分析支援システム。 - 請求項10に記載のデータ分析支援システムであって、
前記処理部は、
利用者に対して次作業についてのテンプレートを推奨するテンプレート推奨機能を備え、
前記テンプレート推奨機能の実行の結果、選択された前記テンプレートを実行する
ことを特徴とするデータ分析支援システム。 - 請求項11に記載のデータ分析支援システムであって、
前記処理部は
利用者が部分的に変更した前記テンプレートに対して、前記テンプレート推奨機能により、前記テンプレートデータベースに蓄積されたテンプレートの中から、適用可能なテンプレートを推奨する
ことを特徴とするデータ分析支援システム。 - 請求項11に記載のデータ分析支援システムであって、
前記処理部は、
前記入力データ作成機能、前記データ処理機能、前記データ可視化機能を用いて、選択された前記テンプレートを実行する
ことを特徴とするデータ分析支援システム。 - 請求項13に記載のデータ分析支援システムであって、
表示部を更に備え、
前記処理部は、
指定された基準に従い、前記テンプレート推奨機能を実行して得られた前記テンプレートを前記表示部に表示する
ことを特徴とするデータ分析支援システム。 - 請求項14に記載のデータ分析支援システムであって、
前記処理部は、
前記表示部に表示された前記テンプレートから、選択された前記テンプレートを前記データ可視化機能で実行した得られた図例を前記表示部に同時に表示する
ことを特徴とするデータ分析支援システム。
Priority Applications (2)
| Application Number | Priority Date | Filing Date | Title |
|---|---|---|---|
| PCT/JP2012/067887 WO2014010071A1 (ja) | 2012-07-13 | 2012-07-13 | データ分析支援方法及びシステム |
| JP2014524563A JP5918368B2 (ja) | 2012-07-13 | 2012-07-13 | データ分析支援方法及びシステム |
Applications Claiming Priority (1)
| Application Number | Priority Date | Filing Date | Title |
|---|---|---|---|
| PCT/JP2012/067887 WO2014010071A1 (ja) | 2012-07-13 | 2012-07-13 | データ分析支援方法及びシステム |
Publications (1)
| Publication Number | Publication Date |
|---|---|
| WO2014010071A1 true WO2014010071A1 (ja) | 2014-01-16 |
Family
ID=49915573
Family Applications (1)
| Application Number | Title | Priority Date | Filing Date |
|---|---|---|---|
| PCT/JP2012/067887 WO2014010071A1 (ja) | 2012-07-13 | 2012-07-13 | データ分析支援方法及びシステム |
Country Status (2)
| Country | Link |
|---|---|
| JP (1) | JP5918368B2 (ja) |
| WO (1) | WO2014010071A1 (ja) |
Cited By (10)
| Publication number | Priority date | Publication date | Assignee | Title |
|---|---|---|---|---|
| JP2016081213A (ja) * | 2014-10-15 | 2016-05-16 | 株式会社日立製作所 | 可視化手段選択支援システム、可視化手段選択支援方法、および可視化手段選択支援プログラム |
| WO2018011985A1 (ja) * | 2016-07-15 | 2018-01-18 | 株式会社日立製作所 | 管理システム及びプラットフォーム構築支援方法 |
| WO2019039534A1 (ja) * | 2017-08-23 | 2019-02-28 | 株式会社日立製作所 | データ分析処理支援装置、及びデータ分析処理支援方法 |
| JP2019046335A (ja) * | 2017-09-06 | 2019-03-22 | 富士通株式会社 | データ解析支援プログラム、データ解析支援装置およびデータ解析支援方法 |
| WO2022026378A1 (en) * | 2020-07-30 | 2022-02-03 | Tableau Software, LLC | Interactive interface for data analysis and report generation |
| US11392608B2 (en) | 2019-06-17 | 2022-07-19 | Tableau Software, LLC | Analyzing marks in visualizations based on dataset characteristics |
| US11550815B2 (en) | 2020-07-30 | 2023-01-10 | Tableau Software, LLC | Providing and surfacing metrics for visualizations |
| US11573807B2 (en) | 2019-03-28 | 2023-02-07 | Tableau Software, LLC | Providing user interfaces based on data source semantics |
| US11579760B2 (en) | 2020-09-08 | 2023-02-14 | Tableau Software, LLC | Automatic data model generation |
| US11783266B2 (en) | 2019-09-18 | 2023-10-10 | Tableau Software, LLC | Surfacing visualization mirages |
Families Citing this family (1)
| Publication number | Priority date | Publication date | Assignee | Title |
|---|---|---|---|---|
| JP6827611B2 (ja) | 2019-01-28 | 2021-02-10 | 三菱電機株式会社 | 開発支援装置、開発支援システム、及び、開発支援方法 |
Citations (7)
| Publication number | Priority date | Publication date | Assignee | Title |
|---|---|---|---|---|
| JP2003058562A (ja) * | 2001-08-02 | 2003-02-28 | Ncr Internatl Inc | インタラクティブビジネスの分析環境下における予測モデルのコンピュータを利用した動的な分析構築方法 |
| JP2003058697A (ja) * | 2001-08-02 | 2003-02-28 | Ncr Internatl Inc | ビジネスの分析環境下における予測モデルのコンピュータを利用した統合方法 |
| JP2003150650A (ja) * | 2001-11-13 | 2003-05-23 | Hitachi Ltd | 解析作業支援装置及び解析作業支援機能を実現するためのプログラム |
| JP2006344211A (ja) * | 2005-05-26 | 2006-12-21 | Computer Patent Annuities Lp | 知的財産権分析・レポート作成システムと方法 |
| JP2011258097A (ja) * | 2010-06-11 | 2011-12-22 | Hitachi Ltd | データ処理装置 |
| JP2012073812A (ja) * | 2010-09-29 | 2012-04-12 | Hitachi Ltd | データ分析支援システム及び方法 |
| JP2012118968A (ja) * | 2010-12-01 | 2012-06-21 | Internatl Business Mach Corp <Ibm> | ユーザに支援式ビジネス分析を提供する方法、コンピュータ・プログラムおよび装置 |
-
2012
- 2012-07-13 JP JP2014524563A patent/JP5918368B2/ja not_active Expired - Fee Related
- 2012-07-13 WO PCT/JP2012/067887 patent/WO2014010071A1/ja active Application Filing
Patent Citations (7)
| Publication number | Priority date | Publication date | Assignee | Title |
|---|---|---|---|---|
| JP2003058562A (ja) * | 2001-08-02 | 2003-02-28 | Ncr Internatl Inc | インタラクティブビジネスの分析環境下における予測モデルのコンピュータを利用した動的な分析構築方法 |
| JP2003058697A (ja) * | 2001-08-02 | 2003-02-28 | Ncr Internatl Inc | ビジネスの分析環境下における予測モデルのコンピュータを利用した統合方法 |
| JP2003150650A (ja) * | 2001-11-13 | 2003-05-23 | Hitachi Ltd | 解析作業支援装置及び解析作業支援機能を実現するためのプログラム |
| JP2006344211A (ja) * | 2005-05-26 | 2006-12-21 | Computer Patent Annuities Lp | 知的財産権分析・レポート作成システムと方法 |
| JP2011258097A (ja) * | 2010-06-11 | 2011-12-22 | Hitachi Ltd | データ処理装置 |
| JP2012073812A (ja) * | 2010-09-29 | 2012-04-12 | Hitachi Ltd | データ分析支援システム及び方法 |
| JP2012118968A (ja) * | 2010-12-01 | 2012-06-21 | Internatl Business Mach Corp <Ibm> | ユーザに支援式ビジネス分析を提供する方法、コンピュータ・プログラムおよび装置 |
Cited By (13)
| Publication number | Priority date | Publication date | Assignee | Title |
|---|---|---|---|---|
| JP2016081213A (ja) * | 2014-10-15 | 2016-05-16 | 株式会社日立製作所 | 可視化手段選択支援システム、可視化手段選択支援方法、および可視化手段選択支援プログラム |
| WO2018011985A1 (ja) * | 2016-07-15 | 2018-01-18 | 株式会社日立製作所 | 管理システム及びプラットフォーム構築支援方法 |
| WO2019039534A1 (ja) * | 2017-08-23 | 2019-02-28 | 株式会社日立製作所 | データ分析処理支援装置、及びデータ分析処理支援方法 |
| US10901699B2 (en) | 2017-08-23 | 2021-01-26 | Hitachi, Ltd. | Data analysis process assistance device and data analysis process assistance method |
| JP2019046335A (ja) * | 2017-09-06 | 2019-03-22 | 富士通株式会社 | データ解析支援プログラム、データ解析支援装置およびデータ解析支援方法 |
| US11573807B2 (en) | 2019-03-28 | 2023-02-07 | Tableau Software, LLC | Providing user interfaces based on data source semantics |
| US11392608B2 (en) | 2019-06-17 | 2022-07-19 | Tableau Software, LLC | Analyzing marks in visualizations based on dataset characteristics |
| US11783266B2 (en) | 2019-09-18 | 2023-10-10 | Tableau Software, LLC | Surfacing visualization mirages |
| US11397746B2 (en) | 2020-07-30 | 2022-07-26 | Tableau Software, LLC | Interactive interface for data analysis and report generation |
| US11550815B2 (en) | 2020-07-30 | 2023-01-10 | Tableau Software, LLC | Providing and surfacing metrics for visualizations |
| WO2022026378A1 (en) * | 2020-07-30 | 2022-02-03 | Tableau Software, LLC | Interactive interface for data analysis and report generation |
| US11893039B2 (en) | 2020-07-30 | 2024-02-06 | Tableau Software, LLC | Interactive interface for data analysis and report generation |
| US11579760B2 (en) | 2020-09-08 | 2023-02-14 | Tableau Software, LLC | Automatic data model generation |
Also Published As
| Publication number | Publication date |
|---|---|
| JPWO2014010071A1 (ja) | 2016-06-20 |
| JP5918368B2 (ja) | 2016-05-18 |
Similar Documents
| Publication | Publication Date | Title |
|---|---|---|
| JP5918368B2 (ja) | データ分析支援方法及びシステム | |
| Dani et al. | Ten years of visualization of business process models: A systematic literature review | |
| Fahland | Process mining over multiple behavioral dimensions with event knowledge graphs | |
| US20170154026A1 (en) | Interaction relationship building and explorer for dashboard | |
| Ha et al. | A timed colored Petri nets modeling for dynamic workflow in product development process | |
| Piera et al. | Coloured Petri net scheduling models: Timed state space exploration shortages | |
| WO2009005942A1 (en) | Scheduling application allowing freeform data entry | |
| Powell | Microsoft Power BI cookbook: Creating business intelligence solutions of analytical data models, reports, and dashboards | |
| Koch et al. | Context model design for a process-oriented manufacturing change management | |
| Mamaliga | Realizing a process cube allowing for the comparison of event data | |
| Saraee et al. | A new data science framework for analysing and mining geospatial big data | |
| Berschik et al. | MBSE WITHIN THE ENGINEERING DESIGN COMMUNITY–AN EXPLORATORY STUDY | |
| Davidson et al. | A qualitative interview study of distributed tracing visualisation: A characterisation of challenges and opportunities | |
| JP4069701B2 (ja) | 作業支援装置 | |
| Omitola et al. | Capturing interactive data transformation operations using provenance workflows | |
| JP5772607B2 (ja) | 生成装置、生成方法、および生成プログラム | |
| Kourla et al. | REBD: A Conceptual Framework for Big Data Requirements Engineering | |
| Basole et al. | Understanding failure mode effect analysis data using interactive visual analytics | |
| Hostos et al. | A Literature Review of Evaluation Approaches for Cyber-Physical Production Systems. | |
| Gan | A data analytic module to extend grafana functionality | |
| Liebel et al. | Addressing model complexity in automotive system development: selection of system model elements for allocation of requirements | |
| WO2019225287A1 (ja) | ビジネスモデルの創出支援方法及びビジネスモデルの創出支援装置 | |
| Choi et al. | VPL-based big data analysis system: UDAS | |
| Razdyakonov et al. | Application of an Agent-Based Model to Develop Ontological Data Visual Management Tool | |
| Azzini et al. | Rules-based process mining to discover PLM system processes |
Legal Events
| Date | Code | Title | Description |
|---|---|---|---|
| 121 | Ep: the epo has been informed by wipo that ep was designated in this application |
Ref document number: 12880829 Country of ref document: EP Kind code of ref document: A1 |
|
| ENP | Entry into the national phase |
Ref document number: 2014524563 Country of ref document: JP Kind code of ref document: A |
|
| NENP | Non-entry into the national phase |
Ref country code: DE |
|
| 122 | Ep: pct application non-entry in european phase |
Ref document number: 12880829 Country of ref document: EP Kind code of ref document: A1 |