WO2013190627A1 - Correlation analyzing device and correlation analyzing method - Google Patents
Correlation analyzing device and correlation analyzing method Download PDFInfo
- Publication number
- WO2013190627A1 WO2013190627A1 PCT/JP2012/065552 JP2012065552W WO2013190627A1 WO 2013190627 A1 WO2013190627 A1 WO 2013190627A1 JP 2012065552 W JP2012065552 W JP 2012065552W WO 2013190627 A1 WO2013190627 A1 WO 2013190627A1
- Authority
- WO
- WIPO (PCT)
- Prior art keywords
- data
- correlation
- language
- numerical
- converted
- Prior art date
Links
Images


Classifications
-
- G—PHYSICS
- G05—CONTROLLING; REGULATING
- G05B—CONTROL OR REGULATING SYSTEMS IN GENERAL; FUNCTIONAL ELEMENTS OF SUCH SYSTEMS; MONITORING OR TESTING ARRANGEMENTS FOR SUCH SYSTEMS OR ELEMENTS
- G05B23/00—Testing or monitoring of control systems or parts thereof
- G05B23/02—Electric testing or monitoring
- G05B23/0205—Electric testing or monitoring by means of a monitoring system capable of detecting and responding to faults
- G05B23/0259—Electric testing or monitoring by means of a monitoring system capable of detecting and responding to faults characterized by the response to fault detection
- G05B23/0275—Fault isolation and identification, e.g. classify fault; estimate cause or root of failure
- G05B23/0278—Qualitative, e.g. if-then rules; Fuzzy logic; Lookup tables; Symptomatic search; FMEA
-
- G—PHYSICS
- G05—CONTROLLING; REGULATING
- G05B—CONTROL OR REGULATING SYSTEMS IN GENERAL; FUNCTIONAL ELEMENTS OF SUCH SYSTEMS; MONITORING OR TESTING ARRANGEMENTS FOR SUCH SYSTEMS OR ELEMENTS
- G05B23/00—Testing or monitoring of control systems or parts thereof
- G05B23/02—Electric testing or monitoring
- G05B23/0205—Electric testing or monitoring by means of a monitoring system capable of detecting and responding to faults
- G05B23/0218—Electric testing or monitoring by means of a monitoring system capable of detecting and responding to faults characterised by the fault detection method dealing with either existing or incipient faults
- G05B23/0243—Electric testing or monitoring by means of a monitoring system capable of detecting and responding to faults characterised by the fault detection method dealing with either existing or incipient faults model based detection method, e.g. first-principles knowledge model
- G05B23/0245—Electric testing or monitoring by means of a monitoring system capable of detecting and responding to faults characterised by the fault detection method dealing with either existing or incipient faults model based detection method, e.g. first-principles knowledge model based on a qualitative model, e.g. rule based; if-then decisions
- G05B23/0248—Causal models, e.g. fault tree; digraphs; qualitative physics
Abstract
A correlation analyzing device includes a data conversion section for converting a plurality of data items generated in different events and having different types or different temporal resolutions to data having a common data format by using relationship information that manages the relationships among the plurality of data items, and a correlation calculation section for calculating the correlations among the data obtained by the conversion in the data conversion section.
Description
本発明は、イベント間の関連性を分析する装置、特に、複数種類のデータを用いてイベントの原因分析の支援を行う相関分析装置及びその方法に関する。
The present invention relates to an apparatus for analyzing the relationship between events, and more particularly to a correlation analysis apparatus and method for supporting cause analysis of an event using a plurality of types of data.
背景技術として、人手によるメソッドを定義したRCA(Root Cause Analysis)やFTA(Fault Tree Analysis)がある。前者は、原因を木構造でリストアップしながら何段階か辿って根本原因を追究する手法である。後者は、因果の関連性をANDやORの分岐を持った木構造で表現するものである。
As background technologies, there are RCA (Root Cause Analysis) and FTA (Fault Tree Analysis) that define methods by hand. The former is a method for pursuing the root cause by tracing the cause in several stages while listing the cause in a tree structure. The latter expresses the causal relationship in a tree structure with AND and OR branches.
原因究明作業を支援するシステムの発明として、特許文献1がある。特許文献1には、単位時間当たりの変化が予め設定した閾値を超えた場合に、選別された他のデータを表示する機能を持つ技術が開示されている。
There is Patent Document 1 as an invention of a system for supporting cause investigation work. Patent Document 1 discloses a technique having a function of displaying other selected data when a change per unit time exceeds a preset threshold value.
また、原因究明作業を支援するシステムの発明として、特許文献2がある。特許文献2には、逸脱事象の発生原因を分析する際に、ヒューマンエラー樹形図を参照して、分析者に、逸脱事象の発生原因の分析を支援する支援情報を呈示する機能を持つ技術が開示されている。
Also, Patent Document 2 is an invention of a system for supporting cause investigation work. Patent Document 2 discloses a technology having a function of presenting support information for supporting analysis of a cause of a departure event to an analyst by referring to a human error tree diagram when analyzing the cause of the departure event. Is disclosed.
上記各特許文献に記載された発明では、扱える時系列の特徴量は均一であることを想定している。一方、原因を追求するための基礎データは、一般に複数種類のデータ(言語をデータ化したテキストデータ、センサデータや各種計測データ等の数値データ)が混在している。そのため、複数種類の基礎データを用いて原因分析する際には、各基礎データ間の関係を比較する必要がある。しかし、この点については、従来技術では何ら配慮されていない。また、複数種類の基礎データを用いて原因分析する際に、基礎データを大規模データに適用するための計算量やデータ量を削減することについても、従来技術では何ら配慮されていない。
In the inventions described in the above patent documents, it is assumed that the time-series feature values that can be handled are uniform. On the other hand, basic data for pursuing the cause is generally a mixture of a plurality of types of data (text data converted into language data, numerical data such as sensor data and various measurement data). Therefore, when performing cause analysis using a plurality of types of basic data, it is necessary to compare the relationship between the basic data. However, no consideration is given to this point in the prior art. Further, when performing cause analysis using a plurality of types of basic data, the conventional technology does not give any consideration to reducing the amount of calculation and the amount of data for applying the basic data to large-scale data.
本発明の目的は、複数種類のデータが混在する場合でも、複数種類のデータ間の相関の算出をすることができる相関分析装置及びその方法を提供することにある。
An object of the present invention is to provide a correlation analysis apparatus and method capable of calculating a correlation between a plurality of types of data even when a plurality of types of data are mixed.
上記課題を解決するために、本発明は、イベント毎に生起されるデータであって、種類または時間解像度の異なる複数のデータを、前記複数のデータ間の関連性を管理する関連性情報を用いて、各データ共通のデータ形式のデータに変換し、前記変換された各データの相関を算出することを特徴とする。
In order to solve the above-mentioned problem, the present invention uses relevance information for managing relevance between a plurality of data having different types or time resolutions, which is generated for each event. The data is converted into data having a common data format, and the correlation between the converted data is calculated.
本発明によれば、複数種類のデータが混在する場合でも、複数種類のデータ間の相関の算出をすることができる。
According to the present invention, even when multiple types of data are mixed, the correlation between the multiple types of data can be calculated.
以下、本発明の実施例を図面に基づいて説明する。
(第1実施例)
本実施例では、複数種類のデータ間の相関を算出可能とする例を説明する。 Embodiments of the present invention will be described below with reference to the drawings.
(First embodiment)
In the present embodiment, an example will be described in which a correlation between a plurality of types of data can be calculated.
(第1実施例)
本実施例では、複数種類のデータ間の相関を算出可能とする例を説明する。 Embodiments of the present invention will be described below with reference to the drawings.
(First embodiment)
In the present embodiment, an example will be described in which a correlation between a plurality of types of data can be calculated.
図1は、本発明に係る計算機システムの第1実施例を示す構成図である。図1において、計算機システムは、相関分析サーバ1001と、複数の端末1002と、ネットワーク1003とから構成され、相関分析サーバ1001と複数の端末1002が、それぞれネットワーク1003に接続される。相関分析サーバ1001は、相関を分析するための相関分析装置である。各端末1002は、ユーザに結果を提示したり、ユーザの操作入力を受け付けたりする端末である。なお、端末1002は、2つ以上から構成されていて、各ユーザが異なる分析結果の提示や要求を入力しても良く、既存のサーバクライアント方式などの構成によって、複数の端末1002から個別の操作を行うことが可能である。
FIG. 1 is a block diagram showing a first embodiment of a computer system according to the present invention. In FIG. 1, the computer system includes a correlation analysis server 1001, a plurality of terminals 1002, and a network 1003. The correlation analysis server 1001 and the plurality of terminals 1002 are connected to the network 1003, respectively. The correlation analysis server 1001 is a correlation analysis device for analyzing the correlation. Each terminal 1002 is a terminal that presents a result to the user or accepts a user operation input. Note that the terminal 1002 is composed of two or more, and each user may input a different analysis result presentation or request, and individual operations from a plurality of terminals 1002 depending on the configuration of an existing server client method or the like. Can be done.
ネットワーク1003は、相関分析サーバ1001および端末1002と情報通信を行うネットワークである。ネットワーク1003は、後述する操作指示や結果の表示を伝達できる通信が可能な通信方式であれば、どのようなものでもかまわない。また、その他の構成例として、ネットワーク1003を介さずに、端末1002を相関分析サーバ1001に直接接続する構成とすることも可能である。入力データの例として、センサデータ1004およびテキストデータ1005を想定している。
The network 1003 is a network that performs information communication with the correlation analysis server 1001 and the terminal 1002. The network 1003 may be any communication system that can perform communication that can transmit an operation instruction and a result display to be described later. As another configuration example, the terminal 1002 may be directly connected to the correlation analysis server 1001 without using the network 1003. As examples of input data, sensor data 1004 and text data 1005 are assumed.
次に、相関分析サーバ1001内部の構成を説明する。相関分析サーバ1001は、当該発明に関連する構成要素として、各種分析処理を行う処理部1010と、各種データを蓄積する記憶装置1020と、データ収集インタフェース(I/F)1030と、表示インタフェース(I/F)1040とから構成される。
Next, the internal configuration of the correlation analysis server 1001 will be described. The correlation analysis server 1001 includes a processing unit 1010 that performs various types of analysis processing, a storage device 1020 that stores various types of data, a data collection interface (I / F) 1030, and a display interface (I / F) 1040.
処理部1010は、センサデータ1004またはテキストデータ1005を原データ1021として記憶装置1020に格納し、格納した原データ1021を管理するデータ管理部1011と、後述する手順で原データ1021から特徴量を抽出する特徴量抽出部1012と、特徴量から相関を算出する相関算出部1013と、相関算出部1013で算出された相関を各種表示によってユーザに提示するための表示内容を構成する表示内容構成部1014を有するCPU(Central Processing Unit)で構成される。
The processing unit 1010 stores the sensor data 1004 or text data 1005 as original data 1021 in the storage device 1020, and extracts a feature amount from the original data 1021 by a data management unit 1011 that manages the stored original data 1021, and a procedure that will be described later. Feature amount extraction unit 1012, correlation calculation unit 1013 that calculates correlation from the feature amount, and display content configuration unit 1014 that configures display content for presenting the correlation calculated by correlation calculation unit 1013 to the user by various displays It consists of a CPU (Central Processing Unit) with
記憶装置1020には、センサデータやテキストデータ等の原データ1021、特徴量データ1022、相関データ1023などの各種データが保管される。
The storage device 1020 stores various data such as original data 1021 such as sensor data and text data, feature data 1022, and correlation data 1023.
データ収集I/F1030は、センサデータ1004およびテキストデータ1005などのデータを収集して、処理部1010中の、データ管理部1011に入力するためのインタフェースである。
The data collection I / F 1030 is an interface for collecting data such as sensor data 1004 and text data 1005 and inputting the collected data to the data management unit 1011 in the processing unit 1010.
表示I/F1040は、処理部1010中の、表示内容構成部1014の表示内容を、実際に端末1002に表示するためのインタフェースである。
The display I / F 1040 is an interface for actually displaying the display content of the display content configuration unit 1014 in the processing unit 1010 on the terminal 1002.
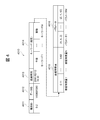
図2は、センサデータ等のセンサ系原データの構成図である。図2において、センサ系原データ2010は、設備に設置された計測機器(センサ)や運転制御盤の情報を抽出したデータ等からなるセンサ系の原データ(計測データ)であって、データID2011と、記述内容2012から構成される。
FIG. 2 is a configuration diagram of sensor system original data such as sensor data. In FIG. 2, sensor system original data 2010 is sensor system original data (measurement data) composed of data extracted from information of a measurement device (sensor) installed in the facility and an operation control panel, and a data ID 2011. , And the description content 2012.
データID2011は、原データ1021のうち、センサデータ1004から得られた原データ2010が、どの設備のどのセンサで発生したかを識別するIDである。また、記述内容2012は、データの発生した日時を示す日時2013と、データ発生元のセンサや計測装置を示すセンサID2014と、センサの出力値を示すセンサ出力値2015と、センサによるイベントの生起を示すフラグ2016から構成される。フラグ2016には、センサによるイベントの生起がある場合、「Y(あり)」が記録され、センサによるイベントの生起がない場合、「N(なし)」が記録される。
The data ID 2011 is an ID for identifying which sensor of which equipment the original data 2010 obtained from the sensor data 1004 out of the original data 1021 is generated. The description content 2012 includes a date and time 2013 indicating the date and time when the data is generated, a sensor ID 2014 indicating the sensor or measuring device that is the data generation source, a sensor output value 2015 indicating the output value of the sensor, and the occurrence of an event by the sensor. The flag 2016 is shown. In the flag 2016, “Y (present)” is recorded when an event has occurred by the sensor, and “N (none)” is recorded when no event has occurred by the sensor.
なお、多くのセンサでは出力値またはフラグの値は一つであるが、複合的に計測する装置を一まとめにしてひとつのセンサとみなす場合もあり、一般に一つ以上の出力値とフラグの値を持つことができるとする。
In many sensors, there is only one output value or flag value. However, there are cases where multiple measuring devices are grouped together and regarded as one sensor. Generally, one or more output values and flag values are used. Suppose you can have
ここで、イベントとは、各種センサが計測データを収集することや作業者が業務記録等を作成することを意味する。また、イベントで生起されるデータとは、各種センサ(計測機器)の計測による計測データと、作業者の作成による業務記録等をデジタルデータに変換した言語データ、例えば、テキストデータを含むデータである。
Here, an event means that various sensors collect measurement data and an operator creates a business record or the like. The data generated by the event is data including measurement data obtained by measurement of various sensors (measurement devices) and language data obtained by converting business records created by an operator into digital data, for example, text data. .
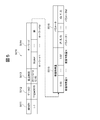
図3は、テキストデータ等のテキスト系原データの構成図である。図3において、テキスト系原データ3010は、日報や各種報告情報等、作業員によるテキスト入力を起源とするテキスト系の原データであって、データID3011と、記述内容3012から構成される。データID3011は、原データ1021のうち、テキストデータ1005から得られた原データ3011が、どの設備や業務で発生したかを識別するIDである。記述内容3012は、データの発生した日時を示す日時3013と、報告者を識別するための報告書ID3014と、自然言語にて、作業内容、結果、特記事項等の報告事項を記入するための報告事項3015から構成される。
FIG. 3 is a configuration diagram of text-based original data such as text data. In FIG. 3, text-based original data 3010 is text-based original data originating from text input by a worker, such as daily reports and various report information, and includes a data ID 3011 and description contents 3012. The data ID 3011 is an ID for identifying in which equipment or business the original data 3011 obtained from the text data 1005 among the original data 1021 is generated. The description content 3012 includes a date and time 3013 indicating the date and time when the data was generated, a report ID 3014 for identifying the reporter, and a report for entering report items such as work content, results, and special notes in natural language. Consists of item 3015.
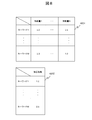
図4は、センサ系特徴量データの構成図である。図4において、センサ系特徴量データ4010は、センサ系原データ2010を変換して、特徴量とした統合特徴量データであって、種別ID4011と、データID4012と、起点時刻4013と、キーワード4014と、数値特徴量4015と、パラメータ4016から構成される。種別ID4011は、原データ2010がテキスト系であるか、センサ系であるかの種別をあらわす指標である。なお、原データ2010が、センサ系の場合、それがどのような種類のセンサなのか等、さらに詳細な種別を示してもよい。データID4012は、このデータがどの設備や業務で発生したかを識別するIDである。起点時刻4013は、データの発生時刻を示す情報である。キーワード4014は、過去の特徴量パターンとキーワードの対応事例から、特徴量に対して典型的なキーワードを推定し、推定したキーワードを付与したものである。その推定方法は後述する。
FIG. 4 is a configuration diagram of sensor system feature data. In FIG. 4, sensor system feature data 4010 is integrated feature data obtained by converting the sensor system original data 2010 into feature data, and includes a type ID 4011, a data ID 4012, a starting time 4013, and a keyword 4014. , A numerical feature amount 4015 and a parameter 4016. The type ID 4011 is an index indicating the type of whether the original data 2010 is a text system or a sensor system. When the original data 2010 is a sensor system, it may indicate a more detailed type such as what type of sensor it is. The data ID 4012 is an ID for identifying in which equipment or business the data is generated. The starting time 4013 is information indicating the data generation time. A keyword 4014 is obtained by estimating a typical keyword with respect to a feature amount from a past feature amount pattern and a corresponding example of the keyword, and adding the estimated keyword. The estimation method will be described later.
数値特徴量4015は、センサ系原データ2010を、定めた形式の特徴量に変換し、変換した特徴量を数値化したものである。例えば、計測データを、計測データの最大値よりも大きい設定値で割り算し、この割り算で得られた値を1以下の数値特徴量データとして求めたものである。この際、定めた形式とは、異なった時間スケール(1日と1時間等)での相関算出を可能とするため、特徴量を複数の時刻スケールに展開して多重のスケールで表現したものである。計測データから得られた数値特徴量データを複数の時刻スケールに展開した場合、各時刻スケールの数値特徴量データは、時間解像度の異なる時系列データとして管理される。
The numerical feature quantity 4015 is obtained by converting the sensor system original data 2010 into a feature quantity in a predetermined format and digitizing the converted feature quantity. For example, the measurement data is divided by a set value larger than the maximum value of the measurement data, and a value obtained by this division is obtained as numerical feature data of 1 or less. In this case, the defined format is a feature that expands features on multiple time scales and expresses them on multiple scales so that correlation can be calculated on different time scales (1 day and 1 hour, etc.). is there. When the numerical feature value data obtained from the measurement data is expanded to a plurality of time scales, the numerical feature value data of each time scale is managed as time series data having different time resolutions.
例えば、数値特徴量1~100までが1時間単位の数値特徴量を示す時系列データとして管理され、数値特徴量101~200までが1日単位の数値特徴量を示す時系列データとして管理される。なお、時系列データの中に不足するデータが存在する場合には、同一の時系列データまたは他の時系列データを基に補間演算や平均値演算などを実行することで、不足分を充足することができる。なお、特徴量部分の時間スケール展開の内容については、図6で別途説明する。
For example, numerical feature amounts 1 to 100 are managed as time series data indicating numerical feature amounts in one hour units, and numerical feature amounts 101 to 200 are managed as time series data indicating numerical feature amounts in one day units. . If there is insufficient data in the time series data, the shortage can be satisfied by executing interpolation calculation or average value calculation based on the same time series data or other time series data. be able to. The contents of the time scale development of the feature amount portion will be separately described with reference to FIG.
パラメータ4016は、計測データに付加される情報であって、異なった時間遅れでの相関算出を決めるために用いられる情報である。例えば、パラメータ1は、種別ID4011がAで、データID4012がXの特徴量と、本特徴量Xとの間の相関の時間遅れ(相関の対象となるデータが得られた時間と、本特徴量Xが得られた時間との差)が2時間であることを示す。この際、相関の対象となるデータ(相関の相手となるデータ)が得られた時間と、本特徴量Xが得られた時間との差が2時間である場合には、時間解像度の条件を満たし、両者のデータの間には、マッチングが成立することを意味する。
The parameter 4016 is information added to the measurement data, and is information used to determine the correlation calculation at different time delays. For example, the parameter 1 includes the time delay of the correlation between the feature quantity whose type ID 4011 is A and the data ID 4012 is X and the feature quantity X (the time when the data to be correlated is obtained, and the feature quantity The difference from the time when X was obtained is 2 hours. At this time, if the difference between the time at which the data to be correlated (data to be correlated) is obtained and the time at which the feature value X is obtained is 2 hours, the time resolution condition is set. This means that matching is established between the two data.
パラメータMは、種別ID4011がZ、データID4012がYの特徴量と、本特徴量Yとの時間遅れが12時間であることを示す。これらのパラメータの値は、種別ID4011やデータID4012ごとに特徴的な値を参照して決定される。ここで、一つの原データ単独では、特徴量の時間スケールをカバーできない場合には、複数の時刻での同じIDを持つセンサでの原データを集めて一つの特徴量とする。
The parameter M indicates that the time delay between the feature quantity Y having the type ID 4011 of Z and the data ID 4012 of Y and the feature quantity Y is 12 hours. The values of these parameters are determined with reference to characteristic values for each type ID 4011 and data ID 4012. Here, if the single original data alone cannot cover the time scale of the feature amount, the original data from the sensors having the same ID at a plurality of times are collected as one feature amount.
図5は、テキスト系特徴量データの構成図である。図5において、テキスト系特徴量データ5010は、テキスト系原データ3010を変換して、特徴量とした統合特徴量データであって、種別ID5011と、データID5012と、起点時刻5013と、キーワード5014と、数値特徴量5015と、パラメータ5016から構成される。種別ID5011は、原データ3010がテキスト系であるか、センサ系であるかの種別をあらわす指標である。原データ3010がテキスト系の場合、日報なのか、不具合報告書なのか等、さらに詳細な種別を示してもよい。データID5012は、このデータがどの設備や業務で発生したかを識別するIDである。起点時刻5013は、データの発生時刻を示す情報である。キーワード5014は、原データ3010のテキストデータから、文書処理によってキーワードを抽出したものである。この際、あらかじめ決まった語彙中に存在するもののみ残してもよい。数値特徴量5015は、テキストデータから対応する特徴量を推定し、推定した特徴量を数値化したものである。
FIG. 5 is a configuration diagram of text-based feature data. In FIG. 5, text-based feature data 5010 is integrated feature data obtained by converting text-based original data 3010 into feature data, and includes a type ID 5011, a data ID 5012, a starting time 5013, and a keyword 5014. , A numerical feature quantity 5015 and a parameter 5016. The type ID 5011 is an index indicating the type of whether the original data 3010 is a text system or a sensor system. When the original data 3010 is a text system, it may indicate a more detailed type such as a daily report or a defect report. The data ID 5012 is an ID for identifying in which equipment or business the data is generated. The starting time 5013 is information indicating the data generation time. A keyword 5014 is obtained by extracting a keyword from text data of the original data 3010 by document processing. At this time, only those existing in a predetermined vocabulary may be left. The numerical feature quantity 5015 is obtained by estimating a corresponding feature quantity from text data and digitizing the estimated feature quantity.
その代表的な方法は、過去のセンサ系のデータ値パターンとキーワードの対応事例から、キーワードに対して特徴量を付与するものである。その手順は、過去に同時に生起したとわかっている、テキストデータ中のキーワードとセンサ系データの値のパターンを対応付け、特定のキーワードに対して生起しやすい特徴量を対応表にして保持する。その対応表、例えば、特徴量・キーワード対応テーブルを用いて、今回抽出された各キーワードに対して、それぞれ最も典型的な特徴量を与える。最後に各抽出キーワードに対して与えられた特徴量の平均値をとることで、今回のキーワードに対する推定特徴量とする。
The typical method is to assign a feature amount to a keyword from past sensor system data value patterns and keyword correspondence examples. The procedure associates the keyword in the text data with the pattern of the value of the sensor system data, which is known to have occurred at the same time in the past, and stores the feature values that are likely to occur for a specific keyword as a correspondence table. Using the correspondence table, for example, the feature quantity / keyword correspondence table, the most typical feature quantity is given to each keyword extracted this time. Finally, the average value of the feature values given to each extracted keyword is taken to obtain the estimated feature value for the current keyword.
上述した特徴量推定の方法は、過去のデータに基づくものであったが、その他の方法として、文書データ中の時間表現等の明らかな特徴に関係する表現を活用して数値特徴量に反映する方法も可能である。例えば、テキストデータの情報として、「午後から次第に異音」という報告があったとすると、文書解析によって、キーワードを抽出し、「午後から」、「次第に」、「異音」を特徴量に反映する。
The above-described feature amount estimation method is based on past data. However, as another method, an expression related to an obvious feature such as a temporal expression in document data is utilized and reflected in a numerical feature amount. A method is also possible. For example, if there is a report of “abnormal noise from the afternoon” as text data information, the keywords are extracted by document analysis, and “from the afternoon”, “gradually”, and “abnormal noise” are reflected in the feature amount. .
反映の方法は、音に関連するセンサであれば、時間別に並んだ特徴量の関連するフィールドの午後からの値を与え、「次第に」という表現から、時間が経過するほどその値を大きくする、等である。
If the sensor is related to sound, the reflection method gives the value from the afternoon of the field related to the feature quantity arranged by time, and from the expression “gradually”, the value increases as time passes. Etc.
パラメータ5016は、図4と同様に、異なった時間遅れでの相関算出を決めるために用いる。記述内容は、図4と同じである。
The parameter 5016 is used to determine the correlation calculation at different time delays as in FIG. The description content is the same as in FIG.
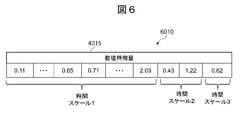
図6は、多重時間スケール数値特徴量データの構成図である。図6において、多重時間スケール数値特徴量データ6010は、図4の数値特徴量4015の具体的な配列例を示したものである。なお、図6では、説明を簡単にする為、時間スケール(時間解像度)が3種類の場合が示されている。時間スケール1のフィールドは、例えば、1時間ごとにセンサの値を時間順に並べたものである。時間スケール2のフィールドは、例えば、午前の測定値と午後の測定値を入力したものである。スケール3のフィールドは、例えば、1日1回の測定値を入力したものである。
FIG. 6 is a configuration diagram of multiple time scale numerical feature data. In FIG. 6, the multiple time scale numerical feature value data 6010 shows a specific arrangement example of the numerical feature values 4015 in FIG. 4. FIG. 6 shows a case where there are three types of time scales (time resolutions) for the sake of simplicity. In the field of time scale 1, for example, sensor values are arranged in order of time every hour. In the field of the time scale 2, for example, morning measurement values and afternoon measurement values are input. In the scale 3 field, for example, a measurement value is input once a day.
一般に、原特徴量では、センサなどの種類や、測定ルールによって、これらのスケールの全てが測定されることは稀である。そのため、欠損しているフィールドは、他のフィールドから推定して補間を行う。例えば、最も短い時間スケールでの測定値が与えられている場合には、それらの平均値、最頻値、中央値、特定時刻での値等、なんらかの代表値を算出して他のフィールドの推定値とすればよい。逆に、より短い時間スケールの測定値を推定する場合、スケールの大きい測定値と全てのフィールドに同じ値を入力する方法で算出する方法が最も単純な方法である。測定値が原理的に長いスケールでのみ可能なものは、そのように補間するしか方法がない。あるいは、代表的な時刻のみ上位のスケールの値を入力して、他のフィールドは、何らかの欠損値を示す記号か、ゼロ値など、センシングの種類に応じてふさわしい規定値を入れることも可能である。
Generally, in the original feature amount, it is rare that all of these scales are measured depending on the type of sensor and the measurement rule. Therefore, the missing field is estimated from other fields and interpolated. For example, if measurements are given on the shortest time scale, some representative values such as average, mode, median, and value at a specific time are calculated to estimate other fields. It can be a value. Conversely, when estimating a measurement value of a shorter time scale, a method of calculating by a method of inputting a measurement value having a large scale and the same value in all fields is the simplest method. If the measured values are only possible in principle on a long scale, there is no other way but to interpolate like that. Alternatively, it is also possible to input a value of a higher scale only for a representative time, and enter a predetermined value suitable for the type of sensing, such as a symbol indicating some missing value or a zero value in the other fields. .
一方、原理的には、現在の原データにあるよりもさらに短い時間間隔で測定が可能であり、同様のセンサによる類似のデータの測定値が参照できる場合には、スケールの大きい測定値をその変化パターンと同じ形になるように、重み付け配分することが可能である。以上のいずれかの補間方法によって、変換された後の特徴量では、全てのスケールにおいて、何らかの値もしくは、欠損を示す記号が入力されているものとする。
On the other hand, in principle, it is possible to measure at shorter time intervals than in the current original data, and when the measurement value of similar data by the same sensor can be referred, It is possible to distribute weights so as to have the same shape as the change pattern. It is assumed that a certain value or a symbol indicating a deficit is input in all scales in the feature value converted by any of the above interpolation methods.
以上、図6では、センサ値の種類が1種類の場合の例を示した。図2で例示したように、複数種類のデータを扱う場合には、それぞれの種類ごとに、多重の時間スケールをもつように変換する。その際のフィールドの順序は、種類ごとに並べたものをスケールごとに並べるか、一つのセンサについてスケールごとに並べたデータを種類ごとに並べるか、どちらか一つに定めて並べるものとする。
As described above, FIG. 6 shows an example in which there is one type of sensor value. As illustrated in FIG. 2, when a plurality of types of data are handled, each type is converted so as to have multiple time scales. In this case, the order of the fields is determined according to either one of the types arranged for each scale, or the data arranged for each scale for one sensor is arranged for each type.
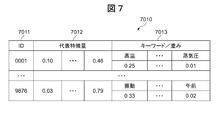
図7は、特徴量・キーワード対応テーブルの構成図である。図7において、特徴量・キーワード対応テーブル7010は、数値特徴量からキーワードの推定や、逆にキーワードから数値特徴量の推定に用いるテーブルであって、ID7011と、代表特徴量7012と、キーワード/重み7013から構成される。ID7011と、代表特徴量7012と、キーワード/重み7013は、種類または時間解像度の異なる複数のデータを、複数のデータ間の関連性を管理するための関連性情報として構成される。ID7011は、特徴量を識別するための識別子である。代表特徴量7012は、特徴量のうち代表となる特徴量を数値化したものである。キーワード/重み7013は、特徴量に対応するキーワードと、キーワードの重みから構成され、上段が、キーワードを示し、下段が、その重みを示す。
FIG. 7 is a configuration diagram of the feature quantity / keyword correspondence table. In FIG. 7, a feature quantity / keyword correspondence table 7010 is a table used for estimating a keyword from a numeric feature quantity, or conversely, estimating a numeric feature quantity from a keyword, and includes an ID 7011, a representative feature quantity 7012, a keyword / weight. 7013. The ID 7011, the representative feature amount 7012, and the keyword / weight 7013 are configured as a plurality of pieces of data having different types or temporal resolutions as relevance information for managing the relevance between the plurality of pieces of data. ID 7011 is an identifier for identifying a feature amount. The representative feature amount 7012 is obtained by quantifying a representative feature amount among the feature amounts. The keyword / weight 7013 includes a keyword corresponding to the feature amount and the keyword weight, and the upper row indicates the keyword and the lower row indicates the weight.
この際、ID7011と、代表特徴量7012およびキーワード/重み7013は、数値特徴量4015とキーワード4014との対応関係が定義された関連性情報(第1の関連性情報)と、数値特徴量5015とキーワードキーワード5014との対応関係が定義された関連性情報(第2の関連性情報)として構成され、ID7011には、イベント毎に生起されるデータを特定する情報として、場所、時間、設備または作業者を特定する情報が格納される。
At this time, the ID 7011, the representative feature amount 7012, and the keyword / weight 7013 include relevance information (first relevance information) in which a correspondence relationship between the numerical feature amount 4015 and the keyword 4014 is defined, and a numerical feature amount 5015. It is configured as relevance information (second relevance information) in which a correspondence relationship with the keyword keyword 5014 is defined, and the ID 7011 includes a place, time, facility, or work as information specifying data generated for each event. Information for identifying the person is stored.
特徴量・キーワード対応テーブル7010を構成するに際しては、まず、なるべく多くの対応するキーワードと特徴量が共存するデータを準備する。それらのデータは人手で準備しても良いし、過去に明確に共起した特徴量とテキストのデータを付き合わせて生成しても良い。そのような複数のデータ対をもって、そのまま特徴量・キーワード対応テーブル7010とすることも可能であるが、対応のばらつきを回避するため、以下の処理を行う。
In constructing the feature quantity / keyword correspondence table 7010, first, data in which as many corresponding keywords and feature quantities as possible coexist is prepared. Such data may be prepared manually, or may be generated by associating feature data that clearly co-occurred in the past with text data. Although such a plurality of data pairs can be directly used as the feature quantity / keyword correspondence table 7010, the following processing is performed in order to avoid variation in correspondence.
まず、各データの特徴量の「数値的近さ」を基にグループ分けを行う。ここで、数値的近さとして、例えば、特徴量の並びを一つの数値ベクトルとみなしてユークリッド距離を用いる。近さを一つ決めると、グループ分けを行う処理は、クラスタリングと呼ばれる。クラスタリングを行った後、各グループに属する特徴量から代表特徴量を算出する。算出の方法は、例えば、特徴量の並びを一つの数値ベクトルとみなしてそれらの平均ベクトルを算出するなどの方法が可能である。
First, grouping is performed based on the “numerical proximity” of the feature values of each data. Here, as the numerical closeness, for example, the Euclidean distance is used by regarding the arrangement of feature amounts as one numerical vector. When one closeness is determined, the process of grouping is called clustering. After clustering, representative feature values are calculated from the feature values belonging to each group. As a calculation method, for example, it is possible to consider a sequence of feature values as one numerical vector and calculate an average vector thereof.
一方、各クラスタを構成する特徴量が、それぞれ対として持っていたキーワードをクラスタ内のデータで全て集めて各キーワードの頻度を集計する。大きい頻度を持つキーワードから順に定めておいた個数のキーワードをキーワードテーブルの対応キーワードとして採用する。同時に、頻度そのもの、または、キーワード全体で、総和が1.0になるように、頻度を規格化したものを、キーワードの重みとして用いる。以上の処理で、クラスタごとに、代表特徴量(ベクトル)と重み付きのキーワード群の対が算出される。なお、各対応データのIDは、対応データを定めるごとに任意に定める。
On the other hand, the keywords included in each cluster as a pair of feature values are all collected from the data in the cluster, and the frequency of each keyword is aggregated. The number of keywords determined in order from the keyword having the highest frequency is adopted as the corresponding keyword in the keyword table. At the same time, the frequency itself or the frequency normalized so that the total sum of the keywords is 1.0 is used as the keyword weight. Through the above processing, a pair of representative feature quantity (vector) and weighted keyword group is calculated for each cluster. The ID of each corresponding data is arbitrarily determined every time the corresponding data is determined.
キーワードと特徴量を関連付けるその他の方法として、上記クラスタリングを用いずに、特徴量ベクトルと各単語の頻度を表わすベクトルの対応付けを直接算出する方法を用いてもよい。その手順は、上記と同様の共存データ中で、上記クラスタリング時に用いた方法と同様に、特徴量を数値ベクトルとみなし、一方で、同じ共存データ中で各キーワードの出現頻度をベクトル表示したものを準備する(以後、キーワード出現頻度ベクトルと呼ぶ)。以上の結果、一つの共存データ中で、特徴量ベクトルとキーワードの出現頻度ベクトルの対が出来るので、それらの関係を互いに変換する際に、最も誤差が少なく変換できるように、変換関数のパラメータを決定すればよい。
As another method for associating the keyword with the feature amount, a method of directly calculating the correspondence between the feature amount vector and the vector representing the frequency of each word may be used without using the clustering. In the same coexistence data as described above, the procedure regards the feature quantity as a numerical vector, similar to the method used at the time of clustering. Prepare (hereinafter referred to as keyword appearance frequency vector). As a result of the above, a pair of feature vector and keyword appearance frequency vector can be created in one coexistence data. Therefore, when converting the relationship between them, the parameters of the conversion function are set so that the conversion can be performed with the least error. Just decide.
変換関数の表現としては、例えば線形変換を仮定する方法が代表的である。この係数は、一つの係数行列と一つの係数ベクトルで表わされる。その係数行列をA、係数ベクトルをbと置くと、特徴量ベクトルからキーワード出現頻度ベクトルを予測する式は、
(キーワード出現頻度ベクトル)=A×(特徴量ベクトル)+b
と表わされる。ここで、行列Aと特徴量ベクトルとの掛け算は、通常の行列とベクトルの積であり、ベクトルbの足し算は、ベクトルの間の足し算である。 As a representation of the conversion function, for example, a method that assumes linear conversion is typical. This coefficient is represented by one coefficient matrix and one coefficient vector. When the coefficient matrix is A and the coefficient vector is b, the formula for predicting the keyword appearance frequency vector from the feature vector is:
(Keyword appearance frequency vector) = A × (feature quantity vector) + b
It is expressed as Here, multiplication of the matrix A and the feature vector is a product of a normal matrix and a vector, and addition of the vector b is addition between the vectors.
逆に、キーワード出現頻度ベクトルから、特徴量ベクトルを予測する式は、(特徴量ベクトル)と(キーワード出現頻度ベクトル)を入れ替えて、上記の逆関数を決定すればよい。なお、以上の係数の算出手順は、多変量解析における重回帰分析の手法を用いればよい。
Conversely, an expression for predicting a feature quantity vector from a keyword appearance frequency vector may be determined by replacing (feature quantity vector) and (keyword appearance frequency vector) with the above inverse function. In addition, the calculation procedure of the above coefficient should just use the technique of the multiple regression analysis in multivariate analysis.
図8に、その線形変換を仮定した変換関数の例を示す。図8において、特徴量・キーワード変換係数4201は、上記係数行列Aであり、特徴量・キーワード変換係数4202は、係数ベクトルbである。すなわち、係数行列Aの各成分は、特徴量ベクトルに対するキーワード出現頻度ベクトルの関連の大きさを示しており、係数ベクトルbは、特徴量・キーワード対応テーブル4201で変換された後のキーワードベクトルの大きさを適正化するために足される値である。
Fig. 8 shows an example of a conversion function assuming the linear conversion. In FIG. 8, a feature quantity / keyword conversion coefficient 4201 is the coefficient matrix A, and a feature quantity / keyword conversion coefficient 4202 is a coefficient vector b. That is, each component of the coefficient matrix A indicates the magnitude of the relationship between the keyword appearance frequency vector and the feature quantity vector, and the coefficient vector b is the magnitude of the keyword vector after being converted by the feature quantity / keyword correspondence table 4201. It is a value added to optimize the thickness.
次に、センサ系特徴量抽出処理を図9のフローチャートに従って説明する。この処理は、センサ系原データを、特徴量・キーワード対応テーブル7010を用いて、センサ系特徴量に変換する手順を示したものである。
Next, sensor system feature amount extraction processing will be described with reference to the flowchart of FIG. This process shows the procedure for converting the sensor system original data into the sensor system feature quantity using the feature quantity / keyword correspondence table 7010.
まず、特徴量抽出部1012は、記憶装置102に格納された原データ1021に対して、どのような種類のデータであるのかを判別し、原データ1020が、テキスト系原データ2010であると判別した場合、原データ2010にデータID4012を割り当てる(S901)。次に、特徴量抽出部1012は、原データ2010を基にデータの種別に応じて特徴量の整形を行う(S902)。特徴量の整形とは、欠値の補間や、データの種別に対して、標準的な時刻での計測に合致しない場合などに、同じくデータ補間で時間をずらした値に変換する処理等である。
First, the feature amount extraction unit 1012 determines what type of data is the original data 1021 stored in the storage device 102, and determines that the original data 1020 is text-based original data 2010. In this case, the data ID 4012 is assigned to the original data 2010 (S901). Next, the feature quantity extraction unit 1012 shapes the feature quantity according to the type of data based on the original data 2010 (S902). Feature shaping is, for example, missing value interpolation or conversion to a value shifted in time by data interpolation when the data type does not match the standard time measurement. .
次に、特徴量抽出部1012は、整形された特徴量に対して、特徴量の多重スケール化を行う(S903)。方法は、図6で説明したとおりである。次に、特徴量抽出部1012は、図4でも述べたように、キーワードの推定を行う(S9004)。キーワード推定の方法は、過去の特徴量パターンとキーワードの対応事例から特徴量に対して典型的なキーワードを付与するものである。
Next, the feature quantity extraction unit 1012 multi-scales the feature quantity with respect to the shaped feature quantity (S903). The method is as described in FIG. Next, the feature quantity extraction unit 1012 performs keyword estimation as described in FIG. 4 (S9004). In the keyword estimation method, a typical keyword is assigned to a feature amount from a past feature amount pattern and a corresponding example of the keyword.
その方法の一例として、図7で上述した、特徴量・キーワードテーブル7010を用いる方法を説明する。まず、与えられた特徴量パターンに対して、特徴量・キーワードテーブル7010中の代表特徴量7012との近さが、最も近い代表特徴量を選出する。ここで、特徴量間の近さは、例えば、特徴量・キーワードテーブル7010を作成する際に用いたユークリッド距離を用いて算出する。
As an example of the method, a method using the feature quantity / keyword table 7010 described above with reference to FIG. 7 will be described. First, for a given feature quantity pattern, a representative feature quantity closest to the representative feature quantity 7012 in the feature quantity / keyword table 7010 is selected. Here, the closeness between the feature amounts is calculated using, for example, the Euclidean distance used when the feature amount / keyword table 7010 is created.
最も近い代表特徴量を選んだら、それに対応する特徴量・キーワードテーブル7010中のキーワードを推定し、推定したキーワードを推定キーワードとする。
When the closest representative feature is selected, the keyword in the feature / keyword table 7010 corresponding to the selected representative feature is estimated, and the estimated keyword is used as the estimated keyword.
最後に、特徴量抽出部1012は、特徴量のパラメータを決定する(S905)。パラメータは、各特徴量を総当り的に対にして、各対の相関を算出する際に、それぞれどのような時間遅れで相関を算出すべきであるかを示すものである。
Finally, the feature quantity extraction unit 1012 determines a feature quantity parameter (S905). The parameter indicates how much time the correlation should be calculated when calculating the correlation of each pair with each feature amount as a brute force pair.
これらのパラメータは、特徴量の組み合わせに対する特性から導かれるものであり、基本は人手で算出する。例えば、あるデータID4012の特徴量が、ある設備の容器内圧力を示すものであって、別のデータID4012の特徴量は、その設備に付属した装置の温度を示すものであったとして、それらは1時間の遅れで高い相関が出ることが知られている場合、相関を算出すべきデータ間の時間遅れを1時間とする。あるいは、過去のデータを複数の時間遅れを用いて分析することで、相関の高い時間遅れを経験的にパラメータとしてもよい。
These parameters are derived from the characteristics for the combination of feature values, and are basically calculated manually. For example, if the feature amount of a certain data ID 4012 indicates the pressure in the container of a certain facility, and the feature amount of another data ID 4012 indicates the temperature of the device attached to the facility, When it is known that a high correlation is produced with a delay of one hour, the time delay between data for which correlation is to be calculated is defined as one hour. Alternatively, a time delay having a high correlation may be empirically set as a parameter by analyzing past data using a plurality of time delays.
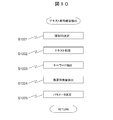
次に、テキスト系特徴量抽出処理を図10のフローチャートに従って説明する。この処理は、テキスト系原データを、特徴量・キーワード対応テーブル7010を用いて、テキスト系特徴量に変換する手順を示したものである。
Next, the text feature extraction process will be described with reference to the flowchart of FIG. This process shows a procedure for converting text-based original data into text-based feature values using the feature-value / keyword correspondence table 7010.
特徴量抽出部1012は、記憶装置1020に格納された原データ1021に対して、どのような種類のデータであるのかを判別し、原データ1021が、テキスト系原データ3010であると判別した場合、原データ3010にデータID5012を割り当てる(S1001)。
When the feature quantity extraction unit 1012 determines what kind of data is the original data 1021 stored in the storage device 1020, and determines that the original data 1021 is text-based original data 3010 The data ID 5012 is assigned to the original data 3010 (S1001).
次に、特徴量抽出部1012は、テキストデータ1005から得られた原データ3010について、単語分割や品詞の同定などの自然言語処理の技法を用いてテキスト処理を行う(S1002)。処理された結果は、一般にキーワードとして使いづらい一般的過ぎる単語、数詞、自立語でない助詞などを含む。このため、特徴量抽出部1012は、頻度、品詞、その他の特徴を用いてキーワードとなりうるものを原データ3010中から抽出する(S1003)。
Next, the feature quantity extraction unit 1012 performs text processing on the original data 3010 obtained from the text data 1005 using natural language processing techniques such as word segmentation and part-of-speech identification (S1002). The processed results include words that are generally too difficult to use as keywords, numbers, particles, particles that are not independent words, and the like. Therefore, the feature quantity extraction unit 1012 extracts from the original data 3010 what can be a keyword using the frequency, the part of speech, and other features (S1003).
次に、図9で説明した手順とは逆に、特徴量抽出部1012は、特徴量・キーワードテーブル7010を用いて、キーワードから換算特徴量を抽出する(S1004)。その手順は、例えば、特徴量・キーワードテーブル7010の中で、現在のデータで抽出されたキーワードを含む行を全て抽出し、キーワードの重みによって、抽出された行を加重平均したものを換算特徴量とする。
Next, contrary to the procedure described in FIG. 9, the feature quantity extraction unit 1012 uses the feature quantity / keyword table 7010 to extract converted feature quantities from the keywords (S1004). For example, in the feature / keyword table 7010, all the lines including the keyword extracted from the current data are extracted, and the weighted average of the extracted lines is converted by the keyword weight. And
例えば、キーワードの「蒸気圧」が、特徴量・キーワードテーブル7010の中の1,2行目に、キーワードの「高温」が、特徴量・キーワードテーブル7010の中の1,3行目にあった場合、1行目の特徴量に対する重みは、「蒸気圧」と「高温」の由来の重みを加えたものとし、2行目の特徴量に対する重みは、「蒸気圧」の重みとし、3行目は、同様に「高温」の重みとして、3つの代表特徴量間で加重平均を行う。
For example, the keyword “vapor pressure” is on the first and second lines in the feature quantity / keyword table 7010, and the keyword “high temperature” is on the first and third lines in the feature quantity / keyword table 7010. In this case, the weight for the feature amount in the first row is obtained by adding the weights derived from “vapor pressure” and “high temperature”, and the weight for the feature amount in the second row is set as the weight of “vapor pressure”. Similarly, the eye performs a weighted average among the three representative feature amounts as the “high temperature” weight.
最後に、特徴量抽出部1012は、パラメータの決定を行う(S1005)。パラメータの決定は、図9の処理と同様に、データの内容によって、人手で与えたものを用いるか、過去のデータを用いて決定する。
Finally, the feature quantity extraction unit 1012 determines parameters (S1005). As in the process of FIG. 9, the parameter is determined by using data given manually or by using past data, depending on the data contents.
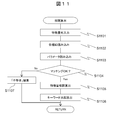
次に、相関算出処理を図11のフローチャートに従って説明する。この処理は、図9と図10の処理で変換された2つの特徴量間の相関を算出する手順を示したものである。マッチングの判定では、双方の特徴量のパラメータをみて、合致すればマッチングしたとして、相関の算出を行い、それ以外は、双方の特徴量のパラメータが合致しないとして、不整合を示す値を返すこととしている。
Next, the correlation calculation process will be described with reference to the flowchart of FIG. This process shows a procedure for calculating the correlation between the two feature amounts converted by the processes of FIGS. 9 and 10. In the matching judgment, the parameters of both feature values are viewed, and if they match, the correlation is calculated, and otherwise, the values indicating mismatch are returned assuming that the parameters of both features do not match. It is said.
まず、相関算出部1013は、記憶装置1020に格納された特徴量データ1022の中から、対象となる2つのデータの特徴量を入力する(S1101)。次に、相関算出部1013は、入力された特徴量から各種IDを読み取る(S1102)。ここで、各種IDとは、前述の、特徴量の種類を示す種別IDや、データの出所を示すIDである。
First, the correlation calculation unit 1013 inputs the feature amounts of the two target data from the feature amount data 1022 stored in the storage device 1020 (S1101). Next, the correlation calculation unit 1013 reads various IDs from the input feature amount (S1102). Here, the various IDs are the above-described type IDs indicating the types of feature quantities and IDs indicating the origin of data.
次に、相関算出部1013は、相手特徴量の各種IDに対応したパラメータを読み取る(S1103)。前述したように、パラメータは、マッチングが可能な相手に対する遅れ時間が記述されている。
Next, the correlation calculation unit 1013 reads parameters corresponding to various IDs of the partner feature amount (S1103). As described above, the parameter describes a delay time with respect to a partner that can be matched.
次に、相関算出部1013は、読み取った各パラメータはマッチングするか否かを判定し(S1104)、パラメータを検討した結果、マッチングが可能な組み合わせであれば、そのパラメータによって指定される時間遅れを伴って、特徴量の相関値を算出する(S1105)。例えば、相関算出部1013は、読み取った各パラメータの時間遅れが、時間解像度の条件を満たし、両者の特徴量の間に、マッチングが成立した場合、両者の特徴量の相関値を算出する。
Next, the correlation calculation unit 1013 determines whether or not each read parameter is matched (S1104). As a result of examining the parameters, if the combination can be matched, the time delay specified by the parameter is calculated. Along with this, a correlation value of the feature amount is calculated (S1105). For example, when the time delay of each read parameter satisfies the condition of time resolution and matching is established between both feature quantities, the correlation calculation unit 1013 calculates a correlation value between both feature quantities.
続いて、相関算出部1013は、キーワード間の共起度合いも算出する(S1106)。例えば、相関算出部1013は、キーワード4014とキーワード5014の中から、読み取った各パラメータの時間遅れが、時間解像度の条件を満たす、キーワード4014とキーワード5014を選択し、選択したキーワード4014とキーワード5014間の共起度合を算出する。
Subsequently, the correlation calculation unit 1013 also calculates the degree of co-occurrence between keywords (S1106). For example, the correlation calculation unit 1013 selects, from the keyword 4014 and the keyword 5014, the keyword 4014 and the keyword 5014 in which the time delay of each read parameter satisfies the time resolution condition, and between the selected keyword 4014 and the keyword 5014. The co-occurrence degree of is calculated.
ここで、キーワードの共起度合いとは、共通したキーワードが、互いの特徴量の間で何割あるかを示す量である。
例えば、(共通キーワード数)/
{(データ1の全キーワード数)×(データ2の全キーワード数)}
という式を用いて算出する。 Here, the degree of co-occurrence of keywords is an amount indicating what percentage of common keywords are present between the feature amounts of each other.
For example, (number of common keywords) /
{(Total number of keywords in data 1) × (total number of keywords in data 2)}
It is calculated using the following formula.
一方、パラメータを検討した結果、マッチング不可と判定した場合、相関算出部1013は、「不整合」の判定結果を返す(S1107)。ここで、時間遅れの量が、互いの特徴量に格納されている時間幅よりも大きい場合も、マッチング不可の判断となる。
On the other hand, as a result of examining the parameters, if it is determined that matching is not possible, the correlation calculation unit 1013 returns a determination result of “mismatch” (S1107). Here, when the amount of time delay is larger than the time width stored in each feature amount, it is determined that the matching is impossible.
本実施例では、特徴量抽出部1012は、イベント毎に生起されるデータであって、種類または時間解像度の異なる複数のデータを、複数のデータ間の関連性を管理する特徴量・キーワード対応テーブル7010を用いて、各データ共通のデータ形式のデータに変換するデータ変換部として機能し、相関算出部1013は、特徴量抽出部1012で得られた各データの相関を算出する相関算出部として機能する。
In the present embodiment, the feature amount extraction unit 1012 is a feature amount / keyword correspondence table that manages a plurality of pieces of data having different types or time resolutions, which are data generated for each event, and managing the relationship between the pieces of data. 7010 functions as a data conversion unit that converts data into a data format common to each data, and the correlation calculation unit 1013 functions as a correlation calculation unit that calculates the correlation of each data obtained by the feature amount extraction unit 1012 To do.
この際、特徴量抽出部1012は、イベント毎に生起されるデータが、計測機器の計測による計測データまたは作業者の業務記録を示す言語データ(テキストデータ)であって、イベント毎に生起されるデータの発生時間を示す時間解像度が異なる複数の時系列データで構成されている場合、計測データの中から、当該計測データの特徴量を示す数値特徴量(第1の数値特徴量データ)4015を時間解像度毎に抽出し、各抽出した数値特徴量4015を特徴量・キーワード対応テーブル(関連性情報)7010を基に、言語データに関連するキーワード(第1の言語データ)4014に変換すると共に、言語データの中から、イベントに関連するキーワード(第2の言語データ)5014を時間解像度毎に抽出し、各抽出したキーワード5014を数値特徴量(第1の数値特徴量データ)5015を基に、キーワード5014の特徴量を示す数値特徴量(第2の数値特徴量データ)5015に変換するデータ変換部として機能する。
At this time, the feature amount extraction unit 1012 generates data for each event, which is measurement data obtained by measurement by the measuring device or language data (text data) indicating the work record of the worker, and is generated for each event. In the case of being composed of a plurality of time-series data having different time resolutions indicating the generation time of data, a numerical feature quantity (first numerical feature quantity data) 4015 indicating the feature quantity of the measurement data is selected from the measurement data. Extraction is performed for each time resolution, and each extracted numeric feature 4015 is converted into a keyword (first language data) 4014 related to language data based on a feature / keyword correspondence table (relevance information) 7010, A keyword (second language data) 5014 related to the event is extracted from the language data for each time resolution, and each extracted keyword is extracted. 014 a numerical feature value based on the (first numerical feature data) 5015, functions as a data converter for converting the numerical feature amount indicating a feature value of the keyword 5014 (second numerical feature data) 5015.
また、相関算出部1013は、特徴量抽出部1012で得られた数値特徴量4015と数値特徴量5015の中から、計測データまたは言語データ(テキストデータ)に付加されるパラメータ4016、5016で特定される時間解像度の条件を満たす、数値特徴量4015と数値特徴量5015(マッチングが成立する数値特徴量)を選択し、選択した数値特徴量4015と数値特徴量5015との相関を算出すると共に、特徴量抽出部1012で得られたキーワード4014とキーワード5014の中から、計測データまたは言語データ(テキストデータ)に付加されるパラメータ4016、5016で特定される時間解像度の条件を満たす、キーワード4014とキーワード5014(マッチングが成立するキーワード)を選択し、選択したキーワード4014とキーワード5014との相関を算出する相関算出部として機能する。
In addition, the correlation calculation unit 1013 is specified by parameters 4016 and 5016 added to measurement data or language data (text data) from the numeric feature 4015 and the numeric feature 5015 obtained by the feature extraction unit 1012. A numerical feature quantity 4015 and a numerical feature quantity 5015 (numerical feature quantity for which matching is established) satisfying a time resolution condition are selected, and a correlation between the selected numerical feature quantity 4015 and the numerical feature quantity 5015 is calculated. Of the keyword 4014 and the keyword 5014 obtained by the quantity extraction unit 1012, the keyword 4014 and the keyword 5014 satisfying the time resolution condition specified by the parameters 4016 and 5016 added to the measurement data or language data (text data). (Keyword that matches), Functioning as correlation calculating unit that calculates a correlation between the keywords 4014 and the keyword 5014-option was.
また、特徴量抽出部1012は、各時間解像度(時間スケール)の数値特徴量データの中に不足する数値特徴量データが存在する場合、不足する数値特徴量データを、当該数値特徴量データとは時間解像度が異なる他の時間解像度の数値特徴量データまたは不足する数値特徴量データと同一の時間解像度の数値特徴量データから推定するデータ変換部として機能する。
Further, the feature quantity extraction unit 1012, when there is insufficient numeric feature quantity data in the numeric feature quantity data of each time resolution (time scale), the missing numeric feature quantity data is referred to as the numeric feature quantity data. It functions as a data conversion unit that estimates from numerical feature quantity data having other time resolutions having different time resolutions or numerical feature quantity data having the same time resolution as deficient numerical feature quantity data.
本実施例によれば、特徴量・キーワード対応テーブル7010を用いることで、複数種類のデータとして、テキストデータ(言語データ)と計測データが混在した場合でも、複数種類のデータ間の相関の算出をすることができる。
According to the present embodiment, by using the feature quantity / keyword correspondence table 7010, even when text data (language data) and measurement data are mixed as multiple types of data, the correlation between the multiple types of data is calculated. can do.
また、本実施例によれば、異なった種別のデータ間の相関を適切な時間スケール、例えば、時間遅れで算出可能となる。
Further, according to this embodiment, the correlation between different types of data can be calculated with an appropriate time scale, for example, with a time delay.
また、本実施例によれば、重要度・相関規準を設定して、部分データの相関のみ算出することで、広範囲のデータの関連性を監視できるにもかかわらず、計算量やデータ量を抑制することが可能である。また、重要度が高い関係から順にデータを残しつつ、データ量を必要に応じて変更することが可能となる。
In addition, according to the present embodiment, by setting importance and correlation criteria and calculating only the correlation of partial data, the relevance of a wide range of data can be monitored, but the calculation amount and data amount are suppressed. Is possible. In addition, it is possible to change the data amount as necessary while leaving data in order from the highest importance.
(第2実施例)
本実施例では、第1実施例で述べた相関の算出方法に加えて、重要度・相関基準によって、部分データのみ相関を算出する処理格納方法についての実施例を説明する。 (Second embodiment)
In this embodiment, in addition to the correlation calculation method described in the first embodiment, an embodiment of a process storage method for calculating a correlation of only partial data based on importance / correlation criteria will be described.
第1実施例の方法により、異なった種類のデータ間であっても相関を算出することが可能であるが、全ての組み合わせを算出することは現実のシステム運用においては、計算時間及び、記憶装置の容量の問題から困難である。そのため、何らかの方法で部分的な算出を元に近似的な関係性を提示する方法が必要となる。本実施例では、そのため、データの重要度を算出することで、その方法を提供するものである。
According to the method of the first embodiment, it is possible to calculate the correlation even between different types of data. However, in the actual system operation, the calculation time and the storage device are all calculated. Difficult due to capacity issues. Therefore, a method for presenting an approximate relationship based on partial calculation by some method is required. In the present embodiment, therefore, the method is provided by calculating the importance of the data.
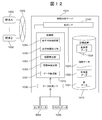
図12は、本発明に係る計算機システムの第2実施例を示す構成図である。本実施例は、処理部1010中に、相関算出部1013で算出された相関を基に、相関が算出されていない別の要素間の相関を算出する近似相関算出部1015が追加され、記憶装置1020中に、重要度データ1024が追加されたものであり、他の構成は、図1に示す第1の実施例と同様である。
FIG. 12 is a block diagram showing a second embodiment of the computer system according to the present invention. In the present embodiment, an approximate correlation calculation unit 1015 that calculates a correlation between other elements for which no correlation is calculated based on the correlation calculated by the correlation calculation unit 1013 is added to the processing unit 1010, and the storage device The importance level data 1024 is added in 1020, and the other configuration is the same as that of the first embodiment shown in FIG.
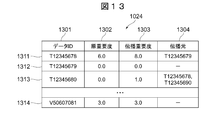
図13は、本実施例で用いる重要度データの構成図である。図13において、重要度データ1024は、データID1301と、原重要度1302と、伝播重要度1303と、伝播元1304から構成され、各行1311~1314が1つのデータに相当する。なお、算出の手順は後述する。
FIG. 13 is a configuration diagram of importance data used in this embodiment. In FIG. 13, importance level data 1024 includes a data ID 1301, an original importance level 1302, a propagation importance level 1303, and a propagation source 1304, and each row 1311 to 1314 corresponds to one piece of data. The calculation procedure will be described later.
データID1301は、重要度データ1024を識別するための識別子である。原重要度1302は、各データの本来の重要度を示す情報である。伝播重要度1303は、相関の状況と原重要度によって算出される情報である。伝播元1304は、データの伝播元を示す情報である。
The data ID 1301 is an identifier for identifying the importance data 1024. The original importance 1302 is information indicating the original importance of each data. The propagation importance 1303 is information calculated based on the correlation status and the original importance. The propagation source 1304 is information indicating the data propagation source.
次に、重要度算出・部分相関算出処理を図14のフローチャートに従って説明する。この処理は、本実施例における、上述した重要度の算出と、部分データのみの相関算出を行う手順である。本手順は、センサデータ1004またはテキストデータ1005が、新規データとして一つ加えられる度に、その新規データと全ての既存データに対して行われる手順である。
Next, the importance calculation / partial correlation calculation processing will be described with reference to the flowchart of FIG. This process is a procedure for performing the above-described calculation of importance and correlation calculation of only partial data in the present embodiment. This procedure is performed for each new data and all existing data every time one sensor data 1004 or text data 1005 is added as new data.
相関算出部1013は、まず、入力された新規データの特徴量を入力する(S1401)、次に、入力された新規データに対して、原重要度を決定する(S1402)。新規データの原重要度は、過去の原因分析上、主要要因となった頻度や、重要なイベントに関連していたか等を勘案して決定される。
The correlation calculation unit 1013 first inputs the feature amount of the input new data (S1401), and then determines the original importance for the input new data (S1402). The original importance of the new data is determined in consideration of the frequency that has become a major factor in the past cause analysis, whether it was related to an important event, and the like.
次に、相関算出部1013は、既存データを順に読み込み(S1403)、読み込んだ各既存データと新規データとの相関算出手順に進む。その相関算出手順では、まず、相関算出部1013は、既に算出されている既存データの伝播重要度(定義は後述)を読み込み(S1409)、既存データと新規データとの相関を算出する(S1405)。
Next, the correlation calculation unit 1013 reads the existing data in order (S1403), and proceeds to the correlation calculation procedure between each read existing data and new data. In the correlation calculation procedure, first, the correlation calculation unit 1013 reads the importance of propagation of existing data that has already been calculated (definition will be described later) (S1409), and calculates the correlation between the existing data and new data (S1405). .
次に、相関算出部1013は、算出した相関の値から、連結重要度という指標を算出する(S1406)。ここで、連結重要度とは、データの対に対して、一つ決まる指標であり、相関と重要度の双方の大きさを一つの数値で表わすものである。すなわち、連結重要度は、相関が大きく、重要度が大きいほど大きな値をとる量である。
Next, the correlation calculation unit 1013 calculates a link importance level index from the calculated correlation value (S1406). Here, the connection importance is an index determined for each pair of data, and represents both the correlation and the importance by a single numerical value. That is, the connection importance is an amount that takes a larger value as the correlation is higher and the importance is higher.
その最も単純な定義は、
(連結重要度)=(既存データの伝播重要度)×(相関の大きさ)
とすればよい。 Its simplest definition is
(Consolidation importance) = (Propagation importance of existing data) x (Correlation magnitude)
And it is sufficient.
(連結重要度)=(既存データの伝播重要度)×(相関の大きさ)
とすればよい。 Its simplest definition is
(Consolidation importance) = (Propagation importance of existing data) x (Correlation magnitude)
And it is sufficient.
次に、相関算出部1013は、連結重要度が保存閾値よりも大きいか否かを判定し(S1407)、この連結重要度が、あらかじめ定めた保存閾値より大きい場合には、相関を保存し(S1408)、新規データの伝播重要度を算出する(S1409)。
Next, the correlation calculation unit 1013 determines whether or not the connection importance is greater than a storage threshold (S1407). If the connection importance is greater than a predetermined storage threshold, the correlation is stored ( S1408), the propagation importance of new data is calculated (S1409).
新規データの伝播重要度は、
例えば、
(伝播重要度)=(原重要度)+(係数)×(既存データの伝播重要度)×(相関の大きさ)で定義される。ここで、係数は、あらかじめ定められた値であり、過去の全データの平均結合数の逆数など、伝播重要度が過度に大きな値とならないための係数であり、通常は、1.0でよい。 The importance of propagation of new data is
For example,
(Propagation importance) = (Original importance) + (Coefficient) × (Propagation importance of existing data) × (Correlation magnitude) Here, the coefficient is a predetermined value, and is a coefficient for preventing the propagation importance from becoming an excessively large value, such as the reciprocal of the average combination number of all past data. .
次に、相関算出部1013は、既存データの伝播重要度を更新する(S1410)。
Next, the correlation calculation unit 1013 updates the propagation importance of existing data (S1410).
更新の方法は、
例えば、
(更新後伝播重要度)=(更新前伝播重要度)+(係数)×(新規データの伝播重要度)×(相関の大きさ)で定義される。ここで、係数は、あらかじめ定められた値であり、上記の新規データの伝播重要度の場合と同様に設定される。 How to update
For example,
(Updated propagation importance) = (Propagation importance before update) + (Coefficient) × (Propagation importance of new data) × (Magnitude of correlation) Here, the coefficient is a predetermined value, and is set in the same manner as in the case of the propagation importance of new data.
一方、ステップS1407にて、連結重要度があらかじめ定めた保存閾値より小さいと判定した場合、あるいは、ステップS1409の処理の後、相関算出部1013は、既存データの処理は全て終了したか否かを判定し(S1411)、次の既存データの処理が存在する場合には、ステップS1409の処理に戻り、次の既存データに対して、ステップS1409~ステップS1411の処理を繰り返し、既存データの処理が全て終了したと判定した場合には、このルーチンでの処理を繰り返す。
On the other hand, if it is determined in step S1407 that the connection importance is smaller than a predetermined storage threshold, or after the processing in step S1409, the correlation calculation unit 1013 determines whether all the processing of existing data has been completed. If it is determined (S1411) and there is a process for the next existing data, the process returns to the process in step S1409 and the processes in steps S1409 to S1411 are repeated for the next existing data. If it is determined that the processing has been completed, the processing in this routine is repeated.
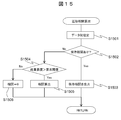
次に、近似相関算出処理を図15のフローチャートに従って説明する。この処理は、任意のデータ間の相関を近似的に算出する手順を示すものである。
Next, the approximate correlation calculation process will be described with reference to the flowchart of FIG. This process shows a procedure for approximately calculating the correlation between arbitrary data.
まず、近似相関算出部1015は、相関を算出したいデータ対を指定する(S1501)。近似相関算出部1015は、指定されたデータ対に対して、上述した保存相関が存在するかを判断し(S1502)、保存相関が存在する場合は、その保存された相関を出力する(S1503)。
First, the approximate correlation calculation unit 1015 designates a data pair whose correlation is to be calculated (S1501). The approximate correlation calculation unit 1015 determines whether the above-described stored correlation exists for the specified data pair (S1502). If the stored correlation exists, the stored correlation is output (S1503). .
一方、ステップS1502で、保存相関が存在しないと判定した場合、近似相関算出部1015は、各データの重要度を算出し、両重要度が共に算出閾値より大きいか否かを判定し(S1504)、両重要度が共に算出閾値より大きいと判定した場合には、両データの相関を算出し(S1505)、算出閾値より小さい重用度のデータが存在し、両重要度が共に算出閾値より大きくないと判定した場合には、両データの相関を近似的にゼロとする(S1506)。ここで、重要度は、そのデータに伝播重要度が存在する場合には、その値を、伝播重要度が存在しない場合には、原重要度を用いる。
On the other hand, if it is determined in step S1502 that there is no stored correlation, the approximate correlation calculation unit 1015 calculates the importance of each data, and determines whether both importances are larger than the calculation threshold (S1504). If it is determined that both importance levels are larger than the calculated threshold value, the correlation between both data is calculated (S1505), and there is data with a degree of importance less than the calculated threshold value, and both importance levels are not greater than the calculated threshold value. Is determined, the correlation between the two data is approximately zero (S1506). Here, as the importance, the value is used when the propagation importance exists in the data, and the original importance is used when the propagation importance does not exist.
本実施例によれば、イベント個別の重要度と相関の大きさを用いて、イベント間の連結の重要度を算出し、算出結果を基に部分データの相関のみを算出するようにしたので、計算量とデータ量を削減することができる。
According to the present embodiment, the importance of the connection between events is calculated using the importance of each event and the magnitude of the correlation, and only the correlation of the partial data is calculated based on the calculation result. The amount of calculation and data can be reduced.
なお、本発明は上記した実施例に限定されるものではなく、様々な変形例が含まれる。例えば、上記した実施例は本発明を分かりやすく説明するために詳細に説明したものであり、必ずしも説明した全ての構成を備えるものに限定されるものではない。また、ある実施例の構成の一部を他の実施例の構成に置き換えることが可能であり、また、ある実施例の構成に他の実施例の構成を加えることも可能である。また、各実施例の構成の一部について、他の構成の追加・削除・置換をすることが可能である。
In addition, this invention is not limited to the above-mentioned Example, Various modifications are included. For example, the above-described embodiments have been described in detail for easy understanding of the present invention, and are not necessarily limited to those having all the configurations described. Further, a part of the configuration of one embodiment can be replaced with the configuration of another embodiment, and the configuration of another embodiment can be added to the configuration of one embodiment. Further, it is possible to add, delete, and replace other configurations for a part of the configuration of each embodiment.
例えば、特徴量抽出部1012は、種類の異なる複数のデータが、計測データと言語データである場合、計測データの中から、当該計測データの特徴量を示す数値特徴量(第1の数値特徴量データ)4014を抽出し、抽出した数値特徴量4014を特徴量・キーワード対応テーブル7010を基に、キーワード(第1の言語データ)4014に変換すると共に、言語データの中から、イベントに関連するキーワード(第2の言語データ)5014を抽出し、抽出したキーワード5014を特徴量・キーワード対応テーブル7010を基に、数値特徴量(第2の数値特徴量データ)5015に変換するデータ変換部として機能する。
For example, when the plurality of different types of data is measurement data and language data, the feature amount extraction unit 1012 includes a numerical feature amount (first numerical feature amount) indicating the feature amount of the measurement data from the measurement data. Data) 4014 is extracted, and the extracted numerical feature quantity 4014 is converted into a keyword (first language data) 4014 based on the feature quantity / keyword correspondence table 7010, and a keyword related to an event is selected from the language data. (Second language data) 5014 is extracted, and the extracted keyword 5014 functions as a data conversion unit that converts the extracted keyword 5014 into a numerical feature quantity (second numerical feature quantity data) 5015 based on the feature quantity / keyword correspondence table 7010. .
相関算出部1013は、特徴量抽出部1012で得られた数値特徴量4014と数値特徴量5015を基に数値特徴量4014と数値特徴量5015との相関を算出し、特徴量抽出部1012で得られたキーワード4014とキーワード5014とを基にキーワード4014とキーワード5014との相関を算出する相関算出部として機能することができる。
The correlation calculation unit 1013 calculates the correlation between the numeric feature 4040 and the numeric feature 5015 based on the numeric feature 4014 and the numeric feature 5015 obtained by the feature extraction unit 1012, and obtains the correlation by the feature extraction unit 1012. Based on the obtained keyword 4014 and keyword 5014, it can function as a correlation calculation unit that calculates the correlation between the keyword 4014 and the keyword 5014.
また、上記の各構成、機能、処理部、処理手段等は、それらの一部又は全部を、例えば、集積回路で設計する等によりハードウェアで実現してもよい。また、上記の各構成、機能等は、プロセッサがそれぞれの機能を実現するプログラムを解釈し、実行することによりソフトウェアで実現してもよい。各機能を実現するプログラム、テーブル、ファイル等の情報は、メモリや、ハードディスク、SSD(Solid State Drive)等の記録装置、または、IC(Integrated Circuit)カード、SD(Secure Digital)メモリカード、DVD(Digital Versatile Disc)等の記録媒体に記録して置くことができる。
In addition, each of the above-described configurations, functions, processing units, processing means, and the like may be realized by hardware by designing a part or all of them with, for example, an integrated circuit. Each of the above-described configurations, functions, and the like may be realized by software by interpreting and executing a program that realizes each function by the processor. Information such as programs, tables, and files that realize each function is stored in memory, a hard disk, a recording device such as an SSD (Solid State Drive), an IC (Integrated Circuit) card, an SD (Secure Digital) memory card, a DVD ( It can be recorded on a recording medium such as Digital Versatile Disc).
1001 相関分析サーバ、1002 端末、1004 センサデータ、1005 テキストデータ、1010 処理部、1020 記憶装置、1011 データ管理部、1012 特徴量抽出部、1013 相関算出部、1014 表示内容構成部。
1001 Correlation analysis server, 1002 terminal, 1004 sensor data, 1005 text data, 1010 processing unit, 1020 storage device, 1011 data management unit, 1012 feature amount extraction unit, 1013 correlation calculation unit, 1014 display content configuration unit.
Claims (15)
- 複数のイベント間の関連性を分析し、分析対象のイベントに関連する他のイベントを抽出する相関分析装置において、
前記イベント毎に生起されるデータであって、種類または時間解像度の異なる複数のデータを、前記複数のデータ間の関連性を管理する関連性情報を用いて、各データ共通のデータ形式のデータに変換するデータ変換部と、
前記データ変換部で変換された各データの相関を算出する相関算出部と、を有することを特徴とする相関分析装置。 In a correlation analyzer that analyzes the relationship between multiple events and extracts other events related to the event being analyzed,
Data generated for each event, and a plurality of data having different types or temporal resolutions are converted into data having a common data format by using relevance information for managing relevance between the plurality of data. A data converter to convert;
A correlation calculation unit that calculates a correlation of each data converted by the data conversion unit. - 請求項1に記載の相関分析装置において、
前記データ変換部は、
前記種類の異なる複数のデータが、計測機器の計測による計測データと、作業者の業務記録を示す言語データである場合、前記計測データの中から、当該計測データの特徴量を示す第1の数値特徴量データを抽出し、前記抽出した第1の数値特徴量データを前記関連性情報を基に、前記言語データに関連する第1の言語データに変換すると共に、前記言語データの中から、前記イベントに関連する第2の言語データを抽出し、前記抽出した第2の言語データを前記関連性情報を基に、当該第2の言語データの特徴量を示す第2の数値特徴量データに変換し、
前記相関算出部は、
前記データ変換部で抽出された第1の数値特徴量データと前記データ変換部で変換された第2の数値特徴量データとを基に前記第1の数値特徴量データと前記第2の数値特徴量データとの相関を算出すると共に、前記データ変換部で変換された第1の言語データと前記データ変換部で抽出された第2の言語データとを基に前記第1の言語データと前記第2の言語データとの相関を算出することを特徴とする相関分析装置。 The correlation analyzer according to claim 1,
The data converter is
When the plurality of different types of data are measurement data obtained by measurement by a measurement device and language data indicating a work record of an operator, a first numerical value indicating a feature amount of the measurement data from the measurement data Extracting feature quantity data, converting the extracted first numerical feature quantity data into first language data related to the language data based on the relevance information, and from among the language data, Second language data related to the event is extracted, and the extracted second language data is converted into second numerical feature value data indicating the feature value of the second language data based on the relevance information. And
The correlation calculation unit
The first numerical feature value data and the second numerical feature are based on the first numerical feature value data extracted by the data converter and the second numerical feature value data converted by the data converter. The first language data and the first language data are calculated based on the first language data converted by the data conversion unit and the second language data extracted by the data conversion unit. A correlation analysis apparatus characterized by calculating a correlation with two language data. - 請求項2に記載の相関分析装置において、
前記関連性情報は、
前記第1の数値特徴量データと前記第1の言語データとの対応関係が定義された第1の関連性情報と、前記第2の数値特徴量データと前記第2の言語データとの対応関係が定義された第2の関連性情報とから構成され、前記第1の関連性情報と前記第2の関連性情報は、前記イベント毎に生起されるデータを特定する情報であって、場所、時間、設備または作業者を特定する情報を含むことを特徴とする相関分析装置。 The correlation analyzer according to claim 2,
The relevance information is
Correspondence between the first relevance information in which the correspondence between the first numerical feature data and the first language data is defined, and the correspondence between the second numerical feature data and the second language data Is defined, the first relevance information and the second relevance information are information specifying data generated for each event, and A correlation analyzer characterized by including information for specifying time, equipment, or workers. - 請求項1に記載の相関分析装置において、
前記データ変換部は、
前記時間解像度の異なる複数のデータが、前記イベント毎に生起されるデータの発生時間を示す時間解像度が異なる複数の時系列データで構成されている場合、前記各時間解像度の時系列データを数値特徴量データに変換し、
前記相関算出部は、
前記データ変換部で変換された各数値特徴量データの相関を算出することを特徴とする相関分析装置。 The correlation analyzer according to claim 1,
The data converter is
When the plurality of pieces of data having different time resolutions are composed of a plurality of pieces of time series data having different time resolutions indicating the generation time of data generated for each event, the time series data of each time resolution is numerically characterized. Converted to quantity data,
The correlation calculation unit
A correlation analysis apparatus characterized by calculating a correlation of each numerical feature quantity data converted by the data conversion unit. - 請求項4に記載の相関分析装置において、
前記データ変換部は、
前記変換された前記各時間解像度の数値特徴量データの中に不足する数値特徴量データが存在する場合、前記不足する数値特徴量データを、当該数値特徴量データとは時間解像度が異なる他の時間解像度の数値特徴量データまたは前記不足する数値特徴量データと同一の時間解像度の数値特徴量データから推定することを特徴とする相関分析装置。 The correlation analyzer according to claim 4,
The data converter is
If there is a missing numerical feature quantity data in the converted numeric feature quantity data of each time resolution, the missing numeric feature quantity data is transferred to another time whose time resolution is different from the numeric feature quantity data. A correlation analysis apparatus characterized by estimating from numerical feature value data of resolution or numerical feature value data of the same time resolution as the missing numerical feature value data. - 請求項1に記載の相関分析装置において、
前記データ変換部は、
前記イベント毎に生起されるデータが、計測機器の計測による計測データまたは作業者の業務記録を示す言語データであって、前記イベント毎に生起されるデータの発生時間を示す時間解像度が異なる複数の時系列データで構成されている場合、前記計測データの中から、当該計測データの特徴量を示す第1の数値特徴量データを前記時間解像度毎に抽出し、前記各抽出した第1の数値特徴量データを前記関連性情報を基に、前記言語データに関連する第1の言語データに変換すると共に、前記言語データの中から、前記イベントに関連する第2の言語データを前記時間解像度毎に抽出し、前記各抽出した第2の言語データを前記関連性情報を基に、当該第2の言語データの特徴量を示す第2の数値特徴量データに変換し、
前記相関算出部は、
前記データ変換部で抽出された第1の数値特徴量データと前記データ変換部で変換された第2の数値特徴量データの中から、前記計測データまたは前記言語データに付加されるパラメータで特定される時間解像度の条件を満たす数値特徴量データを選択し、前記選択した第1の数値特徴量データと第2の数値特徴量データとの相関を算出すると共に、前記データ変換部で変換された第1の言語データと前記データ変換部で抽出された第2の言語データの中から、前記計測データまたは前記言語データに付加されるパラメータで特定される時間解像度の条件を満たす言語データを選択し、前記選択した第1の言語データと第2の言語データとの相関を算出することを特徴とする相関分析装置。 The correlation analyzer according to claim 1,
The data converter is
The data generated for each event is measurement data obtained by measurement by a measuring instrument or language data indicating a work record of an operator, and a plurality of time resolutions indicating generation times of data generated for each event are different. In the case of being composed of time series data, first numerical feature amount data indicating the feature amount of the measurement data is extracted from the measurement data for each time resolution, and each of the extracted first numerical features is extracted. Based on the relevance information, quantity data is converted into first language data related to the language data, and second language data related to the event is converted from the language data for each time resolution. Extracting and converting each extracted second language data into second numerical feature value data indicating a feature value of the second language data based on the relevance information;
The correlation calculation unit
The first numerical feature value data extracted by the data converter and the second numerical feature value data converted by the data converter are specified by parameters added to the measurement data or the language data. Numerical feature quantity data satisfying the time resolution condition is selected, the correlation between the selected first numeric feature quantity data and the second numeric feature quantity data is calculated, and the data converted by the data converter Selecting language data satisfying a condition of time resolution specified by the measurement data or a parameter added to the language data from one language data and the second language data extracted by the data conversion unit; A correlation analyzer for calculating a correlation between the selected first language data and second language data. - 請求項1に記載の相関分析装置であって、
前記相関算出部は、
前記データ変換部で変換された各データの中に新規データと既存データが存在する場合、前記既存データ個別の重要度及び相関の大きさを基に前記既存データの連結の重要度を算出し、前記算出結果が閾値を超えた場合、前記新規データと前記既存データとの相関を算出することを特徴とする相関分析装置。 The correlation analyzer according to claim 1,
The correlation calculation unit
When new data and existing data exist in each data converted by the data conversion unit, the importance of the connection of the existing data is calculated based on the importance of the individual existing data and the magnitude of correlation, A correlation analysis apparatus characterized in that, when the calculation result exceeds a threshold value, a correlation between the new data and the existing data is calculated. - 請求項7に記載の相関分析装置であって、
前記相関算出部は、
前記既存データ個別の重要度を、前記新規データ個別の重要度及び相関の大きさを基に更新することを特徴とする相関分析装置。 The correlation analyzer according to claim 7,
The correlation calculation unit
A correlation analysis apparatus, wherein the importance of each existing data is updated based on the importance of each new data and the magnitude of correlation. - 複数のイベント間の関連性を分析し、分析対象のイベントに関連する他のイベントを抽出する相関分析方法において、
前記イベント毎に生起されるデータであって、種類または時間解像度の異なる複数のデータを、前記複数のデータ間の関連性を管理する関連性情報を用いて、各データ共通のデータ形式のデータに変換するデータ変換ステップと、
前記データ変換ステップで変換された各データの相関を算出する相関算出ステップと、を含むことを特徴とする相関分析方法。 In a correlation analysis method that analyzes the relationship between multiple events and extracts other events related to the event being analyzed,
Data generated for each event, and a plurality of data having different types or temporal resolutions are converted into data having a common data format by using relevance information for managing relevance between the plurality of data. A data conversion step to convert;
A correlation calculation step of calculating a correlation of each data converted in the data conversion step. - 請求項9に記載の相関分析方法において、
前記データ変換ステップでは、
前記種類の異なる複数のデータが、計測機器の計測による計測データと、作業者の業務記録を示す言語データである場合、前記計測データの中から、当該計測データの特徴量を示す第1の数値特徴量データを抽出し、前記抽出した第1の数値特徴量データを前記関連性情報を基に、前記言語データに関連する第1の言語データに変換すると共に、前記言語データの中から、前記イベントに関連する第2の言語データを抽出し、前記抽出した第2の言語データを前記関連性情報を基に、当該第2の言語データの特徴量を示す第2の数値特徴量データに変換し、
前記相関算出ステップでは、
前記データ変換ステップで抽出された第1の数値特徴量データと前記データ変換ステップで変換された第2の数値特徴量データとを基に前記第1の数値特徴量データと前記第2の数値特徴量データとの相関を算出すると共に、前記データ変換ステップで変換された第1の言語データと前記データ変換ステップで抽出された第2の言語データとを基に前記第1の言語データと前記第2の言語データとの相関を算出することを特徴とする相関分析方法。 The correlation analysis method according to claim 9,
In the data conversion step,
When the plurality of different types of data are measurement data obtained by measurement by a measurement device and language data indicating a work record of an operator, a first numerical value indicating a feature amount of the measurement data from the measurement data Extracting feature quantity data, converting the extracted first numerical feature quantity data into first language data related to the language data based on the relevance information, and from among the language data, Second language data related to the event is extracted, and the extracted second language data is converted into second numerical feature value data indicating the feature value of the second language data based on the relevance information. And
In the correlation calculating step,
The first numerical feature value data and the second numerical feature are based on the first numerical feature value data extracted in the data conversion step and the second numerical feature value data converted in the data conversion step. Calculating the correlation with the quantity data, and based on the first language data converted in the data conversion step and the second language data extracted in the data conversion step, the first language data and the first language data A correlation analysis method characterized by calculating a correlation with two language data. - 請求項10に記載の相関分析方法において、
前記関連性情報は、
前記第1の数値特徴量データと前記第1の言語データとの対応関係が定義された第1の関連性情報と、前記第2の数値特徴量データと前記第2の言語データとの対応関係が定義された第2の関連性情報とから構成され、前記第1の関連性情報と前記第2の関連性情報は、前記イベント毎に生起されるデータを特定する情報であって、場所、時間、設備または作業者を特定する情報を含むことを特徴とする相関分析方法。 The correlation analysis method according to claim 10,
The relevance information is
Correspondence between the first relevance information in which the correspondence between the first numerical feature data and the first language data is defined, and the correspondence between the second numerical feature data and the second language data Is defined, the first relevance information and the second relevance information are information specifying data generated for each event, and A correlation analysis method characterized by including information specifying time, equipment or workers. - 請求項9に記載の相関分析方法において、
前記データ変換ステップでは、
前記時間解像度の異なる複数のデータが、前記イベント毎に生起されるデータの発生時間を示す時間解像度が異なる複数の時系列データで構成されている場合、前記各時間解像度の時系列データを数値特徴量データに変換し、
前記相関算出ステップでは、
前記データ変換ステップで変換された各数値特徴量データの相関を算出することを特徴とする相関分析方法。 The correlation analysis method according to claim 9,
In the data conversion step,
When the plurality of pieces of data having different time resolutions are composed of a plurality of pieces of time series data having different time resolutions indicating the generation time of data generated for each event, the time series data of each time resolution is numerically characterized. Converted to quantity data,
In the correlation calculating step,
A correlation analysis method characterized by calculating a correlation of each numerical feature value data converted in the data conversion step. - 請求項12に記載の相関分析方法において、
前記データ変換では、
前記変換された前記各時間解像度の数値特徴量データの中に不足する数値特徴量データが存在する場合、前記不足する数値特徴量データを、当該数値特徴量データとは時間解像度が異なる他の時間解像度の数値特徴量データまたは前記不足する数値特徴量データと同一の時間解像度の数値特徴量データから推定することを特徴とする相関分析方法。 The correlation analysis method according to claim 12,
In the data conversion,
If there is a missing numerical feature quantity data in the converted numeric feature quantity data of each time resolution, the missing numeric feature quantity data is transferred to another time whose time resolution is different from the numeric feature quantity data. A correlation analysis method characterized by estimating from numerical feature value data of resolution or numerical feature value data of the same time resolution as the missing numerical feature value data. - 請求項9に記載の相関分析方法において、
前記データ変換ステップでは、
前記イベント毎に生起されるデータが、計測機器の計測による計測データまたは作業者の業務記録を示す言語データであって、前記イベント毎に生起されるデータの発生時間を示す時間解像度が異なる複数の時系列データで構成されている場合、前記計測データの中から、当該計測データの特徴量を示す第1の数値特徴量データを前記時間解像度毎に抽出し、前記各抽出した第1の数値特徴量データを前記関連性情報を基に、前記言語データに関連する第1の言語データに変換すると共に、前記言語データの中から、前記イベントに関連する第2の言語データを前記時間解像度毎に抽出し、前記各抽出した第2の言語データを前記関連性情報を基に、当該第2の言語データの特徴量を示す第2の数値特徴量データに変換し、
前記相関算出ステップでは、
前記データ変換ステップで抽出された第1の数値特徴量データと前記データ変換ステップで変換された第2の数値特徴量データの中から、前記計測データまたは前記言語データに付加されるパラメータで特定される時間解像度の条件を満たす数値特徴量データを選択し、前記選択した第1の数値特徴量データと第2の数値特徴量データとの相関を算出すると共に、前記データ変換ステップで変換された第1の言語データと前記データ変換ステップで抽出された第2の言語データの中から、前記計測データまたは前記言語データに付加されるパラメータで特定される時間解像度の条件を満たす言語データを選択し、前記選択した第1の言語データと第2の言語データとの相関を算出することを特徴とする相関分析方法。 The correlation analysis method according to claim 9,
In the data conversion step,
The data generated for each event is measurement data obtained by measurement by a measuring instrument or language data indicating a work record of an operator, and a plurality of time resolutions indicating generation times of data generated for each event are different. In the case of being composed of time series data, first numerical feature amount data indicating the feature amount of the measurement data is extracted from the measurement data for each time resolution, and each of the extracted first numerical features is extracted. Based on the relevance information, quantity data is converted into first language data related to the language data, and second language data related to the event is converted from the language data for each time resolution. Extracting and converting each extracted second language data into second numerical feature value data indicating a feature value of the second language data based on the relevance information;
In the correlation calculating step,
The first numerical feature value data extracted in the data conversion step and the second numerical feature value data converted in the data conversion step are specified by parameters added to the measurement data or the language data. Numerical feature quantity data satisfying the conditions of the time resolution to be selected, the correlation between the selected first numeric feature quantity data and the second numeric feature quantity data is calculated, and the data converted in the data conversion step Selecting language data satisfying a condition of time resolution specified by the measurement data or a parameter added to the language data from one language data and the second language data extracted in the data conversion step; A correlation analysis method comprising calculating a correlation between the selected first language data and second language data. - 請求項9に記載の相関分析方法であって、
前記相関算出ステップでは、
前記データ変換ステップで変換された各データの中に新規データと既存データが存在する場合、前記既存データ個別の重要度及び相関の大きさを基に前記既存データの連結の重要度を算出し、前記算出結果が閾値を超えた場合、前記新規データと前記既存データとの相関を算出することを特徴とする相関分析方法。 The correlation analysis method according to claim 9, comprising:
In the correlation calculating step,
When new data and existing data exist in each data converted in the data conversion step, calculate the importance of concatenation of the existing data based on the importance of each existing data and the magnitude of correlation, A correlation analysis method characterized by calculating a correlation between the new data and the existing data when the calculation result exceeds a threshold value.
Priority Applications (1)
| Application Number | Priority Date | Filing Date | Title |
|---|---|---|---|
| PCT/JP2012/065552 WO2013190627A1 (en) | 2012-06-18 | 2012-06-18 | Correlation analyzing device and correlation analyzing method |
Applications Claiming Priority (1)
| Application Number | Priority Date | Filing Date | Title |
|---|---|---|---|
| PCT/JP2012/065552 WO2013190627A1 (en) | 2012-06-18 | 2012-06-18 | Correlation analyzing device and correlation analyzing method |
Publications (1)
| Publication Number | Publication Date |
|---|---|
| WO2013190627A1 true WO2013190627A1 (en) | 2013-12-27 |
Family
ID=49768258
Family Applications (1)
| Application Number | Title | Priority Date | Filing Date |
|---|---|---|---|
| PCT/JP2012/065552 WO2013190627A1 (en) | 2012-06-18 | 2012-06-18 | Correlation analyzing device and correlation analyzing method |
Country Status (1)
| Country | Link |
|---|---|
| WO (1) | WO2013190627A1 (en) |
Cited By (1)
| Publication number | Priority date | Publication date | Assignee | Title |
|---|---|---|---|---|
| CN111538760A (en) * | 2020-04-21 | 2020-08-14 | 国网信通亿力科技有限责任公司 | Method for establishing distribution load line loss correlation analysis model based on Apriori algorithm |
Citations (7)
| Publication number | Priority date | Publication date | Assignee | Title |
|---|---|---|---|---|
| JPH0895959A (en) * | 1994-09-29 | 1996-04-12 | Hitachi Ltd | Method for compressing, analyzing and displaying time sequential data and analysis monitoring device |
| JPH1125169A (en) * | 1997-06-30 | 1999-01-29 | Toshiba Corp | Correlation extraction method |
| JP2002015000A (en) * | 2000-06-29 | 2002-01-18 | Toshiba Corp | Device for deciding similarity of multivariable time series data |
| JP2006031378A (en) * | 2004-07-15 | 2006-02-02 | Nippon Hoso Kyokai <Nhk> | Apparatus for complementing time-series data, its method, and its program |
| JP2007279840A (en) * | 2006-04-03 | 2007-10-25 | Omron Corp | Factor estimation device, factor estimation method, program, and computer-readable recording medium |
| JP2008234618A (en) * | 2007-02-23 | 2008-10-02 | Oki Electric Ind Co Ltd | Knowledge extracting device, knowledge extracting method and computer program |
| JP2009265905A (en) * | 2008-04-24 | 2009-11-12 | Toshiba Corp | Preprocessor using preliminary rule, preprocessing method, information extraction device using the preprocessor and information extraction method |
-
2012
- 2012-06-18 WO PCT/JP2012/065552 patent/WO2013190627A1/en active Application Filing
Patent Citations (7)
| Publication number | Priority date | Publication date | Assignee | Title |
|---|---|---|---|---|
| JPH0895959A (en) * | 1994-09-29 | 1996-04-12 | Hitachi Ltd | Method for compressing, analyzing and displaying time sequential data and analysis monitoring device |
| JPH1125169A (en) * | 1997-06-30 | 1999-01-29 | Toshiba Corp | Correlation extraction method |
| JP2002015000A (en) * | 2000-06-29 | 2002-01-18 | Toshiba Corp | Device for deciding similarity of multivariable time series data |
| JP2006031378A (en) * | 2004-07-15 | 2006-02-02 | Nippon Hoso Kyokai <Nhk> | Apparatus for complementing time-series data, its method, and its program |
| JP2007279840A (en) * | 2006-04-03 | 2007-10-25 | Omron Corp | Factor estimation device, factor estimation method, program, and computer-readable recording medium |
| JP2008234618A (en) * | 2007-02-23 | 2008-10-02 | Oki Electric Ind Co Ltd | Knowledge extracting device, knowledge extracting method and computer program |
| JP2009265905A (en) * | 2008-04-24 | 2009-11-12 | Toshiba Corp | Preprocessor using preliminary rule, preprocessing method, information extraction device using the preprocessor and information extraction method |
Cited By (2)
| Publication number | Priority date | Publication date | Assignee | Title |
|---|---|---|---|---|
| CN111538760A (en) * | 2020-04-21 | 2020-08-14 | 国网信通亿力科技有限责任公司 | Method for establishing distribution load line loss correlation analysis model based on Apriori algorithm |
| CN111538760B (en) * | 2020-04-21 | 2022-09-09 | 国网信通亿力科技有限责任公司 | Method for establishing distribution load line loss correlation analysis model based on Apriori algorithm |
Similar Documents
| Publication | Publication Date | Title |
|---|---|---|
| US8751436B2 (en) | Analyzing data quality | |
| JP4717945B2 (en) | Business analysis program and business analysis device | |
| CN102576328A (en) | System operation management device, system operation management method, and program storage medium | |
| JP5588811B2 (en) | Data analysis support system and method | |
| JP5466622B2 (en) | Operation monitoring device, operation monitoring method, and operation monitoring program | |
| CN115423429A (en) | Multimode integrated distribution network operation system based on image and sound information | |
| Gitzel | Data Quality in Time Series Data: An Experience Report. | |
| Alquthami et al. | Analytics framework for optimal smart meters data processing | |
| US7630857B2 (en) | Environmental information aggregating apparatus and method | |
| KR20140037384A (en) | Apparatus and method for prediction of merchandise demand using social network service data | |
| CN112631889B (en) | Portrayal method, device, equipment and readable storage medium for application system | |
| US8335759B2 (en) | Work analysis device and recording medium recording work analysis program | |
| CN110059070A (en) | Data are collected into manufacture operation management data warehouse from data source | |
| JP2010250864A (en) | Information processing apparatus and program | |
| CN113553341A (en) | Multidimensional data analysis method, multidimensional data analysis device, multidimensional data analysis equipment and computer readable storage medium | |
| JP5397370B2 (en) | Dynamic topic analysis system, dynamic topic analysis method, and medium on which dynamic topic analysis program is recorded | |
| JP2009110220A (en) | Audit log collection/evaluation system, audit log collection/evaluation method, and collection/evaluation computer | |
| WO2013190627A1 (en) | Correlation analyzing device and correlation analyzing method | |
| Barua et al. | MIS and information economics: augmenting rich descriptions with analytical rigor in information systems design | |
| JP2021128478A5 (en) | ||
| US20140372386A1 (en) | Detecting wasteful data collection | |
| CN104978604B (en) | A kind of analog simulation method and device based on professional ability model | |
| JP6201053B2 (en) | Feature data management system and feature data management method | |
| JP2017207878A (en) | Missing data estimation method, missing data estimation device, and missing data estimation program | |
| CN112882935A (en) | Method and device for diagnosing running state of distributed environment |
Legal Events
| Date | Code | Title | Description |
|---|---|---|---|
| 121 | Ep: the epo has been informed by wipo that ep was designated in this application |
Ref document number: 12879505 Country of ref document: EP Kind code of ref document: A1 |
|
| NENP | Non-entry into the national phase |
Ref country code: DE |
|
| 122 | Ep: pct application non-entry in european phase |
Ref document number: 12879505 Country of ref document: EP Kind code of ref document: A1 |
|
| NENP | Non-entry into the national phase |
Ref country code: JP |