WO2013183391A1 - 画像フィルタリング装置、画像フィルタリング方法及び画像フィルタリングプログラム - Google Patents
画像フィルタリング装置、画像フィルタリング方法及び画像フィルタリングプログラム Download PDFInfo
- Publication number
- WO2013183391A1 WO2013183391A1 PCT/JP2013/062769 JP2013062769W WO2013183391A1 WO 2013183391 A1 WO2013183391 A1 WO 2013183391A1 JP 2013062769 W JP2013062769 W JP 2013062769W WO 2013183391 A1 WO2013183391 A1 WO 2013183391A1
- Authority
- WO
- WIPO (PCT)
- Prior art keywords
- filtering
- pixel
- image
- signal
- noise
- Prior art date
- Legal status (The legal status is an assumption and is not a legal conclusion. Google has not performed a legal analysis and makes no representation as to the accuracy of the status listed.)
- Ceased
Links
Images








Classifications
-
- G—PHYSICS
- G06—COMPUTING OR CALCULATING; COUNTING
- G06T—IMAGE DATA PROCESSING OR GENERATION, IN GENERAL
- G06T5/00—Image enhancement or restoration
- G06T5/20—Image enhancement or restoration using local operators
-
- G—PHYSICS
- G06—COMPUTING OR CALCULATING; COUNTING
- G06T—IMAGE DATA PROCESSING OR GENERATION, IN GENERAL
- G06T5/00—Image enhancement or restoration
- G06T5/70—Denoising; Smoothing
-
- G—PHYSICS
- G06—COMPUTING OR CALCULATING; COUNTING
- G06T—IMAGE DATA PROCESSING OR GENERATION, IN GENERAL
- G06T2207/00—Indexing scheme for image analysis or image enhancement
- G06T2207/10—Image acquisition modality
- G06T2207/10024—Color image
-
- G—PHYSICS
- G06—COMPUTING OR CALCULATING; COUNTING
- G06T—IMAGE DATA PROCESSING OR GENERATION, IN GENERAL
- G06T2207/00—Indexing scheme for image analysis or image enhancement
- G06T2207/20—Special algorithmic details
- G06T2207/20024—Filtering details
- G06T2207/20028—Bilateral filtering
-
- G—PHYSICS
- G06—COMPUTING OR CALCULATING; COUNTING
- G06T—IMAGE DATA PROCESSING OR GENERATION, IN GENERAL
- G06T2207/00—Indexing scheme for image analysis or image enhancement
- G06T2207/20—Special algorithmic details
- G06T2207/20172—Image enhancement details
- G06T2207/20192—Edge enhancement; Edge preservation
Definitions
- the present invention relates to an image filtering device, an image filtering method, and an image filtering program.
- noise reduction techniques with excellent storability of original signal information such as edges and textures is increasing in realizing high-quality image capturing.
- a noise reduction method using a bilateral filter is known as such a noise reduction method with excellent preservation of signal information. (For example, refer nonpatent literature 1).
- a pixel having a coordinate position closer to the pixel to be filtered and a pixel having a smaller difference in signal intensity gives a higher weighting to the filtering and increases the filtering effect.
- the edge of the image can be retained in order to reduce the filtering effect.
- the SNR indicates that the amount of noise with respect to the signal is logarithm. The larger the numerical value, the lower the noise and the higher the quality of the signal. However, depending on the input image signal, the output SNR is small. As a result, noise was not sufficiently removed. In addition, there is a problem that the original image signal information is lost when noise is excessively reduced because of fear that sufficient filtering cannot be performed. That is, stable filtering that does not depend on the input image signal cannot be performed.
- the present invention has been made in view of the above circumstances, and an object thereof is to provide an image filtering apparatus, an image filtering method, and an image filtering program capable of performing stable filtering independent of an input image signal.
- An image filtering apparatus is an image filtering apparatus that performs filtering on an image signal, and includes an input unit that inputs the image signal, and pixels that constitute the image signal input by the input unit.
- the difference between the signal intensity of the pixel of interest and the signal intensity of the pixels around the pixel of interest is weighted, and the difference between the signal intensity of the pixel of interest that has been weighted and the signal intensity of the pixels around the pixel of interest
- Filtering means for calculating the signal strength after filtering of the target pixel by adding the value obtained by multiplying the value obtained by multiplying the set value by the coefficient ⁇ and the signal strength of the target pixel, and calculating by the filtering means
- Output means for outputting an image signal composed of pixels of the filtered signal intensity.
- this image filtering device as the signal intensity after filtering of the target pixel, a value obtained by adding the weighted signal intensity difference between the target pixel and pixels around the target pixel is multiplied by a coefficient ⁇ . The value obtained by adding the signal intensity before filtering of the target pixel to the obtained value is calculated. Multiplying the coefficient ⁇ can make the output SNR a stable value regardless of the image signal, which is a finding found by the present inventors through extensive research. As described above, according to an embodiment of the present invention, it is possible to provide an image filtering device capable of performing stable filtering independent of an input image signal.
- the filtering unit when the weighting is performed, the filtering unit increases the weight as the distance between the pixel position of the surrounding pixel and the pixel position of the target pixel is closer, The weighting may be increased as the difference between the signal strength of the surrounding pixels and the signal strength of the target pixel is smaller.
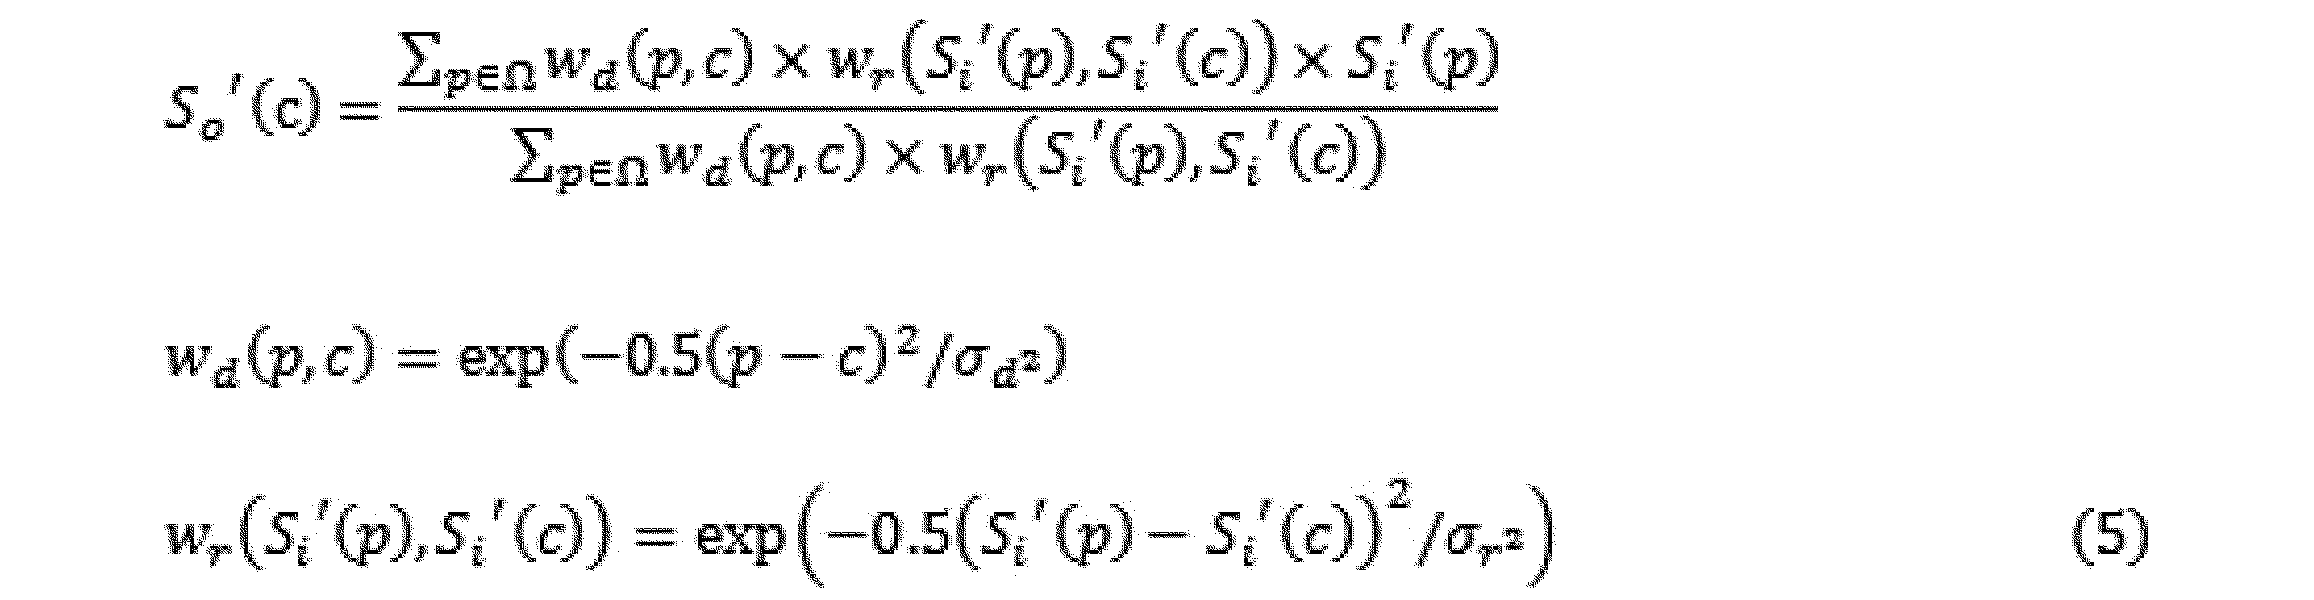
- the filtering means is Calculate the signal strength after filtering by the formula defined as S o ′ () is the signal strength after filtering, S i ′ () is the signal strength before filtering, c is the pixel position of the pixel of interest, p is the pixel position of the surrounding pixels of the pixel of interest, ⁇ is a region where the surrounding pixels are located (local region of H ⁇ W pixels centered on the pixel of interest), ⁇ is the coefficient, ⁇ d 2 is a parameter for weighting according to the distance from the pixel of interest, ⁇ r 2 is a parameter for weighting according to the difference from the signal intensity of the pixel of interest, It may be.
- S o ′ () is the signal strength after filtering
- S i ′ () is the signal strength before filtering
- c is the pixel position of the pixel of interest
- p is the pixel position of the surrounding pixels of the pixel of interest
- ⁇ is a region where the surrounding pixels are located (local region of
- the filtering means is Calculate the signal strength after filtering by the formula defined as S o ′ () is the signal strength after filtering, S i ′ () is the signal strength before filtering, c is the pixel position of the pixel of interest, p is the pixel position of the surrounding pixels of the pixel of interest, ⁇ is a region where the surrounding pixels are located (local region of H ⁇ W pixels centered on the pixel of interest), ⁇ is the coefficient, ⁇ d 2 is a parameter (domain filter dispersion value) for weighting according to the distance from the pixel of interest, ⁇ r 2 is a parameter (range filter dispersion value) for weighting according to the difference from the signal intensity of the pixel of interest, ⁇ V (S i ′ (p)) is the difference between the signal strength of the region including p and the signal strength of the pixel of interest among the plurality of regions obtained by dividing the region of the image signal. It may be.
- Noise variance upper limit calculating means for calculating a plurality of variance values according to the signal strength and calculating a noise variance upper limit value which is an upper limit value of noise according to the signal strength included in the pixel of the image signal from the noise variance value
- a calculated pixel determining unit that determines whether or not surrounding pixels are pixels that can be used to calculate the noise variance value of the pixel of interest using the noise variance upper limit value calculated by the noise variance upper limit value calculating unit
- the filtering means may calculate the signal strength after filtering using the noise variance value ⁇ 2 total (c) as ⁇ r 2 .
- the calculation pixel determination unit includes:
- the surrounding pixels are determined to be pixels that can be used to calculate the noise variance of the pixel of interest, ⁇ 2 max (S i ′ (c)) is the noise variance upper limit value of the pixel of interest, K is a predetermined determination coefficient, It may be.
- the noise variance value can be calculated more reliably.
- the image filtering apparatus further includes a coefficient calculating unit that calculates a coefficient ⁇ , and the coefficient calculating unit inputs a value based on a noise variance value of the image signal before and after filtering,
- the coefficient ⁇ may be calculated from the input value.
- the coefficient calculation unit includes The coefficient ⁇ is calculated by the formula defined as ⁇ i is the noise standard deviation based on the noise variance of the image signal before filtering, ⁇ t is the residual noise standard deviation based on the noise variance of the filtered image signal, It may be. By using the definition formula, the coefficient ⁇ can be calculated more reliably.
- An image filtering method is an image filtering method for filtering an image signal, and includes an input step for inputting an image signal and an image signal input in the input step. Weighting is performed on the difference between the signal strength of the pixel of interest and the signal strength of the pixels around the pixel of interest, and the signal strength of the pixel of interest that has been weighted and the signal strength of the pixels around the pixel of interest
- An image filtering program is an image filtering program that performs filtering on an image signal.
- the image filtering program includes: an input unit that inputs an image signal; and an image signal that is input by the input unit. Is weighted, and the signal strength of the pixel around the pixel of interest and the signal intensity of the pixel around the pixel of interest are weighted.
- Filtering means for calculating a signal strength after filtering of the target pixel by adding a value obtained by multiplying a value obtained by adding a difference ⁇ to the signal strength and a signal strength of the target pixel;
- An output means for outputting an image signal composed of pixels of the signal intensity after filtering calculated by the filtering means. Make.
- the image filtering method and the image filtering program can achieve the same effects as the image filtering device described above.
- an image filtering device an image filtering method, and an image filtering program that can perform appropriate filtering corresponding to a change in signal strength of an image signal.
- FIG. 3 is a diagram illustrating experimental conditions of Example 1. 4 is a graph showing an experimental result when a color chart is used in Example 1.
- FIG. It is a figure which shows the experimental result at the time of using a color chart among Example 1.
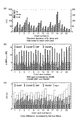
- FIG. It is a figure which shows the noise reduction characteristic of each filtering apparatus in Example 2. It is a figure which shows the noise versus signal ratio of each filtering apparatus in Example 2. It is a figure which shows the structure of the image filtering program which concerns on embodiment of this invention with a recording medium. It is a figure which shows the measuring method of the noise reduction characteristic with respect to input SNR for every (sigma) r .
- the noise superimposing process in the imaging apparatus will be described with reference to FIG.
- incident light passes through the lens 2 and the color filter 3, is photoelectrically converted by the image sensor to become an analog signal, and the image signal is digitized by the A / D converter 4.
- the digitized image signal may be a signal value of a color conversion XYZ color system that represents a device-independent color.
- the signal value of the XYZ color system can be calculated by multiplying the gradation value (R, G, B) of the RGB color system by the conversion matrix M.
- Fixed pattern noise is noise caused by uneven spectral sensitivity of the imaging apparatus 1 including optical systems and sensors.
- Aged noise includes dark current noise, shot noise, quantization noise, and the like.
- Dark current noise is noise caused by thermal noise caused by irregular thermal vibration of electrons in the resistor.
- Shot noise is noise caused by font and electronic quantum fluctuations.
- the quantization noise is noise generated when the image signal is digitized by the A / D conversion unit 4.
- the total noise (Total Noise) is the sum of fixed pattern noise and time-lapse noise. Since superimposition of total noise on the image signal is unavoidable, a method for reducing these noises is required.
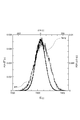
- FIG. 2 is a superimposed image of fixed pattern noise and temporal noise.
- the axes related to the fixed pattern noise are the lower axis (X axis) and the left axis (Y axis).
- the lower axis shows the signal intensity S 1 ′ (pixel value and luminance value) of the image signal
- the left axis shows the value obtained by dividing the frequency of the image signal by the total number of pixels (PDF (S 1 ′)).
- the axes related to noise are the upper axis (U axis) and the right axis (R axis), and the upper axis represents the difference ⁇ S i ′ from the original image signal intensity (in the measurement using the average value image described later,
- the right axis indicates the value (PDF ( ⁇ S 1 ′)) obtained by dividing the frequency of the image signal by the total number of pixels.
- PDF ( ⁇ S 1 ′) PDF ( ⁇ S 1 ′)
- both the measured value of the signal strength affected by the fixed pattern noise and the measured value of the signal strength affected by the temporal pattern noise are approximately the same before and after the original signal information.
- a dispersed value is observed as the signal intensity of the image signal.
- the probability density function is a normal distribution or a function that can be approximated to a normal distribution for both fixed pattern noise, dark current noise, shot noise, and quantization noise that are temporal noise, and the variance value is the signal strength. Because it depends on. From this, the statistical properties of fixed pattern noise and temporal noise for an image signal follow a Gaussian distribution (can be approximated to a Gaussian distribution). That is, it can be seen that each noise to be superimposed follows a Gaussian distribution.
- FIG. 3 is a diagram illustrating the characteristics of the bilateral filter.
- the bilateral filter performs smoothing processing while maintaining the edge of the image signal before filtering, and is composed of two types of weighted average filters, a domain filter and a range filter.
- weights are set by weight functions w d (domain filter weight functions) and w r (range filter weight functions) of two types of weighted average filters.
- Weighting function w d domain filter is a weight on the distance between the pixel and the surrounding pixel of interest (similarity coordinate axis), the distance is set large weights closer. This is based on the assumption that pixels at short distances are highly correlated. That is, even if the surrounding pixels have similar signal intensities, it is assumed that the signals are obtained from different signal sources when the distance between the pixels is large.
- weighting function w r of the range filter is a weight for the difference in signal intensity between the pixel and the surrounding pixel of interest (the similarity of the signal intensity axis), setting a large weight as the difference between the signal intensity is low.
- pixels that have a large absolute value of the difference in signal intensity with the surrounding pixels, such as pixels at the edge boundary, are hardly used for smoothing processing and do not dull the edges of the image. Is obtained.
- the characteristics of the bilateral filter described above are shown in FIG.
- the horizontal axis of the graph indicates the pixel position p of the pixels around the pixel of interest, and the vertical axis of the graph indicates the signal intensity S i ′.
- the graph of the weighting function w d domain filters are the most heavily weighted when the pixel position p is "8”, the graph of the weighting function w r of the range filter signal When the intensity is “150”, the weight is made the heaviest. This is because the pixel position of the target pixel is “8” and the signal intensity is “150”.
- the bilateral filter shown in FIG. 3A is represented by the following equation.
- S o ′ () is the signal intensity after filtering
- S i ′ () is the signal intensity before filtering
- c is the pixel position of the target pixel
- p is the pixel position of the surrounding pixels of the target pixel
- ⁇ is the surrounding pixel
- the area where the pixel is located local area of H ⁇ W pixel centered on the pixel of interest (H and W are natural numbers set in advance)
- ⁇ d 2 is the weight when performing weighting according to the distance from the pixel of interest
- a parameter (domain filter dispersion value) and ⁇ r 2 each represent a parameter (range filter dispersion value) when weighting is performed according to the difference from the signal intensity of the pixel of interest.
- Bilateral filter is an area where surrounding pixels are located (local region of H ⁇ W pixels centered on the pixel of interest) ⁇ , and a parameter for weighting according to the distance from the pixel of interest (domain filter variance value) ⁇ d 2 , a parameter ⁇ r 2 for performing weighting according to the difference in signal intensity of the pixel of interest, is a parameter that affects noise reduction.
- the residual noise component due to excessive noise reduction or insufficient noise reduction occurs when the parameter setting is inappropriate for the amount of noise superimposed on the image signal.
- the pixel position p of the surrounding pixels is used as the horizontal axis
- the signal intensity S i ′ is used as the vertical axis
- the difference pc between the pixel position of the target pixel and the surrounding pixels is shown on the horizontal axis.
- the signal intensity difference ⁇ S i ′ between the pixel of interest and the surrounding pixels is used as the vertical axis
- the characteristics of the bilateral filter are as shown in FIG.
- the weighting function w d of the domain filter and the weighting function w of the range filter The weight of r is the heaviest.
- the bilateral filter shown in FIG. Note that the characteristics of the bilateral filter are described in Non-Patent Document 1.
- FIG. 4 is a functional block diagram of the image filtering device 10 according to the embodiment of the present invention.
- the image filtering device 10 performs filtering on the image signal digitized by the A / D conversion unit 4 shown in FIG.
- the image filtering device 10 according to the present embodiment includes an input unit 11, an output unit 12, a filtering unit 13, a noise variance upper limit calculation unit 14, a calculation pixel determination unit 15, and noise.
- a variance estimation unit 16 and a coefficient calculation unit 17 are provided.
- a filter based on a bilateral filter or a non-local mean filter can be used.
- the image filtering device 10 is realized by a computer including hardware such as a CPU and a memory, for example.
- the image filtering device 10 is mounted on the imaging device 1.
- the SNR of the input image signal can be expressed by 20 log 10 (S i ⁇ bar ′ / ⁇ i ), and the SNR of the output image signal can be expressed by 20 log 10 (S o ⁇ bar ′ / ⁇ t ).
- S i ⁇ bar ′ is the average value of the signal strength before filtering
- S o ⁇ bar ′ is the average value of the signal strength after filtering
- ⁇ i is the noise variance of the image signal (of the input signal) before filtering.
- ⁇ t represent the residual noise standard deviation based on the noise variance value of the image signal after filtering.
- the SNR of the input image signal and the SNR of the output image signal can be obtained for each image signal or each pixel.
- S i ⁇ bar ′ and S o ⁇ bar ′ are the average signal intensity of the pixels of the entire image signal when calculated for each image signal, and the signal intensity for each pixel when calculated for each pixel.
- the signal intensity for each color card number is averaged.
- ⁇ i and ⁇ t can be obtained for each image signal or each pixel.
- ⁇ i and ⁇ t for each image signal for example, it is a square root of a noise variance value ⁇ 2 total that is a variance value of noise for each pixel of interest included in the image signal before and after filtering, which will be described later.
- the average of the noise standard deviation ⁇ total is ⁇ i and ⁇ t .
- ⁇ i and ⁇ t for each pixel for example, a noise standard deviation ⁇ total for each pixel of interest included in the image signal before and after filtering, which will be described later, becomes ⁇ i and ⁇ t of each pixel. .
- a noise standard deviation ⁇ total for each pixel of interest included in the image signal for each color card number before and after filtering is used. Is the average of ⁇ i and ⁇ t .
- the noise variance value ⁇ 2 total and the noise standard deviation ⁇ total can be calculated from a plurality of images by a noise variance upper limit calculation unit 14 described later, and calculated from a single image by a noise variance estimation unit 16 described later. can do.
- the input unit 11 is an input means for inputting the image signal digitized by the A / D conversion unit 4.
- the image signal input by the input unit 11 is composed of pixels having signal strength before filtering.
- the image signal input by the input unit 11 is input to the filtering unit 13.
- the output unit 12 is an output unit that outputs an image signal composed of pixels of the signal intensity after filtering calculated by the filtering unit 13.
- the filtering unit 13 performs an operation (filtering) on the image signal input from the input unit 11 to perform noise removal and edge enhancement in the image signal, and calculates a signal intensity after filtering. Filtering means.
- the image signal filtered by the filtering unit 13 is input to the output unit 12.
- the filtering unit 13 weights the difference between the signal intensity of the pixel of interest and the signal intensity of pixels around the pixel of interest among the pixels constituting the image signal input by the input unit 11 and performs the weighting. By adding the value obtained by multiplying the value obtained by adding the difference between the signal intensity of the pixel of interest and the signal intensity of the pixels around the pixel of interest to the coefficient ⁇ and the signal intensity of the pixel of interest, This is a filtering means for calculating the signal intensity after filtering of the pixel of interest.
- the pixel of interest is a pixel included in the input image signal, and is a pixel for calculating the signal intensity after filtering.
- the surrounding pixels are pixels located around the pixel of interest and are used to calculate the signal intensity of the pixel of interest.
- the filtering unit 13 calculates the signal intensity after filtering of the input image signal by sequentially calculating all the pixels included in the input image signal as the target pixel and calculating the signal intensity after filtering.
- the coefficient ⁇ is a value that is multiplied by the sum of the weighted surrounding pixels, and a predetermined value may be set in advance, or may be calculated by the coefficient calculation unit 17 described later.
- the fact that the signal-to-noise ratio of the image signal after filtering can be set to a stable value by multiplying by the coefficient ⁇ is a finding that the present inventor has found through extensive research.
- the filtering unit 13 increases the weighting as the distance between the pixel position of the surrounding pixels and the pixel position of the target pixel is shorter. Further, when performing the above-described weighting, the filtering unit 13 increases the weight as the difference between the signal strength of the surrounding pixels and the signal strength of the target pixel is smaller.
- the filtering unit 13 can calculate the signal strength after filtering by an expression defined below.
- the difference from the general bilateral filter equation shown in the above equation (6) is that the portion excluding the signal intensity S i ′ () before filtering on the right side is multiplied by the coefficient ⁇ .
- the filtering unit 13 can calculate the signal strength after filtering according to an expression defined below. Similar to the above equation (7), the portion excluding the signal intensity S i ′ () before filtering on the right side is multiplied by the coefficient ⁇ .
- the difference from the above formula (7) is that ⁇ V (S i ′ (p)) is used.
- ⁇ V (S i ′ (p)) is, for example, the difference between the signal intensity of the area including p and the signal intensity of the pixel of interest among a plurality of areas obtained by dividing the area of the image signal in the same size in a grid pattern.
- weighting function w r of the range filter is determined by calculating the difference in signal strength between the target pixel and surrounding pixels for each pixel of each peripheral which it was, but in the above formula is a definition equation of the non-local Mean filter (8), weighting function w r of the range filter, a difference in signal strength between the target pixel and the surrounding pixels around the pixel is located It is calculated and obtained for each fixed region (region including p among a plurality of regions obtained by dividing the region of the image signal).
- the signal intensity of the fixed area for example, the average of the signal intensity of each pixel included in the fixed area can be used.
- a parameter (range filter dispersion value) ⁇ for weighting according to the difference from the signal intensity of the pixel of interest It has been found that more stable filtering can be performed by calculating the signal intensity after filtering using the noise variance value ⁇ 2 total that is the noise variance value for each pixel of interest as r 2 .
- a filtering unit Reference numeral 13 denotes a noise variance value ⁇ 2 total as a parameter (range filter variance value) ⁇ r 2 when weighting is performed according to the difference from the signal intensity of the pixel of interest in the formula (7) and the formula (8). Is used to calculate the signal strength after filtering.
- the noise dispersion upper limit calculation unit 14 receives a plurality of reference image signals obtained by imaging the same target, and disperses noise included in the pixels constituting the reference image signal according to the signal intensity of the pixels.
- Noise variance upper limit calculating means for calculating a plurality of values and calculating a noise variance upper limit value, which is an upper limit value of noise corresponding to the signal intensity included in the pixel of the image signal, from the noise variance value.
- Non-Patent Document 2 An example of a method for calculating a variance value of a plurality of noises calculated by the noise variance upper limit calculator 14 will be described with reference to FIG.
- the calculation method of the variance value of noise is described in “ISO15739 First edition: Photographic-Electronic still-picture imaging-Noise measurement”, 2003 (hereinafter referred to as Non-Patent Document 2).
- a color chart is a plate-like object in which a color table, that is, a color sample is arranged, and is used for color comparison and measurement, such as checking color reproducibility.
- the n sheets may be 8 sheets or more, and in this embodiment, 10 sheets. The positional relationship between the imaging device 1 and the color chart is fixed.
- the positional relationship between the imaging device 1 and the color chart is fixed at the same position, the exposure time is also the same, 10 dark current images are captured in the light shielding space, and the signal intensity distribution of the pixels constituting each dark current image is dispersed. A value is calculated and an average value ⁇ 2 dc thereof is obtained. Then, the average value of the dark current noise is acquired from the dark current image, and the bias added by the dark current noise is subtracted from the first acquired ten reference images to create an image after dark current correction.
- one average value image is created from 10 images after dark current correction.
- the average value image is an image obtained by acquiring the average signal intensity for each pixel.
- ten difference images which are the differences between the average value image and the ten images after dark current correction, are created.
- a local region having a flat region not including an edge of M ⁇ N pixels (M and N are preset natural numbers) is selected for the average value image, A variance value ⁇ 2 ave of the signal intensity of the pixels constituting the average value image in the local region is calculated.
- a local region having a flat region not including an edge of M ⁇ N pixels is selected, and the signal intensity and variance of the difference image in the local region are selected. Calculate the value. Thereafter, an average value ⁇ 2 diff of the variance values of the signal intensities of the pixels constituting each difference image is calculated.
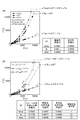
- FIG. 6 shows an image of measurement results of noise variance values.
- the horizontal axis of the graph of FIG. 6 represents the signal intensity S i ′, and the vertical axis represents the variance value of each noise.
- the variance value ⁇ 2 temp of the temporal noise, the variance value ⁇ 2 fp of the fixed pattern noise, and the variance value ⁇ 2 total of the total noise calculated by the above formula are shown in FIG. 6A when the pixel position is fixed at a specific position. ), It can be estimated by an approximate expression using the signal intensity as a variable.
- the multiple correlation coefficient R is used as the determination coefficient R 2 of the multiple correlation coefficient R (the determination coefficient R 2 is not less than 0 and not more than 1, and the closer the value is to 1, the higher the matching degree of the comparison object is
- the values shown in FIG. 6 are as shown in the table of FIG.
- the variance coefficient ⁇ 2 temp of the temporal noise, the variance value ⁇ 2 fp of the fixed pattern noise, and the determination coefficient R 2 of the variance value ⁇ 2 total of the total noise are very close to 1. That is, the variance value of each noise has a high degree of coincidence between the value based on the approximate expression and the actually measured value.
- the value of the coefficient of determination R 2 of multiple correlation coefficient R is as in Table shown in Figure 6 (b).
- the determination coefficient R 2 for the variance value ⁇ 2 temp of the temporal noise having no pixel position dependency is extremely 1.
- the coefficient of determination R 2 for the variance ⁇ 2 fp of the fixed pattern noise that depends on the pixel position is 0.7768, and the degree of coincidence between the value obtained by the approximate expression and the actual measurement value is low. .
- the variance value ⁇ 2 temp of the temporal noise and the variance value ⁇ 2 fp of the fixed pattern noise calculated by the above equation (9) can be expressed by the equations defined below using parameters ⁇ and ⁇ , respectively.
- S i ⁇ ave ′ is the signal intensity of the average value image.
- the noise variance upper limit calculation unit 14 calculates the parameter ⁇ from the calculated S i ⁇ ave ′, ⁇ 2 dc, ⁇ 2 fp , ⁇ 2 temp calculated from the above equation (9), and the above equation (10). And the parameter ⁇ is obtained.
- the parameter ⁇ and the parameter ⁇ can be obtained for each pixel or for the same color in the color chart.
- the noise variance upper limit calculation unit 14 calculates ⁇ max that is the maximum value among a plurality of ⁇ s, ⁇ max that is the maximum value among ⁇ s and a plurality of ⁇ values from the plurality of parameters ⁇ and the plurality of parameters ⁇ obtained. Among them, the minimum value ⁇ min is selected.
- ⁇ max is max ⁇ (S i ′ (p)) ⁇
- ⁇ max is max ⁇ (S i ′ (p)) ⁇
- ⁇ min is min ⁇ .
- the upper limit approximation function ⁇ 2 max (S i ′) of the noise characteristics is derived, and from ⁇ min , the lower limit approximation function ⁇ 2 min (S i ′) of the noise characteristics is represented by the equations defined below. Calculated.
- the lower limit approximation function ⁇ 2 min (S i ′) of the noise characteristic is not necessarily required in determining the pixel for calculating the variance value of the noise of the pixel of interest by the calculation pixel determination unit 15 described later.
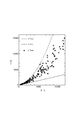
- FIG. 7 shows an upper limit approximation function ⁇ 2 max (S i ′) and a lower limit approximation function ⁇ 2 min (S i ′) of noise characteristics.
- the horizontal axis of the graph in FIG. 7 represents the signal intensity S i ′, and the vertical axis represents the variance value of each noise. Since the upper and lower limits of the variance of the noise is determined, variance sigma 2 total noise in the signal strength can be estimated to be a value between the upper and lower limit values.
- the upper and lower limit approximation functions of noise characteristics are described in “YM Baek, JC Kim, DC Cho, JA Lee, and WY Kin,“ Integrated Noise Modeling For Image Sensor.
- Non-Patent Document 3 Using Bayer Domain Images ", Computer Vision / Computer Graphics Collaboration Technologies, pp. 413-424, 2009” (hereinafter referred to as Non-Patent Document 3).
- the literature proposes modeling that defines the upper and lower limits of noise variance, the method for determining each parameter ( ⁇ max , ⁇ max, ⁇ min ) is not clearly shown.
- the chart used for model creation is a Macbeth color chart, so that the number of shootings is reduced compared to the case of using a gray scale chart or a uniform light source surface.
- the noise variance value estimation method estimates the noise variance value of the pixel of interest using only one image. For this reason, the signals of the pixels in the local region are captured with the same signal source having the same signal strength (including a signal strength that is very close), and noise with characteristics that fall within the upper limit of the noise characteristics acquired in advance is superimposed. Assume that In other words, pixels having the same signal strength are estimated using the upper limit value of the noise characteristics, and the noise variance value is estimated.
- the calculated pixel determination unit 15 uses the noise variance upper limit value calculated by the noise variance upper limit value calculation unit 14, and the surrounding pixels in the filtering target image signal input by the input unit 11 are the noise variance values of the pixel of interest. Calculating pixel determining means for determining whether or not the pixel can be used for calculating.
- the calculation pixel determination unit 15 determines whether the signal intensity of the surrounding pixels satisfies an expression defined below using an upper limit approximation function ⁇ 2 max (S i ′) indicating the noise variance upper limit value of the target pixel. Then, it is determined whether or not the surrounding pixels are pixels that can be used to calculate the noise variance value of the pixel of interest.
- K is a preset determination coefficient (0.5 ksigmappoint), and for example, 5 is used as the determination coefficient K.
- the surrounding pixels satisfying the above equation (12) are determined to be the same signal source having the same signal intensity as the target pixel (including a signal intensity that is very close), and calculation of the variance value of the noise of the target pixel described later is performed. Used for.
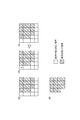
- FIG. 8 shows an image of determining pixels used by the calculation pixel determining unit 15 to calculate the variance value of noise.
- the pixel used for calculating the variance value of noise is determined using only one image to be filtered.
- c indicates a pixel of interest
- p indicates surrounding pixels.
- the central square is the target pixel
- the other squares are the surrounding pixels.
- the hatched squares are the positions of surrounding pixels that satisfy the above expression (12)
- the white squares are the positions of surrounding pixels that do not satisfy the above expression (12).
- surrounding pixels that do not satisfy the above expression 12 are determined to be pixels that are not used to calculate the noise variance value of the pixel of interest.
- the surrounding pixels satisfying the expression 12 are determined to be pixels that can be used to calculate the noise variance value of the pixel of interest.
- each of the surrounding pixels is determined, and as shown in FIG. 8D, a signal set S ⁇ composed of the surrounding pixels satisfying Expression 12 is derived.
- the noise variance estimation unit 16 calculates the noise variance value ⁇ 2 of the pixel of interest from surrounding pixels determined to be pixels that can be used by the calculated pixel determination unit 15 to calculate the noise variance value of the pixel of interest. This is noise variance estimation means for estimating total (c).
- the noise variance value ⁇ 2 total (c) for each pixel of interest calculated by the noise variance estimation unit 16 is used by the filtering unit 13 as a parameter for calculating the signal strength after filtering.
- the filtering unit 13 calculates the signal strength after filtering using the noise variance value ⁇ 2 total (c) as ⁇ r 2 in the above formula (1) or (2).
- the method for obtaining the noise variance value ⁇ 2 total (c) for each pixel is not limited to the above method, and may be obtained by other methods.
- the coefficient calculation unit 17 is a coefficient calculation unit that calculates the coefficient ⁇ .
- the coefficient calculation unit 17 inputs a value based on the noise variance value of the image signal before and after filtering and calculates the coefficient ⁇ from the input value.
- the coefficient ⁇ can be obtained from the standard deviation of noise before and after filtering, which is a value based on the noise variance value of the image signal before and after filtering.
- the filtering is performed by, for example, the filtering device 10, and the signal strength after filtering is calculated by the equation defined by the above equation (1) or (2).
- the standard deviations ⁇ i and ⁇ t of the noise before and after filtering for example, the total noise standard deviation ⁇ total can be used, and when the coefficient ⁇ is calculated for each image signal, each noise signal included in the image signal An average of the noise standard deviation ⁇ total of the pixel of interest becomes ⁇ i and ⁇ t , and a coefficient ⁇ for each image signal is calculated. Also, when calculating the coefficient ⁇ for each pixel, the coefficients of the noise standard deviation sigma i and sigma t of each target pixel included in the image signal every sigma i and sigma t becomes the target pixel of each pixel ⁇ is Calculated.
- the noise variance value ⁇ 2 total and the noise standard deviation ⁇ total can be calculated from a plurality of images by a noise variance upper limit calculation unit 14 described later, and calculated from a single image by a noise variance estimation unit 16 described later. can do. Further, filtering may be performed by a filtering device other than the filtering device 10 to obtain a standard deviation of noise before and after filtering. Specifically, the calculation of the coefficient ⁇ from the standard deviation of noise before and after filtering is performed by an expression defined below.
- ⁇ i is a noise standard deviation based on the noise variance value of the image signal (of the input signal) before filtering ( total noise standard deviation ⁇ total of the image signal before filtering)
- ⁇ t is The residual noise standard deviation based on the noise variance value of the image signal after filtering ( total noise standard deviation ⁇ total of the image signal after filtering) is shown.
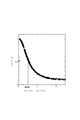
- the coefficient ⁇ when the horizontal axis of the graph is ⁇ r / ⁇ i and the vertical axis is ⁇ t / ⁇ i is as shown in FIG. Since the noise variance estimated by the noise variance estimator 16 can accurately estimate the actually measured value ⁇ i , the noise variance estimated by the noise variance estimator 16 is used as the value of ⁇ r. By setting the value, ⁇ r ⁇ i , and the value of the coefficient ⁇ can be a fixed value. It is also possible to obtain and use the coefficient ⁇ dynamically for all pixels.
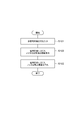
- FIG. 10 is a flowchart showing noise dispersion upper limit calculation processing by the image filtering apparatus 10 according to the embodiment of the present invention.
- S101 to S103 of this process need only be performed once if the imaging conditions such as the image sensor temperature and the shutter speed are the same, and are not performed when the imaging device 1 captures the subject after performing the process once. It is. When the photographing conditions such as the imaging device element temperature and the shutter speed are changed, the processing of S101 to S103 is performed again.
- a plurality of reference images obtained by imaging the same target are input from the input unit 11 (S101).
- An average value image and a difference image are created from the reference image, and each signal intensity and variance value are calculated, and the noise variance upper limit value calculation unit 14 calculates a plurality of noise variance values according to the signal intensity. (S102).
- the noise variance upper limit calculation unit 14 calculates the noise characteristic upper limit approximation function ⁇ 2 max (S i ′) and the lower limit approximation function ⁇ 2 min (S i ) from the noise variance value corresponding to the calculated signal strength. ') Is calculated, and the noise variance upper limit (and lower limit) corresponding to the signal intensity is calculated (S103).
- FIG. 11 is a flowchart showing a filtering process according to the embodiment of the present invention.
- an image signal is input by the input unit 11 (S104, input step).
- the calculation pixel determining unit 15 determines surrounding pixels for calculating the noise variance value of each target pixel (S105).
- the noise variance estimation unit 16 calculates the noise variance value ⁇ 2 total (c) of each pixel of interest using the surrounding pixels for calculating the noise variance value determined by the calculation pixel determination unit 15. (S106).
- filtering is performed using the calculated noise variance value ⁇ 2 total (c) of each pixel of interest (S107).
- the variance value of noise before and after filtering is calculated by the positive coefficient calculation unit 17, and the coefficient ⁇ is calculated from the above equation (13) (S108).
- the filtering unit 13 uses the noise variance value ⁇ 2 total (c) of each pixel of interest calculated in the noise variance estimation unit 16 in S106 and the coefficient ⁇ calculated in the coefficient calculation unit 17 in S108.
- the image signal is filtered again (S109, filtering step).
- the output unit 12 outputs an image signal composed of pixels of the signal intensity after filtering calculated by the filtering unit 13 (S110, output step).
- the signal intensity after filtering of the target pixel is multiplied by a coefficient ⁇ by adding the weighted signal intensity difference between the target pixel and the surrounding pixels of the target pixel.
- a value obtained by adding the signal intensity before filtering of the target pixel to the combined value is calculated. Multiplying the coefficient ⁇ can make the output SNR a stable value regardless of the image signal, which is a finding found by the present inventors through extensive research.
- an image filtering device 10 that can perform stable filtering independent of an input image signal. Moreover, according to this image filtering apparatus 10, the smoothing method excellent in noise reduction can be provided irrespective of the kind of device.
- the weighting is increased as the distance between the pixel position of the surrounding pixel and the pixel position of the target pixel is closer, By increasing the weight as the difference between the signal strength of the pixel of interest and the signal strength of the pixel of interest is smaller, it is possible to retain original signal information such as edges and textures while removing noise.
- the filtering unit 13 reliably calculates the signal strength after filtering by the equation defined by the above equation (1), based on the bilateral filter.
- One embodiment of the invention can be implemented.
- the filtering unit 13 calculates the signal strength after filtering according to the equation defined by the above equation (2), thereby ensuring the reliability based on the non-local mean filter.
- An embodiment of the present invention can be implemented.
- the image filtering device 10 further includes a noise variance upper limit calculation unit 14, a calculation pixel determination unit 15, and a noise variance estimation unit 16, and the filtering unit 13 uses ⁇ r 2 as noise.
- the noise variance value ⁇ 2 total (c) for each pixel is reflected in the weighting function of the range filter in the calculation of the signal strength by filtering. It is possible to prevent the output SNR value from becoming smaller.
- noise reduction characteristic with respect to the input SNR for each ⁇ r
- an arbitrary noise characteristic noise standard deviation is ⁇ i .noise. (N) was superimposed on the standard deviation [sigma] i ), and n evaluation images were created.
- the domain filter dispersion value ⁇ d and the local region ⁇ are fixed values
- the range filter dispersion value ⁇ r is variable (arbitrary value)
- filtering is performed.
- noise reduction characteristics are calculated for each pixel.
- FIGS. 20A to 20C are repeated until the noise reduction characteristics are sufficiently analyzed.
- Non-Patent Document 2 describes a method for measuring ⁇ i and ⁇ t .
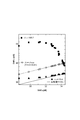
- FIG. 12 a diagram showing noise reduction characteristics with respect to the input SNR for each ⁇ r .
- the local region ⁇ centered on the pixel of interest is fixed to a size of 21 ⁇ 21 pixels and the domain filter variance value ⁇ d 2 is fixed as a filter parameter used in the image filtering device 10.
- the value was 9, and the range filter dispersion value ⁇ r 2 was variable.
- the filter used is based on a bilateral filter or the like.
- the target noise (the noise included in the image signal to be filtered by the filtering device 10 and measured or calculated) is the noise according to the Gaussian distribution.
- a CG chart was used as an input image signal. Note that the parameters of the filter are not limited to those described above, and can be changed as necessary.
- FIG. 12 is a diagram showing noise reduction characteristics with respect to the input SNR for each ⁇ r .
- the horizontal axis of the graph is the SNR of the input image signal
- the vertical axis is the SNR of the output image signal.
- a line indicated by a solid line in the graph represents the SNR of the output when the filtering process is not performed.
- the SNR of the output is reduced (the noise reduction amount is attenuated) when the input SNR is increased, and appropriate filtering can be performed. I understand that there is no.
- the noise variance value ⁇ 2 total is used as ⁇ r 2 , the SNR gain is constant with respect to the input SNR, and the output SNR can be stably obtained. That is, by using the noise variance value ⁇ 2 total of the input image signal as the range filter variance value ⁇ r 2 , it is possible to perform a robust noise reduction that does not depend on the SNR (signal strength or noise characteristics) of the input image signal.
- the calculation pixel determining unit calculates the noise variance value of the pixel of interest when the surrounding pixels satisfy the expression defined by the above expression (3). By determining that the pixel can be used, it is possible to calculate the variance value of the noise of the pixel of interest from one image.
- the variance value of noise can be calculated by a method other than the method according to the present embodiment, and other methods include SNE (shot noise variance value estimation) and AFE (function approximation).
- SNE shot noise variance value estimation
- AFE function approximation
- the variance value of the total noise can be estimated with high accuracy by employing the method according to the present embodiment.
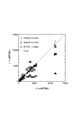
- the horizontal axis represents the measurement value of the dispersion value sigma 2 total noise
- the vertical axis represents the estimate of the variance sigma 2 total noise.
- the noise variance estimation method is described in “H. Talbot, H. Phelipepeau, M. Akil, and S. Bara,“ Efficient Poisson denoising for photography, ”Image Processing (ICIP), 2009 Ece on E16, 16E. pp. 3881-3884, 2009. (hereinafter referred to as non-patent document 4).
- the image filtering apparatus 10 further includes a coefficient calculating unit 17 that calculates a coefficient ⁇ , and the coefficient calculating unit 17 inputs and inputs a value based on a noise variance value of the image signal before and after filtering.
- a coefficient calculating unit 17 that calculates a coefficient ⁇
- the coefficient calculating unit 17 inputs and inputs a value based on a noise variance value of the image signal before and after filtering.
- the coefficient calculation unit 17 can calculate the coefficient ⁇ more reliably by calculating the coefficient ⁇ using the equation defined by the above equation (4).
- the coefficient ⁇ may be a value set in advance by the user of the image filtering device 10.
- the coefficient ⁇ can be a desirable value obtained empirically, for example.
- the image filtering device 10 is mounted on the imaging device 1, but is not necessarily limited thereto, and the image filtering device 10 may not be mounted on the imaging device 1.
- the image filtering device 10 may be configured as a separate body and connected to the imaging device 1.
- the range filter dispersion value ⁇ r 2 of the image filtering device 10 is variable, it is not limited to this and may be a fixed value set in advance.
- the coefficient ⁇ is calculated by measuring the noise dispersion value before and after filtering using the noise dispersion value ⁇ 2 total as the range filter dispersion value ⁇ r 2 , but is not limited thereto.
- filtering may be performed using a filter that does not use the noise variance value ⁇ 2 total .
- a plurality of images in which noise is superimposed on an evaluation image based on a color chart are created, and the coefficient ⁇ may be obtained after measuring pixel noise variance values before and after filtering.
- the image filtering apparatus 10 even the noise according to the noise characteristics of the non-Gaussian distribution can be applied by changing the probability density function of the noise characteristics of interest weighting function w r, for example, medical imaging (magnetic resonance imaging, ultra It can also be applied to noise reduction such as sound wave images) and TOF images.
- medical imaging magnetic resonance imaging, ultra It can also be applied to noise reduction such as sound wave images
- TOF images can be applied by changing the probability density function of the noise characteristics of interest weighting function w r, for example, medical imaging (magnetic resonance imaging, ultra It can also be applied to noise reduction such as sound wave images) and TOF images.
- the image filtering device 10 can be used for noise reduction of a display image of a tablet PC equipped with a camera, a display, a CPU, etc., and can improve the texture of the image.
- the XYZ camera provided with the image filtering device 10 can cope with the prominence of random noise resulting from color conversion.
- the filter used in the image filtering device 10 can be applied to signal processing other than the image signal.
- the first embodiment compares the filtering effects of various filtering devices.
- NABF and CNABF perform filtering using the noise variance value ⁇ 2 total (c) as ⁇ r 2 , but the DBF and SNABF do not use the noise variance value ⁇ 2 total (c).
- each filtering device performs filtering processing on the image signals of the color chart, the flower photograph, and the pepper photograph.
- a nonpatent literature 1 As shown in FIG. 14, each filtering device performs filtering processing on the image signals of the color chart, the flower photograph, and the pepper photograph.
- a nonpatent literature 4 As the imaging device 1, an XYZ still image camera ("Y. “IEEE-IAS 2007 Annual Meeting, 33P5, New La, Louisiana, USA (2007. 9.23-27)” (hereinafter referred to as non-patent document 5) is used.
- FIG. 15 shows the result of filtering the image signal of each color card number (1 to 23) in the color chart.
- the color card number is an image signal with a higher signal strength as the number is larger.
- the calculation results of the dispersion values of the fixed pattern noise, the temporal noise, and the total noise of each color card number are as shown in FIG.
- the SNR of the output image signal for each color card number is as shown in FIG.
- the average SNR ( ⁇ SNR) of the output image signal for each color card number was 5.03 for NABF, 12.68 for CNABF, 6.17 for DBF, and 3.62 for SNABF, respectively.
- the average color difference (dE76 (1.30)) in each color card number was 0.70 for NABF, 0.26 for CNABF, 0.58 for DBF, and 0.82 for SNABF.
- an error of about 0.30 is expected as an error of the measuring instrument.
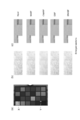
- FIGS. 16B and FIG. 16C images obtained by performing filtering processing on two places (range X and range Y) of the color chart shown in FIG. 16A are shown in FIGS. 16B (range X image) and FIG. 16C (range Y). Image).
- the uppermost image is an image before filtering.
- FIG. 16B shows that the image filtered by CNABF is the smoothest among the images of the respective filtering devices. Further, from FIG. 16C, it can be seen that CNABF can be most emphasized at the edge portion where the brightness of the image changes sharply.
- the average SNR ( ⁇ SNR) of the output image signal obtained by filtering each of the flower photographs with each filtering device is 0.99 for NABF, 1.70 for CNABF, 1.09 for DBF, and 0 for SNABF, respectively. .74.
- the average color difference (dE76 (1.61)) of the output image signal obtained by performing filtering processing on the flower photograph with each filtering device is 1.43 for NABF, 1.30 for CNABF, and 1.31 for DBF, respectively. SNABF was 1.46.
- the average SNR ( ⁇ SNR) of the output image signal obtained by performing filtering processing on the green pepper photograph by each filtering device is 1.84 for NABF, 3.60 for CNABF, 2.13 for DBF, and 1 for SNABF, respectively. .07.
- the average color difference (dE76 (1.33)) of the output image signal obtained by performing filtering processing on the green pepper photo with each filtering device is 1.03 for NABF, 0.78 for CNABF, and 0.85 for DBF, respectively. SNABF was 1.10.
- the local area centered on the target pixel is fixed to a size of 21 ⁇ 21 pixels, and the domain filter variance value ⁇ d 2 is set to a fixed value 9.
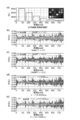
- FIG. 18 shows the noise-to-signal ratio of each filtering device in the second embodiment.
- FIG. 18A shows the true signal value
- FIGS. 18B to 18E show the unprocessed noise image signal and the noise-to-signal ratio after each filtering application. From the results of NABF and CNABF shown in FIGS. 18B and 18C, it was found that NABF and CNABF achieve noise reduction while preserving edges. Further, it was confirmed from the comparison between FIGS. 18B and 18C that the noise reduction effect is increased by using the coefficient ⁇ . On the other hand, in FIGS. 18D and 18E, noise is excessively reduced and flattened in a portion where the signal strength is weak. It was also confirmed that the residual noise component increased as the signal intensity increased.
- the noise probability density function is represented by a normal distribution
- the weighting function of the range filter is equal to the noise probability density function, so the signal intensity difference between the pixel of interest and the pixels in the local area adapts to the noise variance value for each pixel. Therefore, NABF and CNABF can perform noise reduction robust to SNR fluctuations of the input image signal.
- the image filtering program 100 is inserted into a computer and accessed, or stored in a program storage area 51 formed on a recording medium 50 provided in the computer.
- the image filtering program 100 includes a main module 101 that centrally controls image filtering processing, an input module 102, an output module 103, a filtering module 104, a noise variance upper limit calculation module 105, and a calculation pixel determination module 106.
- the functions realized by executing the noise variance estimation module 107 and the coefficient calculation module 108 are the input unit 11, the output unit 12, the filtering unit 13, and the noise variance upper limit value of the image filtering device 10 described above.
- the functions of the calculation unit 14, the calculation pixel determination unit 15, the noise variance estimation unit 16, and the coefficient calculation unit 17 are the same.
- a part or all of the image filtering program 100 may be transmitted via a transmission medium such as a communication line and received and recorded (including installation) by another device.
- Each module of the image filtering program 100 may be installed in any one of a plurality of computers instead of one computer. In that case, processing for determining various parameters of the series of image filtering programs 100 described above is performed by a computer system of the plurality of computers.
Landscapes
- Physics & Mathematics (AREA)
- General Physics & Mathematics (AREA)
- Engineering & Computer Science (AREA)
- Theoretical Computer Science (AREA)
- Image Processing (AREA)
- Facsimile Image Signal Circuits (AREA)
Description
本発明は、画像フィルタリング装置、画像フィルタリング方法及び画像フィルタリングプログラムに関する。
高画質な画像の撮像(撮影)を実現する上で、エッジやテクスチャ等の本来の信号情報の保存性に優れたノイズ低減手法の重要性が高まっている。このような本来の信号情報の保存性に優れたノイズ低減手法として、バイラテラルフィルタ(Bilateral filter)を用いたノイズ低減手法が知られている。(例えば非特許文献1参照)。
C.Tomasi and R.Manduchi, "Bilateral filtering for gray and color images,"in Proceedings of the IEEE International Conference on ComputerVision,Bombay,India, pp.839―846,1998.
バイラテラルフィルタは、平滑化を行う際に、フィルタリングを行う画素と座標位置が近く信号強度差が少ない画素ほど、フィルタリングにおける重みづけを重くし、フィルタリングの効果を大きくするものである。信号強度差が大きい画素についてはフィルタリングの効果を小さくするため、画像のエッジを保持することができる。
しかしながら、従来のバイラテラルフィルタにおいては、入力する画像信号によっては十分にフィルタリングが行えず、ノイズ成分が残留してしまうという問題があった。信号に対するノイズの量を対数で表したものにSNR(SN比。数値が大きいほどノイズが少なく高品質の信号であることを示す)があるが、入力する画像信号によっては、出力のSNRが小さくなり、ノイズの除去が十分に行えていなかった。また、十分にフィルタリングが行えないことを懸念して過剰にノイズ低減を行った場合には、元の画像信号情報が消失するという問題があった。すなわち、入力する画像信号に依存しない安定的なフィルタリングを行うことができていなかった。
本発明は上記実情に鑑みてなされたものであり、入力する画像信号に依存しない安定的なフィルタリングを行うことができる画像フィルタリング装置、画像フィルタリング方法及び画像フィルタリングプログラムを提供することを目的とする。
本発明の一実施形態に係る画像フィルタリング装置は、画像信号に対してフィルタリングを行う画像フィルタリング装置であって、画像信号を入力する入力手段と、入力手段により入力された画像信号を構成する画素のうち着目画素の信号強度と該着目画素の周囲の画素の信号強度との差に重みづけを行い、重みづけを行った着目画素の信号強度と該着目画素の周囲の画素の信号強度との差を足しあわせた値に設定された係数γを掛け合わせた値と該着目画素の信号強度とを足し合わすことで、該着目画素のフィルタリング後の信号強度を算出するフィルタリング手段と、フィルタリング手段によって算出されたフィルタリング後の信号強度の画素で構成される画像信号を出力する出力手段と、を備える。
この画像フィルタリング装置では、着目画素のフィルタリング後の信号強度として、着目画素と該着目画素の周囲の画素との信号強度の差に重みづけを行ったものを足し合わせた値に係数γを掛け合わせた値に、着目画素のフィルタリング前の信号強度を足し合わせた値を算出している。係数γを掛け合わせることにより、画像信号にかかわらず、出力のSNRを安定した値とすることができることは、本発明者が鋭意研究を重ねる中で見出した知見である。以上より、本発明の一実施形態によれば、入力する画像信号に依存しない安定的なフィルタリングを行うことができる画像フィルタリング装置を提供することができる。
また、本発明の一実施形態に係る画像フィルタリング装置において、フィルタリング手段は、重みづけを行う際は、周囲の画素の画素位置と着目画素の画素位置との距離が近いほど重みづけを重くし、周囲の画素の信号強度と着目画素の信号強度との差が小さい程重みづけを重くしてもよい。周囲の画素について、着目画素からの距離の差及び着目画素の信号強度の差に基づいた重みづけを行うことで、ノイズを除去しながら、エッジやテクスチャ等の本来の信号情報を保持することができる。
また、本発明の一実施形態に係る画像フィルタリング装置において、フィルタリング手段は、

と定義される式によりフィルタリング後の信号強度を算出し、
So´()はフィルタリング後の信号強度、
Si´()はフィルタリング前の信号強度、
cは着目画素の画素位置、
pは着目画素の前記周囲の画素の画素位置、
Ωは前記周囲の画素が位置する領域(着目画素を中心としたH×W画素の局所領域)、
γは前記係数、
σd 2は着目画素からの距離に応じた重みづけを行う際のパラメータ、
σr 2は着目画素の信号強度との差に応じた重みづけを行う際のパラメータ、
であってもよい。当該定義式を用いることによって、バイラテラルフィルタをもとにして確実に本発明の一実施形態を実施することができる。
So´()はフィルタリング後の信号強度、
Si´()はフィルタリング前の信号強度、
cは着目画素の画素位置、
pは着目画素の前記周囲の画素の画素位置、
Ωは前記周囲の画素が位置する領域(着目画素を中心としたH×W画素の局所領域)、
γは前記係数、
σd 2は着目画素からの距離に応じた重みづけを行う際のパラメータ、
σr 2は着目画素の信号強度との差に応じた重みづけを行う際のパラメータ、
であってもよい。当該定義式を用いることによって、バイラテラルフィルタをもとにして確実に本発明の一実施形態を実施することができる。
また、本発明の一実施形態に係る画像フィルタリング装置において、フィルタリング手段は、

と定義される式によりフィルタリング後の信号強度を算出し、
So´()はフィルタリング後の信号強度、
Si´()はフィルタリング前の信号強度、
cは着目画素の画素位置、
pは着目画素の前記周囲の画素の画素位置、
Ωは前記周囲の画素が位置する領域(着目画素を中心としたH×W画素の局所領域)、
γは前記係数、
σd 2は着目画素からの距離に応じた重みづけを行う際のパラメータ(ドメインフィルタ分散値)、
σr 2は着目画素の信号強度との差に応じた重みづけを行う際のパラメータ(レンジフィルタ分散値)、
δV(Si´(p))は画像信号の領域を分割した複数領域のうちpを含む領域の信号強度と着目画素の信号強度との差、
であってもよい。当該定義式を用いることによって、ノンローカルミーンフィルタをもとにして確実に本発明の一実施形態を実施することができる。
So´()はフィルタリング後の信号強度、
Si´()はフィルタリング前の信号強度、
cは着目画素の画素位置、
pは着目画素の前記周囲の画素の画素位置、
Ωは前記周囲の画素が位置する領域(着目画素を中心としたH×W画素の局所領域)、
γは前記係数、
σd 2は着目画素からの距離に応じた重みづけを行う際のパラメータ(ドメインフィルタ分散値)、
σr 2は着目画素の信号強度との差に応じた重みづけを行う際のパラメータ(レンジフィルタ分散値)、
δV(Si´(p))は画像信号の領域を分割した複数領域のうちpを含む領域の信号強度と着目画素の信号強度との差、
であってもよい。当該定義式を用いることによって、ノンローカルミーンフィルタをもとにして確実に本発明の一実施形態を実施することができる。
また、本発明の一実施形態に係る画像フィルタリング装置において、同一の対象を撮像した複数の参照用画像信号を入力して、該参照用画像信号を構成する画素に含まれるノイズの、該画素の信号強度に応じた分散値を複数算出し、該ノイズの分散値から、画像信号の画素に含まれる信号強度に応じたノイズの上限値であるノイズ分散上限値を算出するノイズ分散上限値算出手段と、ノイズ分散上限値算出手段が算出したノイズ分散上限値を用いて、周囲の画素が着目画素のノイズの分散値を算出するために用いることができる画素か否かを判定する算出画素決定手段と、算出画素決定手段により着目画素のノイズの分散値を算出するために用いることができる画素であると判定された周囲の画素を用いて着目画素のノイズ分散値σ2
total(c)を推定するノイズ分散推定手段と、をさらに備え、フィルタリング手段は、σr
2としてノイズ分散値σ2
total(c)を用いてフィルタリング後の信号強度を算出してもよい。フィルタリング後の信号強度の算出において、画素毎のノイズ分散値σ2
total(c)を用いることで、より出力のSNRの値が小さくなることを防止できる。また、一枚の画像から、着目画素のノイズの分散値を算出することができる。
また、本発明の一実施形態に係る画像フィルタリング装置において、算出画素決定手段は、

と定義される式を満たす場合に、周囲の画素が着目画素のノイズの分散値を算出するために用いることができる画素であると判定し、
σ2 max(Si´(c))は着目画素のノイズ分散上限値、
Kは予め設定された判定係数、
であってもよい。条件式を満たす画素で構成される信号集合の分散値を着目画素のノイズの分散値と見なすことで、より確実にノイズの分散値を算出することができる。
σ2 max(Si´(c))は着目画素のノイズ分散上限値、
Kは予め設定された判定係数、
であってもよい。条件式を満たす画素で構成される信号集合の分散値を着目画素のノイズの分散値と見なすことで、より確実にノイズの分散値を算出することができる。
また、本発明の一実施形態に係る画像フィルタリング装置において、係数γを算出する係数算出手段をさらに備え、係数算出手段は、フィルタリング前後の画像信号のノイズの分散値に基づく値を入力して、入力した値から係数γを算出してもよい。フィルタリング前後の画像信号のノイズの分散値を用いることによって、簡易に係数γの適切な値を求めることができる。
また、本発明の一実施形態に係る画像フィルタリング装置において、係数算出手段は、

と定義される式により係数γを算出し、
σiはフィルタリング前の画像信号のノイズの分散値に基づくノイズ標準偏差、
σtはフィルタリング後の画像信号のノイズの分散値に基づく残留ノイズ標準偏差、
であってもよい。当該定義式を用いることで、より確実に係数γを算出することができる。
σiはフィルタリング前の画像信号のノイズの分散値に基づくノイズ標準偏差、
σtはフィルタリング後の画像信号のノイズの分散値に基づく残留ノイズ標準偏差、
であってもよい。当該定義式を用いることで、より確実に係数γを算出することができる。
また、本発明の一実施形態に係る画像フィルタリング方法は、画像信号に対してフィルタリングを行う画像フィルタリング方法であって、画像信号を入力する入力ステップと、入力ステップにおいて入力された画像信号を構成する画素のうち着目画素の信号強度と該着目画素の周囲の画素の信号強度との差に重みづけを行い、重みづけを行った着目画素の信号強度と該着目画素の周囲の画素の信号強度との差を足しあわせた値に設定された係数γを掛け合わせた値と該着目画素の信号強度とを足し合わすことで、該着目画素のフィルタリング後の信号強度を算出するフィルタリングステップと、フィルタリングステップにおいて算出されたフィルタリング後の信号強度の画素で構成される画像信号を出力する出力ステップと、を含む。
また、本発明の一実施形態に係る画像フィルタリングプログラムは、画像信号に対してフィルタリングを行う画像フィルタリングプログラムであって、コンピュータを、画像信号を入力する入力手段と、入力手段により入力された画像信号を構成する画素のうち着目画素の信号強度と該着目画素の周囲の画素の信号強度との差に重みづけを行い、重みづけを行った着目画素の信号強度と該着目画素の周囲の画素の信号強度との差を足しあわせた値に設定された係数γを掛け合わせた値と該着目画素の信号強度とを足し合わすことで、該着目画素のフィルタリング後の信号強度を算出するフィルタリング手段と、フィルタリング手段によって算出されたフィルタリング後の信号強度の画素で構成される画像信号を出力する出力手段、として動作させる。
当該画像フィルタリング方法及び画像フィルタリングプログラムは、上述の画像フィルタリング装置と同様な効果を奏することができる。
本発明の一実施形態によれば、画像信号の信号強度の変化に対応した適切なフィルタリングを行うことができる画像フィルタリング装置、画像フィルタリング方法及び画像フィルタリングプログラムを提供することができる。
以下、図面と共に本発明の一実施形態に係る画像フィルタリング装置、画像フィルタリング方法及び画像フィルタリングプログラムについて詳細に説明する。なお、図面の説明においては同一要素には同一符号を付し、重複する説明を省略する。
まず、図1を参照して、撮像装置におけるノイズ重畳過程について説明する。撮像装置1で被写体を撮像すると、入射光がレンズ2、カラーフィルタ3を通過し、イメージセンサーによって光電変換され、アナログ信号となり、A/D変換部4によって画像信号がデジタル化される。該デジタル化される画像信号は、デバイス非依存の色を表す色変換XYZ表色系の信号値としてもよい。XYZ表色系の信号値は、RGB表色系の階調値(R,G,B)に変換行列Mを掛け合わせることにより算出できる。被写体の撮像から画像信号をデジタル化する過程においては、図1に示したように、画像信号に固定パターンノイズ(Fixed Pattern Noise)と経時ノイズ(Temporal Noise)が重畳する。固定パターンノイズは光学系やセンサーを含めた、撮像装置1の分光感度のむらを原因とするノイズである。経時ノイズには暗電流ノイズ、ショットノイズ、量子化ノイズ等がある。暗電流ノイズは抵抗体内の電子の不規則な熱振動によって生じる熱雑音を原因とするノイズである。また、ショットノイズは、フォントや電子の量子的な揺らぎを原因とするノイズである。また、量子化ノイズは、A/D変換部4による画像信号のデジタル化の際に発生するノイズである。固定パターンノイズと経時ノイズを足し合わせたノイズを総合ノイズ(Total Noise)とする。画像信号に対する総合ノイズの重畳は不可避であるため、これらのノイズを低減する手法が求められている。
図2は、固定パターンノイズ及び経時ノイズの重畳イメージである。固定パターンノイズに関わる軸は、下軸(X軸)及び左軸(Y軸)である。下軸は画像信号の信号強度S1´(画素値、輝度値)を、左軸は画像信号の頻度を総画素数で割った値(PDF(S1´)を、それぞれ示している。経時ノイズに関わる軸は、上軸(U軸)及び右軸(R軸)である。上軸は、本来の画像信号強度からの差ΔSi´(後述する平均値画像を用いた測定においては、平均値画像と平均値画像作成に使用したそれぞれの画像の信号強度の差分)を、右軸は画像信号の頻度を総画素数で割った値(PDF(ΔS1´)を、それぞれ示している。図面中に表したように、点線は固定パターンノイズの影響を受けた信号強度の実測値を、実線は経時パターンノイズの影響を受けた信号強度の実測値を表している。
図2に示すように、固定パターンノイズの影響を受けた信号強度の実測値及び経時パターンノイズの影響を受けた信号強度の実測値の双方とも、本来の信号情報を境として、前後同じ程度にばらついた値が画像信号の信号強度として観測されている。これは、固定パターンノイズ及び、経時ノイズである暗電流ノイズ、ショットノイズ、量子化ノイズのいずれも、確率密度関数は正規分布又は正規分布に近似可能な関数で表され、その分散値が信号強度に依存するためである。このことから、画像信号に対する固定パターンノイズ及び経時ノイズの統計的性質はガウス分布(Gaussian)に従う(ガウス分布に近似可能である)。すなわち、重畳する各ノイズはガウス分布に従っていることが分かる。
次に、本実施形態に係る画像フィルタリング装置に用いるバイラテラルフィルタについて説明する。図3はバイラテラルフィルタの特性を示す図である。
バイラテラルフィルタは、フィルタリング前の画像信号のエッジを保ちながら、平滑化処理を行うものであり、ドメインフィルタとレンジフィルタの2種類の加重平均フィルタで構成されている。バイラテラルフィルタは2種類の加重平均フィルタの加重関数wd(ドメインフィルタの加重関数)、wr(レンジフィルタの加重関数)で重みを設定する。ドメインフィルタの加重関数wdは、着目画素と周囲の画素との距離(座標軸上の類似度)に関する重みであり、距離が近いほど重みを大きく設定する。これは、近距離の画素は相関が高いとの仮定に基づくものである。すなわち、例え信号強度が類似している周囲の画素であっても、画素間の距離が離れている場合には異なる信号源から得られた信号と仮定する。また、レンジフィルタの加重関数wrは、着目画素と周囲の画素との信号強度の差(信号強度軸上の類似度)に関する重みであり、信号強度の差が小さいほど重みを大きく設定する。このことにより、エッジ境界部分の画素のように、周囲の画素との間で信号強度の差の絶対値が大きい画素は、平滑化処理にほとんど利用されず、画像のエッジを鈍らせないという効果が得られる。
上述したバイラテラルフィルタの特性は図3(a)に示される。グラフの横軸は着目画素の周囲の画素の画素位置pを、グラフの縦軸は信号強度Si´を示している。また、図3(a)中では、ドメインフィルタの加重関数wdのグラフは画素位置pが「8」である場合に重みを最も重くしており、レンジフィルタの加重関数wrのグラフは信号強度が「150」である場合に重みを最も重くしている。これは、着目画素の画素位置が「8」であり、信号強度が「150」であることによるものである。
図3(a)に示したバイラテラルフィルタは、下記式に示される。
So´()はフィルタリング後の信号強度、Si´()はフィルタリング前の信号強度、cは着目画素の画素位置、pは着目画素の前記周囲の画素の画素位置、Ωは前記周囲の画素が位置する領域(着目画素を中心としたH×W画素の局所領域(H、Wは予め設定された自然数))、σd
2は着目画素からの距離に応じた重みづけを行う際のパラメータ(ドメインフィルタ分散値)、σr
2は着目画素の信号強度との差に応じた重みづけを行う際のパラメータ(レンジフィルタ分散値)をそれぞれ表している。
バイラテラルフィルタは、周囲の画素が位置する領域(着目画素を中心としたH×W画素の局所領域)Ω、着目画素からの距離に応じた重みづけを行う際のパラメータ(ドメインフィルタ分散値)σd
2、着目画素の信号強度の差に応じた重みづけを行う際のパラメータσr
2がノイズ低減を左右するパラメータである。過剰なノイズ低減や不十分なノイズ低減によるノイズ成分の残留は、画像信号へのノイズ重畳量に対してパラメータ設定が不適切な場合に起こる。
図3(a)では、横軸として周囲の画素の画素位置pを、縦軸として信号強度Si´を用いたが、横軸に着目画素と周囲の画素の画素位置の差p-cを、縦軸として着目画素と周囲の画素の信号強度の差δSi´を用いた場合には、バイラテラルフィルタの特性は図3(b)に示されるようになる。着目画素と同一の画素位置(p-c=0)であり、着目画素と同一の信号強度(δSi´=0)である場合に、ドメインフィルタの加重関数wd及びレンジフィルタの加重関数wrの重みが最も重くなっている。
図3(b)に示したバイラテラルフィルタは下記式に示される。

なお、バイラテラルフィルタの特性については、非特許文献1に記載がある。
次に、本発明の実施形態に係る画像フィルタリング装置10の機能について説明する。図4は、本発明の実施形態に係る画像フィルタリング装置10の機能ブロックを示す図である。例えば、画像フィルタリング装置10は、図1に示したA/D変換部4によりデジタル化された画像信号に対して、フィルタリングを行うものである。図4に示すように、本実施形態に係る画像フィルタリング装置10は、入力部11と、出力部12と、フィルタリング部13と、ノイズ分散上限値算出部14と、算出画素決定部15と、ノイズ分散推定部16と、係数算出部17とを備えて構成される。画像フィルタリング装置10のフィルタとしては、例えばバイラテラルフィルタやノンローカルミーンフィルタ(Non-local Means Filter)をベースとしたフィルタを用いることができる。画像フィルタリング装置10は、例えばCPU、メモリ等のハードウェアを備えるコンピュータにより実現される。画像フィルタリング装置10は、撮像装置1に搭載されている。
また、入力画像信号のSNRは、20log10(Si・bar´/σi)で、出力画像信号のSNRは、20log10(So・bar´/σt)で、それぞれ表すことができる。ここで、Si・bar´はフィルタリング前の信号強度の平均値、So・bar´はフィルタリング後の信号強度の平均値、σiはフィルタリング前の(入力信号の)画像信号のノイズの分散値に基づくノイズ標準偏差、σtはフィルタリング後の画像信号のノイズの分散値に基づく残留ノイズ標準偏差、をそれぞれ表している。入力画像信号のSNR及び出力画像信号のSNRは、画像信号毎や画素毎等で求めることができる。Si・bar´及びSo・bar´は、画像信号毎に算出する場合には画像信号全体の画素の信号強度を平均したものとなり、画素毎に算出する場合には画素毎の信号強度となり、カラーチャートの各カラーカードナンバー(画像中の同一の色の範囲)毎に算出する場合には各カラーカードナンバー毎の信号強度を平均したものとなる。σi及びσtは、画像信号毎や画素毎等で求めることができる。σi及びσtを画像信号毎で算出する場合には、例えば、後述する、フィルタリング前後における画像信号に含まれる各着目画素毎のノイズの分散値であるノイズ分散値σ2
totalの平方根であるノイズ標準偏差σtotalを平均したものがσi及びσtとなる。σi及びσtを画素毎で算出する場合には、例えば、後述する、フィルタリング前後における画像信号に含まれる各着目画素毎のノイズ標準偏差σtotalが、各画素のσi及びσtとなる。σi及びσtをカラーチャートの各カラーカードナンバー毎で算出する場合には、例えば、後述する、フィルタリング前後における各カラーカードナンバー毎で画像信号に含まれる各着目画素毎のノイズ標準偏差σtotalを平均したものがσi及びσtとなる。なお、ノイズ分散値σ2
total及びノイズ標準偏差σtotalは、後述するノイズ分散上限値算出部14によって複数毎の画像から算出でき、また、後述するノイズ分散推定部16によって一枚の画像から算出することができる。
入力部11は、A/D変換部4によりデジタル化された画像信号を入力する入力手段である。入力部11が入力する画像信号は、フィルタリング前の信号強度の画素で構成されている。入力部11が入力した画像信号は、フィルタリング部13に入力される。
出力部12は、フィルタリング部13によって算出されたフィルタリング後の信号強度の画素で構成される画像信号を出力する出力手段である。
フィルタリング部13は、入力部11により入力された画像信号に対して、画像信号中のノイズ除去及びエッジの強調などを行うための演算を施し(フィルタリングを行い)、フィルタリング後の信号強度を算出するフィルタリング手段である。フィルタリング部13によりフィルタリングが行われた画像信号は出力部12に入力される。
フィルタリング部13は、入力部11により入力された画像信号を構成する画素のうち着目画素の信号強度と該着目画素の周囲の画素の信号強度との差に重みづけを行い、重みづけを行った着目画素の信号強度と該着目画素の周囲の画素の信号強度との差を足しあわせた値に設定された係数γを掛け合わせた値と該着目画素の信号強度とを足し合わすことで、該着目画素のフィルタリング後の信号強度を算出するフィルタリング手段である。着目画素とは入力された画像信号に含まれる画素であり、フィルタリング後の信号強度を算出する画素である。周囲の画素とは、着目画素の周囲に位置する画素であり、着目画素の信号強度を算出するために用いる画素である。フィルタリング部13は、入力された画像信号に含まれる全画素を順次着目画素とし、フィルタリング後の信号強度を算出することで、入力された画像信号のフィルタリング後の信号強度を算出する。
係数γは重みづけを行った周囲の画素を足し合わせた値に掛け合わせる値であり、予め所定の値を設定してもよいし、後述する係数算出部17により算出してもよい。係数γを掛け合わせることによりフィルタリング後の画像信号のSN比を安定した値とすることができることは、本発明者が鋭意研究を重ねる中で見出した知見である。
フィルタリング部13は、上述した重みづけを行う際は、周囲の画素の画素位置と着目画素の画素位置との距離が近いほど重みづけを重くする。また、フィルタリング部13は、上述した重みづけを行う際は、周囲の画素の信号強度と着目画素の信号強度との差が小さい程重みづけを重くする。
フィルタリング部13は、バイラテラルフィルタを用いて上述したフィルタリングを行う場合には、下記で定義される式によりフィルタリング後の信号強度を算出することができる。
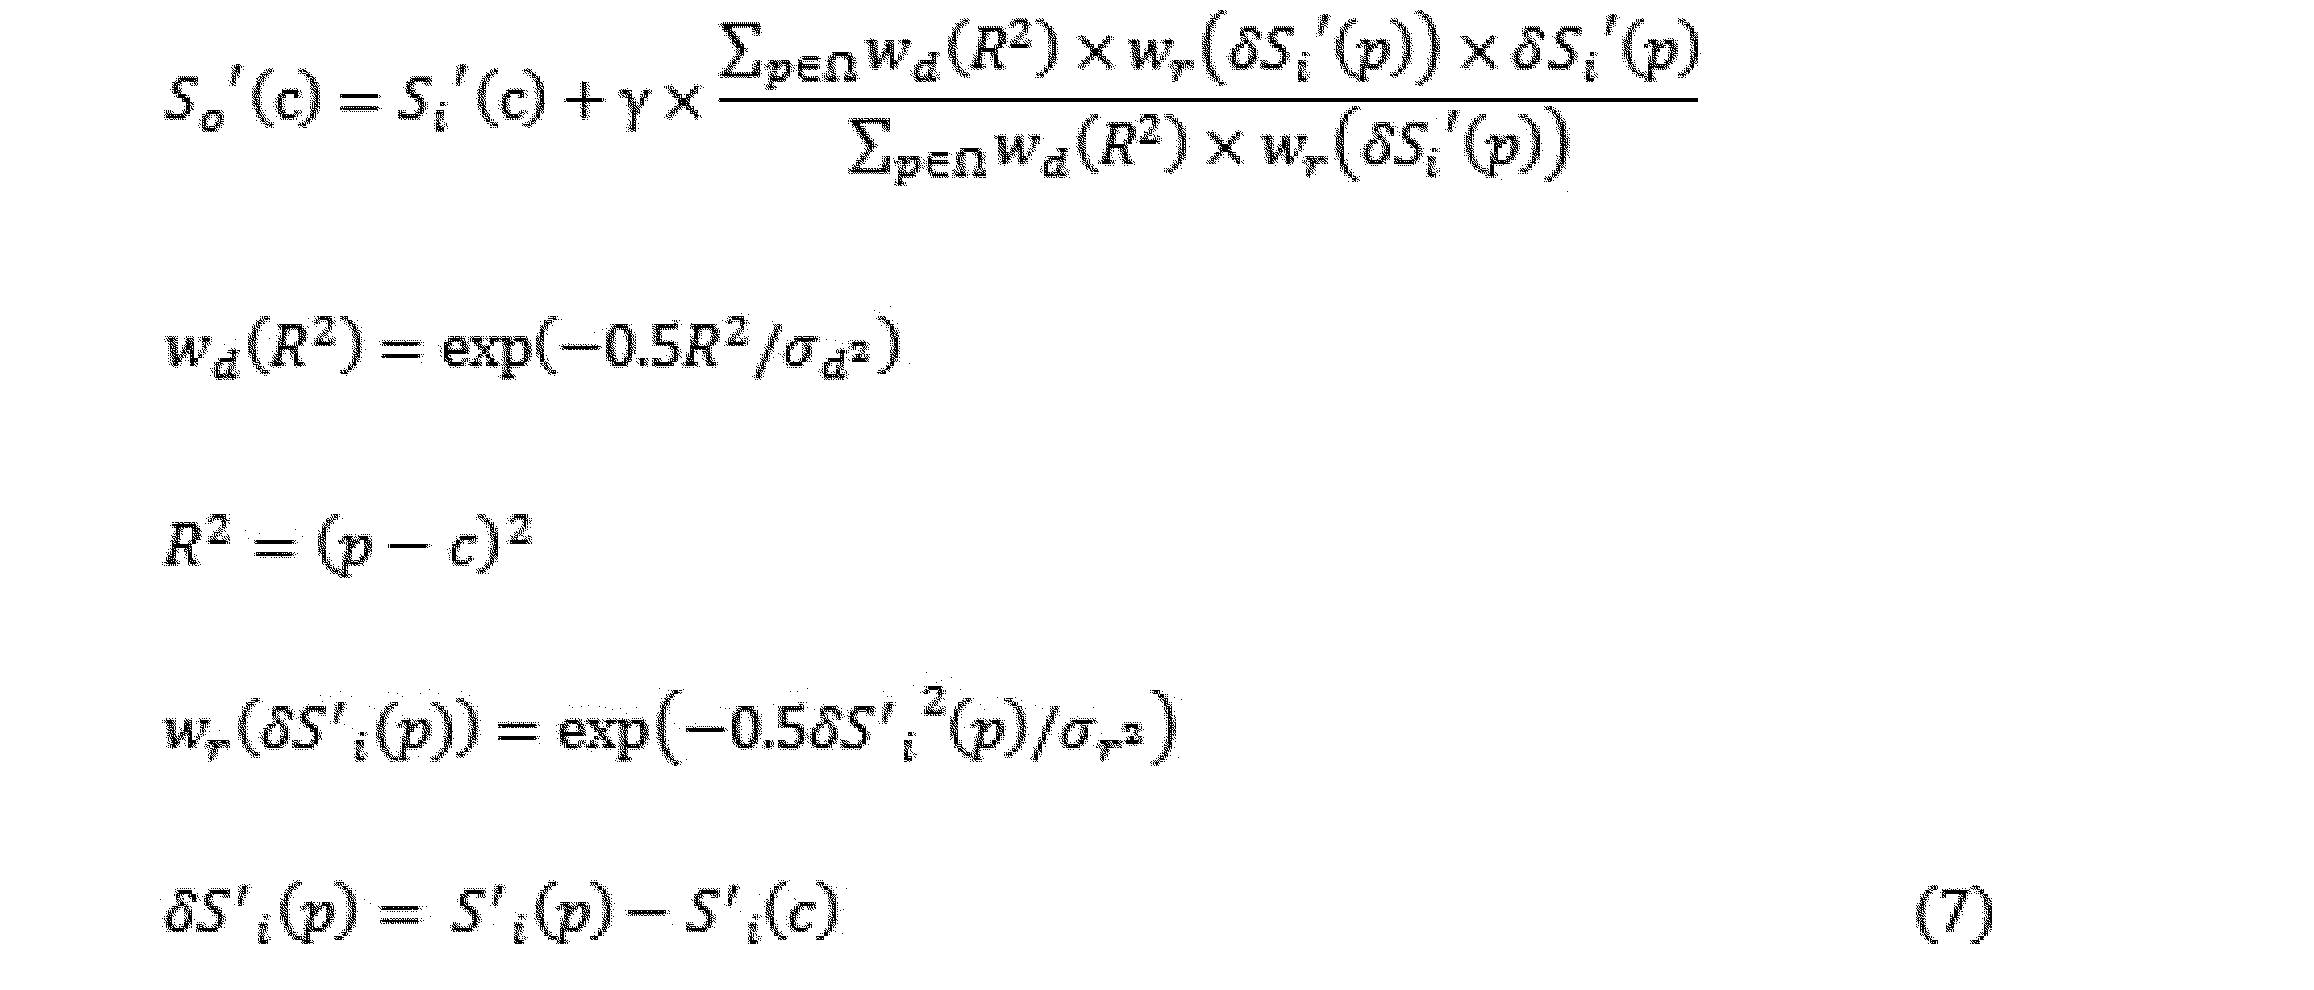
上記式(6)で示した一般的なバイラテラルフィルタの式との相違点は、右辺のフィルタリング前の信号強度Si´()を除く部分に係数γを掛け合わせている点である。
フィルタリング部13は、ノンローカルミーンフィルタを用いて上述したフィルタリングを行う場合には、下記で定義される式によりフィルタリング後の信号強度を算出することができる。
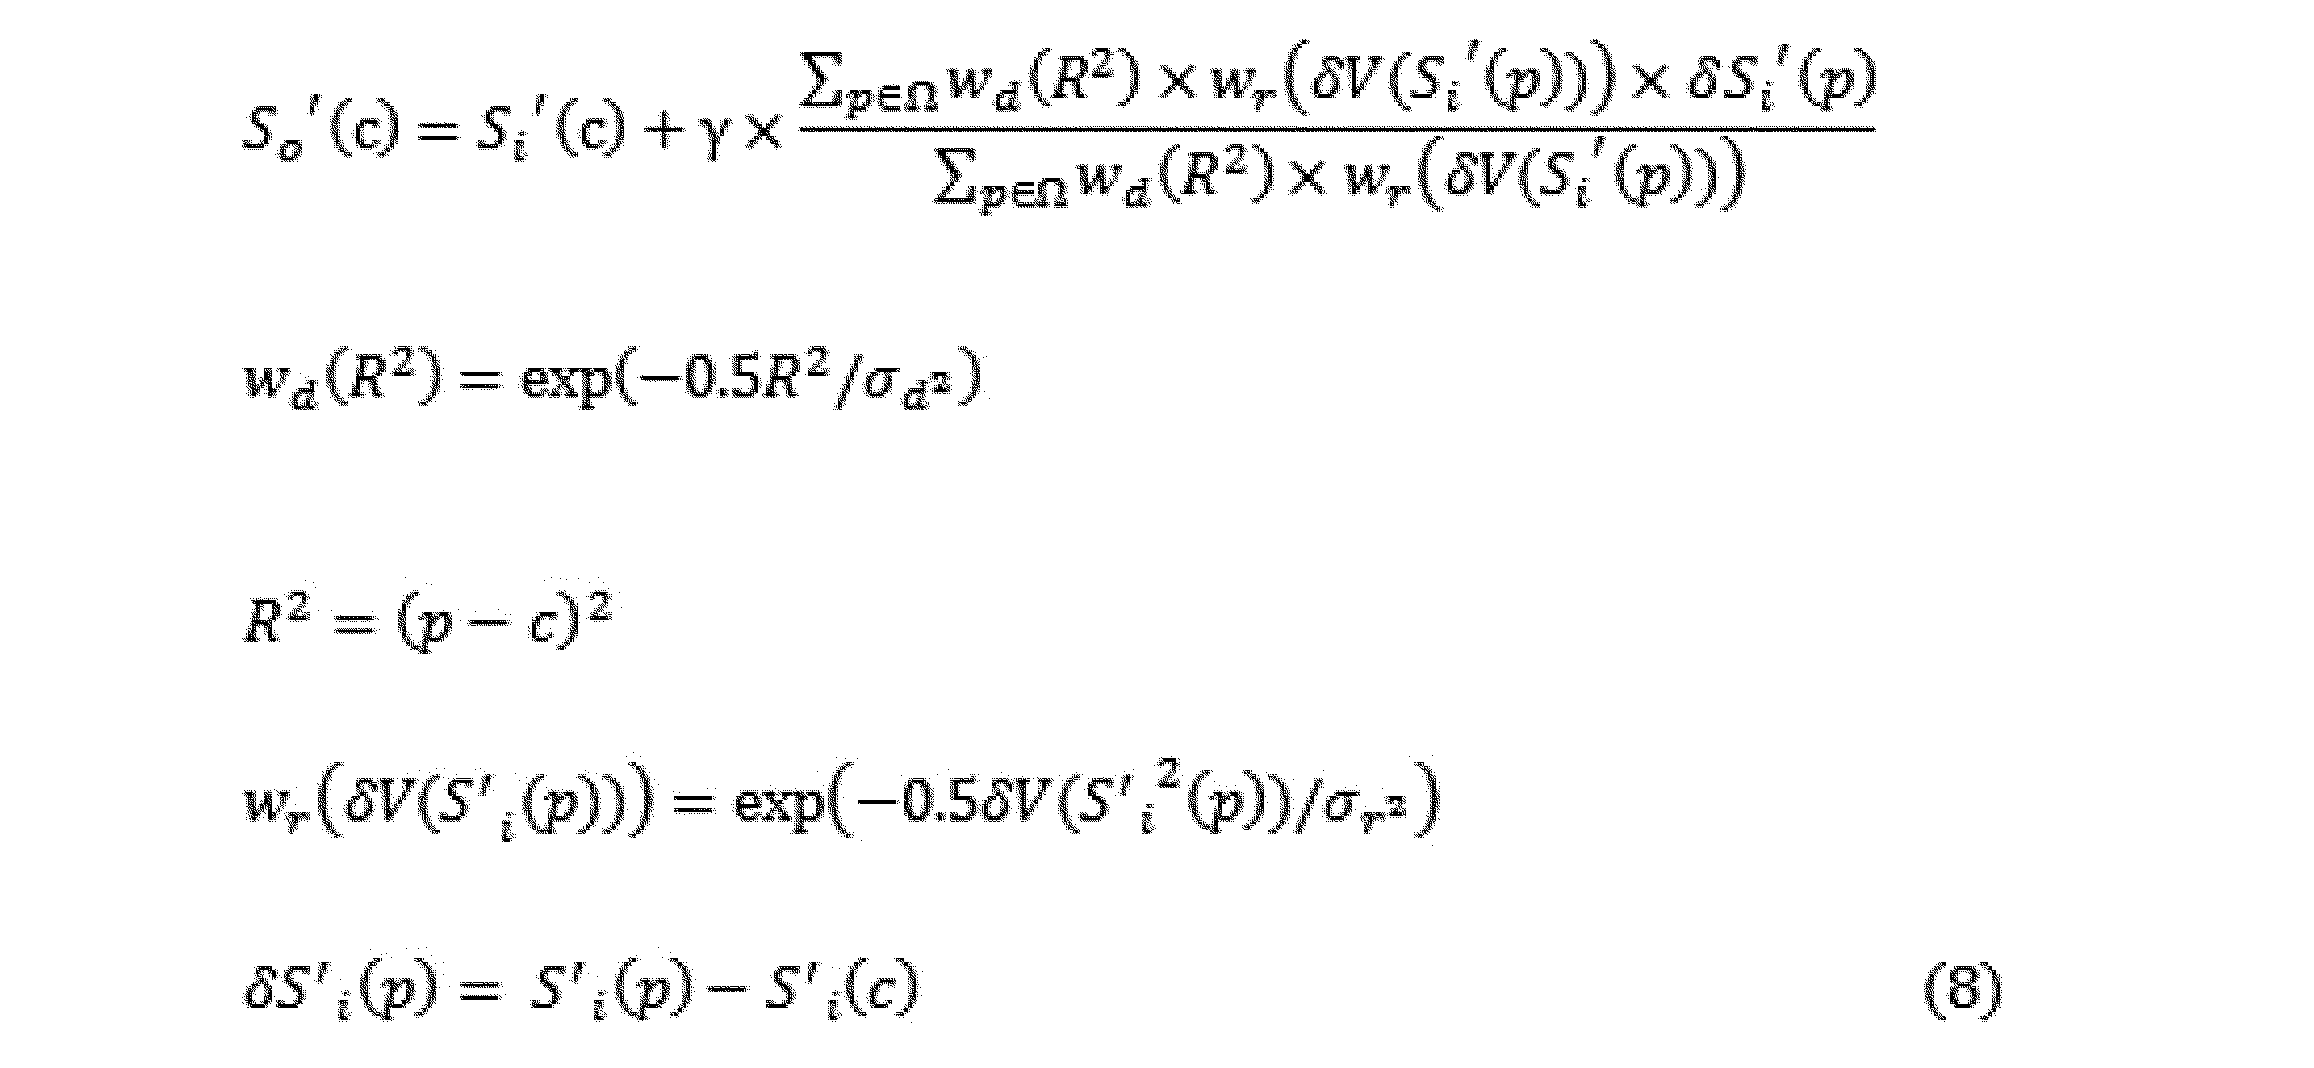
上記式(7)と同様に右辺のフィルタリング前の信号強度Si´()を除く部分に係数γを掛け合わせている。上記式(7)と異なる点は、δV(Si´(p))を用いている点である。δV(Si´(p))は、例えば画像信号の領域を同一の大きさで格子状に分割した複数領域のうちpを含む領域の信号強度と着目画素の信号強度との差である。すなわち、バイラテラルフィルタの定義式である上記式(7)においては、レンジフィルタの加重関数wrは、着目画素と周囲の画素との信号強度の差を各周囲の画素毎に算出して求めていたが、ノンローカルミーンフィルタの定義式である上記式(8)においては、レンジフィルタの加重関数wrは、着目画素と周囲の画素との信号強度の差を、周囲の画素が位置する一定領域(画像信号の領域を分割した複数領域のうちpを含む領域)毎に算出して求めている。この場合に、一定領域の信号強度としては、例えば、一定領域に含まれる各画素の信号強度の平均を用いることができる。
また、発明者は鋭意研究を重ねる中で、上記式(7)及び上記式(8)において、着目画素の信号強度との差に応じた重みづけを行う際のパラメータ(レンジフィルタ分散値)σr
2として、各着目画素毎のノイズの分散値であるノイズ分散値σ2
totalを用いてフィルタリング後の信号強度を算出すると、より安定したフィルタリングを行うことができることを見出した。後述するノイズ分散上限値算出部14、算出画素決定部15、ノイズ分散推定部16によって、各着目画素毎のノイズの分散値であるノイズ分散値σ2
totalが算出された場合には、フィルタリング部13は、上記式(7)及び上記式(8)において、着目画素の信号強度との差に応じた重みづけを行う際のパラメータ(レンジフィルタ分散値)σr
2としてノイズ分散値σ2
totalを用いてフィルタリング後の信号強度を算出する。
ノイズ分散上限値算出部14は、同一の対象を撮像した複数の参照用画像信号を入力して、該参照用画像信号を構成する画素に含まれるノイズの、該画素の信号強度に応じた分散値を複数算出し、該ノイズの分散値から、画像信号の画素に含まれる信号強度に応じたノイズの上限値であるノイズ分散上限値を算出するノイズ分散上限値算出手段である。
ノイズ分散上限値算出部14によって算出される、複数のノイズの分散値の算出方法の例について、図5により説明する。なお、ノイズの分散値の算出方法については、「“ISO15739 First edition : Photography-Electronic still-picture imaging-Noise measurements”,2003.」(以下、非特許文献2という)に記載がある。図5(a)に示すように、最初に、撮像装置1で同一の対象であるカラーチャートをn枚撮像し、参照用画像とする。カラーチャートとは、色の表、すなわち、色見本を配列した板状の物体であり、色彩再現性をチェックするなど色の比較・測定に用いるものである。また、n枚とは8枚以上であればよく、本実施形態では10枚とする。撮像装置1とカラーチャートの位置関係は固定とする。
次に、撮像装置1とカラーチャートの位置関係は同一位置に固定、露光時間も同一として、遮光空間で暗電流画像を10枚撮像し、それぞれの暗電流画像を構成する画素の信号強度の分散値を算出し、それらの平均値σ2
dcを求める。そして、暗電流画像から、暗電流ノイズの平均値を取得し、最初に取得した10枚の参照用画像から暗電流ノイズによって加算されるバイアスを減算し、暗電流補正後の画像を作成する。
次に、図5(b)に示すように、暗電流補正後の10枚の画像から、平均値画像を1枚作成する。平均値画像とは、各画素毎の平均信号強度を取得した画像である。次に、図5(c)に示すように、平均値画像と暗電流補正後の10枚の画像とから、それらの差分である、差分画像を10枚作成する。
次に、図5(d)に示すように、平均値画像について、M×N画素(M、Nは予め設定された自然数)のエッジを含まない平坦な領域を持つ局所領域を選択し、該局所領域における平均値画像を構成する画素の信号強度の分散値σ2
aveを算出する。M×N画素としては、例えばM=N=21とすることが考えられる。
次に、図5(e)に示すように、全ての差分画像について、M×N画素のエッジを含まない平坦な領域を持つ局所領域を選択し、該局所領域における差分画像の信号強度及び分散値を算出する。その後、各差分画像を構成する画素の信号強度の分散値の平均値σ2
diffを算出する。
そして、σ2
ave及びσ2
diffの算出後、下記で定義される式により、図5(f)に示すように、経時ノイズの分散値σ2
temp、固定パターンノイズの分散値σ2
fp、総合ノイズの分散値σ2
totalをそれぞれ算出する。

図6は、ノイズの分散値の測定結果イメージを示している。図6のグラフの横軸は信号強度Si´を、縦軸は各ノイズの分散値を表している。上記式により算出した経時ノイズの分散値σ2
temp、固定パターンノイズの分散値σ2
fp、総合ノイズの分散値σ2
totalは、画素位置を特定位置に固定した場合には、図6(a)に示したように、信号強度を変数とした近似式で推定することができる。
当該近似式で推定した経時ノイズの分散値σ2
temp、固定パターンノイズの分散値σ2
fp、総合ノイズの分散値σ2
totalと、各ノイズの分散値の測定値との一致度合を示す係数として重相関係数Rを用いると、重相関係数Rの決定係数R2(決定係数R2は0以上かつ1以下であって、1に近い値であるほど比較対象の一致度が高いことを示す)の値は、図6(a)に示した表のようになる。画像信号を、無彩色であって学習内(近似式を算出するのに用いた画素)のものにした場合及び有彩色で学習外(近似式を算出するのに用いていない画素)のものにした場合のいずれの場合においても、経時ノイズの分散値σ2
temp、固定パターンノイズの分散値σ2
fp、総合ノイズの分散値σ2
totalの決定係数R2は1に極めて近い値となる。すなわち、各ノイズの分散値は、近似式による値と実測値とで、高い一致度となる。
一方で、画素位置を不特定位置とした場合には、重相関係数Rの決定係数R2の値は、図6(b)に示した表のようになる。画像信号を、カラーチャート24色の不特定位置であって学習外のものにした場合には、画素位置の依存性がない経時ノイズの分散値σ2
tempについての決定係数R2は1に極めて近い値となるものの、画素位置の依存性がある固定パターンノイズの分散値σ2
fpについての決定係数R2は0.7768となり、近似式による値と実測値とで一致度は低いものとなる。総合ノイズの分散値σ2
totalについても決定係数R2は0.8782となり、近似式による値と実測値とで一致度は低いものとなる。固定パターンノイズの分散値σ2
fp及び総合ノイズの分散値σ2
totalについての、近似式による値と実測値との乖離が大きいことから、画素位置を不特定位置とした場合には、1つの近似式で経時ノイズの分散値σ2
temp、固定パターンノイズの分散値σ2
fp、総合ノイズの分散値σ2
totalを推定することはできないことがわかる。そこで、ノイズの分散値の上下限値を特定(ノイズ特性の上下限近似関数を特定)することで、ノイズの分散値を算出する方法を採用する。
上記式(9)にて算出された、経時ノイズの分散値σ2
temp、固定パターンノイズの分散値σ2
fpはそれぞれパラメータα及びβを用いて下記で定義する式に表すことができる。Si・ave´は平均値画像の信号強度である。

そして、ノイズ分散上限値算出部14は、算出したSi・ave´、σ2
dc、及び上記式(9)から算出したσ2
fp、σ2
tempと、上記式(10)より、パラメータα及びパラメータβを得る。パラメータα及びパラメータβは、画素毎やカラーチャートの同一色毎に得ることができる。ノイズ分散上限値算出部14は得られた複数のパラメータα及び複数のパラメータβから、複数のαのうち最大値であるαmax、複数のβのうち最大値であるβmax、複数のβのうち最小値であるβminを選定する。具体的には、ランダムサンプリングした画素に対して、αmaxはmax{α(Si´(p))}、βmaxはmax{β(Si´(p))}、βminはmin{β(Si´(p))}でそれぞれ求められる。αmax及びβmaxからはノイズ特性の上限近似関数σ2
max(Si´)が、βminからはノイズ特性の下限近似関数σ2
min(Si´)が、それぞれ下記で定義する式により算出される。なお、ノイズ特性の下限近似関数σ2
min(Si´)については、後述する算出画素決定部15による着目画素のノイズの分散値を算出するための画素の決定においては、必ずしも必要ではない。

図7は、ノイズ特性の上限近似関数σ2
max(Si´)及び下限近似関数σ2
min(Si´)を示している。図7のグラフの横軸は信号強度Si´を、縦軸は各ノイズの分散値を表している。ノイズの分散値の上下限が決定するため、各信号強度におけるノイズの分散値σ2
totalは、当該上下限値の間の値であると推定できる。なお、ノイズ特性の上下限近似関数に関しては、「Y.M.Baek,J.C.Kim,D.C.Cho,J.A.Lee,andW.Y.Kin,“Integrated Noise Modeling For Image Sensor Using Bayer Domain Images”,Computer Vision/Computer Graphics CollaborationTechniques,pp.413-424,2009.」(以下、非特許文献3という)に記載がある。ただし、当該文献には、ノイズ分散の上下限を定義するモデル化の提案はされているものの、各パラメータ(αmax、βmax、βmin)の決定方法は明確に示されていない。また、モデル作成に使用するチャートは、マクベスカラーチャートとすることで、グレイスケールチャートや均一光源面等を用いた場合と比較して、撮影回数の低減を実現した。
ここで、当該ノイズの分散値推定方法は、一枚の画像のみを使用して着目画素のノイズ分散値を推定するものである。そのために、局所領域内画素の信号は同一の信号強度(極めて近似する信号強度を含む)である同一信号源を撮像し、事前に取得したノイズ特性の上限内に収まる特性のノイズが重畳していると仮定する。すなわち、ノイズ特性の上限値を用いて同一の信号強度の画素を推定し、ノイズの分散値を推定するものである。
算出画素決定部15は、ノイズ分散上限値算出部14が算出したノイズ分散上限値を用いて、入力部11によって入力されたフィルタリング対象の画像信号における周囲の画素が、着目画素のノイズの分散値を算出するために用いることができる画素か否かを判定する算出画素決定手段である。
算出画素決定部15は、着目画素のノイズ分散上限値を示す上限近似関数σ2
max(Si´)を用いて、周囲の画素の信号強度が、下記で定義される式を満たすか判定し、該周囲の画素が、着目画素のノイズの分散値を算出するために用いることができる画素か否かを判定する。

上記式(12)において、Kは予め設定された判定係数(0.5ksigmapoint)であり、判定係数Kとしては、例えば、5を用いる。上記式(12)を満たす周囲の画素は、着目画素と同一の信号強度(極めて近似する信号強度を含む)である同一信号源であると判断され、後述する着目画素のノイズの分散値の算出に用いられる。
算出画素決定部15による、ノイズの分散値を算出するために用いる画素の決定イメージを図8に示す。ノイズの分散値を算出するために用いる画素の決定はフィルタリング対象の一枚の画像のみを使用して行われる。図中のcは着目画素を、pは周囲の画素を示す。図8(a)に示すように、中央のマスを着目画素とし、その他のマスを周囲の画素としている。いま、各マスのうち、斜線が描かれているマスは上記式(12)を満たす周囲の画素の位置、白抜きのマスは上記式(12)を満たさない周囲の画素の位置とする。例えば、図8(b)のように、上記式12を満たさない周囲の画素については、着目画素のノイズの分散値を算出するために用いない画素であると判定される。一方で、図8(c)のように、上記式12を満たす周囲の画素については、着目画素のノイズの分散値を算出するために用いることができる画素であると判定される。このように、周囲の画素について、それぞれ判定していき、図8(d)のように、上記式12を満たす周囲の画素で構成された信号集合SΨを導出する。
ノイズ分散推定部16は、算出画素決定部15により着目画素のノイズの分散値を算出するために用いることができる画素であると判定された周囲の画素から、着目画素のノイズの分散値σ2
total(c)を推定するノイズ分散推定手段である。ノイズ分散推定部16は、図8(d)に示した信号集合SΨに含まれる画素の信号強度の分散値を、着目画素の総合ノイズ分散値σ2
total(c)であるとみなす(VAR(SΨ)=σ2
total(c))。ノイズ分散推定部16によって算出された着目画素毎のノイズの分散値σ2
total(c)は、フィルタリング部13によって、フィルタリング後の信号強度を算出するためのパラメータとして用いられる。具体的には、フィルタリング部13は、上記式(1)又は(2)におけるσr
2として、ノイズの分散値σ2
total(c)を用いてフィルタリング後の信号強度を算出する。なお、画素毎におけるノイズ分散値σ2
total(c)を求める方法は、上記方法に限定されず、その他の方法により求めてもよい。
係数算出部17は、係数γを算出する係数算出手段である。係数算出部17は、フィルタリング前後の画像信号のノイズの分散値に基づく値を入力して入力した値から、係数γを算出する。係数γは、フィルタリング前後の画像信号のノイズの分散値に基づく値である、フィルタリング前後のノイズの標準偏差から求めることができる。ここで、フィルタリングは、例えばフィルタリング装置10によって実施され、上記式(1)又は(2)で定義される式によりフィルタリング後の信号強度が算出される。この場合には、例えば、上記式(1)又は(2)のγ=1として、フィルタリング部13によるフィルタリングが行われる。また、フィルタリング前後のノイズの標準偏差σi及びσtとしては、例えば、総合ノイズ標準偏差σtotalを用いることができ、係数γを画像信号毎に算出する場合には、画像信号に含まれる各着目画素のノイズ標準偏差σtotalを平均したものが、σi及びσtとなり画像信号毎の係数γが算出される。また、係数γを画素毎に算出する場合には、画像信号に含まれる各着目画素毎のノイズ標準偏差σi及びσtが各画素のσi及びσtとなり各着目画素毎の係数γが算出される。なお、ノイズ分散値σ2
total及びノイズ標準偏差σtotalは、後述するノイズ分散上限値算出部14によって複数毎の画像から算出でき、また、後述するノイズ分散推定部16によって一枚の画像から算出することができる。また、フィルタリング装置10以外のフィルタリング装置でフィルタリングを行い、フィルタリング前後のノイズの標準偏差を求めるものであってもよい。フィルタリング前後のノイズの標準偏差からの係数γの算出は、具体的には、下記で定義する式によって行われる。

上記式(13)において、σiはフィルタリング前の(入力信号の)画像信号のノイズの分散値に基づくノイズ標準偏差、(フィルタリング前の画像信号の総合ノイズ標準偏差σtotal)を、σtはフィルタリング後の画像信号のノイズの分散値に基づく残留ノイズ標準偏差(フィルタリング後の画像信号の総合ノイズ標準偏差σtotal)をそれぞれ表している。
上記式(13)は以下のように導かれる。分散値の算出式より、以下の式が成り立つ。

Strueは信号強度の真値、Sinはフィルタリング前の着目画素の信号強度、Soutはフィルタリング後の着目画素の信号強度である。
上記式(14)に誤差係数(error factor)εを導入すると、以下の式が成り立つ。

さらに、上記式(15)より、以下の式が成り立つ。

さらに上記式(16)及び上記式(6)と、

の関係をもとに、以下の式が成り立つ。

また、グラフの横軸にσr/σi、縦軸にσt/σiをとった場合の係数γは図9に示すようになる。ノイズ分散推定部16により推定されたノイズの分散値は、実際に測定される値σiを精度よく推定することができるため、σrの値をノイズ分散推定部16により推定されたノイズの分散値とすることで、σr≒σiとなり、係数γの値を固定値とすることができる。なお、すべての画素について動的に係数γを求め使用することも可能である。
引き続いて、図10及び図11のフローチャートを用いて、本発明の実施形態に係る画像フィルタリング装置10の、ノイズの分散上限値算出処理及びフィルタリング処理を説明する。図10は、本発明の実施形態に係る画像フィルタリング装置10によるノイズの分散上限値算出処理を示すフローチャートである。本処理のS101~S103は、撮像素子温度やシャッタースピード等の撮影条件が同じ場合であれば、一度行われればよく、一度行った後に撮像装置1で被写体を撮像する際には行われない処理である。撮像装置素子温度やシャッタースピード等の撮影条件が変わった場合には、再度、S101~S103の処理が行われる。
まず、同一の対象を撮像した複数の参照用画像が、入力部11より入力される(S101)。当該参照用画像から、平均値画像及び差分画像を作成し、それぞれの信号強度及び分散値を算出することで、ノイズ分散上限値算出部14によって、信号強度に応じたノイズの分散値が複数算出される(S102)。
そして、算出された信号強度に応じたノイズの分散値から、ノイズ分散上限値算出部14によって、ノイズ特性の上限近似関数σ2
max(Si´)、及び下限近似関数σ2
min(Si´)が算出され、信号強度に応じたノイズ分散上限値(及び下限値)が算出される(S103)。
図11は、本発明の実施形態に係るフィルタリング処理を示すフローチャートである。撮像装置1によって被写体が撮像されると、入力部11により画像信号が入力される(S104、入力ステップ)。そして、着目画素のノイズ分散上限値を示す上限近似関数σ2
maxに基づき、算出画素決定部15によって各着目画素のノイズの分散値を算出するための周囲の画素が決定される(S105)。
次に、算出画素決定部15が決定したノイズの分散値を算出するための周囲の画素を用いて、ノイズ分散推定部16によって、各着目画素のノイズの分散値σ2
total(c)が算出される(S106)。
次に、算出された各着目画素のノイズの分散値σ2
total(c)を用いて、フィルタリングが実施される(S107)。この場合には、暫定的に、上記式(1)又は(2)のγ=1としてフィルタリングが実施される。正係数算出部17によってフィルタリング前後のノイズの分散値が算出され、上記式(13)より、係数γが算出される(S108)。
そして、S106においてノイズ分散推定部16に算出された各着目画素のノイズの分散値σ2
total(c)及び、S108において係数算出部17に算出された係数γを用いて、フィルタリング部13によって、再度画像信号のフィルタリングが実施される(S109、フィルタリングステップ)。
S109における画像信号のフィルタリング処理が完了すると、出力部12により、フィルタリング部13によって算出されたフィルタリング後の信号強度の画素で構成される画像信号が出力される(S110、出力ステップ)。
次に、本実施形態に係る画像フィルタリング装置10の作用・効果について説明する。
この画像フィルタリング装置10では、着目画素のフィルタリング後の信号強度として、着目画素と該着目画素の周囲の画素との信号強度の差に重みづけを行ったものを足し合わせた値に係数γを掛け合わせた値に、着目画素のフィルタリング前の信号強度を足し合わせた値を算出している。係数γを掛け合わせることにより、画像信号にかかわらず、出力のSNRを安定した値とすることができることは、本発明者が鋭意研究を重ねる中で見出した知見である。
以上より、本発明の一実施形態によれば、入力する画像信号に依存しない安定的なフィルタリングを行うことができる画像フィルタリング装置10を提供することができる。また、本画像フィルタリング装置10によれば、デバイスの種類に関係なく、ノイズ低減に優れた平滑化手法を提供することができる。
また、本実施形態に係る画像フィルタリング装置10において、フィルタリング部13は、重みづけを行う際は、周囲の画素の画素位置と着目画素の画素位置との距離が近いほど重みづけを重くし、周囲の画素の信号強度と着目画素の信号強度との差が小さい程重みづけを重くすることで、ノイズを除去しながら、エッジやテクスチャ等の本来の信号情報を保持することができる。
また、本実施形態に係る画像フィルタリング装置10において、フィルタリング部13は、上記式(1)で定義される式によりフィルタリング後の信号強度を算出することで、バイラテラルフィルタをもとにして確実に本発明の一実施形態を実施することができる。
また、本実施形態に係る画像フィルタリング装置10において、フィルタリング部13は、上記式(2)で定義される式によりフィルタリング後の信号強度を算出することで、ノンローカルミーンフィルタをもとにして確実に本発明の一実施形態を実施することができる。
また、本実施形態に係る画像フィルタリング装置10において、ノイズ分散上限値算出部14と、算出画素決定部15と、ノイズ分散推定部16と、をさらに備え、フィルタリング部13は、σr
2としてノイズ分散値σ2
total(c)を用いてフィルタリング後の信号強度を算出することで、フィルタリングによる信号強度の算出において、画素毎のノイズ分散値σ2
total(c)をレンジフィルタの加重関数に反映させることができ、より出力のSNRの値が小さくなることを防止できる。
σr毎の入力SNRに対するノイズ低減特性を調べるために、図20(a)に示すように、入力画像であるCGチャートにノイズ発生器により、任意のノイズ特性(ノイズ標準偏差がσi。ノイズのパラメータは標準偏差σiを変えて重畳可能)のノイズを重畳したものを、n枚評価画像として作成した。そして、図20(b)に示すように、ドメインフィルタ分散値σd及び局所領域Ωは固定値とし、レンジフィルタ分散値σrは可変(任意値)とし、フィルタリングを行い、図20(c)に示すように、それぞれの画素について、ノイズ低減特性を算出する。図20(a)~図20(c)に示す処理は、ノイズ低減特性の解析が十分に行われるまで繰り返され、σiの値を変更して処理を行う場合には図20(a)~図20(c)の処理が繰り返され、σrの値を変更して処理を行う場合には図20(b)~図20(c)の処理が繰り返される。また、ドメインフィルタ分散値σd及び局所領域Ωを変えて同様の処理を行えば、σt/σi、σr/σi、σd、Ωの4パラメータで構成される4次元空間上でノイズ低減特性が表される。なお、σi及びσtの測定方法は、非特許文献2に記載がある。
画素毎のノイズ分散値σ2
total(c)を用いてフィルタリングを行った場合の効果については、図12(σr毎の入力SNRに対するノイズ低減特性を示す図)により確認することができる。なお、この際の当該フィルタリング処理は、画像フィルタリング装置10に用いるフィルタのパラメータとして、着目画素を中心とした局所領域Ωは21×21画素のサイズに固定し、ドメインフィルタ分散値σd
2は固定値9とし、レンジフィルタ分散値σr
2は可変とした。また、使用するフィルタはバイラテラルフィルタ等をベースとするものである。また、対象ノイズ(フィルタリング装置10によるフィルタリング対象となる画像信号に含まれるノイズであって、測定又は算出するもの)はガウス分布に従うノイズとした。また、CGチャートを入力画像信号とした。なお、フィルタのパラメータは上述したものに限定されるものではなく、必要に応じて変更することが可能である。
図12はσr毎の入力SNRに対するノイズ低減特性を示す図である。グラフの横軸が入力画像信号のSNRであり、縦軸が出力画像信号のSNRである。グラフ中で実線で示された線は、フィルタリング処理を行わなかった場合の出力のSNRを表している。着目画素の信号強度との差に応じた重みづけを行う際のパラメータ(レンジフィルタ分散値)としてσr
2を用いた場合には、σrの値を比較的小さく(13.4)した場合には、入力のSNRを大きくした場合に、出力のSNRが未処理の場合と同等となっており、適切にフィルタリングが行えていないことがわかる。また、σrの値を比較的大きく(158.7)した場合にも、入力のSNRを大きくした場合に出力のSNRが低減(ノイズ低減量が減衰)しており、適切なフィルタリングが行えていないことがわかる。一方で、σr
2としてノイズ分散値σ2
totalを用いた場合には、入力のSNRに対してSNR利得が一定であり、安定的に出力のSNRを得ることができていることがわかる。すなわち、レンジフィルタ分散値σr
2に入力画像信号のノイズ分散値σ2
totalを用いることで、入力画像信号のSNR(信号強度やノイズ特性)に依存しないロバストなノイズ低減が可能となる。
また、本実施形態に係る画像フィルタリング装置10において、算出画素決定部は、上記式(3)で定義される式を満たす場合に、周囲の画素が着目画素のノイズの分散値を算出するために用いることができる画素であると判定することで、一枚の画像から着目画素のノイズの分散値を算出することを可能とする。
なお、本実施形態に係る方法以外の方法でノイズの分散値を算出することもでき、他の方法としてはSNE(ショットノイズ分散値推定)やAFE(関数近似)などがあるが、図13に示すように、本実施形態に係る方法を採用することによって、総合ノイズの分散値を高い精度で推定することができる。図13のグラフにおいて、横軸はノイズの分散値σ2
totalの測定値、縦軸はノイズの分散値σ2
totalの推定値である。なお、ノイズの分散値推定手法については、「H. Talbot, H. Phelippeau, M. Akil, and S. Bara, “Efficient Poisson denoising for photography,”Image Processing (ICIP),2009 16th IEEE International Conference on, pp.3881-3884, 2009.」(以下、非特許文献4という)に記載がある。
また、本実施形態に係る画像フィルタリング装置10において、係数γを算出する係数算出部17をさらに備え、係数算出部17は、フィルタリング前後の画像信号のノイズの分散値に基づく値を入力して入力した値から係数γを算出することで、簡易に係数γの適切な値を求めることができる。
また、本実施形態に係る画像フィルタリング装置10において、係数算出部17は、上記式(4)で定義される式により係数γを算出することで、より確実に係数γを算出することができる。あるいは係数γは、画像フィルタリング装置10のユーザにより予め設定された値でもよい。この場合、係数γは、例えば、経験的に得られた望ましい値とすることができる。
以上、本発明の実施形態について説明したが、本発明は上記実施形態に限られるものではなく、各請求項に記載した要旨を変更しない範囲で変形し、又は他のものに適用したものであってもよい。
例えば、画像フィルタリング装置10は撮像装置1に搭載されているものとしたが、必ずしもこれに限定されるものではなく、画像フィルタリング装置10は撮像装置1に搭載されているものでなくてもよい。例えば、画像フィルタリング装置10が別体として構成され、撮像装置1と接続されるように構成されていてもよい。
また、画像フィルタリング装置10のレンジフィルタ分散値σr
2は可変としたが、これに限定さえず、予め設定された固定値としてもよい。
また、係数γは、レンジフィルタ分散値σr
2としてノイズの分散値σ2
totalを用いたフィルタリング前後のノイズの分散値を測定して算出することとしたが、これに限定されるものではなく、例えば、ノイズの分散値σ2
totalを用いないフィルタでフィルタリングを行ってもよい。また、カラーチャートに基づく評価画像にノイズを重畳させた画像を複数毎作成し、フィルタリング前後の画素ノイズ分散値を測定した上で係数γを求めてもよい。
また、画像フィルタリング装置10は、ガウス分布以外のノイズ特性に従うノイズにもwrの重み付け関数を対象となるノイズ特性の確率密度関数に変更することで応用でき、例えば医療画像(磁気共鳴画像、超音波画像)やTOF画像等のノイズ低減にも応用可能である。
また、画像フィルタリング装置10は、カメラ、ディスプレイ、CPU等を備えるタブレットPC等の表示画像のノイズ低減に用いることもでき、画像の質感を向上させることができる。
また、画像フィルタリング装置10における信号強度に対する重みづけの考え方を、他のフィルタに展開することが可能である。
また、画像フィルタリング装置10を備えたXYZカメラでは、色変換に由来するランダムノイズの顕著化にも対応することができる。
また、画像信号以外の信号処理に対しても、画像フィルタリング装置10で用いたフィルタを適用することが可能である。
以下、本発明の実施例について説明する。なお、本発明はこれらの実施例に限定されるものではない。
[実施例1]
実施例1は、種々のフィルタリング装置毎のフィルタリング効果を比較するものである。比較対象となるフィルタリング装置は、上記式(1)によりフィルタリングを行うフィルタリング装置であって係数γ=1.0とするNABF、上記式(1)によりフィルタリングを行うフィルタリング装置であって係数γ=2.2とするCNABF、非特許文献1に記載されたフィルタリング装置であるDBF、非特許文献4に記載されたフィルタリング装置であるSNABF、の四種類である。NABF及びCNABFは、σr 2としてノイズ分散値σ2 total(c)を用いてフィルタリングを行っているが、DBF及びSNABFではノイズ分散値σ2 total(c)を用いていない。また、画像信号をフィルタリングする範囲は21×21画素の範囲であり、着目画素からの距離に応じた重みづけを行う際のパラメータ(ドメインフィルタ分散値)σd 2=9とする。
実施例1は、種々のフィルタリング装置毎のフィルタリング効果を比較するものである。比較対象となるフィルタリング装置は、上記式(1)によりフィルタリングを行うフィルタリング装置であって係数γ=1.0とするNABF、上記式(1)によりフィルタリングを行うフィルタリング装置であって係数γ=2.2とするCNABF、非特許文献1に記載されたフィルタリング装置であるDBF、非特許文献4に記載されたフィルタリング装置であるSNABF、の四種類である。NABF及びCNABFは、σr 2としてノイズ分散値σ2 total(c)を用いてフィルタリングを行っているが、DBF及びSNABFではノイズ分散値σ2 total(c)を用いていない。また、画像信号をフィルタリングする範囲は21×21画素の範囲であり、着目画素からの距離に応じた重みづけを行う際のパラメータ(ドメインフィルタ分散値)σd 2=9とする。
図14に示すように、カラーチャート、花の写真、ピーマンの写真の画像信号について、各フィルタリング装置でフィルタリング処理を行う。なお、このようなフィルタリング処理に関しての実験については、非特許文献1及び非特許文献4に記載がある。なお、撮像装置1として、XYZ表色系で画像信号の取出しが可能な、XYZ静止画カメラ(「Y.Shimodaira, H.Suzuki, M.Kretkowski, “New Imaging and Display System for Wide Gamut Color Reproduction,” IEEE-IAS 2007 Annual Meeting, 33P5, New Orleans, Louisiana, USA(2007.9.23-27)」(以下、非特許文献5という)に記載あり)を用いる。
図15に、カラーチャートの各カラーカードナンバー(1~23)の画像信号についてフィルタリング処理を行った結果を示している。なお、カラーカードナンバーは数が大きいほど信号強度が強い画像信号である。各カラーカードナンバーの固定パターンノイズ、経時ノイズ、総合ノイズの分散値の算出結果は図15(a)に示すようになった。また、各カラーカードナンバー毎の出力画像信号のSNRは、図15(b)に示すようになった。図15(b)から明らかなように、係数γ=2.2としたCNABFは、いずれのカラーカードナンバーにおいても、出力画像信号のSNRを高い値で維持することができた。各カラーカードナンバーにおける出力画像信号のSNRの平均(ΔSNR)は、それぞれ、NABFが5.03、CNABFが12.68、DBFが6.17、SNABFが3.62となった。
また、図15(c)に示すように、色差についても、各カラーカードナンバーについて、係数γ=2.2としたCNABFが最も低い値となった。各カラーカードナンバーにおける色差の平均(dE76(1.30))は、それぞれ、NABFが0.70、CNABFが0.26、DBFが0.58、SNABFが0.82となった。色差は、計測器が持つ誤差として0.30程度が見込まれるところ、CNABFでは当該計測器が持つ誤差と同程度の色差となった。
また、図16(a)に示すカラーチャートの2か所(範囲X及び範囲Y)についてフィルタリング処理を行った画像を図16(b)(範囲Xの画像)、図16(c)(範囲Yの画像)に示す。図16(b)、図16(c)ともに、最上部の画像はフィルタリング前の画像である。図16(b)からは、CNABFによりフィルタリングを行った画像が、各フィルタリング装置の画像のうちで最もなめらかであることがわかる。また、図16(c)からは、画像の明るさが鋭敏に変化しているエッジ部分について、CNABFが最も強調できていることがわかる。
また、花の写真について各フィルタリング装置でフィルタリング処理を行った出力画像信号のSNRの平均(ΔSNR)は、それぞれ、NABFが0.99、CNABFが1.70、DBFが1.09、SNABFが0.74となった。花の写真について各フィルタリング装置でフィルタリング処理を行った出力画像信号の色差の平均(dE76(1.61))は、それぞれ、NABFが1.43、CNABFが1.30、DBFが1.31、SNABFが1.46となった。
また、ピーマンの写真について各フィルタリング装置でフィルタリング処理を行った出力画像信号のSNRの平均(ΔSNR)は、それぞれ、NABFが1.84、CNABFが3.60、DBFが2.13、SNABFが1.07となった。ピーマンの写真について各フィルタリング装置でフィルタリング処理を行った出力画像信号の色差の平均(dE76(1.33))は、それぞれ、NABFが1.03、CNABFが0.78、DBFが0.85、SNABFが1.10となった。
以上より、カラーチャート及び花、ピーマンの写真について、出力画像信号のSNR及び色差の値を調べると、係数γ=2.2としたCNABFが最も良い値となることがわかった。
[実施例2]
実施例2は、カラーチャートに基づく評価画像を10枚作成し、σ2 totalを用いてかつ係数γ=1.0とするNABF、σ2 totalを用いてかつ係数γ=2.2とするCNABF、σ2 totalではなく固定値σr 2(σr1=0.5Smax、σr2=0.125Smax)を用いた2つのフィルタリング装置、の計四種類のフィルタリング装置で、画像信号に対してノイズ低減を実施し、処理後の画像信号に対し、処理前の画像信号に対するSNR利得を求めた。なお、各フィルタリング装置の共通条件として、着目画素を中心とした局所領域は21×21画素のサイズに固定し、ドメインフィルタ分散値σd 2は固定値9とした。また、Smaxとは画像が取りうる最大階調値であり、例えば、本実施例では14bitの出力の撮像装置1を用いているため、Smax =(2^14)-1=16383となる。
実施例2は、カラーチャートに基づく評価画像を10枚作成し、σ2 totalを用いてかつ係数γ=1.0とするNABF、σ2 totalを用いてかつ係数γ=2.2とするCNABF、σ2 totalではなく固定値σr 2(σr1=0.5Smax、σr2=0.125Smax)を用いた2つのフィルタリング装置、の計四種類のフィルタリング装置で、画像信号に対してノイズ低減を実施し、処理後の画像信号に対し、処理前の画像信号に対するSNR利得を求めた。なお、各フィルタリング装置の共通条件として、着目画素を中心とした局所領域は21×21画素のサイズに固定し、ドメインフィルタ分散値σd 2は固定値9とした。また、Smaxとは画像が取りうる最大階調値であり、例えば、本実施例では14bitの出力の撮像装置1を用いているため、Smax =(2^14)-1=16383となる。
図17は、実施例2における各フィルタリング装置(係数γ=1.0とするNABFを除く)のノイズ低減特性を示す図である。評価画像の結果について、横軸に入力画像信号のSNR、縦軸にSNR利得としてプロットしたものである。図17より、係数γ=2.2とするCNABFは利得が12db以上であるのに対して、固定値σr
2(σr1=0.5Smax、σr2=0.125Smax)を用いた場合は利得が減衰している。また、図18に実施例2における各フィルタリング装置のノイズ対信号比を示す。図18(a)は信号真値、図18(b)~(e)は未処理のノイズ画像信号と各フィルタリング適用後のノイズ対信号比である。図18(b)、(c)に示されるNABF、CNABFの結果より、NABF及びCNABFは、エッジを保存したままノイズの低減を実現していることがわかった。また、係数γの使用によりノイズの低減効果が上昇していることが図18(b)、(c)の比較から確認された。一方、図18(d)、(e)は、信号強度が弱い部分では過剰にノイズの低減が行われ、平坦化されている。また、信号強度が強くなるに従って残留ノイズ成分が増えていくことが確認された。
以上より、係数γ及びσ2
totalを用いることによって、適切にノイズ低減が行われることがわかった。なお、ノイズの確立密度関数が正規分布で表されるためレンジフィルタの加重関数はノイズの確立密度関数と等しいところ、着目画素と局所領域内画素の信号強度差は画素ごとのノイズ分散値に適応的な重みづけが行われるため、NABF、CNABFでは入力画像信号のSNR変動にロバストなノイズ低減を行うことができた。
引き続いて、上述した画像フィルタリング装置10の機能を用いた処理を、コンピュータに実行させるための文字入力プログラムを説明する。図19に示すように、画像フィルタリングプログラム100は、コンピュータに挿入されてアクセスされる、あるいはコンピュータが備える記録媒体50に形成されたプログラム格納領域51内に格納される。
画像フィルタリングプログラム100は、画像フィルタリング処理を統括的に制御するメインモジュール101と、入力モジュール102と、出力モジュール103と、フィルタリングモジュール104と、ノイズ分散上限値算出モジュール105と、算出画素決定モジュール106と、ノイズ分散推定モジュール107と、係数算出モジュール108とを実行させることにより実現される機能は、上述した画像フィルタリング装置10の入力部11と、出力部12と、フィルタリング部13と、ノイズ分散上限値算出部14と、算出画素決定部15と、ノイズ分散推定部16と、係数算出部17と、の機能とそれぞれ同様である。
なお、画像フィルタリングプログラム100は、その一部もしくは全部が、通信回線等の伝送媒体を介して伝送され、他の機器により受信されて記録(インストールを含む)される構成としてもよい。また、画像フィルタリングプログラム100の各モジュールは、1つのコンピュータでなく、複数のコンピュータのいずれかにインストールされてもよい。その場合、当該複数のコンピュータによるコンピュータシステムによって上述した一連の画像フィルタリングプログラム100の各種パラメータを決定する処理が行われる。
1…撮像装置、2…レンズ、3…カラーフィルタ、4…A/D変換部、10…画像フィルタリング装置、11…入力部、12…出力部、13…フィルタリング部、14…ノイズ分散上限値算出部、15…算出画素決定部、16…ノイズ分散推定部、17…係数算出部、50…記録媒体、51…プログラム格納部、100…画像フィルタリングプログラム、101…メインモジュール、102…入力モジュール、103…出力モジュール、104…フィルタリングモジュール、105…ノイズ分散上限値算出モジュール、106…算出画素決定モジュール、107…ノイズ分散推定モジュール、108…係数算出モジュール。
Claims (10)
- 画像信号に対してフィルタリングを行う画像フィルタリング装置であって、
画像信号を入力する入力手段と、
前記入力手段により入力された前記画像信号を構成する画素のうち着目画素の信号強度と該着目画素の周囲の画素の信号強度との差に重みづけを行い、重みづけを行った着目画素の信号強度と該着目画素の周囲の画素の信号強度との差を足しあわせた値に設定された係数γを掛け合わせた値と該着目画素の信号強度とを足し合わすことで、該着目画素のフィルタリング後の信号強度を算出するフィルタリング手段と、
前記フィルタリング手段によって算出された前記フィルタリング後の信号強度の画素で構成される画像信号を出力する出力手段と、
を備える画像フィルタリング装置。 - 前記フィルタリング手段は、前記重みづけを行う際は、前記周囲の画素の画素位置と前記着目画素の画素位置との距離が近いほど重みづけを重くし、前記周囲の画素の信号強度と前記着目画素の信号強度との差が小さいほど重みづけを重くする、請求項1に記載の画像フィルタリング装置。
- 前記フィルタリング手段は、
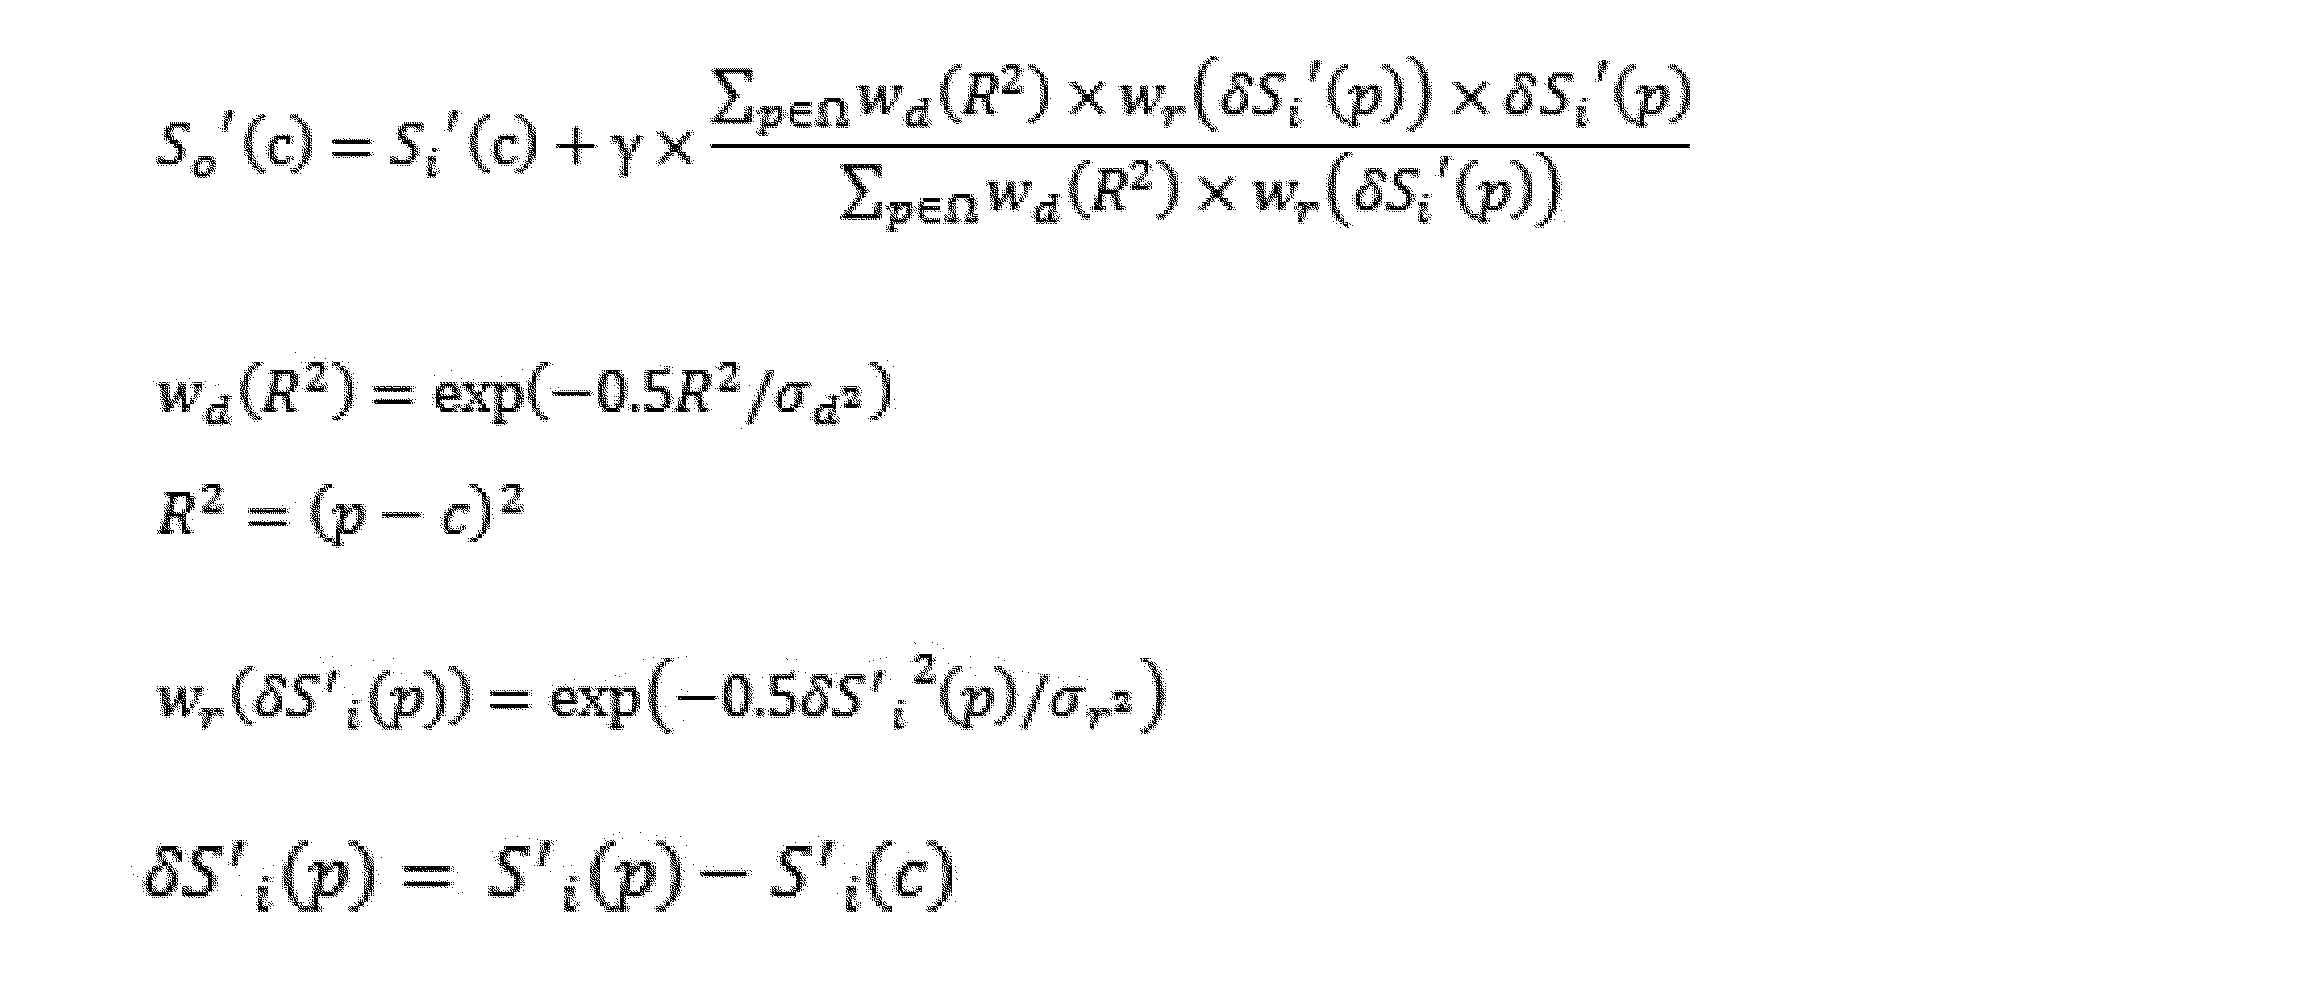
So´()はフィルタリング後の信号強度、
Si´()はフィルタリング前の信号強度、
cは着目画素の画素位置、
pは着目画素の前記周囲の画素の画素位置、
Ωは前記周囲の画素が位置する領域、
γは前記係数、
σd 2は着目画素からの距離に応じた重みづけを行う際のパラメータ、
σr 2は着目画素の信号強度との差に応じた重みづけを行う際のパラメータ、
である、請求項2に記載の画像フィルタリング装置。 - 前記フィルタリング手段は、
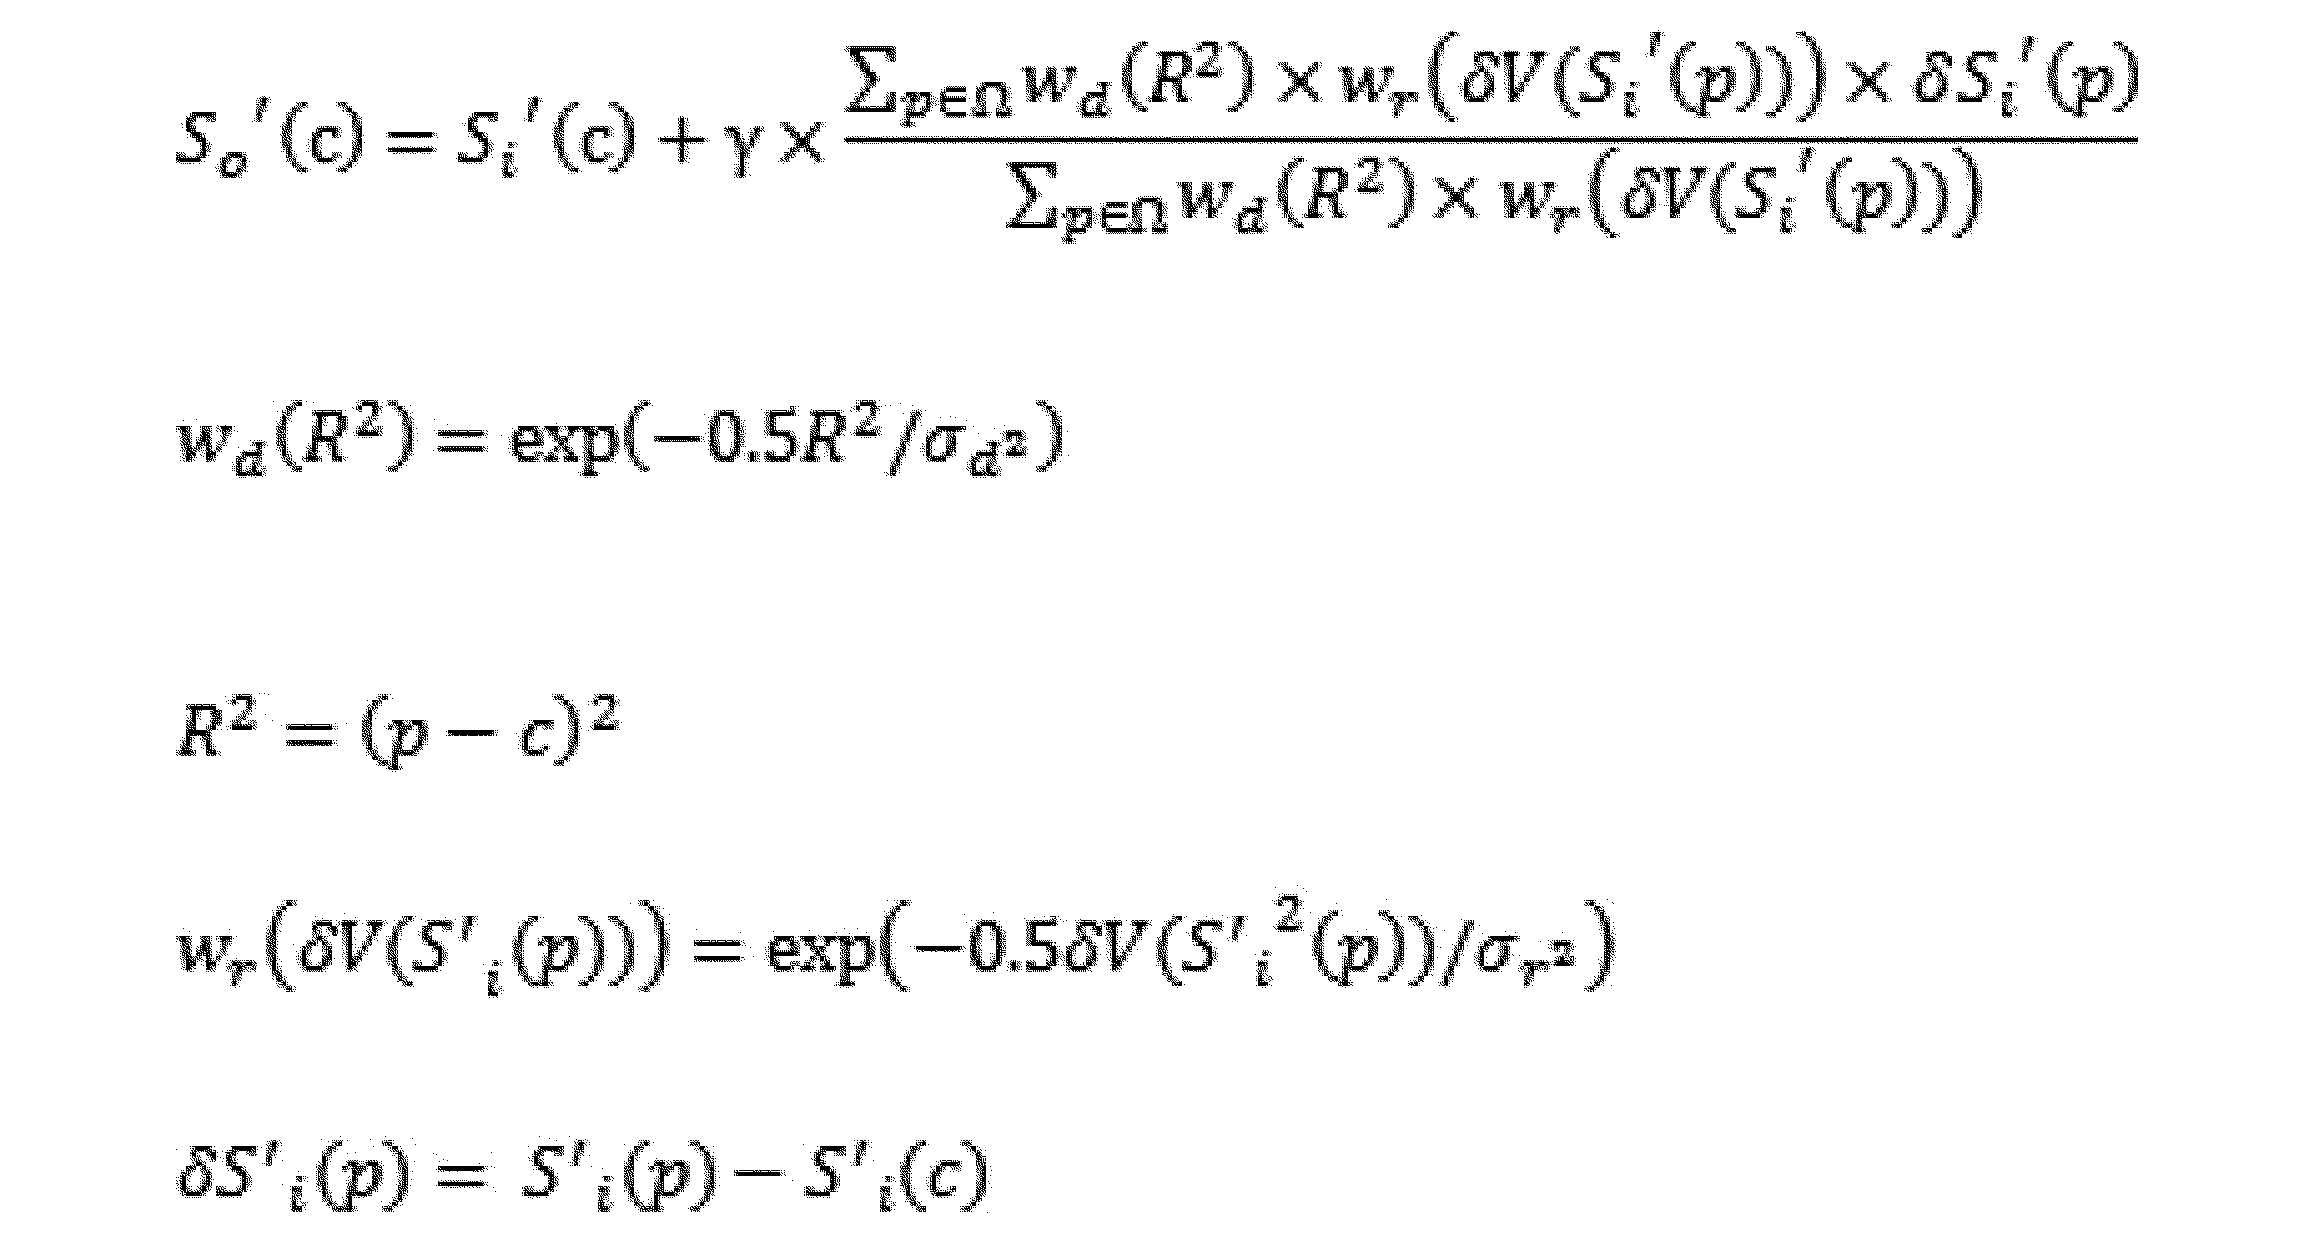
So´()はフィルタリング後の信号強度、
Si´()はフィルタリング前の信号強度、
cは着目画素の画素位置、
pは着目画素の前記周囲の画素の画素位置、
Ωは前記周囲の画素が位置する領域、
γは前記係数、
σd 2は着目画素からの距離に応じた重みづけを行う際のパラメータ、
σr 2は着目画素の信号強度との差に応じた重みづけを行う際のパラメータ、
δV(Si´(p))は画像信号の領域を分割した複数領域のうちpを含む領域の信号強度と着目画素の信号強度との差、
である、請求項2に記載の画像フィルタリング装置。 - 同一の対象を撮像した複数の参照用画像信号を入力して、該参照用画像信号を構成する画素に含まれるノイズの、該画素の信号強度に応じた分散値を複数算出し、該ノイズの分散値から、画像信号の画素に含まれる信号強度に応じたノイズの上限値であるノイズ分散上限値を算出するノイズ分散上限値算出手段と、
前記ノイズ分散上限値算出手段が算出した前記ノイズ分散上限値を用いて、前記周囲の画素が、前記着目画素のノイズの分散値を算出するために用いることができる画素か否かを判定する算出画素決定手段と、
前記算出画素決定手段により、前記着目画素のノイズの分散値を算出するために用いることができる画素であると判定された前記周囲の画素を用いて、前記着目画素のノイズ分散値σ2 total(c)を推定するノイズ分散推定手段と、をさらに備え、
前記フィルタリング手段は、前記σr 2として前記ノイズ分散値σ2 total(c)を用いてフィルタリング後の信号強度を算出する、請求項3又は4に記載の画像フィルタリング装置。 - 前記算出画素決定手段は、

σ2 max(Si´(c))は前記着目画素のノイズ分散上限値、
Kは予め設定された判定係数、
である、請求項5に記載の画像フィルタリング装置。 - 前記係数γを算出する係数算出手段をさらに備え、
前記係数算出手段は、フィルタリング前後の画像信号のノイズの分散値に基づく値を入力して入力した値から、前記係数γを算出する、請求項1~6のいずれか一項に記載の画像フィルタリング装置。 - 前記係数算出手段は、

σiはフィルタリング前の画像信号のノイズの分散値に基づくノイズ標準偏差、
σtはフィルタリング後の画像信号のノイズの分散値に基づく残留ノイズ標準偏差、
である、請求項7に記載の画像フィルタリング装置。 - 画像信号に対してフィルタリングを行う画像フィルタリング方法であって、
画像信号を入力する入力ステップと、
前記入力ステップにおいて入力された前記画像信号を構成する画素のうち着目画素の信号強度と該着目画素の周囲の画素の信号強度との差に重みづけを行い、重みづけを行った着目画素の信号強度と該着目画素の周囲の画素の信号強度との差を足しあわせた値に設定された係数γを掛け合わせた値と該着目画素の信号強度とを足し合わすことで、該着目画素のフィルタリング後の信号強度を算出するフィルタリングステップと、
前記フィルタリングステップにおいて算出された前記フィルタリング後の信号強度の画素で構成される画像信号を出力する出力ステップと、
を含む画像フィルタリング方法。 - 画像信号に対してフィルタリングを行う画像フィルタリングプログラムであって、
コンピュータを、
画像信号を入力する入力手段と、
前記入力手段により入力された前記画像信号を構成する画素のうち着目画素の信号強度と該着目画素の周囲の画素の信号強度との差に重みづけを行い、重みづけを行った着目画素の信号強度と該着目画素の周囲の画素の信号強度との差を足しあわせた値に設定された係数γを掛け合わせた値と該着目画素の信号強度とを足し合わすことで、該着目画素のフィルタリング後の信号強度を算出するフィルタリング手段と、
前記フィルタリング手段によって算出された前記フィルタリング後の信号強度の画素で構成される画像信号を出力する出力手段、
として動作させる画像フィルタリングプログラム。
Priority Applications (1)
| Application Number | Priority Date | Filing Date | Title |
|---|---|---|---|
| JP2014519887A JP6172641B2 (ja) | 2012-06-05 | 2013-05-02 | 画像フィルタリング装置、画像フィルタリング方法及び画像フィルタリングプログラム |
Applications Claiming Priority (2)
| Application Number | Priority Date | Filing Date | Title |
|---|---|---|---|
| JP2012128012 | 2012-06-05 | ||
| JP2012-128012 | 2012-06-05 |
Publications (1)
| Publication Number | Publication Date |
|---|---|
| WO2013183391A1 true WO2013183391A1 (ja) | 2013-12-12 |
Family
ID=49711792
Family Applications (1)
| Application Number | Title | Priority Date | Filing Date |
|---|---|---|---|
| PCT/JP2013/062769 Ceased WO2013183391A1 (ja) | 2012-06-05 | 2013-05-02 | 画像フィルタリング装置、画像フィルタリング方法及び画像フィルタリングプログラム |
Country Status (2)
| Country | Link |
|---|---|
| JP (1) | JP6172641B2 (ja) |
| WO (1) | WO2013183391A1 (ja) |
Cited By (2)
| Publication number | Priority date | Publication date | Assignee | Title |
|---|---|---|---|---|
| KR101926269B1 (ko) * | 2017-08-04 | 2018-12-06 | 한양대학교 산학협력단 | 양방향 필터를 이용한 입력 영상의 잡음 제거 방법 및 그 장치 |
| CN112215758A (zh) * | 2019-07-11 | 2021-01-12 | 瑞昱半导体股份有限公司 | 基于信噪比的去噪声方法 |
Citations (2)
| Publication number | Priority date | Publication date | Assignee | Title |
|---|---|---|---|---|
| JP2006033473A (ja) * | 2004-07-16 | 2006-02-02 | Nikon Corp | 画像処理装置、および画像処理プログラム |
| JP2010178302A (ja) * | 2009-02-02 | 2010-08-12 | Olympus Corp | 画像処理装置及び画像処理方法 |
-
2013
- 2013-05-02 WO PCT/JP2013/062769 patent/WO2013183391A1/ja not_active Ceased
- 2013-05-02 JP JP2014519887A patent/JP6172641B2/ja not_active Expired - Fee Related
Patent Citations (2)
| Publication number | Priority date | Publication date | Assignee | Title |
|---|---|---|---|---|
| JP2006033473A (ja) * | 2004-07-16 | 2006-02-02 | Nikon Corp | 画像処理装置、および画像処理プログラム |
| JP2010178302A (ja) * | 2009-02-02 | 2010-08-12 | Olympus Corp | 画像処理装置及び画像処理方法 |
Cited By (3)
| Publication number | Priority date | Publication date | Assignee | Title |
|---|---|---|---|---|
| KR101926269B1 (ko) * | 2017-08-04 | 2018-12-06 | 한양대학교 산학협력단 | 양방향 필터를 이용한 입력 영상의 잡음 제거 방법 및 그 장치 |
| CN112215758A (zh) * | 2019-07-11 | 2021-01-12 | 瑞昱半导体股份有限公司 | 基于信噪比的去噪声方法 |
| CN112215758B (zh) * | 2019-07-11 | 2023-10-10 | 瑞昱半导体股份有限公司 | 基于信噪比的去噪声方法 |
Also Published As
| Publication number | Publication date |
|---|---|
| JPWO2013183391A1 (ja) | 2016-01-28 |
| JP6172641B2 (ja) | 2017-08-02 |
Similar Documents
| Publication | Publication Date | Title |
|---|---|---|
| Fu et al. | Retinex-based perceptual contrast enhancement in images using luminance adaptation | |
| US8711249B2 (en) | Method of and apparatus for image denoising | |
| EP2801188B1 (en) | Image processing apparatus, imaging device, image processing method, and computer-readable recording medium | |
| JP4645921B2 (ja) | 画像信号処理装置および方法、プログラム、並びに撮像装置 | |
| US9445022B2 (en) | Image processing apparatus and image processing method, and program | |
| US10452922B2 (en) | IR or thermal image enhancement method based on background information for video analysis | |
| US20170070718A1 (en) | Advanced Multi-Band Noise Reduction | |
| US20180053289A1 (en) | Method and system for real-time noise removal and image enhancement of high-dynamic range images | |
| CN116681606B (zh) | 一种水下不均匀光照图像增强方法、系统、设备及介质 | |
| JP6097588B2 (ja) | 画像処理装置及び画像処理方法 | |
| US9153013B2 (en) | Image processing apparatus, image processing method and computer readable medium | |
| US7327504B2 (en) | Method of detecting clipped image pixels | |
| JP2004005675A (ja) | 勾配解析を利用したデジタル画像のノイズ予測方法 | |
| JP2012023455A (ja) | 画像処理装置、画像処理方法、及びプログラム | |
| US20060056722A1 (en) | Edge preserving method and apparatus for image processing | |
| CN117197111B (zh) | 一种显示器缺陷检测方法、装置、计算机设备及存储介质 | |
| JP6172641B2 (ja) | 画像フィルタリング装置、画像フィルタリング方法及び画像フィルタリングプログラム | |
| JP6161847B1 (ja) | 画像処理装置及び画像処理方法 | |
| JP2018160024A (ja) | 画像処理装置、画像処理方法及びプログラム | |
| JP5810778B2 (ja) | 画像処理装置および画像処理方法 | |
| JP2020021314A (ja) | 画像処理装置及び画像処理方法 | |
| Burns | Image quality concepts | |
| KR20100027888A (ko) | 레티넥스 기법을 이용한 영상처리방법 | |
| CN117218015B (zh) | 图像增强方法、终端设备及存储介质 | |
| JP2009272746A (ja) | 画像処理装置、撮像装置及び画像処理方法 |
Legal Events
| Date | Code | Title | Description |
|---|---|---|---|
| 121 | Ep: the epo has been informed by wipo that ep was designated in this application |
Ref document number: 13800707 Country of ref document: EP Kind code of ref document: A1 |
|
| ENP | Entry into the national phase |
Ref document number: 2014519887 Country of ref document: JP Kind code of ref document: A |
|
| NENP | Non-entry into the national phase |
Ref country code: DE |
|
| 122 | Ep: pct application non-entry in european phase |
Ref document number: 13800707 Country of ref document: EP Kind code of ref document: A1 |