WO2012165158A1 - ガス検知位置の配置の決定を支援するための装置および記録媒体、ならびに、ガス検知位置の設定支援方法 - Google Patents
ガス検知位置の配置の決定を支援するための装置および記録媒体、ならびに、ガス検知位置の設定支援方法 Download PDFInfo
- Publication number
- WO2012165158A1 WO2012165158A1 PCT/JP2012/062628 JP2012062628W WO2012165158A1 WO 2012165158 A1 WO2012165158 A1 WO 2012165158A1 JP 2012062628 W JP2012062628 W JP 2012062628W WO 2012165158 A1 WO2012165158 A1 WO 2012165158A1
- Authority
- WO
- WIPO (PCT)
- Prior art keywords
- gas
- flow rate
- concentration
- simulation
- conditions
- Prior art date
- Legal status (The legal status is an assumption and is not a legal conclusion. Google has not performed a legal analysis and makes no representation as to the accuracy of the status listed.)
- Ceased
Links
Images






Classifications
-
- G—PHYSICS
- G01—MEASURING; TESTING
- G01M—TESTING STATIC OR DYNAMIC BALANCE OF MACHINES OR STRUCTURES; TESTING OF STRUCTURES OR APPARATUS, NOT OTHERWISE PROVIDED FOR
- G01M3/00—Investigating fluid-tightness of structures
- G01M3/02—Investigating fluid-tightness of structures by using fluid or vacuum
- G01M3/04—Investigating fluid-tightness of structures by using fluid or vacuum by detecting the presence of fluid at the leakage point
- G01M3/20—Investigating fluid-tightness of structures by using fluid or vacuum by detecting the presence of fluid at the leakage point using special tracer materials, e.g. dye, fluorescent material, radioactive material
-
- G—PHYSICS
- G01—MEASURING; TESTING
- G01M—TESTING STATIC OR DYNAMIC BALANCE OF MACHINES OR STRUCTURES; TESTING OF STRUCTURES OR APPARATUS, NOT OTHERWISE PROVIDED FOR
- G01M3/00—Investigating fluid-tightness of structures
- G01M3/02—Investigating fluid-tightness of structures by using fluid or vacuum
- G01M3/26—Investigating fluid-tightness of structures by using fluid or vacuum by measuring rate of loss or gain of fluid, e.g. by pressure-responsive devices, by flow detectors
Definitions
- the present invention relates to support for determining the arrangement of gas detection positions.
- Patent Document 1 Japanese Patent Laid-Open No. 06-26972 discloses a technique for detecting a gas leakage position using a plurality of gas detectors.
- gas detectors having directivity are positioned at at least two points apart from each other, and each gas detector is rotated and scanned in the horizontal direction to obtain the gas concentration distribution in the target area with respect to each scanning angle. taking measurement.
- the gas leakage position detected by the gas detector is detected by detecting the gas leakage position in the target area from each scanning angle corresponding to the concentration increase point in the measured gas concentration distribution and capturing the target area as an image by the camera. Is superimposed on the image.
- Patent Document 2 Japanese Patent Laid-Open No. 07-43241 discloses a technique for obtaining a gas leak position using an anemometer and a gas detector.
- Patent Document 3 Japanese Patent Application Laid-Open No. 08-432359 discloses gas concentration data from a gas detector based on a three-dimensional gas diffusion formula and a wind direction wind speed from a wind direction anemometer installed in the vicinity of the gas detector. A technique for estimating a gas leakage area from data is disclosed.
- detecting the gas concentration at an appropriate position contributes to measures to prevent the gas from diffusing into a specific area, and can minimize the number of gas detectors installed. It is considered important in terms of being able to do so.
- the present invention has been conceived in view of such circumstances, and an object of the present invention is to provide information that assists in determining the installation position of the gas detector in the detection area.
- An apparatus is an apparatus for assisting determination of arrangement of gas detection positions in a detection area.
- the apparatus includes information on an assumed leakage position that is a position where gas leakage is assumed in the detected area, an input unit for receiving input of information on the gas detection position, and information input to the input unit. And an arithmetic device for providing information on the optimal arrangement of the gas detection positions.
- the arithmetic unit calculates the limit discharge flow rate that is the maximum flow rate that does not reach the allowable concentration outside the detected area when there is a gas leak in the detected area when the flow rate is about gas.
- the method for supporting the setting of the gas detection position according to another aspect of the present invention is executed in a computer for supporting the determination of the arrangement of the gas detection position in the detected area.
- the computer has a step of accepting input of information on an assumed leakage position, which is a position where gas leakage is assumed in the detected area, and a flow rate of the gas, and the gas leaked in the detected area.
- a limit discharge flow rate that is a maximum flow rate that does not reach an allowable concentration outside the detection area, a step of receiving input of information on a gas detection position, and a limit discharge flow rate at a leak assumed position.
- the recording medium non-temporarily records a computer-executable program for supporting the determination of the arrangement of the gas detection positions in the detection area.
- the program accepts the input of information on the assumed leakage position, which is a position where gas leakage is assumed in the detected area, to the computer, and the flow rate of the gas, and the gas leakage in the detected area is detected.
- a step of calculating a limit discharge flow rate that is a maximum flow rate that does not reach an allowable concentration outside the detection area a step of receiving input of information on the gas detection position, and a limit release at a leak assumed position For each condition based on the step of executing the simulation of the gas concentration distribution in the detected area for each of a plurality of conditions and the concentration distribution obtained in the simulation when there is a leak of gas at a flow rate Calculates and presents the number of gas detection positions that have received an input and detects a gas with a specific concentration or higher To perform the steps.
- the program causes the computer to further execute a step of presenting an arrangement of gas detection positions where a gas having a specific concentration or more is detected at a specific number or more of positions under any of a plurality of conditions.
- the method includes the step of changing or increasing the number of gas detection positions.
- the step of calculating the limit discharge flow rate includes a simulation of gas diffusion under two or more conditions with different wind directions.
- the step of calculating the limit discharge flow rate includes a simulation of gas diffusion under two or more conditions with different wind speeds.
- the step of calculating the limit discharge flow rate includes a simulation of gas diffusion under two or more conditions with different atmospheric stability.
- the step of calculating the limit discharge flow rate includes a simulation of gas diffusion under two or more conditions with different atmospheric temperatures.
- the step of calculating the limit emission flow rate includes a simulation of gas diffusion under two or more conditions in which radiant heat from the sun is different.
- the step of calculating the limit discharge flow rate includes a simulation of gas diffusion under two or more conditions with different ground surface roughness.
- the diffusion simulation is executed for each of a plurality of conditions regarding the gas leakage at the assumed leakage position, and the concentration distribution of the gas is obtained. For each condition, the number of positions where a gas having a specific concentration or higher is detected among the input gas detection positions is presented.
- FIG. 1 is a hardware block diagram of a computer in which a program for determining an optimum arrangement executed in the embodiment of the present invention is installed.
- a computer 100 includes a computer main body 101 on which a CD-ROM (Compact Disk-Read Only Memory) driving device 113 is mounted, a monitor 102, a keyboard 103, and a mouse 104.
- CD-ROM Compact Disk-Read Only Memory
- the computer main body 101 communicates with a CPU (Central Processing Unit) 105, a memory 106, and a fixed disk 107, which is a storage device, connected to each other via a bus. Interface 109.
- CPU Central Processing Unit
- the diffusion simulation process according to the present embodiment is realized by the CPU 105 executing a program using computer hardware such as the memory 106.
- a program is stored in a storage medium such as the CD-ROM 114 or distributed via a network or the like.
- Such a program is read from a storage medium by the CD-ROM driving device 113 or the like or received by the communication interface 109 and stored in the fixed disk 107. Further, such a program is read from the fixed disk 107 to the memory 106 and executed by the CPU 105.
- the storage medium is not limited to a CD-ROM.
- Other examples of storage media include DVD-ROM (Digital Versatile Disk-Read Only Memory), USB (Universal Serial Bus) memory, memory card, FD (Flexible Disk), hard disk, magnetic tape, cassette tape, MO (Magnetic Non-volatile programs such as Optical Disc), MD (Mini Disc), IC (Integrated Circuit) card (excluding memory card), optical card, mask ROM, EPROM, EEPROM (Electronically Erasable Programmable Read-Only Memory) are stored. Media to be used.
- the CPU 105 is an arithmetic processing unit that performs various numerical logic operations, and provides a control function according to the present embodiment by sequentially executing programmed instructions.
- the memory 106 stores various information according to the program execution of the CPU 105.
- the monitor 102 is a display unit for displaying information output by the CPU 105, and includes, for example, an LCD (Liquid Crystal Display) or a CRT (Cathode Ray Tube). That is, the simulation result and the like are displayed on the monitor 102.
- LCD Liquid Crystal Display
- CRT Cathode Ray Tube
- the mouse 104 receives a command from the user according to an operation such as click or slide.
- the keyboard 103 receives a command from the user corresponding to the input key.
- the communication interface 109 is a device for establishing communication between the computer 100 and another device, and can accept various data from the outside.
- ⁇ Outline of optimal placement determination process Conventionally, based on the result of atmospheric diffusion simulation, it is generally performed to predict a place where a leaked gas may stay when a gas leak occurs at a specific place. In the present embodiment, the simulation is performed for each of a plurality of conditions (wind direction, wind speed, etc.), and information on the arrangement of the gas detectors is provided using the results. In the present specification, “arrangement of gas detectors” means a combination of installation positions of a plurality of gas detectors.
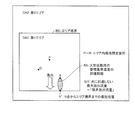
- FIG. 2 is a diagram for explaining an area to be subjected to diffusion simulation in the present embodiment.
- FIG. 3 is a flowchart of a process (optimum arrangement determination process) executed by the CPU 105 to determine an optimal installation position of the gas detector in the present embodiment. In the following, the contents of the optimum arrangement determination process will be described according to the process numbers in FIG.
- step S10 Identification of leak location and initial setting of gas detection position
- target gas two areas having different management levels regarding the concentration of a gas whose concentration is to be detected.
- a first area OA1 having a relatively high management level and a second area OA2 having a management level lower than that of the first area OA1 are set.
- a high management level means that the concentration of gas allowed for the gas of interest is high. That is, in the second area OA2, the concentration of permissible gas is lower for the gas of interest than in the first area OA1.
- the optimum arrangement determining process of the present embodiment is a scale in which when the gas of interest leaks in the first area OA1, the concentration of the gas reaches the upper limit concentration allowed in the second area OA2 in the second area OA2.
- the purpose is to quickly determine whether or not this is a leak.
- an input of a location where the gas of interest is likely to leak (a leak expected location) is accepted.
- a leak expected location three points of P, Q, and R are shown in the first area OA1 as possible leakage points. Note that the number of “presumed leak points” assumed in the present embodiment is not limited to that shown in FIG. It may be singular.
- the junction part of the compressor, pump, reaction equipment, storage tank, and transfer piping which handle gas of interest can be considered, for example.
- an initial setting input regarding the installation position of the device (gas detector) for detecting the concentration of the target gas is received.
- the installation position of the existing gas detector is input as the initial installation position.
- step S20 Next, the critical discharge flow rate in the system to be simulated is determined.
- the limit discharge flow rate is a flow rate assumed for the target gas, and even if the target gas leaks from any location in the first area OA1, the concentration of the target gas in the second area OA2 is the area concerned. This is the maximum flow rate that does not reach the allowable concentration at.
- the calculation method of the limit discharge flow rate will be explained. First, out of the input leakage presumed locations, the one closest to the boundary between the first area OA1 and the second area OA2 (area boundary BD in FIG. 2) is selected. Next, a diffusion simulation is performed a plurality of times while changing the flow rate of the gas of interest at the selected leakage assumed location. Note that in a plurality of simulations, the flow rate of the gas of interest and the weather conditions (wind speed, atmospheric temperature, atmospheric stability, etc.) are changed. In addition, the wind direction used for the simulation is a direction from the selected leak assumed location toward the point at the shortest distance from the assumed leak location on the boundary BD. Then, in the plurality of simulations, the flow rate of the target gas when the concentration of the target gas at the boundary BD becomes an allowable concentration is acquired as the limit discharge flow rate.
- the assumed leakage point closest to the boundary BD is the point R.
- the reachable range toward the area boundary BD due to atmospheric diffusion of the gas is indicated by RA.
- the point closest to the point R on the boundary BD is indicated as the point R ′.
- the diffusion simulation for the target gas is executed a plurality of times while changing the flow rate of the target gas at the point R. In the plurality of simulations, the direction from the point R to the point R ′ is adopted as the wind direction.
- the flow rate (kg / kg) of the target gas at the point R when the concentration of the target gas at the point R ′ becomes DS1 (ppm). min) is the critical discharge flow rate of the gas of interest.
- TRACE registered trademark
- SAFER Systems USA
- step S30 Examination of validity of limit discharge flow rate (step S30)
- the limit discharge flow rate is a value obtained irrespective of actual process conditions (temperature, pressure, etc.) and the diameter of the pipe at the assumed leakage location. Therefore, for example, when the flow rate of the target gas when the piping of the target gas is completely broken is estimated, the flow rate at which the calculated limit discharge flow rate cannot actually occur, for example, the estimated flow rate is smaller than the limit discharge flow rate. May also occur.
- the processing after step S40 is executed.
- the processing after step S40 is not executed.
- step S40 For each of a plurality of diffusion simulations performed by changing the weather conditions, the number and position of gas detectors capable of detecting a concentration higher than a specific concentration are specified. Specifically, the following procedure is performed.
- a diffusion simulation is carried out by changing the wind direction from the estimated leakage locations using the above-mentioned limit discharge flow rate as the discharge flow rate.
- the conditions at the time when the critical discharge flow rate is obtained are used as fixed values, but diffusion simulations with different values may be performed. Diffusion simulation is performed for each possible leak location. In other words, when there are two possible leak locations and four sets of weather conditions for the simulation are prepared, the diffusion simulation is executed four times, that is, eight times for each of the two locations.
- the concentration of the gas detected at the installation position of the gas detector that received the input in step S10 is specified.
- the specification of the concentration is realized by, for example, specifying the gas concentration in the result of the diffusion simulation at the position corresponding to the installation position of each gas detector. That is, the gas concentration at the installation position in the simulation result is the concentration at which the gas detector installed at the position detects the gas.
- concentration of the gas in each installation position is obtained for every one diffusion simulation.
- the number of gas detectors estimated to be able to detect a gas having a specific concentration or higher is specified.
- step S50 Confirmation of leakage detection with a predetermined number or more of gas detectors.
- the gas detector installation position it is determined for all diffusion simulation results whether or not leakage of the gas of interest has been detected by a sufficient number of gas detectors. More specifically, for example, it is determined whether or not the number of gas detectors that have been able to detect a gas having a specific concentration or more specified in step S40 is a specific number or more for all diffusion simulation results.
- step S60 when it is determined that the installation position of the gas detector is not appropriate, that is, for at least one diffusion simulation result, the number of gas detectors that can detect a specific gas concentration was less than the specific number. In that case, the process proceeds to step S60.
- step S60 Changing the installation position of the gas detector (step S60)
- the CPU 105 changes the arrangement of the gas detector and returns the process to step S40.
- step S60 the CPU 105 changes the arrangement of the gas detectors to other combinations of the installation positions of the plurality of gas detectors considered in the first area OA1.
- step S10 the number of gas detectors whose installation positions are input in step S10 is 1
- step S60 the CPU 105 moves the gas detector to another possible installation position in the first area OA1. Change the installation position of the detector.
- the initial arrangement input of the gas detector can be accepted. Then, it is determined whether or not the arrangement is appropriate. If it is determined to be appropriate, a message to that effect is displayed. On the other hand, if it is determined that it is not appropriate, a change is made to the arrangement, and it is determined whether or not the changed arrangement is appropriate.
- FIG. 4 collectively shows conditions (wind direction and discharge point) to be changed in the simulation for an area to be disposed of the gas detector.
- a boundary BD1 corresponding to the boundary BD of FIG. 2 is indicated by a broken line.
- the inside of the boundary BD1 is an area where the gas detector is to be arranged, and corresponds to the first area OA1 in FIG.
- buildings, equipment, liquid breakwaters, and the like are shown in the boundary BD1 in the same arrangement as the actual region to be simulated.
- FIG. 4 the figure corresponding to the actual building about the area used as the object of a diffusion simulation is shown inside boundary BD1. Further, in FIG. 4, a leak-presumed portion is indicated by a square mark in which characters A to C are written. Furthermore, in FIG. 4, the installation positions of the eight gas detectors are indicated by circular marks with numbers 1 to 8 written therein. In the present specification, each gas detector is referred to as “No. 1 gas detector”, “No. 2 gas detector”, or the like, using numerals attached to the inside.
- the information for specifying the actual building position and shape, the assumed leakage location, and the installation position of the gas detector are input to the computer 100 via the keyboard 103 and the mouse 104, for example.
- FIG. 4 shows only a part of the boundary BD1.
- a region that is assumed to be the location of the gas detector inside the boundary BD1 is indicated by a wavy line as a region PT.
- the limit discharge flow rate for the point B is calculated.
- the limit discharge flow rate depends on the actual process conditions and the pipe diameter of the assumed leakage point. Based on the above, it is determined whether the flow rate can be assumed in the system to be simulated.
- the CPU 105 sends a message to the monitor 102 (for example, in the target system, even if the gas of interest leaks at the leaked location, the concentration of the gas does not exceed the allowable concentration outside the boundary BD1. It is assumed that a message indicating that the simulation is unnecessary may be displayed.
- step S40 determines that the limit discharge flow rate calculated as described above is a flow rate that can be assumed in the system to be simulated.
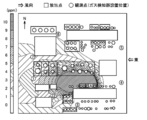
- FIG. 5 and FIG. 6 are diagrams showing examples of the results of simulations executed under different conditions.
- FIG. 5 and 6 show the wind direction, the discharge point (leakage point), and the detection position by the gas detector.
- FIG. 4 a plurality of wind directions are shown.
- diffusion simulation is executed as a different condition for each wind direction indicated in this way. In FIG. 4, these different conditions are shown together.
- FIG. 5 shows an example of a diffusion simulation result when leakage occurs at the leakage assumed location indicated by C.
- FIG. 6 shows gas leakage at the leakage assumed location indicated by A in FIG. It is a figure which shows an example of the result of the diffusion simulation when it generate
- the assumed concentration distribution of the target gas is indicated by the type of hatching.
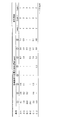
- FIG. 7 shows the maximum detected concentration at each observation point (installation position) for each diffusion simulation executed under different conditions.
- the maximum detected concentration is the concentration of gas detected at the installation position of each gas detector specified in step S40.
- FIG. 7 shows six types of conditions, “A-1,” “A-2,” “B-1,” “B-2,” “C-1,” and “C-2.”
- the observation point means a position input as an installation position of the gas detector indicated by circles 1 to 8 in FIGS.
- the simulation result in FIG. 5 corresponds to the condition C-2 in FIG. 7, and the simulation result in FIG. 6 corresponds to the condition A-1 in FIG.
- the maximum detected concentration of the first gas detector is 4.1 (ppm).
- the maximum detected densities of No. 2 to No. 8 are sequentially set to “2.8”, “0.6”, “ ⁇ ”, “ ⁇ ”, “0.7”, “2.6”, and “1.5”. . These units are “ppm”.
- “ ⁇ ” means that the maximum detected concentration is less than 0.1 ppm.
- the maximum detected concentration is the gas concentration of the gas of interest in the diffusion simulation at the installation position of each gas detector.
- an item of the number of detectors is further provided.
- the number of detectors for each concentration of 1 ppm, 2 ppm, and 3 ppm, the number of detectors whose maximum detection concentration is greater than or equal to each concentration among the detectors from No. 1 to 8 is described for each simulation condition. .
- the number of detectors that are predicted to detect a concentration of 1 ppm or more is “4”. This is the number of gas detectors No. 1, No. 2, No. 7, and No. 8 that have a maximum detection concentration of 1 ppm or more for the condition “A-1”. Correspondingly, the number of detectors of 1 ppm or more in the condition “A-1” is set to “4”.
- the number of detectors of 2 ppm or more under the condition “A-1” is set to “3”.
- the gas detector having a maximum detection concentration of 3 ppm or more is only No. 1. Thereby, in FIG. 7, the number of detectors of 3 ppm is set to “1”.
- step S50 Confirmation of Leakage Detection with a Predetermined Number of Gas Detectors
- the confirmation process in step S50 is performed for each condition as shown in FIG. This is done using the maximum detected concentration predicted for each gas detector.
- the description will be given by taking the case where the “specific number” is “2” as an example.
- the “specific gas concentration” is “1 ppm”
- the arrangement of the gas detectors corresponding to FIG. 7 is appropriate. This is because the number of detectors at 1 ppm is 2 or more for all of the conditions “A-1” to “C-2”.
- the “specific gas concentration” is set to “2 ppm”
- the arrangement of the gas detectors corresponding to FIG. 7 is determined to be appropriate. This is because the number of detectors at 2 ppm is 2 or more for all six conditions “A-1” to “C-2”.
- FIGS. 8 and 9 are diagrams showing the results of diffusion simulation corresponding to FIGS. 5 and 6, respectively. 8 and 9, the position of the second gas detector is changed upward from the arrangement of the gas detectors shown in FIGS. 5 and 6. This change depends on the processing result in step S60. In FIG. 8 and FIG. 9, in order to show such a change in position, the second gas detection circle is indicated by “′”.
- FIG. 10 is a diagram showing the maximum detected concentration at each observation point under each simulation condition corresponding to the arrangement of the gas detectors shown in FIG. 8 or FIG.
- the maximum detected concentration and the number of detectors in FIG. 10 have the same meanings as those in FIG. 7, and will not be described repeatedly.
- the maximum detection concentrations of the gas detectors No. 1 and Nos. 3 to 7 are the same as those of FIG.
- the maximum detected concentration of the No. 2 (No. 2 ') gas detector changes from that shown in FIG. This is because, as shown in FIGS. 8 and 9, the installation position of the second gas detector is changed from the position shown in FIG. 5 or FIG. 6.
- the number of detectors of 3 ppm is “2” or more for all simulation conditions. Therefore, it is determined that the arrangement of the gas detector corresponding to FIG. 7 is not appropriate, but the arrangement of the gas detector corresponding to FIG. 10 (the arrangement in which the installation position of the second gas detector is changed) is appropriate. It is judged that.
- the present embodiment it is possible to receive an input of the installation position of the gas detector and determine whether or not the input installation position (a combination thereof) is appropriate.
- the installation position of the gas detector is changed from the input position, and it is determined again whether or not the position of the gas detector after the change is appropriate.
- the number of detectors under each simulation condition is calculated for each of a plurality of “specific gas concentrations” (1 ppm, 2 ppm, 3 ppm). Displayed. It should be noted that the calculation / display of the number of detectors need only be performed for at least one “specific gas concentration”.
- the CPU 105 may propose to increase the number of gas detectors.
- FIG. 11 corresponds to a diagram in which the gas detector No. 8 in FIG. 5 is deleted.
- step S60 the CPU 105 further increases the number of gas detectors by “1”, determines the arrangement of the gas detectors after the increase, and returns the process to step S40. Then, after increasing the number of gas detectors, the CPU 105 repeats the processing from step S40 to step S60 until it is determined that the arrangement is appropriate. Then, for example, when a result as shown in FIG. 9 is obtained, the optimum arrangement determination process is terminated.
- the CPU 105 increases the number of gas detectors by “1” in this way and determines that the arrangement is appropriate no matter how the arrangement of the gas detectors is changed, the number of gas detectors is further increased. Is increased by "1". In this manner, in steps S40 to S60, the CPU 105 increases the number of gas detectors until it determines that the arrangement is appropriate, and changes the arrangement of the gas detector group after the number is increased. .
- the diffusion simulation is performed for the gas of interest at each leakage assumed location with the above-mentioned limit discharge flow rate as the discharge flow rate. Then, based on the gas concentration distribution obtained by the diffusion simulation, it was evaluated whether or not the arrangement of the gas detector that detects the concentration of the gas of interest is appropriate.
- Conditions that can be changed include “wind direction”, “wind speed”, “atmospheric temperature”, “atmospheric stability”, “radiant heat from the sun”, “surface roughness”, and the like.
- At least information for making the determination may be displayed without determining whether or not the arrangement of the input gas detector is appropriate.
- Such information includes, for example, the number of detectors shown in FIG.
- step S40 in FIG. 3 is performed, the number of detectors based on the result of the diffusion simulation as shown in FIG. 7 and the like are displayed, and the user changes the arrangement of the gas detectors by looking at the display. You may make it do.
- step S60 instead of changing the arrangement of the gas detectors, the CPU 105 receives an input from the user for changing the installation position of the gas detectors.
- the above-mentioned TRACE registered trademark
- the above-mentioned TRACE registered trademark
- many cases can be evaluated in a short time.
- obstacles existing in the evaluation area are represented and evaluated by one parameter of surface roughness, if there are relatively large obstacles such as buildings or plant equipment around the leak point, diffusion The result may be very different from the actual result.
- PANEPR a 3D-CFD (three-dimensional thermal fluid analysis) tool manufactured by French Fluids
- a 3D-CFD (three-dimensional thermal fluid analysis) tool manufactured by French Fluids is a three-dimensional CFD tool based on the finite volume method and incorporates three basic equations of fluid and various turbulence models. By doing so, it is possible to reproduce the mechanical turbulent structure around the obstacle. Therefore, diffusion prediction considering the influence of obstacles that cannot be predicted by the normal distribution type diffusion model is possible. However, due to the long calculation time, it is difficult to conduct early evaluation for many cases. When the diffusion distance extends far, the predicted value of the concentration reached at a distance may be less accurate than the predicted value in the normal distribution formula, which is an empirical model, due to the accumulation of calculation errors.
- the calculation result of TRACE (registered trademark) is applied in the determination of the limit discharge flow rate, while the appropriate evaluation of the installation position of the gas detector after step S40 is limited in the model plant.
- the three-dimensional CFD tool (for example, “PANEPR”) may be used for examination.
- 100 computer 101 computer main body, 102 monitor, 103 keyboard, 104 mouse, 105 CPU, 106 memory.
Landscapes
- Physics & Mathematics (AREA)
- General Physics & Mathematics (AREA)
- Examining Or Testing Airtightness (AREA)
Abstract
被検知エリアにおいてガス検知位置の配置の決定を支援するためのコンピュータ(100)は、被検知エリア内においてガスの漏洩が想定される位置である漏洩想定位置の情報、および、ガス検知位置の情報の入力をそれぞれ受け付ける。そして、コンピュータ(100)は、配管を通すガスの流量である、限界放出流量を算出する。限界放出流量は、被検知エリア内でガスの漏洩があった場合に、当該被検知エリア外において許容される濃度に達しない最大の流量である。また、コンピュータ(100)は、漏洩想定位置において限界放出流量のガスの漏洩があった場合の、被検知エリア内でのガスの濃度分布のシミュレーションを、複数の条件のそれぞれについて実行し、当該シミュレーションにおいて得られた濃度分布に基づいて、条件ごとに、入力を受け付けたガス検知位置のうち、特定の濃度以上のガスを検知する位置の数を算出し、提示する。
Description
本発明は、ガス検知位置の配置の決定の支援に関する。
従来から、化学プラントなどにおいて、ガス検知器を単にガス濃度の検知に利用する技術だけでなく、その検知方法に工夫を加えたり、または、検出されたガス濃度の情報に他の情報を加えることにより、ガスの漏洩位置の特定に利用するための技術が種々開示されている。
たとえば、特許文献1(特開平06-26972号公報)には、複数のガス検知器を用いてガスの漏洩位置を検出するための技術が開示されている。当該技術では、指向性を有するガス検知器を距離を隔てた少なくとも2地点に位置させ、それぞれのガス検知器を横方向に回転走査することにより、それぞれの走査角度に対する対象区域のガス濃度分布を測定する。そして、測定したガス濃度分布中の濃度上昇箇所に対応するそれぞれの走査角度から対象区域中のガス漏洩位置を検出すると共に当該対象区域をカメラにより画像としてとらえ、ガス検知器により検出したガス漏洩位置を画像中に重畳して表示する。
また、特許文献2(特開平07-43241号公報)には、風向風速計とガス検知器とを用いて、ガス漏洩位置を求める技術が開示されている。
また、特許文献3(特開平08-43239号公報)には、3次元ガス拡散式に基づいてガス検知器からのガス濃度データおよびガス検知器の近辺に設置された風向き風速計からの風向き風速データからガス漏洩領域を推定する技術が開示されている。
しかしながら、従来の技術では、ガス漏洩領域の特定または推定のために、ガス検知器にどのような検出をさせるか、または、ガス検知器の検出出力をどのように利用するかについては検討がなされていたものの、ガス検知器をどのように配置するかについては、検討がなされていなかった。つまり、従来では、ガス検知器の配置は、たとえば、管理者の経験に基づいて決定されていた。
一方で、適切な位置でガス濃度の検知を行なうことは、ガスの特定の領域への拡散を未然に防止するための対策に寄与したり、ガス検知器の設置数を最小限に抑えることができる等の意味で重要であると考えられる。
本発明は、かかる実情に鑑み考え出されたものであり、その目的は、被検知エリアにおけるガス検知器の設置位置の決定を支援する情報を提供することである。
本発明の或る局面に従った装置は、被検知エリアにおいてガス検知位置の配置の決定を支援するための装置である。当該装置は、被検知エリア内においてガスの漏洩が想定される位置である漏洩想定位置の情報、および、ガス検知位置の情報の入力を受け付けるための入力部と、入力部に入力された情報に基づいて、ガス検知位置の最適な配置の情報を提供するための演算装置とを備える。演算装置は、ガスについての流量であって、被検知エリア内でガスの漏洩があった場合に、当該被検知エリア外において許容される濃度に達しない最大の流量である限界放出流量を算出し、漏洩想定位置において限界放出流量のガスの漏洩があった場合の、被検知エリア内でのガスの濃度分布のシミュレーションを、複数の条件のそれぞれについて実行し、シミュレーションにおいて得られた濃度分布に基づいて、条件ごとに、入力を受け付けたガス検知位置のうち、特定の濃度以上のガスを検知する位置の数を算出し、提示する。
本発明の他の局面に従ったガス検知位置の設定を支援する方法は、被検知エリアにおいてガス検知位置の配置の決定を支援するためのコンピュータにおいて実行される。当該コンピュータは、被検知エリア内においてガスの漏洩が想定される位置である漏洩想定位置の情報の入力を受付けるステップと、ガスについての流量であって、被検知エリア内でガスの漏洩があった場合に、当該被検知エリア外において許容される濃度に達しない最大の流量である限界放出流量を算出するステップと、ガス検知位置の情報の入力を受け付けるステップと、漏洩想定位置において限界放出流量でのガスの漏洩があった場合の、被検知エリア内でのガスの濃度分布のシミュレーションを、異なる2以上の条件のそれぞれについて実行するステップと、シミュレーションにおいて得られた濃度分布に基づいて、条件ごとに、入力を受け付けたガス検知位置のうち、特定の濃度以上のガスを検知する位置の数を算出し、提示するステップとを実行する。
本発明のさらに他の局面に従った記録媒体は、被検知エリアにおいてガス検知位置の配置の決定を支援するためのコンピュータが実行可能なプログラムを非一時的に記録している。プログラムは、コンピュータに、被検知エリア内においてガスの漏洩が想定される位置である漏洩想定位置の情報の入力を受付けるステップと、ガスについての流量であって、被検知エリア内でガスの漏洩があった場合に、当該被検知エリア外において許容される濃度に達しない最大の流量である限界放出流量を算出するステップと、ガス検知位置の情報の入力を受け付けるステップと、漏洩想定位置において限界放出流量のガスの漏洩があった場合の、被検知エリア内でのガスの濃度分布のシミュレーションを、複数の条件のそれぞれについて実行するステップと、シミュレーションにおいて得られた濃度分布に基づいて、条件ごとに、入力を受け付けたガス検知位置のうち、特定の濃度以上のガスを検知する位置の数を算出し、提示するステップとを実行させる。
好ましくは、上記プログラムは、コンピュータに、複数の条件のいずれにおいても、特定の濃度以上のガスが、特定の数以上の位置で検知されるガス検知位置の配置を提示するステップをさらに実行させる。
好ましくは、ガス検知位置の配置を提示するステップは、複数の条件のそれぞれについて実行されたシミュレーションにおいて得られた濃度分布のいずれにおいても、特定の濃度以上のガスが、特定の数以上の位置で検知されるために、ガス検知位置の変更または数を増加させるステップを含む。
好ましくは、限界放出流量を算出するステップは、ガスの拡散についての、風向きが異なる2以上の条件でのシミュレーションを含む。
好ましくは、限界放出流量を算出するステップは、ガスの拡散についての、風速が異なる2以上の条件でのシミュレーションを含む。
好ましくは、限界放出流量を算出するステップは、ガスの拡散についての、大気安定度が異なる2以上の条件でのシミュレーションを含む。
好ましくは、限界放出流量を算出するステップは、ガスの拡散についての、大気温度が異なる2以上の条件でのシミュレーションを含む。
好ましくは、限界放出流量を算出するステップは、ガスの拡散についての、太陽からの放射熱が異なる2以上の条件でのシミュレーションを含む。
好ましくは、限界放出流量を算出するステップは、ガスの拡散についての、地表面粗度が異なる2以上の条件でのシミュレーションを含む。
本発明によれば、漏洩想定位置におけるガスの漏洩に関し、複数の条件のそれぞれについて拡散シミュレーションが実行され、当該ガスの濃度分布が得られる。そして、条件ごとに、入力されたガス検知位置のうち、特定の濃度以上のガスを検知する位置の数が提示される。
これにより、ガスが漏洩した場合に、風向きなどの条件が変わっても常に所定数以上の位置で特定の濃度以上のガスを検知できるような配置を得られる。
本発明の実施の形態について、図面を参照しながら詳細に説明する。なお、図中の同一または相当部分については、同一符号を付してその説明は繰返さない。
<ハードウェア構成>
図1は、本発明の実施の形態において実行される最適配置決定処理のプログラムがインストールされたコンピュータのハードウェアブロック図である。
図1は、本発明の実施の形態において実行される最適配置決定処理のプログラムがインストールされたコンピュータのハードウェアブロック図である。
図1を参照して、コンピュータ100は、CD-ROM(Compact Disk-Read Only Memory)駆動装置113を搭載したコンピュータ本体101と、モニタ102と、キーボード103と、マウス104とを含む。
コンピュータ本体101は、CD-ROM駆動装置113に加えて、相互にバスで接続された、演算装置であるCPU(Central Processing Unit)105と、メモリ106と、記憶装置である固定ディスク107と、通信インターフェース109とを含む。
本実施の形態に従う拡散シミュレーション処理は、CPU105がメモリ106などのコンピュータハードウェアを用いて、プログラムを実行することで実現される。一般的に、このようなプログラムは、CD-ROM114などの記憶媒体に格納されて、またはネットワークなどを介して流通する。そして、このようなプログラムは、CD-ROM駆動装置113などにより記憶媒体から読取られて、または通信インターフェース109にて受信されて、固定ディスク107に格納される。さらに、このようなプログラムは、固定ディスク107からメモリ106に読出されて、CPU105により実行される。
なお、記憶媒体はCD-ROMに限定されない。記憶媒体の他の例としては、DVD-ROM(Digital Versatile Disk - Read Only Memory)、USB(Universal Serial Bus)メモリ、メモリカード、FD(Flexible Disk)、ハードディスク、磁気テープ、カセットテープ、MO(Magnetic Optical Disc)、MD(Mini Disc)、IC(Integrated Circuit)カード(メモリカードを除く)、光カード、マスクROM、EPROM、EEPROM(Electronically Erasable Programmable Read-Only Memory)などの、不揮発的にプログラムを格納する媒体が挙げられる。
CPU105は、様々な数値論理演算を行なう演算処理部であり、プログラムされた命令を順次実行することで、本実施の形態に従う制御機能を提供する。メモリ106は、CPU105のプログラム実行に応じて各種の情報を記憶する。
モニタ102は、CPU105が出力する情報を表示するための表示部であって、一例としてLCD(Liquid Crystal Display)やCRT(Cathode Ray Tube)などから構成される。すなわち、モニタ102には、シミュレーションの結果などが表示される。
マウス104は、クリックやスライドなどの動作に応じたユーザから指令を受付ける。キーボード103は、入力されるキーに応じたユーザから指令を受付ける。
通信インターフェース109は、コンピュータ100と他の装置との間の通信を確立するための装置であり、各種データを外部から受付可能である。
なお、上述したようなコンピュータに代えて、その一部または全部を専用のハードウェアによって実現してもよい。
<最適配置決定処理の概要>
従来より、大気拡散シミュレーションの結果に基づいて、特定の場所でガスの漏洩が生じたときに、漏洩ガスが滞留する可能性のある場所を予測することは一般的に実施されている。本実施の形態では、複数の条件(風向き、風速、等)のそれぞれについて上記シミュレーションを行ない、当該結果を用いて、ガス検知器の配置に関する情報を提供する。なお、本明細書では、「ガス検知器の配置」は、複数のガス検知器の設置位置の組合せを意味する。
従来より、大気拡散シミュレーションの結果に基づいて、特定の場所でガスの漏洩が生じたときに、漏洩ガスが滞留する可能性のある場所を予測することは一般的に実施されている。本実施の形態では、複数の条件(風向き、風速、等)のそれぞれについて上記シミュレーションを行ない、当該結果を用いて、ガス検知器の配置に関する情報を提供する。なお、本明細書では、「ガス検知器の配置」は、複数のガス検知器の設置位置の組合せを意味する。
本実施の形態において、ガス検知器の配置に関する情報の提供の際に実施される処理の概要を、図2および図3を参照して以下に説明する。図2は、本実施の形態における拡散シミュレーションの対象となるエリアを説明するための図である。図3は、本実施の形態において、CPU105が、ガス検知器の最適な設置位置を決定するために実行する処理(最適配置決定処理)のフローチャートである。以下、図3中の処理番号に従って、最適配置決定処理の内容を説明する。
1) 漏洩箇所の特定およびガス検知位置の初期設定(ステップS10)
本実施の形態では、まず、濃度検出の対象となるガス(以下、「着目ガス」という)の濃度についての管理レベルが異なる2つのエリアを想定する。具体的には、図2に示すように、管理レベルが比較的高い第1エリアOA1と、第1エリアOA1よりも管理レベルが低い第2エリアOA2とが、設定される。なお、管理レベルが高いとは、着目ガスについて許容されるガスの濃度が高いことを意味する。つまり、第2エリアOA2は、第1エリアOA1よりも、着目ガスについて、許容されるガスの濃度が低い。そして、本実施の形態の最適配置決定処理は、第1エリアOA1内で着目ガスが漏洩した際、第2エリアOA2において当該ガスの濃度が当該第2エリアOA2で許容される上限濃度に達する規模の漏洩であるか否かを迅速に判断することを目的としている。
本実施の形態では、まず、濃度検出の対象となるガス(以下、「着目ガス」という)の濃度についての管理レベルが異なる2つのエリアを想定する。具体的には、図2に示すように、管理レベルが比較的高い第1エリアOA1と、第1エリアOA1よりも管理レベルが低い第2エリアOA2とが、設定される。なお、管理レベルが高いとは、着目ガスについて許容されるガスの濃度が高いことを意味する。つまり、第2エリアOA2は、第1エリアOA1よりも、着目ガスについて、許容されるガスの濃度が低い。そして、本実施の形態の最適配置決定処理は、第1エリアOA1内で着目ガスが漏洩した際、第2エリアOA2において当該ガスの濃度が当該第2エリアOA2で許容される上限濃度に達する規模の漏洩であるか否かを迅速に判断することを目的としている。
次に、第1エリアOA1において、着目ガスの漏洩しやすい箇所(漏洩想定箇所)の入力を受け付ける。図2では、第1エリアOA1内に、漏洩想定箇所として、P,Q,Rの3点が示されている。なお、本実施の形態において想定される「漏洩想定箇所」の数は、図2に示されたものに限定されない。単数であっても良い。なお、漏洩想定箇所としては、たとえば、着目ガスを取り扱う圧縮器、ポンプ、反応設備、貯槽、移送配管の接合部が考えられる。
次に、第1エリアOA1において、上記の着目ガスの濃度を検知する機器(ガス検知器)の設置位置についての初期設定の入力を受け付ける。たとえば、既設のガス検知器の設置位置が、初期設定の設置位置として入力される。
2) 「限界放出流量」の決定(ステップS20)
次に、シミュレーションの対象となるシステムにおける、限界放出流量を決定する。
次に、シミュレーションの対象となるシステムにおける、限界放出流量を決定する。
ここで、限界放出流量とは、着目ガスについて想定される流量であって、第1エリアOA1内のいずれの箇所から着目ガスが漏洩しても、第2エリアOA2において着目ガスの濃度が当該エリアにおける許容濃度に到達しない最大の流量である。
限界放出流量の算出方法について、説明する。まず、入力された漏洩想定箇所のうち、第1エリアOA1と第2エリアOA2の境界(図2のエリア境界BD)に最も近いものを選択する。次に、選択された漏洩想定箇所における着目ガスの流量を変化させながら、複数回、拡散シミュレーションを行なう。なお、複数回のシミュレーションでは、着目ガスの流量および気象条件(風速、大気温度、大気安定度、など)が変更される。また、シミュレーションに使用される風向きは、上記選択された漏洩想定箇所から、境界BD上の当該漏洩想定箇所から最短距離にある点に向かう向きである。そして、当該複数回のシミュレーションの中で、上記境界BDにおける着目ガスの濃度が許容濃度となるときの着目ガスの流量が、限界放出流量として取得される。
図2の例では、境界BDに最も近い漏洩想定箇所は、点Rである。図2では、点Rにおいてガスが漏洩した場合、当該ガスの大気拡散によるエリア境界BDに向けての到達範囲がRAで示されている。そして、図2の例では、境界BDにおいて最も点Rに近い点が点R’として示されている。限界放出流量の算出のために、点Rにおける着目ガスの流量を変化させながら、複数回、着目ガスについての拡散シミュレーションが実行される。なお、当該複数回のシミュレーションにおいて、風向きとしては、点Rから点R’に向かう向きが採用される。たとえば、第2エリアOA2における着目ガスの許容濃度がDS1(ppm)である場合、点R’の着目ガスの濃度がDS1(ppm)になったときの、点Rにおける着目ガスの流量(kg/min)が、着目ガスの限界放出流量である。
なお、拡散シミュレーションには、米国SAFER Systems社製の正規分布型拡散モデル内蔵ツールであるTRACE(登録商標)など、公知の技術を利用することができるため、ここでは詳細な説明は繰り返さない。
3) 限界放出流量の妥当性の検討(ステップS30)
限界放出流量は、実際のプロセス条件(温度、圧力、等)や漏洩想定箇所の配管の口径とは無関係に求められた値である。したがって、たとえば、着目ガスの配管が全破断したときの着目ガスの流量を推定した場合、当該推定した流量が限界放出流量よりも小さい等、算出された限界放出流量が現実に発生し得ない流量である場合も生じ得る。
限界放出流量は、実際のプロセス条件(温度、圧力、等)や漏洩想定箇所の配管の口径とは無関係に求められた値である。したがって、たとえば、着目ガスの配管が全破断したときの着目ガスの流量を推定した場合、当該推定した流量が限界放出流量よりも小さい等、算出された限界放出流量が現実に発生し得ない流量である場合も生じ得る。
このことから、本実施の形態では、限界放出流量の妥当性の検討として、当該流量が、シミュレーションの対象となるシステムにおいて想定され得る流量であるか否かが判断される。想定され得ると判断された場合(たとえば、限界放出流量が上記想定され得る流量の最大値以下である場合)には、ステップS40以降の処理が実行される。一方、想定し得ない流量である場合(たとえば、限界放出流量が上記想定され得る流量の最大値を超える場合)には、ステップS40以降の処理は実行されない。
4) ガス検知器設置位置の適正評価(ステップS40)
気象条件を変えて行なわれる複数の拡散シミュレーションのそれぞれについて、特定の濃度以上の濃度を検出できるガス検出器の数および位置が特定される。具体的には、以下に示す手順が行なわれる。
気象条件を変えて行なわれる複数の拡散シミュレーションのそれぞれについて、特定の濃度以上の濃度を検出できるガス検出器の数および位置が特定される。具体的には、以下に示す手順が行なわれる。
まず、各漏洩想定箇所から前述の限界放出流量を放出流量として、風向を変えた拡散シミュレーションを実施する。風向以外の気象条件(風速、大気温度、大気安定度など)については、限界放出流量が得られた際の条件を固定値として使用するが、値を変えた拡散シミュレーションを実施しても良い。拡散シミュレーションは、漏洩想定箇所ごとに、行なわれる。つまり、漏洩想定箇所が2箇所あり、シミュレーションについての気象条件の組が4組準備された場合には、拡散シミュレーションは、2箇所のそれぞれについて4回、つまり、8回実行される。
そして、各拡散シミュレーションの結果(着目ガスの濃度分布)に基づいて、ステップS10で入力を受け付けたガス検知器の設置位置において検知される当該ガスの濃度を特定する。当該濃度の特定は、たとえば、各ガス検知器の設置位置に対応する位置の、拡散シミュレーションの結果におけるガス濃度を特定することによって実現される。つまり、シミュレーション結果における設置位置のガス濃度が、当該位置に設置されたガス検知器がガスを検知する濃度である。これにより、1回の拡散シミュレーションごとに、各設置位置でのガスの検知濃度の推定値が得られる。
そして、各拡散シミュレーションの結果について、特定の濃度以上のガスを検知できると推定されたガス検知器の数が特定される。
5) 所定数以上のガス検知器での漏洩検知の可否の確認(ステップS50)
ガス検知器設置位置が適正か否かを判断するために、すべての拡散シミュレーション結果について、十分な数のガス検知器で着目ガスの漏洩を検知できたか否かを判断する。より具体的には、たとえば、ステップS40において特定した、特定の濃度以上のガスを検知できたガス検知器の数が、すべての拡散シミュレーション結果について、特定の数以上であったか否かを判断する。
ガス検知器設置位置が適正か否かを判断するために、すべての拡散シミュレーション結果について、十分な数のガス検知器で着目ガスの漏洩を検知できたか否かを判断する。より具体的には、たとえば、ステップS40において特定した、特定の濃度以上のガスを検知できたガス検知器の数が、すべての拡散シミュレーション結果について、特定の数以上であったか否かを判断する。
そして、ガス検知器設置位置が適正であると判断した場合、つまり、すべての拡散シミュレーション結果について特定のガス濃度を特定の数以上のガス検知器で検出できると判断された場合には、現在の配置が適正である旨を示す処理(そのようなメッセージをモニタ102に表示する、等)を実行して、処理を終了する。
一方、ガス検知器の設置位置が適正ではないと判断した場合、つまり、少なくとも1つの拡散シミュレーション結果について、特定のガス濃度を検知できるとされたガス検知器の数が特定の数未満であった場合には、ステップS60へ処理が進められる。
6) ガス検知器の設置位置の変更(ステップS60)
ガス検知器の設置位置が適正ではないと判断すると、CPU105は、ガス検知器の配置を変更して、ステップS40へ処理を戻す。
ガス検知器の設置位置が適正ではないと判断すると、CPU105は、ガス検知器の配置を変更して、ステップS40へ処理を戻す。
なお、ステップS60が繰り返されるたびに、CPU105は、第1エリアOA1内で考えられる複数のガス検知器の設置位置の他の組合せへと、ガス検知器の配置を変更する。また、ステップS10において設置位置を入力されたガス検知器の数が1である場合には、CPU105は、ステップS60が繰り返されるたびに、第1エリアOA1内で考えられる別の設置位置に、ガス検知器の設置位置を変更する。
以上、主に図3を参照して説明したように、最適配置決定処理では、ガス検知器の初期の配置の入力を受け付けられる。そして、当該配置が適切か否かが判断される。そして、適切であると判断されれば、その旨が表示される。一方、適切ではないと判断された場合には、配置に変更が加えられ、変更後の配置が適切であるか否かが判断される。
<最適配置決定処理の具体例>
次に、最適配置決定処理の具体例について説明する。
次に、最適配置決定処理の具体例について説明する。
1) 漏洩箇所の特定およびガス検知位置の初期設定
図4には、ガス検知器の配置の対象となるエリアについて、シミュレーションにおいて変更される条件(風向きや放出点)がまとめて記載されている。
図4には、ガス検知器の配置の対象となるエリアについて、シミュレーションにおいて変更される条件(風向きや放出点)がまとめて記載されている。
図4では、図2の境界BDに相当する境界BD1が、破線で示されている。図4において境界BD1の内部が、ガス検知器の配置の対象となるエリアであり、図2の第1エリアOA1に対応する。また、図4では、境界BD1内に、シミュレーションの対象となる実際の領域と同様の配置で、建物や機器、防液堤などが示されている。
そして、図4では、境界BD1の内部に、拡散シミュレーションの対象となるエリアについての、実際の建物に対応した図形が示されている。また、図4では、内部にA~Cの文字を記載された四角形の印により、漏洩想定箇所が示されている。さらに、図4では、内部に1~8の数字を記載された円形の印により、8個のガス検知器の設置位置が示されている。本明細書では、各ガス検知器を、内部に付された数字を用いて、「1番のガス検知器」「2番のガス検知器」等と呼ぶ。
本実施の形態では、上記した実際の建物の位置や形状、漏洩想定箇所、および、ガス検知器の設置位置を特定する情報は、たとえば、キーボード103やマウス104を介して、コンピュータ100へ入力される。
図4では、境界BD1の一部のみが示されている。また、境界BD1の内部であって、ガス検知器の配置場所として想定される領域が、領域PTとして波線で示されている。
2) 「限界放出流量」の決定
図4では、A~Cで示された漏洩想定箇所のうち、境界BD1に最も近い漏洩想定箇所が、点Bである。なお、図4では、境界BD1上の、最も点Bに近い場所が、点B′として示されている。
図4では、A~Cで示された漏洩想定箇所のうち、境界BD1に最も近い漏洩想定箇所が、点Bである。なお、図4では、境界BD1上の、最も点Bに近い場所が、点B′として示されている。
そして、図3を参照して説明したように、点Bについての限界放出流量が算出される。
3) 限界放出流量の妥当性の検討
上記のように算出された限界放出流量について、図3を参照して説明したように、当該限界放出流量が実際のプロセス条件や漏洩想定箇所の配管の口径などに基づいて、シミュレーションの対象となるシステムにおいて想定され得る流量であるか否かが判断される。
3) 限界放出流量の妥当性の検討
上記のように算出された限界放出流量について、図3を参照して説明したように、当該限界放出流量が実際のプロセス条件や漏洩想定箇所の配管の口径などに基づいて、シミュレーションの対象となるシステムにおいて想定され得る流量であるか否かが判断される。
ここで、想定され得ないと判断されると、最適配置決定処理は、この時点で終了する。なお、CPU105は、この時点で、モニタ102にメッセージ(たとえば、対象となるシステムでは、漏洩想定箇所で着目ガスが漏洩しても、境界BD1外では当該ガスの濃度が許容濃度以上にはならないと想定されるため、シミュレーションが不要である旨のメッセージ)を表示しても良い。
一方、上記のように算出された限界放出流量が、シミュレーションの対象となるシステムにおいて想定され得る流量であると判断されると、さらに、処理は、ステップS40(図3参照)以降へと進められる。
4) ガス検知器設置位置の適正評価
上記したように、本実施の形態の最適配置決定処理では、限界放出流量の妥当性が確認された後、気象条件を変えて、複数の拡散シミュレーションが実行される。図5および図6は、それぞれ、異なる条件で実行されたシミュレーションの結果の一例を示す図である。
上記したように、本実施の形態の最適配置決定処理では、限界放出流量の妥当性が確認された後、気象条件を変えて、複数の拡散シミュレーションが実行される。図5および図6は、それぞれ、異なる条件で実行されたシミュレーションの結果の一例を示す図である。
図5および図6では、風向き、放出点(漏洩箇所)、ガス検出器による検出位置が示されている。なお、図4では、複数の風向きが記載されている。本実施の形態では、このように示された風向きごとに、異なる条件として、拡散シミュレーションが実行される。図4では、これらの異なる条件がまとめて示されている。
なお、図5は、Cで示される漏洩想定箇所において漏洩が生じた場合の、拡散シミュレーション結果の一例を示し、また、図6は、図4でAで示される漏洩想定箇所においてガスの漏洩が発生した場合の拡散シミュレーションの結果の一例を示す図である。
図5と図6の各図では、想定される着目ガスの濃度分布が、ハッチングの種類によって示されている。
図7は、条件を変えて実行された各拡散シミュレーションについての、各観測点(設置位置)での最大検知濃度が示されている。なお、最大検知濃度とは、ステップS40において特定される、各ガス検知器の設置位置において検知されるガスの濃度である。図7では、各条件が、「A-1」「A-2」「B-1」「B-2」「C-1」「C-2」の6種類が示されている。また、観測点とは、図4~図6において、1~8を付された丸印で示された、ガス検知器の設置位置として入力された位置を意味する。図5のシミュレーション結果は、図7の条件C-2に対応し、図6のシミュレーション結果は、図7の条件A-1に対応する。
図7では、たとえば、「A-1」の条件では、1番のガス検知器の最大検知濃度は、4.1(ppm)とされている。また、2番~8番の最大検知濃度は、順に、「2.8」「0.6」「-」「-」「0.7」「2.6」「1.5」とされている。なお、これらの単位は、「ppm」である。また、図7において、「-」は、最大検知濃度が0.1ppm未満であったことを意味している。
最大検知濃度とは、各ガス検知器の設置位置における、拡散シミュレーションにおける着目ガスのガス濃度である。
図7では、さらに、検知器数という項目が設けられている。
検知器数は、1ppm、2ppm、3ppmのそれぞれの濃度について、1番から8番の検知器のうち、最大検知濃度が各濃度以上である検知器の数が、シミュレーション条件毎に記載されている。
検知器数は、1ppm、2ppm、3ppmのそれぞれの濃度について、1番から8番の検知器のうち、最大検知濃度が各濃度以上である検知器の数が、シミュレーション条件毎に記載されている。
「A-1」の条件では、1ppm以上の濃度を検知すると予測される検知器の数は、「4」とされている。これは、条件「A-1」について、1ppm以上の最大検知濃度が1ppm以上であったガス検知器は、1番、2番、7番、および、8番の4台である。これに対応して、条件「A-1」の、1ppm以上の検知器数は、「4」とされている。
また、条件「A-1」では、最大検知濃度が2ppm以上の検知器は、1番、2番、7番の3台である。これに対応して、図7では、条件「A-1」の、2ppm以上の検知器数は、「3」とされている。
また、図7の条件「A-1」では、最大検知濃度が3ppm以上のガス検知器は、1番のみである。これにより、図7では、3ppmの検知器数が、「1」とされている。
5) 所定数以上のガス検知器での漏洩検知の可否の確認
図3を参照して説明した最適配置決定処理では、ステップS50における確認処理は、図7に示されたような、各条件毎の、各ガス検知器について予測される最大検知濃度を用いて、行なわれる。
図3を参照して説明した最適配置決定処理では、ステップS50における確認処理は、図7に示されたような、各条件毎の、各ガス検知器について予測される最大検知濃度を用いて、行なわれる。
なお、上記したように、確認処理は、特定のガス濃度を特定の数以上のガス検知器が検出できるかどうかが判断される。
ここで、「特定の数」を「2」とした場合を例に、以下説明を行なう。
「特定のガス濃度」が「1ppm」である場合には、図7が対応するガス検知器の配置は、適切なものであると判断される。条件「A-1」~「C-2」のすべてについて、1ppmの検知器数が2以上であるからである。
「特定のガス濃度」が「1ppm」である場合には、図7が対応するガス検知器の配置は、適切なものであると判断される。条件「A-1」~「C-2」のすべてについて、1ppmの検知器数が2以上であるからである。
また、「特定のガス濃度」が「2ppm」とされた場合であっても、図7が対応するガス検知器の配置は、適正であると判断される。条件「A-1」~「C-2」の6つの条件のすべてについて、2ppmでの検知器数が2以上であるからである。
一方、図7に示された配置について、「特定のガス濃度」が「3ppm」である場合には、ガス検知器の配置が適正ではないと判断される。条件「A-2」~「C-2」については、最大検知濃度が3ppm以上であるガス検知器数が2以上であるが、条件「A-1」については、最大検知濃度が3ppm以上であるのは1番のガス検知器のみで、検知器数が1とされているからである。つまり、上記した「特定の数」である2未満となる条件が存在するからである。
したがって、図7に対応するガス検知器の配置について、特定の数が2とされた場合、特定のガス濃度が、1ppmまたは2ppmとされた場合には、当該配置が適正であると判断されて、そのまま最適配置決定処理は終了するが、特定の数が2とされ、特定のガス濃度が3ppmとされた場合には、図7の結果に対応するガス検知器の配置は適正ではないと判断されて、処理がステップS60へ進められる。
6) ガス検知器の設置位置の変更
図8および図9は、それぞれ、図5と図6に対応した、拡散シミュレーションの結果を示す図である。なお、図8および図9では、図5および図6に示されたガス検知器の配置から、2番のガス検知器の位置が上方へと変更されている。この変更は、ステップS60における、処理の結果による。図8および図9では、このような位置の変更を示すために、2番のガス検知の丸印が「′」を付されて示されている。
図8および図9は、それぞれ、図5と図6に対応した、拡散シミュレーションの結果を示す図である。なお、図8および図9では、図5および図6に示されたガス検知器の配置から、2番のガス検知器の位置が上方へと変更されている。この変更は、ステップS60における、処理の結果による。図8および図9では、このような位置の変更を示すために、2番のガス検知の丸印が「′」を付されて示されている。
図10は、図8または図9に示されたガス検知器の配置に対応した、各シミュレーション条件での、各観測点での最大検知濃度を示す図である。
図10における最大検知濃度、および、検知器数については、図7のそれらと同様の意味であるため、重複した説明は行なわない。
図7と比較して、図10の最大検知濃度では、1番、および、3番~7番のガス検知器の最大検知濃度は、図7と同様である。一方、2番(2′番)のガス検知器の最大検知濃度については、図7に示されたものから変化している。図8および図9に示したように、2番のガス検知器の設置位置が、図5または図6に示された位置から変更されているからである。
図7を参照して、3ppmの検知器数についても、すべてのシミュレーション条件について、「2」以上となっている。したがって、図7に対応したガス検知器の配置は適正ではないと判断されるが、図10に対応したガス検知器の配置(2番のガス検知器の設置位置が変更された配置)は適正であると判断される。
以上説明したように、本実施の形態では、ガス検知器の設置位置の入力を受付け、当該入力された設置位置(の組合せ)が適正か否かを判定することができる。
また、適正ではないと判断された場合には、入力された位置からガス検知器の設置位置を変更し、再度、変更後のガス検知器の位置が適正であるか否かを判断する。
なお、本実施の形態において、検知器数に関し、図7および図10では、複数の「特定のガス濃度」(1ppm、2ppm、3ppm)のそれぞれについて、各シミュレーション条件での検知器数が算出され、表示された。なお、検知器数の算出・表示は、少なくとも1つの「特定のガス濃度」のみについてなされればよい。
また、図7または図10に示されたシミュレーション結果に基づく最大検知濃度や検知器数については、モニタ102に表示されることが好ましい。
<最適配置決定処理の変形例>
以上説明した本実施の形態の最適配置決定処理では、ガス検知器の配置は変更されるが、ガス検知器の「数」が変更されることがなかった。
以上説明した本実施の形態の最適配置決定処理では、ガス検知器の配置は変更されるが、ガス検知器の「数」が変更されることがなかった。
しかしながら、設置位置を入力されたガス検知器の数では、すべてのシミュレーション条件のすべてにおいて、上記した特定の濃度以上のガスを特定の数以上のガス検知器で検出することができない場合がある。そのような場合、CPU105は、ガス検知器の数を増加させることを提案しても良い。
具体的には、たとえば、初期設定として、図11に示されるような1番~7番の7個のガス検知器の配置が入力されたとする。なお、図11は、図5において8番のガス検知器が削除された図に相当する。
この場合の、条件A-1~C-2の6個の条件での拡散シミュレーションに基くガス検出器の最大検知濃度を、図12に示す。
図12では、条件C-2では、1ppm,2ppm,3ppmのいずれについても、検知器数が「1」となっている。したがって、上記した「特定の数」が「2」以上である場合には、図12に対応する配置は適正なものではないと判断される。
さらに、ステップS60の処理を繰り返して7個の配置を如何に変更しても、図12に対応する配置が適正なものとは判断されない場合を想定する。このような場合には、CPU105は、ステップS60において、さらに、ガス検知器の数を「1」増加させ、増加後のガス検知器の配置を決定し、ステップS40へ処理を戻す。そして、CPU105は、ガス検知器の数を増加させた後、配置が適正と判断されるまで、ステップS40~ステップS60の処理を繰り返す。そして、たとえば図9に示すような結果が得られると、最適配置決定処理を終了させる。
また、CPU105は、このようにガス検知器の数を「1」増加させた後、如何にガス検知器の配置を変更しても適正な配置と判断した場合には、さらにガス検知器の数を「1」増加させる。このようにして、ステップS40~ステップS60において、CPU105は、配置が適正と判断するまで、ガス検知器の数を増加させ、そして、数を増加した後のガス検知器群についてその配置を変更する。
<その他の変形例>
・拡散シミュレーションにおいて変更可能な条件
以上説明した本実施の形態では、着目ガスについて、各漏洩想定箇所において、前述の限界放出流量を放出流量として、拡散シミュレーションが実施される。そして、当該拡散シミュレーションで得られたガス濃度分布に基づいて、当該着目ガスの濃度を検出するガス検知器の配置が適正であるか否かが評価された。
・拡散シミュレーションにおいて変更可能な条件
以上説明した本実施の形態では、着目ガスについて、各漏洩想定箇所において、前述の限界放出流量を放出流量として、拡散シミュレーションが実施される。そして、当該拡散シミュレーションで得られたガス濃度分布に基づいて、当該着目ガスの濃度を検出するガス検知器の配置が適正であるか否かが評価された。
上記拡散シミュレーションでは、風向等の条件が変更される。なお、変更可能な条件としては、「風向」「風速」「大気温度」「大気安定度」「太陽からの放射熱」「地表面粗度」などが挙げられる。
・ユーザによる配置の変更
本実施の形態では、最初に入力されたガス検知器の配置が適正ではないと判断された場合に、適正であると判断されるまで当該配置が変更されていた。
本実施の形態では、最初に入力されたガス検知器の配置が適正ではないと判断された場合に、適正であると判断されるまで当該配置が変更されていた。
ここで、本実施の形態では、少なくとも、入力されたガス検知器の配置が適正であるか否かについてまでは判断することなく、当該判断をするための情報を、少なくとも表示すればよい。このような情報としては、たとえば、図7等に示した検知器数がある。
つまり、図3のステップS40の処理が行なわれ、図7等に示したような拡散シミュレーションの結果に基く検知器数等を表示し、当該表示を見て、ユーザがガス検知器の配置を変更するようにしても良い。
この場合、ステップS60において、CPU105は、ガス検知器の配置を変更する代わりに、ユーザからのガス検知器の設置位置の変更の入力を受け付ける。
・拡散シミュレーションのためのツール
本実施の形態では、シミュレーションに用いるツールとして、上記したTRACE(登録商標)を採用した。これにより、短時間で多ケースの評価が可能である。ただし、評価エリア内に存在する障害物を地表面粗度の1つのパラメータで代表して評価するため、漏洩点周辺に建屋やプラント機器などの比較的大きな障害物が存在する場合には、拡散結果が実際とは大きく異なってしまう可能性がある。
本実施の形態では、シミュレーションに用いるツールとして、上記したTRACE(登録商標)を採用した。これにより、短時間で多ケースの評価が可能である。ただし、評価エリア内に存在する障害物を地表面粗度の1つのパラメータで代表して評価するため、漏洩点周辺に建屋やプラント機器などの比較的大きな障害物が存在する場合には、拡散結果が実際とは大きく異なってしまう可能性がある。
一方、フランスFruidyn社製3D-CFD(3次元熱流体解析)ツールである“PANEPR”は、有限体積法をベースとした3次元CFDツールであり、流体の3基礎式および各種乱流モデルを内蔵していることで、障害物周辺の機械的な乱流構造を再現可能である。したがって、正規分布型拡散モデルでは予測できない障害物の影響を考慮した拡散予測が可能である。ただし、計算時間が長いため、多ケースの検討に対して早期に評価を実施することは難しい。拡散距離が遠方に及ぶ場合、遠方での到達濃度の予測値が計算誤差の累積に伴い、経験モデルである正規分布式での予測値よりも精度を欠く可能性がある。
このことから、たとえば、限界放出流量の決定においてはTRACE(登録商標)の計算結果を適用し、一方、ステップS40以降のガス検知器の設置位置の適正評価については、モデルプラント内の限定された領域内に多数の障害物が配置されていることを考慮して、3次元CFDツール(たとえば、“PANEPR”)を用いて検討してもよい。
100 コンピュータ、101 コンピュータ本体、102 モニタ、103 キーボード、104 マウス、105 CPU、106 メモリ。
Claims (11)
- 被検知エリアにおいてガス検知位置の配置の決定を支援するための装置であって、
前記被検知エリア内においてガスの漏洩が想定される位置である漏洩想定位置の情報、および、ガス検知位置の情報の入力を受け付けるための入力部と、
前記入力部(103,104)に入力された情報に基づいて、ガス検知位置の最適な配置の情報を提供するための演算装置(105)とを備え、
前記演算装置(105)は、
前記ガスについての流量であって、前記被検知エリア内で前記ガスの漏洩があった場合に、当該被検知エリア外において許容される濃度に達しない最大の流量である限界放出流量を算出し、
前記漏洩想定位置において前記限界放出流量のガスの漏洩があった場合の、前記被検知エリア内での前記ガスの濃度分布のシミュレーションを、複数の条件のそれぞれについて実行し、
前記シミュレーションにおいて得られた濃度分布に基づいて、前記条件ごとに、前記入力を受け付けたガス検知位置のうち、特定の濃度以上の前記ガスを検知する位置の数を算出し、提示する、ガス検知位置の配置の決定を支援するための装置。 - 被検知エリアにおいてガス検知位置の配置の決定を支援するためのコンピュータが、
前記被検知エリア内においてガスの漏洩が想定される位置である漏洩想定位置の情報の入力を受付けるステップと、
前記ガスについての流量であって、前記被検知エリア内で前記ガスの漏洩があった場合に、当該被検知エリア外において許容される濃度に達しない最大の流量である限界放出流量を算出するステップと、
ガス検知位置の情報の入力を受け付けるステップと、
前記漏洩想定位置において前記限界放出流量でのガスの漏洩があった場合の、前記被検知エリア内での前記ガスの濃度分布のシミュレーションを、異なる2以上の条件のそれぞれについて実行するステップと、
前記シミュレーションにおいて得られた濃度分布に基づいて、前記条件ごとに、前記入力を受け付けたガス検知位置のうち、特定の濃度以上の前記ガスを検知する位置の数を算出し、提示するステップとを実行する、ガス検知位置の設定を支援する方法。 - 被検知エリアにおいてガス検知位置の配置の決定を支援するためのコンピュータが実行可能なプログラムを非一時的に記録した、コンピュータ読取可能な記録媒体であって、
前記プログラムは、前記コンピュータに、
前記被検知エリア内においてガスの漏洩が想定される位置である漏洩想定位置の情報の入力を受付けるステップと、
前記ガスについての流量であって、前記被検知エリア内で前記ガスの漏洩があった場合に、当該被検知エリア外において許容される濃度に達しない最大の流量である限界放出流量を算出するステップと、
ガス検知位置の情報の入力を受け付けるステップと、
前記漏洩想定位置において前記限界放出流量のガスの漏洩があった場合の、前記被検知エリア内での前記ガスの濃度分布のシミュレーションを、複数の条件のそれぞれについて実行するステップと、
前記シミュレーションにおいて得られた濃度分布に基づいて、前記条件ごとに、前記入力を受け付けたガス検知位置のうち、特定の濃度以上の前記ガスを検知する位置の数を算出し、提示するステップとを実行させる、記録媒体。 - 前記コンピュータに、
前記複数の条件のいずれにおいても、前記特定の濃度以上の前記ガスが、特定の数以上の位置で検知されるガス検知位置の配置を提示するステップをさらに実行させる、請求項3に記載の記録媒体。 - 前記ガス検知位置の配置を提示するステップは、
前記複数の条件のそれぞれについて実行された前記シミュレーションにおいて得られた濃度分布のいずれにおいても、前記特定の濃度以上の前記ガスが、前記特定の数以上の位置で検知されるために、ガス検知位置の変更または数を増加させるステップを含む、請求項4に記載の記録媒体。 - 前記限界放出流量を算出するステップは、前記ガスの拡散についての、風向きが異なる2以上の条件でのシミュレーションを含む、請求項3に記載の記録媒体。
- 前記限界放出流量を算出するステップは、前記ガスの拡散についての、風速が異なる2以上の条件でのシミュレーションを含む、請求項3に記載の記録媒体。
- 前記限界放出流量を算出するステップは、前記ガスの拡散についての、大気安定度が異なる2以上の条件でのシミュレーションを含む、請求項3に記載の記録媒体。
- 前記限界放出流量を算出するステップは、前記ガスの拡散についての、大気温度が異なる2以上の条件でのシミュレーションを含む、請求項3に記載の記録媒体。
- 前記限界放出流量を算出するステップは、前記ガスの拡散についての、太陽からの放射熱が異なる2以上の条件でのシミュレーションを含む、請求項3に記載の記録媒体。
- 前記限界放出流量を算出するステップは、前記ガスの拡散についての、地表面粗度が異なる2以上の条件でのシミュレーションを含む、請求項3に記載の記録媒体。
Applications Claiming Priority (2)
| Application Number | Priority Date | Filing Date | Title |
|---|---|---|---|
| JP2011119353A JP2012247307A (ja) | 2011-05-27 | 2011-05-27 | ガス検知位置の配置の決定を支援するためのプログラム |
| JP2011-119353 | 2011-05-27 |
Publications (1)
| Publication Number | Publication Date |
|---|---|
| WO2012165158A1 true WO2012165158A1 (ja) | 2012-12-06 |
Family
ID=47259021
Family Applications (1)
| Application Number | Title | Priority Date | Filing Date |
|---|---|---|---|
| PCT/JP2012/062628 Ceased WO2012165158A1 (ja) | 2011-05-27 | 2012-05-17 | ガス検知位置の配置の決定を支援するための装置および記録媒体、ならびに、ガス検知位置の設定支援方法 |
Country Status (2)
| Country | Link |
|---|---|
| JP (1) | JP2012247307A (ja) |
| WO (1) | WO2012165158A1 (ja) |
Cited By (3)
| Publication number | Priority date | Publication date | Assignee | Title |
|---|---|---|---|---|
| US20210247299A1 (en) * | 2017-09-19 | 2021-08-12 | Sparrow Detect, Inc. | Generating signatures based on sensing gas concentration conditions |
| CN116296121A (zh) * | 2023-03-27 | 2023-06-23 | 国网江苏省电力有限公司无锡供电分公司 | 洁净空气绝缘电气设备泄漏模拟装置及检测方法 |
| US12234844B2 (en) | 2018-12-28 | 2025-02-25 | Beckman Coulter, Inc. | Pneumatics system with advanced system diagnostics capabilities |
Families Citing this family (4)
| Publication number | Priority date | Publication date | Assignee | Title |
|---|---|---|---|---|
| JP5921452B2 (ja) * | 2013-01-30 | 2016-05-24 | 株式会社東芝 | 拡散推定方法及び拡散推定装置 |
| WO2025122948A1 (en) * | 2023-12-08 | 2025-06-12 | Schlumberger Technology Corporation | Detection and quantification of multiple methane leaks |
| JPWO2025163827A1 (ja) * | 2024-01-31 | 2025-08-07 | ||
| WO2025163829A1 (ja) * | 2024-01-31 | 2025-08-07 | 日本郵船株式会社 | 安全設計装置、安全設計方法、及びアンモニア燃料船 |
Citations (3)
| Publication number | Priority date | Publication date | Assignee | Title |
|---|---|---|---|---|
| JP2003255055A (ja) * | 2002-03-01 | 2003-09-10 | Hitachi Eng Co Ltd | 大気汚染発生源推定の環境シミュレーション方法およびシステム |
| JP2008267992A (ja) * | 2007-04-20 | 2008-11-06 | Hitachi Ltd | 漏洩検知システム |
| JP2009156814A (ja) * | 2007-12-27 | 2009-07-16 | Hitachi Engineering & Services Co Ltd | 道路排ガス拡散シミュレーション方法および装置 |
-
2011
- 2011-05-27 JP JP2011119353A patent/JP2012247307A/ja not_active Withdrawn
-
2012
- 2012-05-17 WO PCT/JP2012/062628 patent/WO2012165158A1/ja not_active Ceased
Patent Citations (3)
| Publication number | Priority date | Publication date | Assignee | Title |
|---|---|---|---|---|
| JP2003255055A (ja) * | 2002-03-01 | 2003-09-10 | Hitachi Eng Co Ltd | 大気汚染発生源推定の環境シミュレーション方法およびシステム |
| JP2008267992A (ja) * | 2007-04-20 | 2008-11-06 | Hitachi Ltd | 漏洩検知システム |
| JP2009156814A (ja) * | 2007-12-27 | 2009-07-16 | Hitachi Engineering & Services Co Ltd | 道路排ガス拡散シミュレーション方法および装置 |
Cited By (4)
| Publication number | Priority date | Publication date | Assignee | Title |
|---|---|---|---|---|
| US20210247299A1 (en) * | 2017-09-19 | 2021-08-12 | Sparrow Detect, Inc. | Generating signatures based on sensing gas concentration conditions |
| US11835449B2 (en) * | 2017-09-19 | 2023-12-05 | Sparrow Detect Inc. | Generating signatures based on sensing gas concentration conditions |
| US12234844B2 (en) | 2018-12-28 | 2025-02-25 | Beckman Coulter, Inc. | Pneumatics system with advanced system diagnostics capabilities |
| CN116296121A (zh) * | 2023-03-27 | 2023-06-23 | 国网江苏省电力有限公司无锡供电分公司 | 洁净空气绝缘电气设备泄漏模拟装置及检测方法 |
Also Published As
| Publication number | Publication date |
|---|---|
| JP2012247307A (ja) | 2012-12-13 |
Similar Documents
| Publication | Publication Date | Title |
|---|---|---|
| WO2012165158A1 (ja) | ガス検知位置の配置の決定を支援するための装置および記録媒体、ならびに、ガス検知位置の設定支援方法 | |
| Kim et al. | Localization and quantification of concrete spalling defects using terrestrial laser scanning | |
| Flores et al. | Methodology for determining the emitter local head loss in drip irrigation systems | |
| US20170074773A1 (en) | Local effective permeability measurements for complex porous structures | |
| CN108534756A (zh) | 风电机组塔筒倾斜度检测方法 | |
| CN105787980A (zh) | 一种检测虚拟现实显示设备视场角的方法及系统 | |
| US9372944B2 (en) | Numerical analysis device, element generation program, and numerical analysis method | |
| JP6981464B2 (ja) | 診断コスト出力装置、診断コスト出力方法及びプログラム | |
| Hou et al. | Leakage locating and sampling optimization of small-rate leakage on medium-and-low-pressure unground natural gas pipelines | |
| CN110260918A (zh) | 建筑监测方法、装置、电子设备及计算机可读存储介质 | |
| JP2017141554A (ja) | 凍土の造成状況管理システム、凍土の造成状況処理装置、及び凍土の造成状況管理方法 | |
| JP6471035B2 (ja) | 漏水発生位置推定装置、システムおよび方法 | |
| CN115577597B (zh) | 裂隙通道中溶质超扩散的模拟方法、装置、介质、设备 | |
| JP7287879B2 (ja) | 腐食検知システム | |
| CN120176608B (zh) | 一种对大跨超限梁结构变形的监测方法及装置 | |
| JP7325699B2 (ja) | 温度センサ位置設定方法、プログラム、及び処理装置 | |
| US20100042332A1 (en) | System and method for source identification for a chemical release | |
| CN113874866A (zh) | 传感器模型的生成方法和系统、传感器测量方法和系统 | |
| JP6363971B2 (ja) | 推定方法および推定装置 | |
| Asri et al. | Flow characteristics for leak detection in oil and gas pipeline network using CFD simulations | |
| CN114992151B (zh) | 风机任意位置随机方法 | |
| Zhang et al. | Refined process upcrossing rate approach for estimating probabilistic wind load effects with consideration of directionality | |
| CN117779839A (zh) | 管廊桥架支座精准定位施工方法 | |
| Hu et al. | Final Project Report on Computational Modeling and Analysis of Air-Based NSTF | |
| CN115790423A (zh) | 一种沉管隧道监测装置及监测方法 |
Legal Events
| Date | Code | Title | Description |
|---|---|---|---|
| 121 | Ep: the epo has been informed by wipo that ep was designated in this application |
Ref document number: 12793308 Country of ref document: EP Kind code of ref document: A1 |
|
| NENP | Non-entry into the national phase |
Ref country code: DE |
|
| 122 | Ep: pct application non-entry in european phase |
Ref document number: 12793308 Country of ref document: EP Kind code of ref document: A1 |