WO2012160798A1 - グルタチオンアルキルエステル同位体置換体および反応性代謝物の検出方法 - Google Patents
グルタチオンアルキルエステル同位体置換体および反応性代謝物の検出方法 Download PDFInfo
- Publication number
- WO2012160798A1 WO2012160798A1 PCT/JP2012/003302 JP2012003302W WO2012160798A1 WO 2012160798 A1 WO2012160798 A1 WO 2012160798A1 JP 2012003302 W JP2012003302 W JP 2012003302W WO 2012160798 A1 WO2012160798 A1 WO 2012160798A1
- Authority
- WO
- WIPO (PCT)
- Prior art keywords
- adduct
- isotope
- compound
- glutathione
- minutes
- Prior art date
- Legal status (The legal status is an assumption and is not a legal conclusion. Google has not performed a legal analysis and makes no representation as to the accuracy of the status listed.)
- Ceased
Links
- 0 *C(CNC([C@](CS)NO)=O)=O Chemical compound *C(CNC([C@](CS)NO)=O)=O 0.000 description 1
- BMXMUWZBYSOZEB-QPHDTYRISA-N OC(CNC([C@H](/C=C/S)NO)=O)=O Chemical compound OC(CNC([C@H](/C=C/S)NO)=O)=O BMXMUWZBYSOZEB-QPHDTYRISA-N 0.000 description 1
Images


Classifications
-
- G—PHYSICS
- G01—MEASURING; TESTING
- G01N—INVESTIGATING OR ANALYSING MATERIALS BY DETERMINING THEIR CHEMICAL OR PHYSICAL PROPERTIES
- G01N33/00—Investigating or analysing materials by specific methods not covered by groups G01N1/00 - G01N31/00
- G01N33/48—Biological material, e.g. blood, urine; Haemocytometers
- G01N33/483—Physical analysis of biological material
- G01N33/4833—Physical analysis of biological material of solid biological material, e.g. tissue samples, cell cultures
-
- C—CHEMISTRY; METALLURGY
- C07—ORGANIC CHEMISTRY
- C07B—GENERAL METHODS OF ORGANIC CHEMISTRY; APPARATUS THEREFOR
- C07B59/00—Introduction of isotopes of elements into organic compounds ; Labelled organic compounds per se
-
- C—CHEMISTRY; METALLURGY
- C07—ORGANIC CHEMISTRY
- C07K—PEPTIDES
- C07K5/00—Peptides containing up to four amino acids in a fully defined sequence; Derivatives thereof
- C07K5/02—Peptides containing up to four amino acids in a fully defined sequence; Derivatives thereof containing at least one abnormal peptide link
- C07K5/0215—Peptides containing up to four amino acids in a fully defined sequence; Derivatives thereof containing at least one abnormal peptide link containing natural amino acids, forming a peptide bond via their side chain functional group, e.g. epsilon-Lys, gamma-Glu
-
- G—PHYSICS
- G01—MEASURING; TESTING
- G01N—INVESTIGATING OR ANALYSING MATERIALS BY DETERMINING THEIR CHEMICAL OR PHYSICAL PROPERTIES
- G01N33/00—Investigating or analysing materials by specific methods not covered by groups G01N1/00 - G01N31/00
- G01N33/48—Biological material, e.g. blood, urine; Haemocytometers
- G01N33/50—Chemical analysis of biological material, e.g. blood, urine; Testing involving biospecific ligand binding methods; Immunological testing
- G01N33/94—Chemical analysis of biological material, e.g. blood, urine; Testing involving biospecific ligand binding methods; Immunological testing involving narcotics or drugs or pharmaceuticals, neurotransmitters or associated receptors
-
- H—ELECTRICITY
- H01—ELECTRIC ELEMENTS
- H01J—ELECTRIC DISCHARGE TUBES OR DISCHARGE LAMPS
- H01J49/00—Particle spectrometers or separator tubes
- H01J49/0027—Methods for using particle spectrometers
-
- G—PHYSICS
- G01—MEASURING; TESTING
- G01N—INVESTIGATING OR ANALYSING MATERIALS BY DETERMINING THEIR CHEMICAL OR PHYSICAL PROPERTIES
- G01N2458/00—Labels used in chemical analysis of biological material
- G01N2458/15—Non-radioactive isotope labels, e.g. for detection by mass spectrometry
Definitions
- the present invention relates to a novel isotope-labeled compound and a method for detecting a reactive metabolite using the isotope-labeled compound as a trapping reagent. .
- IDT idiosyncratic drug toxicity
- a trapping test using a trapping reagent is known as a method for simply examining whether a drug candidate compound generates a reactive metabolite by metabolism. Reactive metabolites are not very easy to detect because they are very unstable.
- a drug candidate compound is incubated in the presence of a metabolic enzyme, and a trapping reagent is allowed to coexist with the drug candidate compound when testing whether a reactive metabolite is generated.
- the trapping reagent binds to a reactive metabolite generated by the action of a drug candidate compound by a metabolic enzyme to form an adduct.
- This trapping reagent-reactive metabolite adduct is relatively stable and can be detected using a mass spectrometer or the like.
- Patent Document 1 describes glutathione as a trapping reagent.
- Non-patent Document 2 Another example reported as a compound that can be used as a trapping reagent is glutathione ethyl ester. It has been reported that when glutathione ethyl ester is used as a trapping reagent, a trapping reagent-reactive metabolite adduct can be detected with higher sensitivity in analysis using a mass spectrometer than when glutathione is used as a trapping reagent. (Non-patent document 2).
- the trapping reagent-reaction is detected when the trapping reagent-reactive metabolite adduct is detected by a liquid chromatography-mass spectrometer (LC-MS) or the like.
- LC-MS liquid chromatography-mass spectrometer
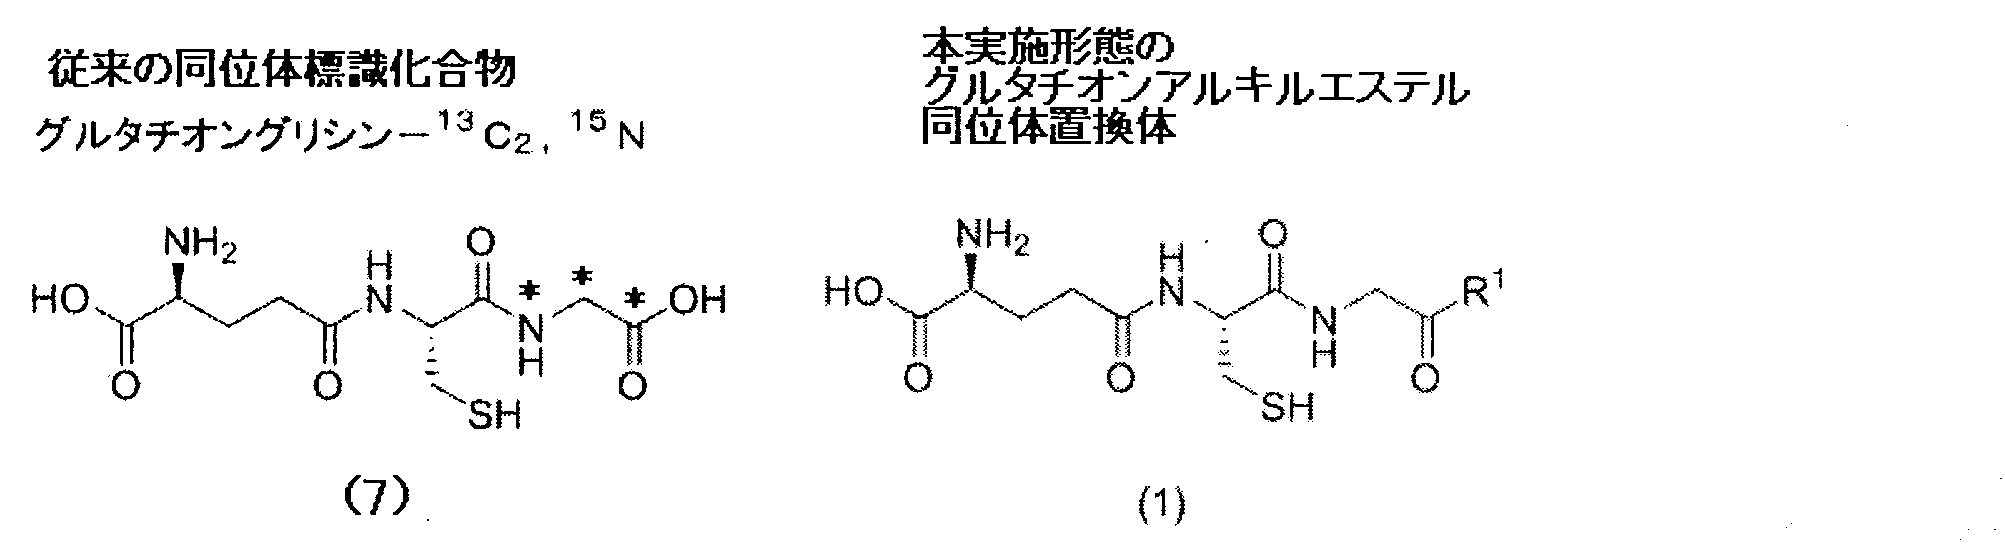
- an isotope-labeled compound that can be used as a trapping reagent includes glutathione glycine- 13 C 2 , 15 N (Patent Document 2, Non-Patent Documents 3 and 4).
- Glutathione glycine- 13 C 2 , 15 N is an isotope ( 13 C) in which two carbon atoms ( 12 C) of a glycine moiety of glutathione and an isotope ( 15 N) in one nitrogen atom ( 14 N) It is a labeled isotope-labeled compound.
- Glutathione glycine- 13 C 2 , 15 N has a mass number 3 higher than that of normal glutathione.
- Glutathione glycine- 13 C 2 , 15 N is mixed with normal glutathione at a constant ratio (such as 1: 1) and used as a trapping reagent to give glutathione glycine- 13 C 2 , 15 N-reactive metabolite adduct And glutathione-reactive metabolite adducts are formed at a certain ratio. When this is detected by LC-MS or the like, an isotope double line having a mass number different by 3 appears. This facilitates discrimination of the target peak, thereby reducing the possibility of being determined as false positive.
- the present invention uses a novel isotope-labeled compound that can be used as a trapping reagent for clarifying a compound that generates a reactive metabolite among drug candidate compounds, and uses the isotope-labeled compound as a trapping reagent
- An object is to provide a method for detecting a reactive metabolite.
- an isotope substituent of a glutathione alkyl ester represented by the general formula (1) (hereinafter simply represented by the general formula (1)). (Also referred to as a substituted product).
- the substitution product represented by the general formula (1) can be easily prepared from inexpensive glutathione.
- R 1 represents a linear or branched alkoxy group having 1 to 8 carbon atoms in which at least one of contained carbon atom, oxygen atom and hydrogen atom is isotope-labeled, or contained And a cycloalkoxy group having 3 to 8 carbon atoms in which at least one of carbon atoms, oxygen atoms, and hydrogen atoms is isotopically labeled.
- the substituent represented by the general formula (1) has an isotope in the structure.
- LC-MS analysis is performed upon detection of reactive metabolites.
- the present inventor adopts a trapping reagent-reactive metabolite adduct by adopting a measurement method capable of detecting a wide range of continuous ions such as a full scan method or a neutral loss scan method in the LC-MS analysis. It has also been found that ion peaks derived from can be detected more easily. Thereby, detection with few false negatives is possible. That is, the present invention includes the following inventions.
- a glutathione alkyl ester isotope-substituted product represented by the general formula (1).
- R 1 represents a linear or branched alkoxy group having 1 to 8 carbon atoms in which at least one of contained carbon atom, oxygen atom and hydrogen atom is isotope-labeled, or contained And a cycloalkoxy group having 3 to 8 carbon atoms in which at least one of carbon atoms, oxygen atoms, and hydrogen atoms is isotopically labeled.
- the glutathione alkyl ester isotope according to [1], in which at least one of a carbon atom, an oxygen atom, and a hydrogen atom represented by the general formula (2) and provided with an asterisk * is isotopically labeled. Body replacement.
- D represents deuterium ( 2 H).
- a glutathione alkyl ester isotope substitute-reactive metabolite adduct and a detection auxiliary compound-reactive metabolite by incubating a reaction sample containing a detection auxiliary compound and a drug candidate compound in the presence of a drug metabolizing enzyme Give rise to adducts, Detection of mass peaks of the resulting glutathione alkyl ester isotope substitute-reactive metabolite adduct and detection auxiliary
- the substitution product represented by the general formula (1) can be prepared at a very low cost compared to the isotope-labeled compound used as a conventional trapping reagent. Therefore, it is possible to realize screening of a huge amount of drug candidate compounds, which has been difficult in the past.
- the first spectrum contains the peak of adduct C. It is the 1st spectrum in retention time 3.92 minutes when ticlopidine is used as an object compound.
- the first spectrum contains the peak of adduct D. It is the 1st spectrum in retention time 4.02 minutes at the time of using ticlopidine as an object compound.
- the first spectrum contains the peak of adduct E. It is the 1st spectrum in retention time 5.56 minutes at the time of using diclofenac as an object compound.
- the first spectrum contains the peak of adduct F. It is the 1st spectrum in retention time 5.78 minutes at the time of using diclofenac as an object compound.
- the first spectrum contains the peak of the adduct G. It is a final chromatogram when the target compound is not used. (Control) It is a final chromatogram when acetaminophen is used as a target compound. It is a final chromatogram when omeprazole is used as a target compound. It is a final chromatogram when imipramine is used as a target compound. It is a final chromatogram when thienyl acid is used as a target compound. It is a final chromatogram when quercetin is used as a target compound. It is the 1st spectrum in retention time 2.33 minutes when acetaminophen is used as an object compound. The first spectrum contains the adduct H peak.
- the first spectrum contains the peak of adduct I. It is a 1st spectrum in the retention time of 3.99 minutes at the time of using omeprazole as a target compound.
- the first spectrum contains the peak of adduct J. It is the 1st spectrum in retention time 4.27 minutes at the time of using imipramine as an object compound.
- the first spectrum contains the peak of adduct K. It is the 1st spectrum in retention time 4.33 minutes at the time of using imipramine as an object compound.
- the first spectrum contains the peak of the adduct L.
- the first spectrum contains the peak of adduct M. It is the 1st spectrum in retention time 3.76 minutes when quercetin is used as an object compound.
- the first spectrum contains the peak of adduct N. It is the 1st spectrum in retention time 4.01 minutes when quercetin is used as an object compound.
- the first spectrum contains the peak of adduct O. It is the 1st spectrum in retention time 4.52 minutes when quercetin is used as an object compound.
- the first spectrum contains the peak of the adduct P. In a comparative example, it is a final chromatogram when not using a target compound.
- a comparative example it is a final chromatogram when omeprazole is used as a target compound. In a comparative example, it is a final chromatogram when clozapine is used as a target compound. In a comparative example, it is a final chromatogram when diclofenac is used as a target compound. In a comparative example, it is a final chromatogram when imipramine is used as a target compound. In a comparative example, it is a final chromatogram when thienyl acid is used as a target compound. In a comparative example, it is a final chromatogram when acetaminophen is used as a target compound.
- a comparative example it is a final chromatogram when quercetin is used as a target compound.
- it is the 1st spectrum in retention time 3.59 minutes when omeprazole is used as an object compound.
- the first spectrum contains the peak of adduct Q.
- it is the 1st spectrum in retention time 4.22 minutes at the time of using clozapine as an object compound.
- the first spectrum contains the peak of the adduct R.
- it is the 1st spectrum in retention time 4.33 minutes at the time of using clozapine as an object compound.
- the first spectrum contains the peak of the adduct S.
- the first spectrum in a comparative example, it is the 1st spectrum in retention time 5.49 minutes when diclofenac is used as an object compound.
- the first spectrum contains the peak of the adduct T.
- the first spectrum contains the peak of the adduct U.
- the first spectrum contains the peak of adduct V.
- it is the 1st spectrum in retention time 3.87 minutes when quercetin is used as an object compound.
- the first spectrum contains the peak of the adduct W.
- a comparative example it is the 1st spectrum in retention time 4.35 minutes at the time of using quercetin as an object compound.
- the first spectrum contains the peak of adduct X.
- a comparative example it is a final chromatogram when omeprazole is used as a target compound.
- the first spectrum contains the peak of the adduct Q2.
- it is a final chromatogram when not using a target compound. (Control)
- a comparative example it is a final chromatogram when omeprazole is used as a target compound.
- a final chromatogram when clozapine is used as a target compound In a comparative example, it is a final chromatogram when imipramine is used as a target compound. In a comparative example, it is a final chromatogram when thienyl acid is used as a target compound. In a comparative example, it is a final chromatogram when acetaminophen is used as a target compound. In a comparative example, it is a final chromatogram when quercetin is used as a target compound. In a comparative example, it is the 1st spectrum in retention time 2.74 minutes when omeprazole is used as an object compound. The first spectrum contains the peak of adduct Y.
- a comparative example it is the 1st spectrum in retention time 2.88 minutes at the time of using omeprazole as an object compound.
- the first spectrum contains the adduct Z peak.
- it is the 1st spectrum in retention time 3.22 minutes at the time of using clozapine as an object compound.
- the first spectrum contains the peak of adduct AA.
- it is the 1st spectrum in retention time 3.37 minutes at the time of using clozapine as an object compound.
- the first spectrum contains the peak of the adduct AB.
- it is the 1st spectrum in retention time 3.50 minutes when clozapine is used as an object compound.
- the first spectrum contains the peak of the adduct AC. In a comparative example, it is the 1st spectrum in retention time 3.65 minutes when imipramine is used as an object compound.
- the first spectrum contains the peak of the adduct AD. In a comparative example, it is the 1st spectrum in retention time 4.85 minutes at the time of using thienyl acid as an object compound.
- the first spectrum contains the peak of the adduct AE. In a comparative example, it is the 1st spectrum in retention time 2.82 minutes when quercetin is used as an object compound.
- the first spectrum contains the peak of adduct AF. In a comparative example, it is the 1st spectrum in retention time 3.16 minutes at the time of using quercetin as an object compound.
- the first spectrum contains the peak of the adduct AG.
- a reactive metabolite is detected using a substituent represented by the general formula (1) which is an isotope-labeled compound.
- R 1 represents a linear or branched alkoxy group having 1 to 8 carbon atoms in which at least one of contained carbon atom, oxygen atom and hydrogen atom is isotope-labeled, or contained And a cycloalkoxy group having 3 to 8 carbon atoms in which at least one of carbon atoms, oxygen atoms, and hydrogen atoms is isotopically labeled.
- the definition of the functional group of the general formula may be omitted with reference to the definition already described.
- “isotopically labeled compound” refers to a compound in which at least one of the contained atoms is substituted with an isotope.
- the isotopes described in this specification refer to atoms having the same atomic number but having a mass number different from the mass number (number of neutrons) which is predominant in nature.
- the “pharmaceutical drug candidate compound” described in the present specification is a compound that is subjected to various tests for the purpose of drug development, and is not limited to a compound that forms a reactive metabolite.
- the “reactive metabolite” described in the present specification refers to an electrophilic or radical compound produced by changing the chemical structure of a substrate compound by being metabolized by a drug metabolizing enzyme described later. means.
- electrophilic compounds have electrophilic functional groups such as epoxide groups, quinone groups, unsaturated carbonyl groups, and imine groups in their molecules.
- reactive metabolites radical compounds have highly reactive free radicals in their molecules.
- drug-metabolizing enzyme refers to any enzyme derived from human or animal tissue that can metabolize a drug candidate compound.
- the drug metabolizing enzyme used for detecting reactive metabolites is preferably derived from human or rat tissue, more preferably derived from human tissue. Of these, it is preferably derived from liver tissue.
- examples of drug-metabolizing enzymes include cytochrome P450 enzyme, peroxidase, cyclooxygenase, and myeloperoxidase.
- the drug metabolizing enzyme may be used in an isolated form, or may be used in a form contained in a cell or a cell fraction, and can be appropriately set by those skilled in the art.
- a drug metabolizing enzyme in which a drug metabolizing enzyme is contained in a cell or cell fraction refers to a cell or cell fraction derived from human or animal tissue containing the above-mentioned “drug metabolizing enzyme”.
- examples of cells or cell fractions containing drug-metabolizing enzymes include cells, S9 fractions, microsomal fractions and soluble fractions, and preferably cells, S9 fractions or microsomal fractions are used. Particularly preferably, hepatocytes, liver S9 or liver microsomes are used.
- Drug metabolizing enzymes may be used for reactive metabolite detection in combination with coenzymes.
- the coenzymes include oxidized coenzymes such as oxidized nicotinamide adenine dinucleotide (NAD +) and oxidized nicotinamide adenine dinucleotide phosphate (NADP +), reduced nicotinamide adenine dinucleotide (NADH), reduced There are reduced coenzymes such as type nicotinamide adenine dinucleotide phosphate (NADPH).
- NADPH type nicotinamide adenine dinucleotide phosphate
- NADPH or NADP + is used in combination with a drug metabolizing enzyme.
- hepatocytes, liver S9 or liver microsomes are used for reactive metabolite detection in combination with a coenzyme NADPH or NADP +.
- a combination of liver microsomes and NADPH is more preferred.
- the “liquid chromatography-mass spectrometer (LC-MS)” described in the present specification is a system in which liquid chromatography and a mass spectrometer are connected.
- LC liquid chromatography
- MS mass spectrometer
- the ions are detected. Since the compound-derived ion (parent ion) contained in the LC solution is generated, the presence or absence of the compound can be confirmed by detecting the mass-to-charge ratio (m / z) of the ion. At this time, an appropriate scanning method can be selected.
- the mass-to-charge ratio (m / z) is a value obtained by mass spectrometry, which is a value obtained by ionizing molecules in a measurement sample and dividing the mass (m) of the obtained ions by the number of charges (z). is there. From the value of the mass-to-charge ratio (m / z) of ions and the value of the number of charges (z), the mass of the molecule can be determined.
- the “MS / MS measurement” described in the present specification means that a parent ion arbitrarily selected from the parent ions obtained by the MS measurement is further collisionally activated with an inert gas, and the generated ions ( This is a method for detecting (child ions).
- the mass-to-charge ratio (m / z) of the child ions can be measured by an appropriate scanning method.
- the inert gas include helium and argon.
- Examples of the liquid chromatography (LC) include high performance liquid chromatography (HPLC), Ultra Performance LC (UPLC), and Ultra Fast LC (UFLC), among which UPLC is preferable.
- MS mass spectrometer
- FT-ICR Fourier transform ion cyclotron resonance mass spectrometer
- Examples of ionization methods that can be used in a mass spectrometer include electrospray ionization (ESI) and atmospheric pressure ionization (APCI), and among these, ESI is preferred.
- Examples of the scan method used in the mass spectrometer (MS) include a full scan method, a neutral loss scan method, an SRM method, and a product ion scan method. Of these, it is preferable to use the neutral loss scan method or the full scan method because the number of cases in which false negative is determined can be reduced.
- the full scan method is a method in which a parent ion is continuously detected in a range of an arbitrarily selectable mass to charge ratio (m / z). Since the present method measures the entire mass range (a mass range having a certain width that can be arbitrarily selected), the trapping reagent-reactive metabolite adduct produced can be detected without exception.
- the neutral loss scan method is a method in which a parent ion is continuously detected in a range of an arbitrarily selectable mass-to-charge ratio (m / z). Among them, a neutral molecule having a specific mass number is desorbed. This is a method for detecting parent ions.
- the SRM method detects both ions (parent ion and child ion) that generate a child ion having a specific mass-to-charge ratio (m / z) from a parent ion having a specific mass-to-charge ratio (m / z). Is the method.
- This method is a measurement method that predicts the structure of a trapping reagent-reactive metabolite adduct generated from a drug candidate compound and a trapping reagent, and narrows the measurement range based on its mass. Since it is a method for detecting a specific range, the influence of impurities is small, and highly sensitive measurement is possible.
- the product ion scan method detects child ions continuously from a parent ion having a specific mass-to-charge ratio (m / z) within an arbitrarily selectable mass-to-charge ratio (m / z) range. It is a method to do. When an unpredictable reactive metabolite is generated, detection failure may occur when using the SRM method, but exhaustive detection is possible by using the full scan method. In the development of pharmaceuticals, it is useful to be able to capture unpredictable reactive metabolites, which is important information that leads to the design of the next drug candidate compound.
- the “chromatogram” described in the present specification represents the MS measurement result of the LC eluate with the retention time on the horizontal axis and the relative abundance on the vertical axis.
- the “mass spectrum” described in the present specification is an MS measurement result at an arbitrary time, with the mass-to-charge ratio (m / z) on the horizontal axis and the relative abundance on the vertical axis. .
- “at least one of a carbon atom, an oxygen atom, and a hydrogen atom is isotopically labeled” means that at least one of a carbon atom, an oxygen atom, and a hydrogen atom is bonded to each atom. It is substituted with an isotope.
- Examples of carbon atom isotopes include 13 C and 14 C. 18 O is mentioned as an isotope of an oxygen atom.
- Examples of the isotope of a hydrogen atom include 2 H (also expressed as D) or 3 H.
- linear or branched alkoxy group having 1 to 8 carbon atoms examples include, for example, methoxy group, ethoxy group, 1-methylethoxy group, 1,1-dimethylethoxy group, 1-propoxy group, 2-propoxy group Group, 2-methyl-2-propoxy group, 1-ethylpropoxy group, 2-ethylpropoxy group, 1-butoxy group, 2,3-dimethyl-2-butane-2-oxy group, 2,3-dimethylbutane- Examples include 2-oxy group, 1-pentoxy group, 1-hexyloxy group, 1-heptyloxy group, and 1-octyloxy group. *
- Examples of the “cycloalkoxy group having 3 to 8 carbon atoms” include a cyclopropoxy group, a cyclopropylmethoxy group, a cyclobutoxy group, a cyclopentoxy group, a cyclohexyloxy group, a cycloheptyloxy group, and a cyclooctyloxy group. Can be mentioned.
- the “detection auxiliary compound” described in the present specification is a compound used by mixing with a reaction sample in detection of a reactive metabolite.
- the detection auxiliary compound is a compound in which at least one of the atoms of the glutathione alkyl ester isotope substituent of the present embodiment used as a trapping reagent is replaced with an atom having a different mass number (number of neutrons). Therefore, the detection auxiliary compound has the same skeleton as the glutathione alkyl ester isotope substituent of the present embodiment used as a trapping reagent, and the same functional group (atom) is bonded to the same position in the same configuration. Yes.
- the glutathione alkyl ester isotope substitute of this embodiment used as a trapping reagent and the detection auxiliary compound differ in at least one mass number (the number of neutrons) of the atoms, and as a result, the two compounds have the same mass number. The only difference is that the molecular weights differ between the two.
- the molecular weight of the detection auxiliary compound can be appropriately set by those skilled in the art in consideration of the particular ease in mass spectrometry and the like.
- the detection auxiliary compound binds to a reactive metabolite, so it can be said to be one of the trapping reagents in the detection of the reactive metabolite.
- a substitutional unlabeled compound represented by the general formula (1) mixed in the reaction sample can be used.
- the term “unlabeled compound” means a compound in which all atoms that are isotopes of glutathione alkyl ester isotope substituents are substituted with atoms that are non-isotopes. That is, when the glutathione alkyl ester isotope substituent has the carbon atom isotope 13 C, the unlabeled compound refers to a compound in which the 13 C is substituted with 12 C.
- the unlabeled compound refers to a compound in which the 18 O is substituted with 16 O.
- the glutathione alkyl ester isotope substitute has the hydrogen atom isotope 2 H
- the unlabeled compound means a compound having a structure in which the 2 H is substituted with 1 H.
- a “trapping reagent” is used for the detection of reactive metabolites and is a covalent complex that is covalently bound to a reactive metabolite and is more stable than the reactive metabolite (trapping reagent).
- Reagents referred to as reactive metabolite adducts.
- detection auxiliary compound-reactive metabolite means a covalent complex of a detection auxiliary compound and a reactive metabolite.
- glutathione alkyl ester isotope substitute-reactive metabolite adduct refers to the glutathione alkyl ester isotope substitute, which is the isotope-labeled compound of the present embodiment, and reactive metabolism. It means a covalent complex with a product.
- a double line that appears when a non-labeled compound of a glutathione alkyl ester isotope substitute is used as a detection auxiliary compound is referred to as an “isotope double line”.
- “False positive” described in the present specification means that the reactive metabolite is not produced in the incubation of the drug candidate compound and the drug metabolizing enzyme, although the reactive metabolite is not actually generated. It means to show the result (positive) that it was generated. False positives are undesirable because they lead to the removal of safe compounds that do not produce reactive metabolites from drug candidates.
- “False negative” described in this specification means that a reactive metabolite is produced in the incubation of a drug candidate compound and a drug metabolizing enzyme, even though a reactive metabolite is actually produced. This means that the result is negative (negative). False negatives are not preferred because compounds that produce reactive metabolites will be mistaken for safe compounds.
- Step 1 In vitro incubation and sample preparation
- the substitute represented by the general formula (1), the detection auxiliary compound, and the drug candidate compound are mixed to obtain a reaction sample.
- the ratio of the substitution product represented by the general formula (1) and the detection auxiliary compound is not particularly limited, and can be appropriately set by those skilled in the art. However, the molar ratio is preferably 2: 1 to 1: 2. 1 is more preferable.
- the reaction sample is incubated in the presence of a drug metabolizing enzyme. Incubation conditions are not particularly limited.
- the concentration of the drug metabolizing enzyme, the concentration of the drug candidate compound, and the like can be appropriately set according to the sensitivity required by those skilled in the art in the LC-MS analysis of step 2 described later.
- the drug-metabolizing enzyme may be contained in the microsome fraction or the like and mixed in the reaction sample. Therefore, the concentration of the drug-metabolizing enzyme can be adjusted based on the protein concentration in the reaction sample.
- the reaction time and reaction temperature can also be set as appropriate according to the sensitivity required in the LC-MS analysis, and can be set at 37 ° C. for 60 minutes, for example.
- the drug metabolizing enzyme may be present in the reaction sample in a form contained in cells or cell fractions.
- a coenzyme such as NADPH may be added to this reaction sample. After incubation, analysis is performed using LC-MS.
- the substitution product represented by the general formula (1) of the present embodiment may generate a disulfide bond at the thiol group portion to generate a dimer.
- DTT dithiothreitol
- This can suppress the appearance of a large dimer peak in the chromatogram of the LC-MS analysis, so that the peak of the trapping reagent-reactive metabolite adduct can be easily identified.
- reducing agents such as 2-mercaptoethanol and tris (2-carboxyethyl) phosphine can be used.
- FIG. 1 shows a schematic diagram of an example of LC-MS analysis.
- the four types of instrument data charts shown in FIG. 1 are referred to as a first chromatogram, a first spectrum, a second spectrum, and a final chromatogram in order from the top.
- the first chromatogram is a chart showing the results of mass spectrometry by sequentially introducing the LC eluate from which the compounds have been separated by liquid chromatography (LC) into a mass spectrometer (MS).
- the horizontal axis represents the retention time (hereinafter simply referred to as retention time) of the compound corresponding to each peak in the liquid chromatography column, and the vertical axis represents the ion corresponding to each peak.
- the first spectrum is a chart showing a mass analysis result at a specific time point on the first chromatogram.
- the horizontal axis represents the mass-to-charge ratio (m / z)
- the vertical axis represents the relative abundance of ions corresponding to each peak.
- the second spectrum is a chart showing the results of MS / MS measurement.
- the horizontal axis represents the mass-to-charge ratio (m / z), and the vertical axis represents the relative abundance of ions corresponding to each peak.
- the final chromatogram is a chart that displays, as a chromatogram, only the peak in which the neutral loss of the mass designated in the MS / MS measurement is detected among the peaks represented in the first chromatogram.
- the horizontal axis represents the retention time
- the vertical axis represents the relative abundance of ions corresponding to each peak.
- the sample prepared in Step 1 (product obtained by incubation) was separated by liquid chromatography (LC), and the obtained LC eluate was separated into a mass spectrometer (MS). Introduce. After ionization in MS, mass spectrometry is performed to obtain a first chromatogram and a first spectrum (Act101 and Act102).
- the measurement range of mass spectrometry is good enough to detect the mass-to-charge ratio (m / z) of the adduct generated from the target compound and the trapping reagent.
- the mass-to-charge ratio (m / z) range is selected as 350-1200. Full scan measurement under the above conditions is preferred.
- MS / MS measurement may be performed (Act103).
- MS / MS measurement is performed to confirm the MS / MS fragment, whereby the possibility of being determined as false positive can be further reduced.
- a preferred energy setting range is a range of Normalized Collision Energy 5-50.
- the MS / MS measurement performed after collision activation it is a peak identified as a detection auxiliary doublet, and is a mixture ratio of the substitution product represented by the general formula (1) and the detection auxiliary compound (preferably By measuring only ions corresponding to peaks having an intensity ratio of 2: 1 to 1: 2, more preferably 1: 1), detection with fewer false positives can be performed more efficiently. Therefore, it is preferable to use the isotopic data dependent scan mode.
- the “isotopic data dependent scan mode” is a mode in which MS / MS measurement is performed only when ions having a mass difference and intensity ratio specified in advance are detected during full scan measurement.
- a 129 Da neutral loss filter may be applied to the obtained data set (Act104).
- the “neutral loss filter” is a data analysis method in which only data having a specified mass of neutral loss is displayed as a chromatogram with respect to acquired data. By using a neutral loss filter, a final chromatogram is obtained (see FIG. 1). By obtaining the final chromatogram, the unique peak of the generated trapping reagent-reactive metabolite adduct can be more easily identified.
- R 1 is a linear or branched alkoxy group having 1 to 8 carbon atoms in which at least one of a carbon atom, an oxygen atom and a hydrogen atom is labeled, or a carbon atom or an oxygen atom And a cycloalkoxy group having 3 to 8 carbon atoms in which at least one of hydrogen atoms is isotopically labeled.
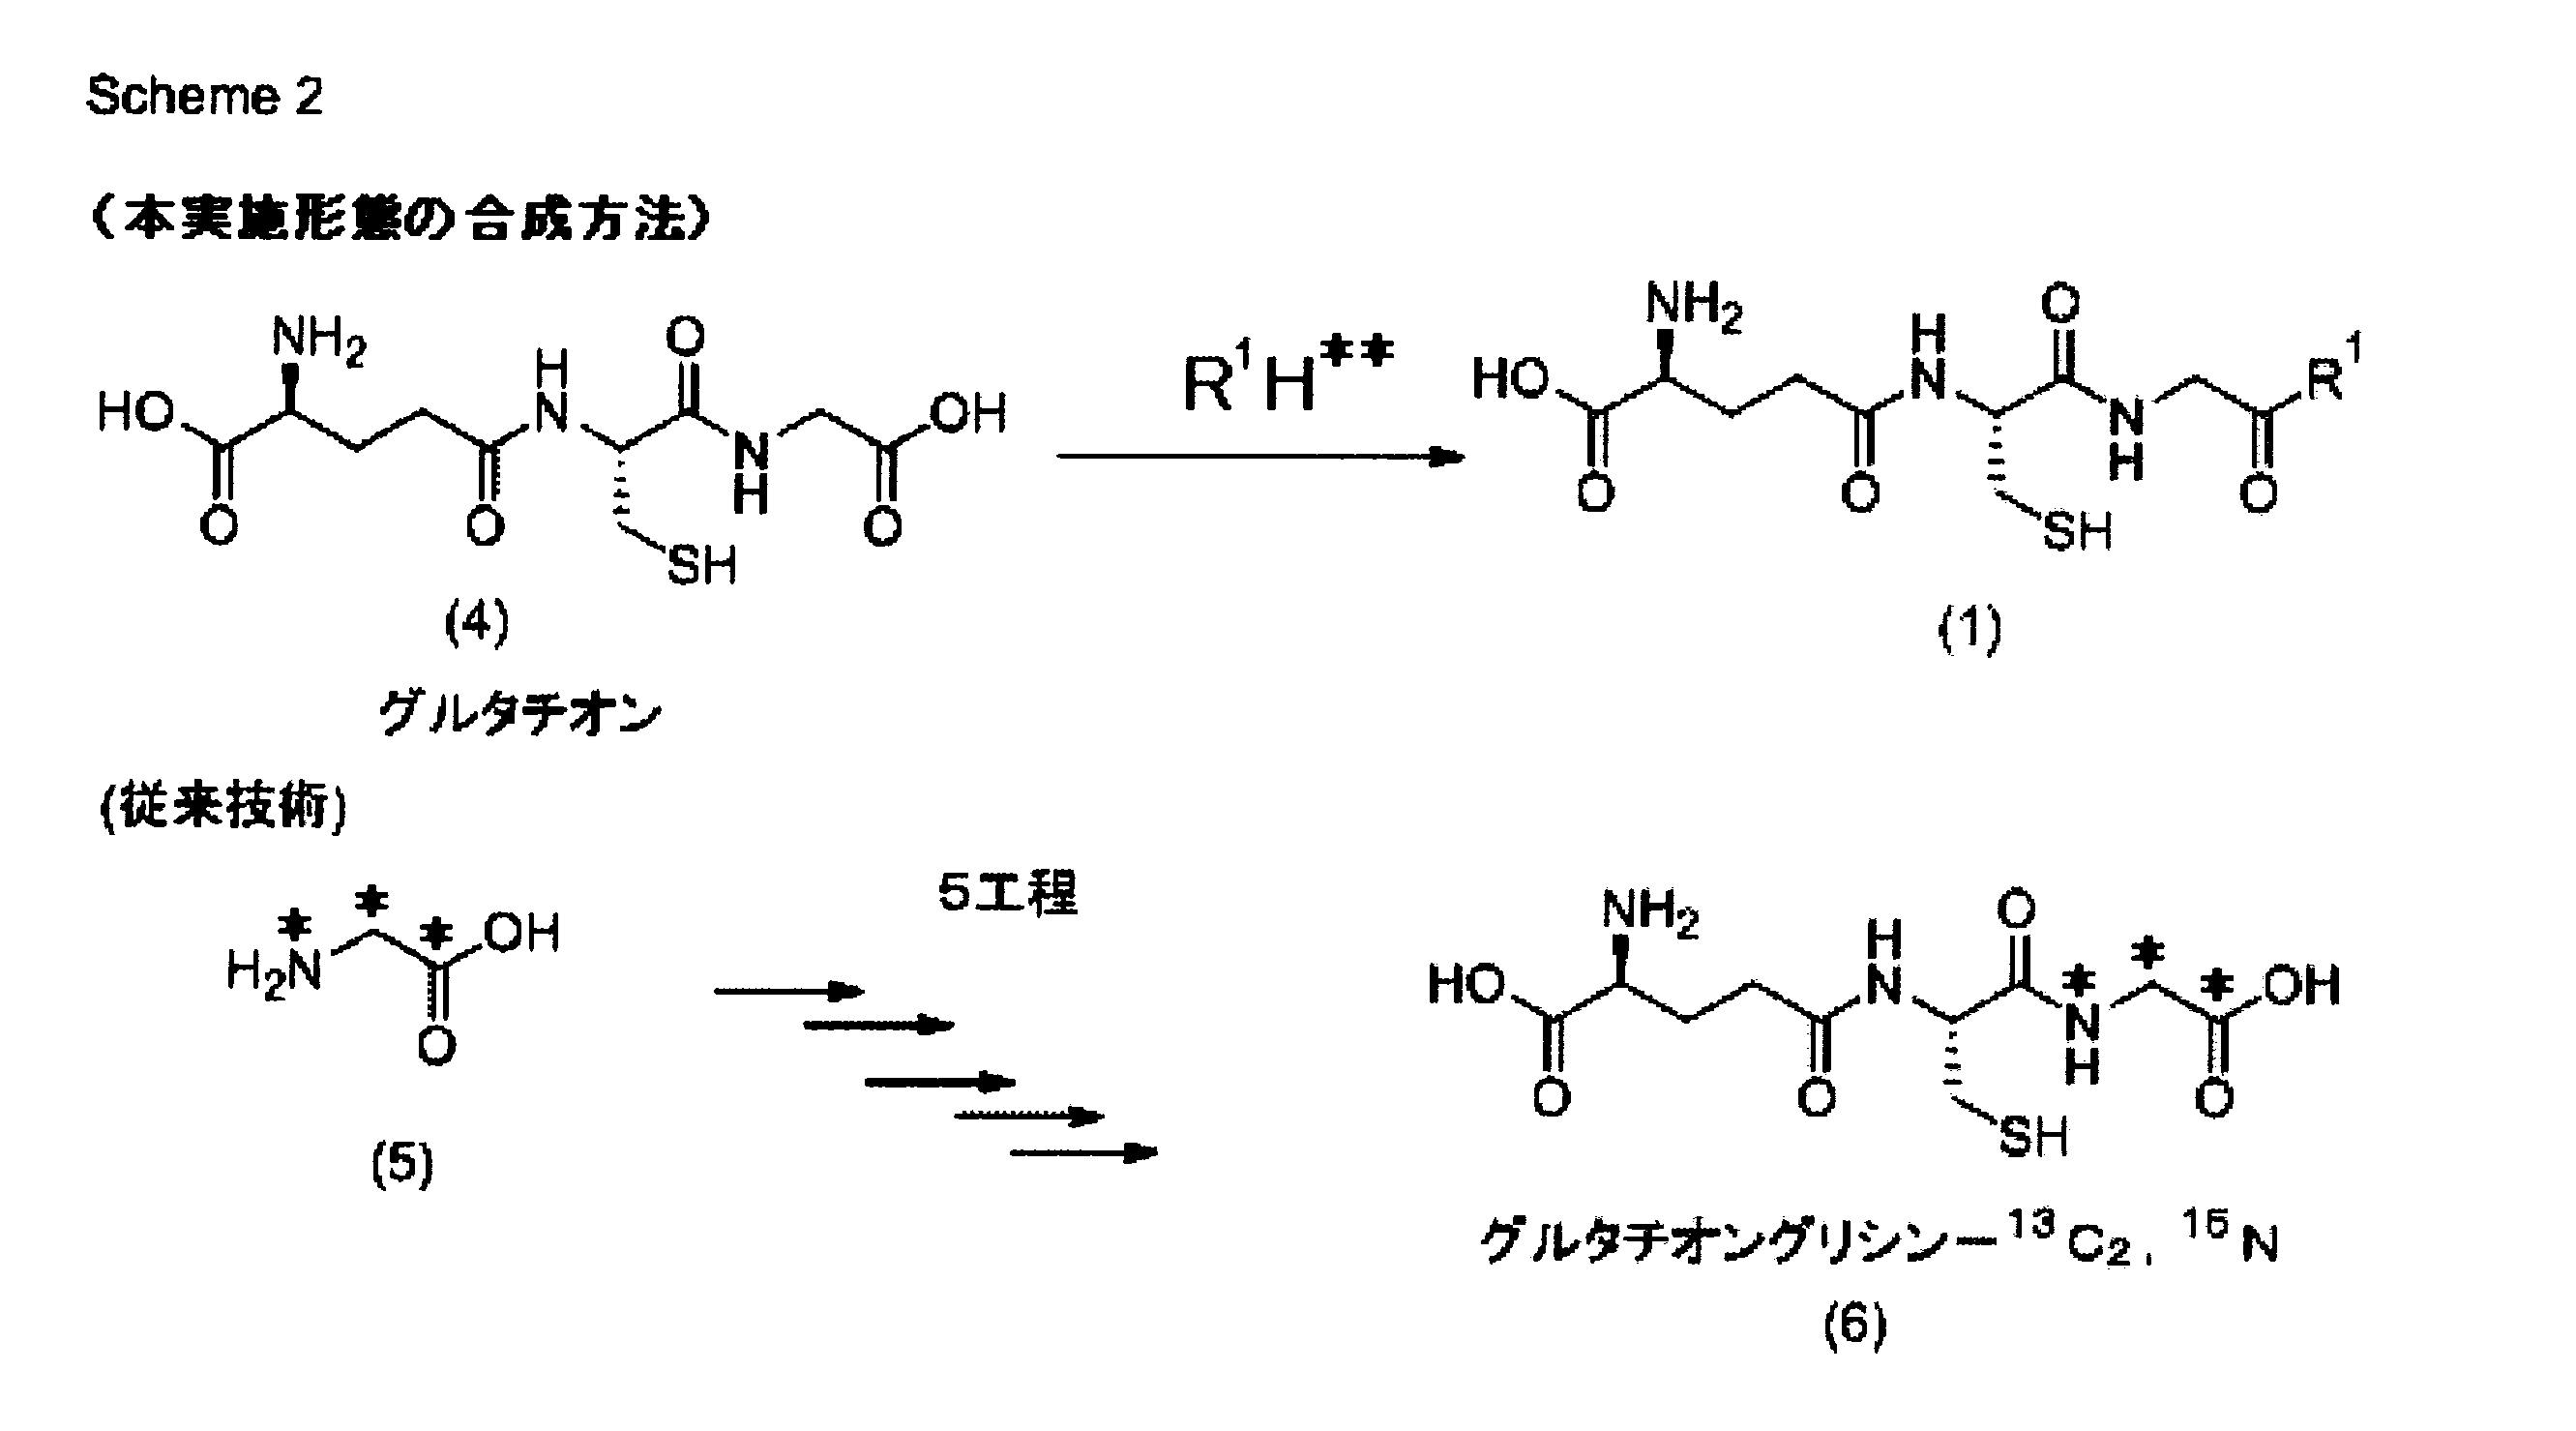
- the glutathione alkyl ester isotope substitute represented by the general formula (1) can be produced, for example, by deriving from the glutathione represented by the general formula (4). For example, it can be produced by reacting glutathione represented by the formula (4) with an alcohol represented by the general formula (5) containing an isotope in the presence of a catalyst.
- R 1 is as described above, and a hydrogen atom marked with two stars ** may be substituted with an isotope.
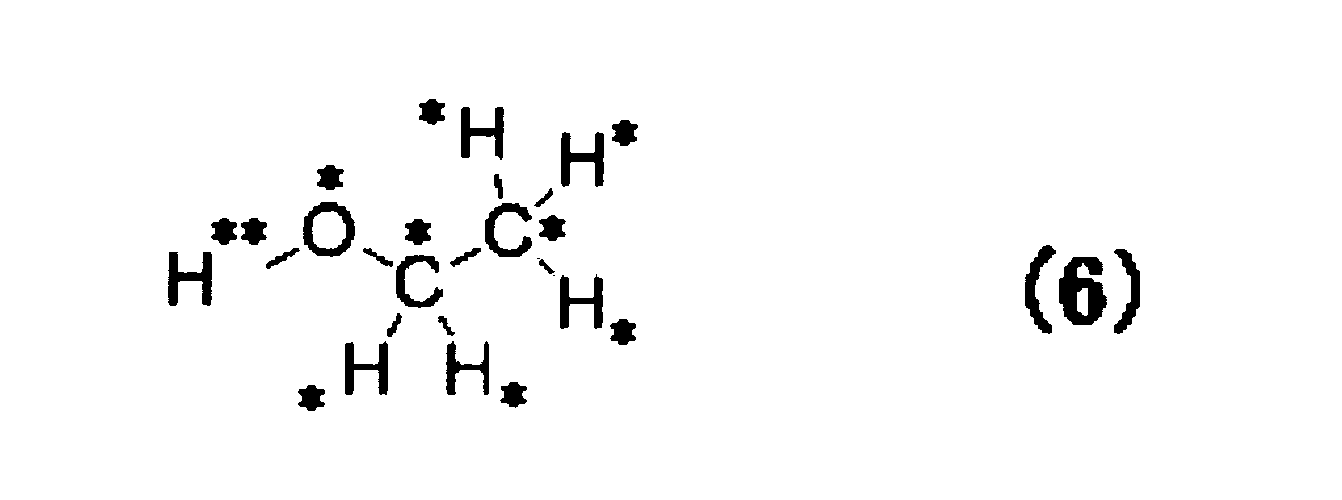
- glutathione represented by formula (4) is reacted with isotope-labeled ethanol represented by general formula (6) in the presence of a catalyst. Thereby, the glutathione alkyl ester isotope substituted body represented by the general formula (2) can be obtained.
- Examples of the alcohol represented by the general formula (5) containing an isotope include methanol-d3, methanol-d4, ethanol-1,1-d2, ethanol-2,2,2-d3, ethanol-d5, ethanol- d6, propanol-1,1-d2, propanol-2,2-d2, propanol-3,3,3-d3, propanol-d7, propanol-d8, isopropanol-1,1,1,3,3,3- and d6, isopropanol-d8, butanol-d10, 1-pentanol-d11, cyclohexanol-d12, and octanol-d18.
- Ethanol-1,1-d2, ethanol-2,2,2-d3, ethanol-d5 or ethanol-d6 is preferred, and ethanol-d6 is more preferred.
- the catalyst is used in an amount of 0.5 to 10 equivalents relative to glutathione, preferably 1 to 2 equivalents, more preferably 1.6 equivalents.
- the reaction temperature may range from 0 ° C. to the boiling point of the alcohol containing the isotope, preferably 20 ° C. to 40 ° C., more preferably 25 ° C. to 35 ° C.
- the substituted product represented by the general formula (1) can use inexpensive glutathione as a synthetic raw material.
- glutathione by making commercially available glutathione react with alcohol containing isotopes such as commercially available heavy ethanol (alcohol represented by the general formula (5)), it can be easily prepared in a single step with a high yield. Is possible.
- alcohol represented by the general formula (5) alcohol represented by the general formula (5)
- glutathione glycine- 13 C 2 , 15 N which is the prior art, is commercially available, it is a very expensive reagent and is difficult to obtain in large quantities.
- a very expensive glycine isotope substitute is used as a raw material, and five steps are required to obtain glutathione glycine- 13 C 2 , 15 N. Therefore, it is extremely difficult to obtain glutathione glycine- 13 C 2 , 15 N at low cost (Non-patent Document 4) (Scheme 2).
- R 1 is as described above, and a hydrogen atom marked with two asterisks ** may be substituted with an isotope.
- the trapping reagent reacts with the reactive metabolite in the incubation of the reaction sample containing the trapping reagent (substituent represented by the general formula (1), auxiliary detection compound) and drug candidate compound.
- an ion peak derived from a trapping reagent-reactive metabolite adduct appears as a multiple line that is, for example, a detection auxiliary double line.
- a multiple line such as a detection auxiliary double line is easier to identify than a single peak. Therefore, it is possible to detect fewer false positives in the detection of reactive metabolites.
- the characteristic peak of the glutathione alkyl ester isotope substituent-reactive metabolite adduct according to the present embodiment has a wide range of continuous peaks in LC-MS analysis, such as full scan method or neutral loss scan method. By applying a measurement method capable of detecting ions, it becomes easier to detect. Therefore, it is possible to detect with fewer cases judged as false negatives.
- D represents deuterium ( 2 H).
- Glutathione reduced form 503.8 mg, 1.64 mmol was suspended in ethanol-d6 (99.5 ATOM% D) (5 mL), and concentrated sulfuric acid (0.137 mL, 2.56 mmol) was added to the reaction solution. It was. The reaction solution was stirred at room temperature for 30 minutes and then allowed to stand at room temperature for 21 hours. Triethylamine (0.714 mL) was added to the reaction solution for neutralization, and ethanol (10 mL) and diisopropyl ether (10 mL) were added to crystallize the product. After standing at 4 ° C. for 16 hours, the crystals were collected by filtration. By drying under reduced pressure at 35 ° C.
- Steps common to Examples 2 to 9 Steps 1 and 2
- Step 1 In vitro incubation and sample preparation for analysis
- a substrate compound that produces a reactive metabolite in a detection test of a reactive metabolite is referred to as a target compound.
- Target compound (10 ⁇ mol / L, 10 nmol), a mixture (1 mmol / L, 1 ⁇ mol) of glutathione ethyl ester (GSHEE) and glutathione ethyl ester-d5 (GSHEEE-d5) mixed at a molar ratio of 1: 1, rat liver
- GHEE glutathione ethyl ester
- GSHEEE-d5 glutathione ethyl ester-d5
- An incubation mixture (reaction sample) containing microsomes (1 mg / mL, 1 mg), potassium phosphate buffer (pH 7.4) (100 mmol / L, 100 ⁇ mol), magnesium chloride (5 mmol / L, 5 ⁇ mol), and purified water was added. Pre-incubation at 37 ° C for 5 minutes.
- NADPH 20 mmol / L, 20 ⁇ mol
- the final incubation volume was 1 mL.
- a sample containing no target compound was used as a control.
- a 50 mmol / L dithiothreitol aqueous solution 100 ⁇ L, 5 ⁇ mol was added to the incubation mixture and centrifuged at 10,000 g for 5 minutes.
- the centrifugal supernatant was subjected to a solid phase extraction column (OASIS HLB 1 cc, 30 mg) previously washed with 1 mL of methanol and activated with 1 mL of purified water. After washing with 1 mL of water and 1 mL of 5% methanol water, the reaction product was eluted with 1 mL of methanol. The solvent was distilled off under a nitrogen stream, and the residue was dissolved in 150 ⁇ L of acetonitrile: water (2: 8) to obtain a sample for analysis.
- LC-MS analysis (Step 2-1) Liquid chromatography AQCUITY UPLC system (WATERS) was used for separation by chromatography.
- a portion (10 ⁇ L) of the prepared analytical sample was injected onto an AQCUITY UPLC BEH C18 column (2.1 ⁇ 100 mm, 1.7 ⁇ m). This chromatographic separation was performed at a mobile phase flow rate of 0.5 mL / min under the gradient conditions shown in the table below.
- Step 2-2 Mass Spectrometry
- the LC column eluate obtained in Step 2-1 was introduced into an LTQ XL ion trap mass spectrometer. Ionization was performed in the positive mode of ESI (mode for detecting positively charged ions). The measurement conditions used are shown below (measurement conditions A).
- Measurement condition A ISplay Voltage: 5.0kV Capillary Temp: 350 °C Sheath Gas Flow Rate: 41 Aux Gas Flow Rate: 18 Sweep Gas Flow Rate: 6.5
- a full scan measurement with a mass-to-charge ratio (m / z) range of 400-800 was performed to obtain a first chromatogram and a first spectrum shown in FIGS. 6 to 12 and FIGS.
- an isotope double line (double line having an intensity ratio of 1: 1 with a difference of 5 amu) appears in the mass analysis of Step 2-2, and the second mass analysis (MS / MS measurement) Represents a peak where a neutral loss of 129 Da was detected.
- the peaks appearing in the final chromatogram the peaks excluding the peaks appearing in the control (FIG. 2 or FIG. 13) are considered to be peaks of the trapping reagent-reactive metabolite adduct.
- the above measurement was performed using clozapine, ticlopidine, diclofenac, acetaminophen, omeprazole, imipramine, thienylic acid and quercetin as the target compounds. These eight compounds are known to generate reactive metabolites, and glutathione ethyl ester-d5, which is one of the isotope-labeled compounds according to this embodiment, detects reactive metabolites. Selected to prove whether it can be used.
- FIG. 3 shows the final chromatogram obtained for the target compound.
- Several components show positive responses, but sample-specific peaks are observed at retention times of 4.81 minutes, 4.89 minutes and 5.02 minutes compared to the control chromatogram ( Figure 2).
- An adduct corresponding to a retention time of 4.81 minutes is referred to as an adduct A
- an adduct corresponding to a retention time of 4.89 minutes is referred to as an adduct B
- an adduct corresponding to a retention time of 5.02 minutes is referred to as an adduct C.
- FIG. 4 shows the final chromatogram obtained for the target compound.
- Several components show positive responses, but sample-specific peaks are observed at retention times of 3.92 minutes and 4.03 minutes compared to the control chromatogram ( Figure 2).
- the adduct corresponding to the retention time of 3.92 minutes is referred to as adduct D
- the adduct corresponding to the retention time of 4.03 minutes is referred to as adduct E.
- adduct D characteristic isotope double lines having mass to charge ratios (m / z) of 631 and 636 Da were confirmed.
- FIG. 9 shows the final chromatogram obtained for the target compound.
- FIG. 5 shows the final chromatogram obtained for the target compound.
- Several components show positive responses, but sample-specific peaks are observed at retention times of 5.54 and 5.78 minutes compared to the control chromatogram ( Figure 2).
- An adduct corresponding to a retention time of 5.54 minutes is referred to as an adduct F
- an adduct corresponding to a retention time of 5.78 minutes is referred to as an adduct G.
- characteristic isotope double lines having a mass-to-charge ratio (m / z) of 611 and 616 Da were confirmed.
- m / z mass-to-charge ratio
- FIG. 14 shows the final chromatogram obtained for the target compound. Several components show positive responses, but a sample-specific peak is observed at a retention time of 2.33 minutes compared to the control chromatogram (FIG. 13). An adduct corresponding to a retention time of 2.33 minutes is referred to as adduct H. As shown in FIG. 19, for the adduct H, characteristic isotope double lines having mass-to-charge ratios (m / z) of 485 and 490 Da were confirmed. From the above results, acetaminophen was determined to be positive even when glutathione ethyl ester-d5 was used as a trapping reagent, and it was confirmed that one kind of reactive metabolite was produced.
- m / z mass-to-charge ratios
- FIG. 15 shows the final chromatogram obtained for the object compound.
- Several components show positive responses, but sample-specific peaks are observed at retention times of 3.92 minutes and 3.99 minutes compared to the control chromatogram ( Figure 13).
- An adduct corresponding to a retention time of 3.92 minutes is referred to as adduct I
- adduct J an adduct corresponding to a retention time of 3.99 minutes.
- FIG. 16 shows the final chromatogram obtained for the target compound.
- Several components show positive responses, but sample-specific peaks are observed at retention times of 4.27 and 4.33 minutes compared to the control chromatogram (FIG. 13).
- the adduct corresponding to the retention time of 4.27 minutes is referred to as adduct K
- the adduct corresponding to the retention time of 4.33 minutes is referred to as adduct L.
- characteristic isotope double lines having mass-to-charge ratios (m / z) of 602 and 607 Da were confirmed.
- FIG. 1 mass-to-charge ratios
- FIG. 17 shows the final chromatogram obtained for the target compound.
- Several components show positive responses, but a sample-specific peak is observed at a retention time of 5.74 minutes compared to the control chromatogram (FIG. 13).
- An adduct corresponding to a retention time of 5.74 minutes is referred to as adduct M.
- characteristic isotope double lines having mass-to-charge ratios (m / z) of 664 and 669 Da were confirmed. From the above results, it was confirmed that thienyl acid was positive even when glutathione ethyl ester-d5 was used as a trapping reagent, and it was confirmed that one kind of reactive metabolite was produced.
- FIG. 18 shows the final chromatogram obtained for the target compound.
- Several components show positive responses, but sample-specific peaks are observed at retention times of 3.76 minutes, 4.01 minutes, and 4.52 minutes compared to the control chromatogram ( Figure 13).
- An adduct corresponding to a retention time of 3.76 minutes is referred to as an adduct N
- an adduct corresponding to a retention time of 4.01 minutes is referred to as an adduct O
- an adduct corresponding to a retention time of 4.52 minutes is referred to as an adduct P.
- Examples 2 to 9 by using glutathione ethyl ester-d5 isomer represented by the formula (3) as a trapping reagent, positive results were correctly obtained for all eight compounds (no false negatives).
- the peaks of glutathione alkyl ester isotope substituent-reactive metabolite adduct and detection auxiliary compound-reactive metabolite adduct appear as characteristic isotope double lines. Yes. Therefore, the peaks of glutathione alkyl ester isotope substituent-reactive metabolite adduct and detection auxiliary compound-reactive metabolite adduct can be easily distinguished from other peaks. Therefore, the possibility of being determined as a false positive can be reduced. .
- the above measurement was performed using 7 compounds of clozapine, diclofenac, acetaminophen, omeprazole, imipramine, thienylic acid and quercetin as the target compounds. These seven compounds are known to generate reactive metabolites, and are compared with the case where the isotope-labeled compound of this embodiment is used as a trapping reagent in the detection of reactive metabolites. Selected. The final spectrum obtained for the control is shown in FIG.
- FIG. 29 shows the final chromatogram obtained for the target compound.
- Several components show positive responses, but a sample-specific peak is observed at a retention time of 3.59 minutes compared to the control chromatogram (FIG. 28).
- An adduct corresponding to a retention time of 3.59 minutes is referred to as adduct Q.
- adduct Q As shown in FIG. 36, for adduct Q, a peak was confirmed at a mass-to-charge ratio (m / z) of 679 Da.
- FIG. 30 shows the final chromatogram obtained for the target compound.
- Several components show positive responses, but sample-specific peaks are observed at retention times of 4.22 and 4.33 minutes compared to the control chromatogram ( Figure 28).
- An adduct corresponding to a retention time of 4.22 minutes is referred to as an adduct R
- an adduct corresponding to a retention time of 4.33 minutes is referred to as an adduct S.
- a peak was confirmed at a mass-to-charge ratio (m / z) of 646 Da.
- a peak was confirmed for the adduct S at a mass to charge ratio (m / z) of 660 Da.
- FIG. 31 shows the final chromatogram obtained for the target compound.
- Several components show positive responses, but a sample-specific peak is observed at a retention time of 5.49 minutes compared to the control chromatogram (FIG. 28).
- An adduct corresponding to a retention time of 5.49 minutes is referred to as adduct T.
- a peak was confirmed at a mass-to-charge ratio (m / z) of 645 Da.
- FIG. 32 shows the final chromatogram obtained for the target compound, but no sample-specific peak was observed.
- FIG. 33 shows the final chromatogram obtained for the target compound, but no sample-specific peak was observed.
- FIG. 34 shows the final chromatogram obtained for the target compound.
- Several components show positive responses, but a sample-specific peak is observed at a retention time of 2.18 minutes compared to the control chromatogram (FIG. 28).
- An adduct corresponding to a retention time of 2.18 minutes is referred to as an adduct U.
- a peak was confirmed at a mass-to-charge ratio (m / z) of 485 Da.
- FIG. 35 shows the final chromatogram obtained for the target compound.
- Several components show positive responses, but sample-specific peaks are observed at retention times of 3.63 minutes, 3.87 minutes and 4.35 minutes compared to the control chromatogram ( Figure 28).
- An adduct corresponding to a retention time of 3.63 minutes is referred to as an adduct V
- an adduct corresponding to a retention time of 3.87 minutes is referred to as an adduct W
- an adduct corresponding to a retention time of 4.35 minutes is referred to as an adduct X.
- Table 2 shows the results of Examples and Comparative Examples 1 to 7.
- the case where the isotope-labeled compound of the present embodiment is used as a trapping reagent is compared with the case where only glutathione ethyl ester is used as a trapping reagent.
- About 5 compounds among 7 compounds it turns out that the number of the reactive metabolite which was able to be confirmed in an Example is larger than a comparative example (omeprazole, a clozapine, a diclofenac, an imipramine, a thienyl acid).
- a comparative example omeprazole, a clozapine, a diclofenac, an imipramine, a thienyl acid.
- imipramine and thienylic acid no reactive metabolite was detected in the comparative example, and a negative result was obtained.
- both imipramine and thienylic acid are known to be compounds that generate reactive metabolites, and the result is “false negative”.
- the isotope-labeled compound of the present embodiment is less likely to be false negative than a compound conventionally used as a trapping reagent and is superior in use as a trapping reagent. .
- Target compound Omeprazole Omeprazole was used as the target compound. Except for performing MS / MS measurement in data dependent scan mode (Dynamic Exclusion ON mode) in which MS / MS measurement is performed in descending order of ion intensity in the MS / MS measurement corresponding to (Step 2-3). Measurements were performed in the same manner as in Comparative Example 1. In the data dependent scan mode (Dynamic Exclusion ON mode), the most intense ion of the peaks in the first spectrum is measured three times by MS / MS, then the ion is excluded, and then the strongest ion is removed. While performing 3 times of MS / MS measurement, the process is repeated in order of intensity. The measurement conditions used are as follows (measurement condition D). (Measurement condition D) Repeat Count: 3 Repeat Duration: 6.00 Exclusion List Size: 100 Exclusion Duration: 6.00
- FIG. 44 shows the final chromatogram obtained for the target compound.
- Several components show positive responses, but a sample-specific peak is observed at a retention time of 3.61 minutes compared to the control chromatogram (FIG. 28).
- An adduct corresponding to a retention time of 3.61 minutes is referred to as adduct Q2.
- adduct Q2 As shown in FIG. 45, for adduct Q2, a strong peak was confirmed at a mass-to-charge ratio (m / z) of 679 Da.
- Example 6 among the peaks of the first spectrum, only the isotope double line can be activated by collision, MS / MS measurement can be performed, and detection can be performed with high sensitivity.
- Comparative Example 8 the intensity is high. Activation is performed sequentially from ions. From this, it is considered that when the peak intensity of the trapping reagent-reactive metabolite adduct is low in the peak of the first spectrum, the number of collision activations is reduced and the sensitivity is lowered.
- the isotope-labeled compound of this embodiment is less likely to be false negative and is more excellent in use as a trapping reagent.
- Step 1 In vitro incubation and sample preparation for analysis Mixture of target compound (10 ⁇ mol / L, 10 nmol), glutathione (GSH) and glutathione glycine- 13 C 2 , 15 N in a molar ratio of 1: 0.7 (1 mmol / L, 1 ⁇ mol), rat liver microsomes (1 mg / mL, 1 mg), potassium phosphate buffer (pH 7.4) (100 mmol / L, 100 ⁇ mol), magnesium chloride (5 mmol / L, 5 ⁇ mol), and purified water
- the incubation mixture (reaction sample) containing was preincubated at 37 ° C. for 5 minutes.
- NADPH 20 mmol / L, 20 ⁇ mol
- Step 2 LC-MS analysis (Step 2-1) Liquid chromatography AQCUITY UPLC system (WATERS) was used for separation by chromatography. A portion (10 ⁇ L) of the prepared analytical sample was injected onto an AQCUITY UPLC BEH C18 column (2.1 ⁇ 100 mm, 1.7 ⁇ m). This chromatographic separation was performed under the gradient conditions shown in Table 3 at a mobile phase flow rate of 0.5 mL / min.
- WATERS Liquid chromatography AQCUITY UPLC system
- Step 2-2 Mass Spectrometry
- the LC column eluate obtained in Step 2-1 was introduced into an LTQ XL ion trap mass spectrometer. Ionization was performed in the positive mode of ESI (mode for detecting positively charged ions). The measurement conditions used are shown below (measurement conditions A).
- Measurement condition A ISplay Voltage: 5.0kV Capillary Temp: 350 °C Sheath Gas Flow Rate: 41 Aux Gas Flow Rate: 18 Sweep Gas Flow Rate: 6.5
- FIGS. 53 to 61 A full scan measurement with a mass-to-charge ratio (m / z) range of 450-900 was performed to obtain a first chromatogram and a first spectrum shown in FIGS. 53 to 61 (omeprazole: FIGS. 53 to 54, clozapine: FIG. 55-57, imipramine: FIG. 58, thienylic acid: FIG. 59, quercetin: FIGS. 60-61).
- Step 2-3 MS / MS Measurement Isotopic Data Dependency that MS / MS measurement is performed by collision activation of only “ion having an intensity ratio of 1: 0.7 with a difference of 3 amu” giving an isotope doublet A second spectrum was obtained by measurement in the dent scan mode.
- the measurement conditions used are shown below (measurement condition E).
- Measurement condition E Normalized Collision Energy: 35 Mass Difference: 3.00 Expected ratio: 0.7 Match tolerance: 0.15
- Step 2-4 Neutral loss filter
- the final chromatogram shown in FIGS. 46 to 52 was obtained by applying a 129 Da neutral loss filter to the data set obtained by the MS / MS measurement in step 2-3 (control).
- an isotope double line (double line having an intensity ratio of 1: 0.7 with a difference of 3 amu) appears in the mass analysis of step 2-2, and the second mass analysis (MS / MS (Measurement) represents the peak at which a neutral loss of 129 Da was detected.
- MS / MS Measurement
- the peaks appearing in the final chromatogram the peaks excluding the peak appearing in FIG. 46 (control) are considered to be peaks of the trapping reagent-reactive metabolite adduct.
- FIG. 47 shows the final chromatogram obtained for the object compound.
- Several components show positive responses, but retention times 1.13 minutes, 1.23 minutes, 1.95 minutes, 2.21 minutes and 2.1 compared to the control chromatogram (FIG. 46).
- Sample specific peaks are observed at 74 minutes, 2.88 minutes and 3.61 minutes. Among these, the peaks at 1.13 minutes, 1.23 minutes, 1.95 minutes, 2.21 minutes and 3.61 minutes are false positive peaks, and the peaks at 2.74 minutes and 2.88 minutes are trapped.
- An adduct corresponding to a retention time of 2.74 minutes is referred to as adduct Y.
- adduct Z An adduct corresponding to a retention time of 2.88 minutes is referred to as adduct Z.
- adduct Z characteristic isotope double lines having mass-to-charge ratios (m / z) of 621 and 624 Da were confirmed.
- adduct Z characteristic isotope double lines having mass-to-charge ratios (m / z) of 651 and 654 Da were confirmed.
- FIG. 48 shows the final chromatogram obtained for the target compound.
- Several components show positive responses, but sample-specific peaks are observed at retention times of 3.22, 3.37, and 3.50 minutes compared to the control chromatogram ( Figure 46).
- An adduct corresponding to a retention time of 3.22 minutes is referred to as an adduct AA
- an adduct corresponding to a retention time of 3.36 minutes is referred to as an adduct AB
- an adduct corresponding to a retention time of 3.50 minutes is referred to as an adduct AC.
- characteristic isotope double lines having mass-to-charge ratios (m / z) of 650 and 653 Da were confirmed for adduct AA.
- characteristic isotope double lines having a mass-to-charge ratio (m / z) of 618 and 621 Da were confirmed.
- a characteristic isotope doublet having mass-to-charge ratios (m / z) of 632 and 635 Da was confirmed for the adduct AC.
- FIG. 49 shows the final chromatogram obtained for the target compound.
- Several components show positive responses but are sample specific at retention times 3.65 min, 4.61 min, 4.78 min and 4.93 min compared to the control chromatogram ( Figure 46).
- the peak is observed.
- the peaks at 4.61 minutes, 4.78 minutes and 4.93 minutes are false positive peaks
- the peak at 3.65 minutes is the peak of the trapping reagent-reactive metabolite adduct.
- An adduct corresponding to a retention time of 3.65 minutes is referred to as adduct AD.
- a characteristic isotope double line having mass-to-charge ratios (m / z) of 574 and 577 Da was confirmed for adduct AD.
- FIG. 50 shows the final chromatogram obtained for the target compound.
- Several components show positive responses, but sample-specific peaks are observed at retention times of 4.85 and 8.71 minutes compared to the control chromatogram ( Figure 46).
- the peak at 8.71 minutes is a false positive peak
- the peak at 4.85 minutes is a peak of a trapping reagent-reactive metabolite adduct.
- An adduct corresponding to a retention time of 4.85 minutes is referred to as an adduct AE.
- characteristic isotope double lines having mass-to-charge ratios (m / z) of 636 and 639 Da were confirmed for adduct AE.
- FIG. 51 shows the final chromatogram obtained for the target compound, but no peak of the trapping reagent-reactive metabolite adduct was observed.
- FIG. 52 shows the final chromatogram obtained for the object compound.
- Several components show positive responses, but sample-specific peaks are observed at retention times 2.82 minutes and 3.16 minutes compared to the control chromatogram ( Figure 46).
- An adduct corresponding to a retention time of 2.82 minutes is referred to as an adduct AF
- an adduct corresponding to a retention time of 3.16 minutes is referred to as an adduct AG.
- FIG. 60 for the adduct AF, characteristic isotope double lines having mass-to-charge ratios (m / z) of 608 and 611 Da were confirmed.
- FIG. 61 for the adduct AG, characteristic isotope double lines having mass-to-charge ratios (m / z) of 608 and 611 Da were confirmed.
- Table 4 shows the results of Examples and Comparative Examples.
- the case where the isotope-labeled compound of this embodiment is used as a trapping reagent and the case where glutathione glycine- 13 C 2 , 15 N is used are compared.
- About 3 compounds among 6 compounds it turns out that the number of the reactive metabolites which were able to be confirmed in an Example is larger than a comparative example (imipramine, acetaminophen, quercetin).
- acetaminophen no reactive metabolite was detected in the comparative example, and a negative result was obtained.
- acetaminophen is also known to be a compound that generates a reactive metabolite, and the result is “false negative”.
- the isotope-labeled compound of this embodiment was used. In some cases, false positive peaks that were not confirmed were observed. From the above, the isotope-labeled compound of the present embodiment is less likely to be judged as false negative and false positive than the compound conventionally used as a trapping reagent, and is more excellent in use as a trapping reagent. I understand that.
- isotope-labeled compound that can be used as a trapping reagent, useful for selecting drug candidate compounds that produce reactive metabolites.
- a detection method and a detection reagent capable of detecting a reactive metabolite more accurately with fewer false negatives as well as false positives.
Landscapes
- Chemical & Material Sciences (AREA)
- Health & Medical Sciences (AREA)
- Life Sciences & Earth Sciences (AREA)
- Engineering & Computer Science (AREA)
- Organic Chemistry (AREA)
- Molecular Biology (AREA)
- Biomedical Technology (AREA)
- Physics & Mathematics (AREA)
- General Health & Medical Sciences (AREA)
- Medicinal Chemistry (AREA)
- Hematology (AREA)
- Biochemistry (AREA)
- Urology & Nephrology (AREA)
- Immunology (AREA)
- Analytical Chemistry (AREA)
- Food Science & Technology (AREA)
- Biophysics (AREA)
- Pathology (AREA)
- General Physics & Mathematics (AREA)
- Microbiology (AREA)
- Bioinformatics & Cheminformatics (AREA)
- Proteomics, Peptides & Aminoacids (AREA)
- Genetics & Genomics (AREA)
- Cell Biology (AREA)
- Pharmacology & Pharmacy (AREA)
- Biotechnology (AREA)
- Optics & Photonics (AREA)
- Other Investigation Or Analysis Of Materials By Electrical Means (AREA)
- Organic Low-Molecular-Weight Compounds And Preparation Thereof (AREA)
- Peptides Or Proteins (AREA)
Abstract
Description
一方、上記のグルタチオンまたはグルタチオンエチルエステルをトラッピング試薬として用いた場合、トラッピング試薬-反応性代謝物付加体を液体クロマトグラフィー-質量分析装置(LC-MS)等で検出する際に、トラッピング試薬-反応性代謝物付加体のピークの特定が難しいという事情が存在する。そのため、トラッピング試薬-反応性代謝物付加体のピークではないピークをトラッピング試薬-反応性代謝物付加体のピークであると見誤り、その結果、誤って反応性代謝物が生成されたと判定することもある(偽陽性)。

一般式(1)で表される置換体は、同位体を構造中に有している。よって、一般式(1)で表される置換体をトラッピング試薬として反応性代謝物の検出に用いた場合には、従来の同位体トラッピング試薬(グルタチオングリシン-13C2,15Nなど)と同様の原理で、LC-MS分析等においてトラッピング試薬-反応性代謝物付加体に由来するイオンピークの特定が容易となる。従って、偽陽性の少ない検出が可能となる。
すなわち、本発明は、以下の発明を含有する。
〔1〕一般式(1)で表されるグルタチオンアルキルエステル同位体置換体。

式(1)中、R1は、含有される炭素原子、酸素原子および水素原子のうち少なくとも1つが同位体標識されている炭素数が1~8である直鎖もしくは分岐のアルコキシ基、または含有される炭素原子、酸素原子および水素原子のうち少なくとも1つが同位体標識されている炭素数が3~8であるシクロアルコキシ基を示す。
〔2〕一般式(2)で表され、星印*の付与されている炭素原子、酸素原子、および水素原子のうち少なくとも1つが同位体標識されている〔1〕に記載のグルタチオンアルキルエステル同位体置換体。

〔3〕一般式(3)で表される〔1〕に記載のグルタチオンアルキルエステル同位体置換体。

式(3)中、Dは重水素(2H)を表す。
〔4〕〔1〕から〔3〕のいずれか一項に記載のグルタチオンアルキルエステル同位体置体を用いて、反応性代謝物を検出する方法。
〔5〕〔4〕に記載の方法において、
〔1〕から〔3〕のいずれか一項に記載のグルタチオンアルキルエステル同位体置換体、当該グルタチオンアルキルエステル同位体置換体が有する原子のうち少なくとも1つが質量数が異なる原子に置き換えられている化合物である検出補助化合物、および医薬品候補化合物を含む反応試料を薬物代謝酵素の存在下においてインキュベートすることにより、グルタチオンアルキルエステル同位体置換体-反応性代謝物付加体および検出補助化合物-反応性代謝物付加体を生じさせ、
液体クロマトグラフィー-質量分析装置(LC-MS)を用いた分析において、生じたグルタチオンアルキルエステル同位体置換体-反応性代謝物付加体および検出補助化合物-反応性代謝物付加体の質量ピークを検出することを含む、反応性代謝物を検出する方法。〔6〕〔5〕に記載の方法において、
前記反応試料中における〔1〕から〔3〕のいずれか一項に記載の前記グルタチオンアルキルエステル同位体置換体と前記検出補助化合物のモル比率が2:1から1:2である、反応性代謝物を検出する方法。
〔7〕〔5〕または〔6〕に記載の方法において、
インキュベートすることにより得られた生成物にジチオスレイトール、2-メルカプトエタノール、またはトリス(2-カルボキシエチル)フォスフィンを添加した後、前記液体クロマトグラフィー-質量分析装置(LC-MS)を用いた分析を行うことをさらに含む、反応性代謝物を検出する方法。
〔8〕〔5〕から〔7〕のうちいずれか1つに記載の方法において、
前記液体クロマトグラフィー-質量分析装置(LC-MS)を用いた分析において、ニュートラルロススキャン法またはフルスキャン法を行う、反応性代謝物を検出する方法。
〔9〕〔5〕から〔8〕のうちいずれか1つに記載の方法において、
前記検出補助化合物が、前記反応試料中に含まれる〔1〕から〔3〕のいずれか一項に記載のグルタチオンアルキルエステル同位体置換体の非標識化合物である、反応性代謝物を検出する方法。
〔10〕グルタチオンに、重水素化アルコールを反応させることにより、〔1〕から〔3〕のいずれか一項に記載の前記グルタチオンアルキルエステル同位体置換体を製造する方法。
〔11〕〔10〕に記載の方法において、
前記重水素化アルコールがエタノール-d6であるグルタチオンアルキルエステル置換体を製造する方法。
本実施形態においては、同位体標識化合物である一般式(1)で表される置換体を用いて反応性代謝物の検出を行う。

なお、以下において、一般式が有する官能基の定義については、すでに記載した定義を引用してその説明を省略することがある。
本明細書に記載されている「同位体標識化合物」とは、含まれる原子のうち少なくとも1つが、同位体によって置換されている化合物をいう。また、本明細書に記載されている同位体とは、同じ原子番号を有するが、天然において優勢である質量数(中性子の数)とは異なる質量数を有する原子をいう。
薬物代謝酵素は単離された態様で使用されてもよいほか、細胞もしくは細胞画分に含有されている態様で使用されてもよく、当業者が適宜設定できる。
薬物代謝酵素は、補酵素と組み合わせて反応性代謝物検出のために使用してもよい。補酵素には、酸化型ニコチンアミドアデニンジヌクレオチド(NAD+)、酸化型ニコチンアミドアデニンジヌクレオチドリン酸(NADP+)などの酸化型補酵素と、還元型ニコチンアミドアデニンジヌクレオチド(NADH)、還元型ニコチンアミドアデニンジヌクレオチドリン酸(NADPH)などの還元型補酵素がある。好ましくは、NADPHまたはNADP+が薬物代謝酵素と組み合わされて使用される。
好ましい態様としては、肝細胞、肝S9または肝ミクロソームが、補酵素であるNADPHまたはNADP+と組み合わせて反応性代謝物検出のために使用される。このうち、肝ミクロソームとNADPHの組み合わせがより好ましい。
質量電荷比(m/z)とは、質量分析により得られる値であり、測定試料中の分子をイオン化させ、得られてくるイオンの質量(m)を電荷数(z)で除した値である。イオンの質量電荷比(m/z)の値と電荷数(z)の値より、分子の質量を求めることができる。
液体クロマトグラフィー(LC)には高速液体クロマトグラフィー(HPLC)、Ultra Performance LC(UPLC)、Ultra Fast LC(UFLC)を挙げることができ、中でもUPLCが好ましい。
質量分析装置(MS)において使用されるスキャン方法としては、フルスキャン法、ニュートラルロススキャン法、SRM法またはプロダクトイオンスキャン法があげられる。このうち、偽陰性と判定される場合をより少なくできるので、ニュートラルロススキャン法またはフルスキャン法を用いることが好ましい。
ニュートラルロススキャン法とは、任意に選択可能な質量電荷比(m/z)の範囲において親イオンを連続的に検出する方法であるが、そのうち、特定の質量数の中性分子を脱離する親イオンを検出する方法である。
予測不可能な反応性代謝物が生成する場合、SRM法を使用すると、検出もれが生じる可能性があるが、フルスキャン法を使用することにより、網羅的な検出が可能となる。医薬品の開発においては、予想できない反応性代謝物を補足できることは有用であり、次の医薬品候補化合物の設計に繋がる重要な情報となる。
本明細書中に記載されている「マススペクトル」とは、任意の時間におけるMS測定結果を、質量電荷比(m/z)を横軸に、相対存在量を縦軸に表したものである。
炭素原子の同位体としては、13Cまたは14Cが挙げられる。酸素原子の同位体としては、18Oが挙げられる。水素原子の同位体としては、2H(Dとも表される)または3Hが挙げられる。
検出補助化合物の分子量は、質量分析等における特定の容易さなどを考慮して当業者が適宜設定することができる。
検出補助化合物は、本実施形態のグルタチオンアルキルエステル同位体置換体と同様、反応性代謝物と結合するため、反応性代謝物の検出におけるトラッピング試薬の1つということもできる。
検出補助化合物として、例えば、反応試料に混合される一般式(1)で表される置換体の非標識化合物を用いることができる。なお、非標識化合物とは、グルタチオンアルキルエステル同位体置換体が有する同位体である原子全てが非同位体である原子に置換されている化合物を意味する。
すなわち、グルタチオンアルキルエステル同位体置換体が炭素原子の同位体13Cを有する場合は、その非標識化合物とは、当該13Cが12Cに置換されている化合物をいう。同様に、グルタチオンアルキルエステル同位体置換体が酸素原子の同位体18Oを有する場合は、その非標識化合物とは、当該18Oが16Oに置換されている化合物をいう。そして、グルタチオンアルキルエステル同位体置換体が水素原子の同位体2Hを有する場合は、その非標識化合物とは、当該2Hが1Hに置換された構造を有する化合物を意味する。
本明細書中に記載されている「検出補助化合物-反応性代謝物」とは、検出補助化合物と、反応性代謝物との共有結合複合体を意味する。
本明細書中に記載されている「グルタチオンアルキルエステル同位体置換体-反応性代謝物付加体」とは、本実施形態の同位体標識化合物であるグルタチオンアルキルエステル同位体置換体と、反応性代謝物との共有結合複合体を意味する。
本明細書中に記載されている「偽陰性」とは、医薬品候補化合物と薬物代謝酵素とのインキュベートにおいて、実際には反応性代謝物が生成されたにも係らず、反応性代謝物が生成されていないとの結果(陰性)を示すことを意味する。偽陰性は、反応性代謝物を生成する化合物を安全な化合物と見誤ることになるので、好ましくない。
反応性代謝物の検出の一例について説明する。
(工程1)インビトロ・インキュベーション及びサンプル調製
一般式(1)で表される置換体、検出補助化合物、および医薬品候補化合物を混合し、反応試料とする。一般式(1)で表される置換体と検出補助化合物との割合は特に限定されず、当業者が適宜設定できるが、モル比率で2:1から1:2であることが好ましく、1:1であることがより好ましい。当該反応試料を、薬物代謝酵素の存在下、インキュベートする。インキュベーションの条件は特に限定されない。例えば、薬物代謝酵素の濃度および医薬品候補化合物の濃度などは、当業者が後述する工程2のLC-MS分析において求める感度に応じて適宜設定できる。薬物代謝酵素は、上述のとおりミクロソーム画分などに含まれて反応試料中に混合されていてもよい。よって、薬物代謝酵素の濃度は、反応試料中のタンパク質濃度に基づき調整することもできる。また、反応時間および反応温度についてもLC-MS分析において求める感度に応じて適宜設定でき、例えば37℃で60分とすることができる。
薬物代謝酵素は、反応試料中、細胞や細胞画分に含有される態様で存在していてもよい。また、この反応試料には、NADPHなどの補酵素を添加してもよい。インキュベーション後、LC―MSを用いて分析を行う。
LC―MS分析の一例の概略図を図1に示す。図1中に記載されている4種類の機器データチャートをそれぞれ上から順番に、第1クロマトグラム、第1スペクトル、第2スペクトル、および最終クロマトグラムと称呼する。
第1クロマトグラムは、液体クロマトグラフィー(LC)により化合物が分離されたLC溶出液を、質量分析装置(MS)に順次導入し、質量分析を行った結果を示すチャートである。第1クロマトグラムにおいて、横軸は、各ピークに対応する化合物の液体クロマトグラフィーのカラムにおける保持時間(以下、単に保持時間と称す)を示し、また、縦軸は、各ピークに対応するイオンの相対存在量を示している。
第1スペクトルは、第1クロマトグラム上の特定の時点における質量分析結果を示すチャートである。第1スペクトルにおいて、横軸は、質量電荷比(m/z)を示し、縦軸は、各ピークに対応するイオンの相対存在量を示している。
最終クロマトグラムは、第1クロマトグラムに表されたピークのうち、MS/MS測定において指定した質量のニュートラルロスが検出されたピークのみを、クロマトグラムとして表示させるチャートである。最終クロマトグラムにおいて、横軸は保持時間を示し、縦軸は各ピークに対応するイオンの相対存在量を示す。
質量分析の測定範囲は、対象化合物とトラッピング試薬から生成する付加体の質量電荷比(m/z)を検出できる範囲が良く、例えば質量電荷比(m/z)の範囲を350-1200に選択した条件でのフルスキャン測定が好ましい。
グルタチオンアルキルエステル構造を有する化合物からは、衝突活性化により、質量数129Daのピログルタミン酸分子が脱離することが知られている。よって、MS/MS測定は、この129Daのニュートラルロスが検出できるエネルギー設定で衝突活性化を行うことが好ましい。
このMS/MS測定の結果、第2スペクトルが得られる。好ましいエネルギー設定範囲は、Normalized Collision Energy 5~50の範囲である。
「アイソトピックデータディペンデントスキャンモード」とは、フルスキャン測定時に、あらかじめ指定した質量差および強度比のイオンが検出された場合のみ、MS/MS測定を実施するモードである。
ここで、「ニュートラルロスフィルター」とは、取得済みのデータに対し、指定した質量のニュートラルロスがあるもののみを、クロマトグラムとして表示させるデータ解析法である。ニュートラルロスフィルターを使用することにより、最終クロマトグラムが得られる(図1参照)。最終クロマトグラムを得ることで、生成されたトラッピング試薬-反応性代謝物付加体の特有のピークをより容易に特定することができる。
一般式(1)で表される置換体の製造方法の一例をScheme1に示す。

一般式(1)で表されるグルタチオンアルキルエステル同位体置換体は、例えば、一般式(4)で表されるグルタチオンから誘導することにより製造することができる。
例えば、式(4)で表されるグルタチオンを、触媒存在下、同位体を含有する一般式(5)で表されるアルコールと反応させることにより、製造することができる。


反応温度は0℃~同位体を含有するアルコールの沸点の範囲が挙げられるが、好ましくは20℃~40℃であり、さらに好ましくは25℃~35℃である。
トラッピング試薬として使用されていた従来の同位体標識化合物では、同位体をグルタチオンの構成アミノ酸である、グリシン残基中に有していた(特許文献2、非特許文献3、4)。本発明者らは、グルタチオンの構成アミノ酸部分ではないR1に含まれる元素を同位体標識することで、トラッピング試薬として使用できる、安価な同位体標識化合物の提供を可能とした。
一方、従来技術であるグルタチオングリシン-13C2,15Nに関しては、市販されているものの、非常に高価な試薬であり、大量に入手することが困難である。また、別途合成する場合も、非常に高価なグリシン同位体置換体を原料としているほか、グルタチオングリシン-13C2,15Nを得るまでには、5段階を必要とする。よって、グルタチオングリシン-13C2,15Nを安価に入手することは極めて困難である(非特許文献4)(Scheme2)。
以上、本実施形態によれば、トラッピング試薬として使用できる、より安価な同位体標識化合物を提供することができるので、より膨大な数の医薬品候補化合物のスクリーニングが実現可能となる。研究開発の初期段階で簡便に毒性が評価できることは、医薬品開発のスピードアップにも繋がり、意義が大きい。
また、本実施形態においては、トラッピング試薬(一般式(1)で表される置換体、補助検出化合物)、および医薬品候補化合物を含む反応試料のインキュベーションにおいて、トラッピング試薬と反応性代謝物とを反応させてトラッピング試薬-反応性代謝物付加体を生じさせる。よって、LC-MS分析等においてトラッピング試薬-反応性代謝物付加体に由来するイオンピークが、例えば検出補助二重線である多重線として出現する。検出補助二重線のような多重線は、単独のピークよりも特定が容易である。したがって、反応性代謝物の検出において、偽陽性のより少ない検出が可能となる。
さらに、本実施形態に係るグルタチオンアルキルエステル同位体置換体-反応性代謝物付加体の特徴的なピークは、LC-MS分析においてフルスキャン法またはニュートラルロススキャン法などの、広い範囲の連続的なイオンが検出可能な測定方法を適用することで、より検出しやすくなる。よって、偽陰性と判定されるケースをより少なくした検出も可能である。
グルタチオンエチルエステル-d5体(式(3))の合成

グルタチオン還元型(503.8mg、1.64mmol)をエタノール-d6(99.5ATOM%D)(5mL)に懸濁させたのち、濃硫酸(0.137mL、2.56mmol)を添加し、反応液とした。反応液を室温で30分間撹拌したのち、室温で21時間静置した。この反応液にトリエチルアミン(0.714mL)を加えて中和し、エタノール(10mL)、ジイソプロピルエーテル(10mL)を加え、生成物を晶析させた。4℃で16時間静置したのち、結晶をろ取した。35℃で3時間減圧乾燥することで、472mg(収率85%)の白色固体を得た。
ESI-MS(Positive)m/z 336 [M+H]+
1H-NMR(D2O,400MHz) δ:1.98-2.04(2H,m),2.35-2.42(2H,m),2.79-2.81(2H,m),3.63(1H,t,J=6.08Hz),3.87-3.88(1H,m),4.41(1H,t,J=6.12Hz)
(工程1)インビトロ・インキュベーション及び分析用サンプル調製
以下の実施例2~9においては、反応性代謝物の検出試験において反応性代謝物を生じさせる基質化合物を対象化合物と称す。
対象化合物(10μmol/L、10nmol)、グルタチオンエチルエステル(GSHEE)とグルタチオンエチルエステル-d5体(GSHEE―d5)をモル比1:1の割合で混合した混合物(1mmol/L、1μmol)、ラット肝ミクロソーム(1mg/mL、1mg)、リン酸カリウム・バッファー(pH7.4)(100mmol/L、100μmol)、塩化マグネシウム(5mmol/L、5μmol)、および精製水を含有するインキュベーション混合物(反応試料)を37℃で5分間プレインキュベートした。プレインキュベートしたインキュベーション混合物に、NADPH(20mmol/L、20μmol)を添加し、反応(インキュベーション)を開始した。最終インキュベーション容量は1mLであった。また、対象化合物を含まないサンプルを、コントロールとして使用した。
37℃で60分間のインキュベーション後、50mmol/Lジチオスレイトール水溶液(100μL、5μmol)をインキュベーション混合物に添加し、5分間10,000gで遠心分離に供した。あらかじめ1mLのメタノールで洗浄後、1mLの精製水で活性化した固相抽出カラム(OASIS HLB 1cc,30mg)に、前記遠心上清を、供した。1mLの水、1mLの5%メタノール水により洗浄を行った後、さらに1mLのメタノールにより反応生成物を溶出させた。窒素気流下で溶媒を留去し、残渣を150μLのアセトニトリル:水(2:8)に溶解させ、分析用サンプルとした。
(工程2)LC―MS分析
(工程2-1)液体クロマトグラフィー
クロマトグラフィーによる分離は、AQCUITY UPLCシステム(WATERS)を使用した。調製された分析用サンプルの一部(10μL)を、AQCUITY UPLC BEH C18カラム(2.1×100mm、1.7μm)上にインジェクトした。このクロマトグラフィーによる分離を、0.5mL/分の移動相流速で下表に示すグラジエント条件で行った。

工程2-1で得られたLCカラム溶出液を、LTQ XL イオントラップ型質量分析計に導入した。イオン化は、ESIのポジティブモード(正に荷電したイオンを検出するモード)で行った。使用した測定条件を以下に示す(測定条件A)。
(測定条件A)
ISplay Voltage: 5.0kV
Capillary Temp: 350℃
Sheath Gas Flow Rate: 41
Aux Gas Flow Rate: 18
Sweep Gas Flow Rate: 6.5
質量電荷比(m/z)の範囲が400-800にわたるフルスキャン測定を行い、第1クロマトグラムおよび図6~図12、図19~図27に示す第1スペクトルを得た(クロザピン:図6~8、チクロピジン:図9~10、ジクロフェナク:図11~12、アセトアミノフェン:図19、オメプラゾール:図20~21、イミプラン:図22~23、チエニル酸:図24、ケルセチン:図25~27)。
(工程2-3)MS/MS測定
同位体二重線を与える“5amuの差で1:1の強度比をもつイオン”のみを衝突活性化してMS/MS測定するアイソトピックデータディペンデントスキャンモードで測定し、第2スペクトルが得られた。使用した測定条件を以下に示す(測定条件B)。
(測定条件B)
Normalized Collision Energy:35
Mass Difference:5.00
Expected ratio: 1.00
Match tolerance:0.15
(工程2-4)ニュートラルロスフィルター
工程2-3のMS/MS測定により得られたデータセットに129Daのニュートラルロスフィルターを適用することにより、図2~5、13~18に示す最終クロマトグラムを取得した(コントロール:図2および図13、クロザピン:図3、チクロピジン:図4、ジクロフェナク:図5、アセトアミノフェン:図14、オメプラゾール:図15、イミプラン:図16、チエニル酸:図17、ケルセチン:図18)。
なお、反応試料に混合されるラット肝ミクロソームのロットが異なることや質量分析計におけるイオン化状態や感度の違いなどに応じて、前述のクロマトグラムのピークの出現状態および後述する質量分析におけるスペクトルのピークの出現状態が異なることがある。そのため、より正確な分析を行うために、実施例1~4のコントロール(図2)とは別に、実施例5~9については新たにコントロールの調製および測定を行っている(図13)。
最終クロマトグラムは、工程2-2の質量分析で同位体二重線(5amuの差で1:1の強度比を持つ二重線)が現れ、且つ第二の質量分析(MS/MS測定)で、129Daのニュートラルロスが検出されたピークを表す。最終クロマトグラムに表れるピークのうち、コントロール(図2または図13)でも表れたピークを除いたピークが、トラッピング試薬―反応性代謝物付加体のピークと考えられる。
対象化合物として、クロザピン、チクロピジン、ジクロフェナク、アセトアミノフェン、オメプラゾール、イミプラミン、チエニル酸及びケルセチンを用いて、上記の測定を行った。なお、これら8つの化合物は、反応性代謝物を生成することが知られており、本実施形態に係わる同位体標識化合物の1つであるグルタチオンエチルエステル-d5体が、反応性代謝物の検出に使用できるのかどうか立証するため、選択された。

対象化合物:クロザピン
図3は、対象化合物について得られた最終クロマトグラムを示している。数種の成分が正の応答を示しているが、コントロールのクロマトグラム(図2)と比較し、保持時間4.81分、4.89分および5.02分においてサンプル特有のピークが認められる。保持時間4.81分に対応する付加体を付加体A、保持時間4.89分に対応する付加体を付加体B、保持時間5.02分に対応する付加体を付加体Cとする。図6に示されるように、付加体Aについて、質量電荷比(m/z)が678および683Daである特徴的な同位体二重線が確認された。図7に示されるように、付加体Bについて、質量電荷比(m/z)が646および651Daである特徴的な同位体二重線が確認された。図8に示されるように、付加体Cについて、質量電荷比(m/z)が660および665Daである特徴的な同位体二重線が確認された。
以上の結果より、クロザピンはグルタチオンエチルエステル-d5体をトラッピング試薬として用いた場合でも陽性と判定され、3種類の反応性代謝物を生成していることが確認できた。
対象化合物:チクロピジン
図4は、対象化合物について得られた最終クロマトグラムを示している。数種の成分が正の応答を示しているが、コントロールのクロマトグラム(図2)と比較し、保持時間3.92分および4.03分においてサンプル特有のピークが認められる。保持時間3.92分に対応する付加体を付加体D、保持時間4.03分に対応する付加体を付加体Eとする。図9に示されるように、付加体Dについて、質量電荷比(m/z)が631および636Daである特徴的な同位体二重線が確認された。図10に示されるように、付加体Eについて、質量電荷比(m/z)が631および636Daである特徴的な同位体二重線が確認された。
以上の結果より、チクロピジンはグルタチオンエチルエステル-d5体をトラッピング試薬として用いた場合でも陽性と判定され、2種類の反応性代謝物を生成していることが確認できた。
対象化合物:ジクロフェナク
図5は、対象化合物について得られた最終クロマトグラムを示している。数種の成分が正の応答を示しているが、コントロールのクロマトグラム(図2)と比較し、保持時間5.54分および5.78分においてサンプル特有のピークが認められる。保持時間5.54分に対応する付加体を付加体F、保持時間5.78分に対応する付加体を付加体Gとする。図11に示されるように、付加体Fについて、質量電荷比(m/z)が611および616Daである特徴的な同位体二重線が確認された。図12に示されるように、付加体Gについて、質量電荷比(m/z)が645および650Daである特徴的な同位体二重線が確認された。
以上の結果より、ジクロフェナクはグルタチオンエチルエステル-d5体をトラッピング試薬として用いた場合でも陽性と判定され、2種類の反応性代謝物を生成していることが確認できた。
対象化合物:アセトアミノフェン
図14は、対象化合物について得られた最終クロマトグラムを示している。数種の成分が正の応答を示しているが、コントロールのクロマトグラム(図13)と比較し、保持時間2.33分においてサンプル特有のピークが認められる。保持時間2.33分に対応する付加体を付加体Hとする。図19に示されるように、付加体Hについて、質量電荷比(m/z)が485および490Daである特徴的な同位体二重線が確認された。
以上の結果より、アセトアミノフェンはグルタチオンエチルエステル-d5体をトラッピング試薬として用いた場合でも陽性と判定され、1種類の反応性代謝物を生成していることが確認できた。
対象化合物:オメプラゾール
図15は、対象化合物について得られた最終クロマトグラムを示している。数種の成分が正の応答を示しているが、コントロールのクロマトグラム(図13)と比較し、保持時間3.92分および3.99分においてサンプル特有のピークが認められる。保持時間3.92分に対応する付加体を付加体I、保持時間3.99分に対応する付加体を付加体Jとする。図20に示されるように、付加体Iについて、質量電荷比(m/z)が649および654Daである特徴的な同位体二重線が確認された。図21に示されるように、付加体Jについて、質量電荷比(m/z)が679および684Daである特徴的な同位体二重線が確認された。
以上の結果より、オメプラゾールはグルタチオンエチルエステル-d5体をトラッピング試薬として用いた場合でも陽性と判定され、2種類の反応性代謝物を生成していることが確認できた。
対象化合物:イミプラミン
図16は、対象化合物について得られた最終クロマトグラムを示している。数種の成分が正の応答を示しているが、コントロールのクロマトグラム(図13)と比較し、保持時間4.27分および4.33分においてサンプル特有のピークが認められる。保持時間4.27分に対応する付加体を付加体K、保持時間4.33分に対応する付加体を付加体Lとする。図22に示されるように、付加体Kについて、質量電荷比(m/z)が602および607Daである特徴的な同位体二重線が確認された。図23に示されるように、付加体Lについて、質量電荷比(m/z)が648および653Daである特徴的な同位体二重線が確認された。
以上の結果より、イミプラミンはグルタチオンエチルエステル-d5体をトラッピング試薬として用いた場合でも陽性と判定され、2種類の反応性代謝物を生成していることが確認できた。
対象化合物:チエニル酸
図17は、対象化合物について得られた最終クロマトグラムを示している。数種の成分が正の応答を示しているが、コントロールのクロマトグラム(図13)と比較し、保持時間5.74分においてサンプル特有のピークが認められる。保持時間5.74分に対応する付加体を付加体Mとする。図24に示されるように、付加体Mについて、質量電荷比(m/z)が664および669Daである特徴的な同位体二重線が確認された。
以上の結果より、チエニル酸はグルタチオンエチルエステル-d5体をトラッピング試薬として用いた場合でも陽性と判定され、1種類の反応性代謝物を生成していることが確認できた。
対象化合物:ケルセチン
図18は、対象化合物について得られた最終クロマトグラムを示している。数種の成分が正の応答を示しているが、コントロールのクロマトグラム(図13)と比較し、保持時間3.76分、4.01分および4.52分においてサンプル特有のピークが認められる。保持時間3.76分に対応する付加体を付加体N、保持時間4.01分に対応する付加体を付加体O、保持時間4.52分に対応する付加体を付加体Pとする。図25に示されるように、付加体Nについて、質量電荷比(m/z)が636および641Daである特徴的な同位体二重線が確認された。図26に示されるように、付加体Oについて、質量電荷比(m/z)が636および641Daである特徴的な同位体二重線が確認された。図27に示されるように、付加体Pについて、質量電荷比(m/z)が636および641Daである特徴的な同位体二重線が確認された。
以上の結果より、ケルセチンはグルタチオンエチルエステル-d5体をトラッピング試薬として用いた場合でも陽性と判定され、3種類の反応性代謝物を生成していることが確認できた。
(偽陰性なし)。
また、実施例2~9において、グルタチオンアルキルエステル同位体置換体-反応性代謝物付加体、および検出補助化合物-反応性代謝物付加体のピークが、特徴的な同位体二重線として現れている。そのため、グルタチオンアルキルエステル同位体置換体-反応性代謝物付加体および検出補助化合物-反応性代謝物付加体のピークとそれ以外のピークとが容易に判別できる。よって、偽陽性と判定される可能性を小さくできる。。
トラッピング試薬として、グルタチオンエチルエステル(GSHEE)とグルタチオンエチルエステル-d5体(GSHEE―d5)の混合物に代えて、グルタチオンエチルエステル(1mmol/L、1μmol)を用い、前記(工程1)~(工程2)と同様の方法で反応および測定を行った。
(測定条件C)
Activation Type:CID
Normalized Collision Energy:35
また、コントロールについて得られた最終スペクトルを図28に示す。
対象化合物:オメプラゾール
図29は、対象化合物について得られた最終クロマトグラムを示している。数種の成分が正の応答を示しているが、コントロールのクロマトグラム(図28)と比較し、保持時間3.59分においてサンプル特有のピークが認められる。保持時間3.59分に対応する付加体を付加体Qとする。図36に示されるように、付加体Qについて、質量電荷比(m/z)が679Daにピークが確認された。
対象化合物:ケルセチン
図35は、対象化合物について得られた最終クロマトグラムを示している。数種の成分が正の応答を示しているが、コントロールのクロマトグラム(図28)と比較し、保持時間3.63分、3.87分および4.35分においてサンプル特有のピークが認められる。保持時間3.63分に対応する付加体を付加体V、保持時間3.87分に対応する付加体を付加体W、持時間4.35分に対応する付加体を付加体Xとする。図41に示されるように、付加体Vについて、質量電荷比(m/z)が636Daにピークが確認された。図42に示されるように、付加体Wについて、質量電荷比(m/z)が636Daにピークが確認された。図43に示されるように、付加体Xについて、質量電荷比(m/z)が636Daにピークが確認された。
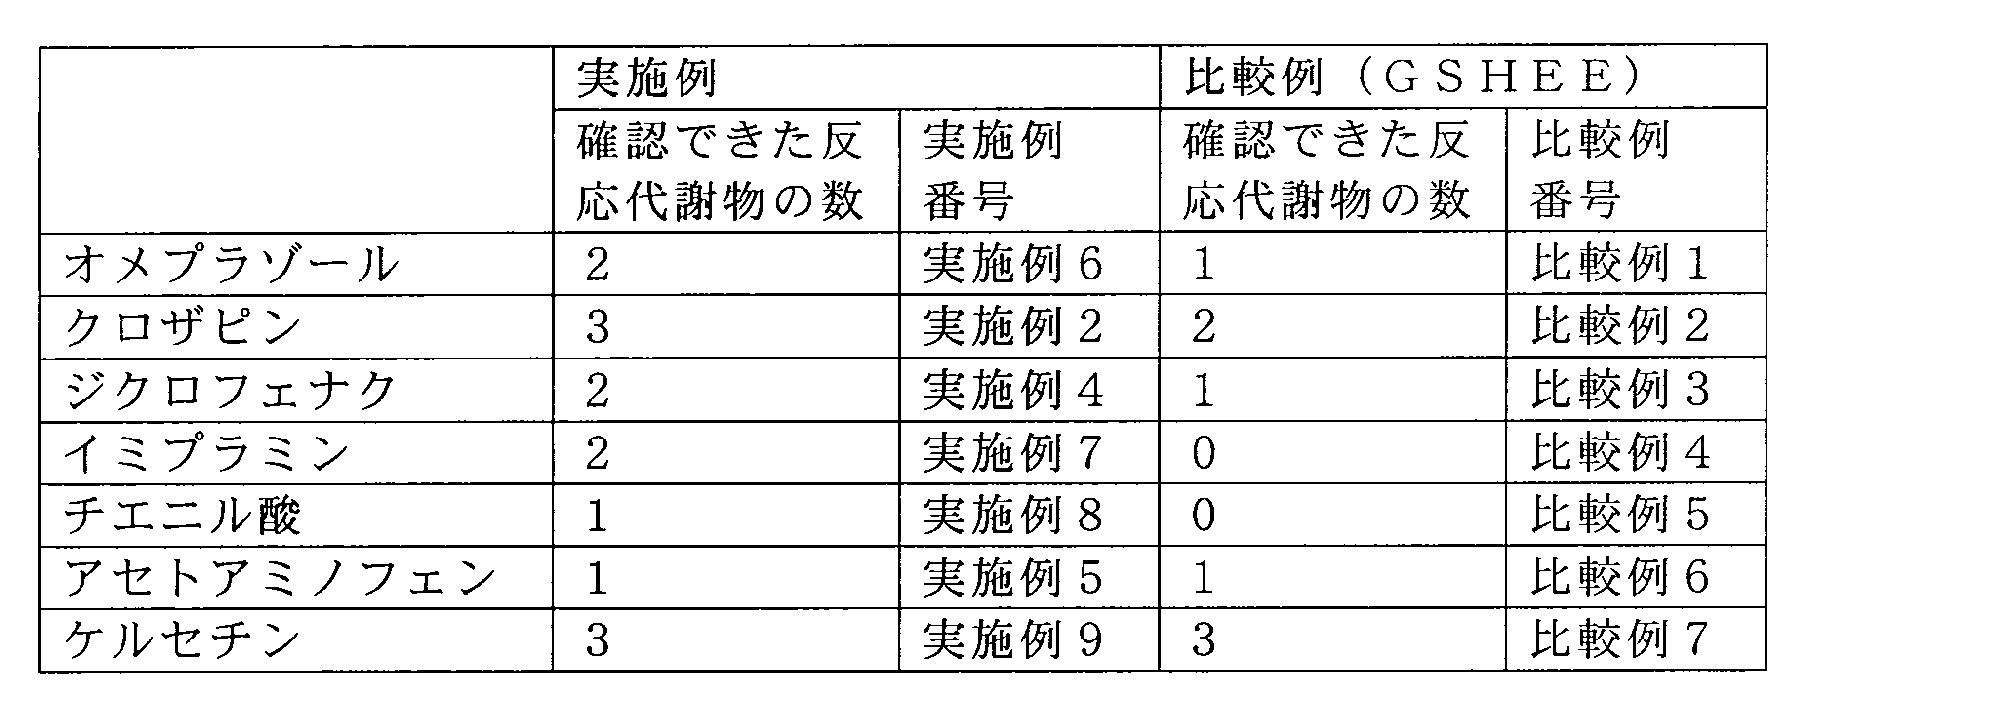
特に、イミプラミンやチエニル酸においては、比較例では1つも反応性代謝物が検出できておらず、陰性結果が出ている。前述した通り、イミプラミン、チエニル酸のいずれも反応性代謝物を生成する化合物であることが知られており、当該結果は、「偽陰性」である。
一方、比較例1~7ではグルタチオンエチルエステルを用いているため、同位体二重線は観測されない。比較例1~7では最も強度の強いイオンを衝突活性化しているが、トラッピング試薬-反応代謝物付加体のピーク強度が低い場合、当該ピークは衝突活性化を受けず、その結果、確認できる反応性代謝物の数が減ったと考えられる。
対象化合物:オメプラゾール
対象化合物としてオメプラゾールを用いた。(工程2-3)に対応するMS/MS測定においてイオンの強度の高い順にMS/MS測定を実行するデータディペンデントスキャンモード(Dynamic Exclusion ONモード)でMS/MS測定を行った以外は、比較例1と同様に測定を行った。データディペンデントスキャンモード(Dynamic Exclusion ONモード)は、第一スペクトル内のピークのうち最も強度の強いイオンを3回MS/MS測定した後、当該イオンを除外し、次に強度の強いイオンを3回MS/MS測定するとともに、当該処理を強度の順に繰り返し行う。使用した測定条件は以下の通りである(測定条件D)。
(測定条件D)
Repeat Count:3
Repeat Duration:6.00
Exclusion List Size:100
Exclusion Duration:6.00
(工程1)インビトロ・インキュベーション及び分析用サンプル調製
対象化合物(10μmol/L、10nmol)、グルタチオン(GSH)とグルタチオングリシン-13C2,15Nをモル比1:0.7の割合で混合した混合物(1mmol/L、1μmol)、ラット肝ミクロソーム(1mg/mL、1mg)、リン酸カリウム・バッファー(pH7.4)(100mmol/L、100μmol)、塩化マグネシウム(5mmol/L、5μmol)、および精製水を含有するインキュベーション混合物(反応試料)を37℃で5分間プレインキュベートした。プレインキュベートしたインキュベーション混合物に、NADPH(20mmol/L、20μmol)を添加し、反応(インキュベーション)を開始した。最終インキュベーション容量は1mLであった。また、対象化合物を含まないサンプルを、コントロールとして使用した。
(工程2-1)液体クロマトグラフィー
クロマトグラフィーによる分離は、AQCUITY UPLCシステム(WATERS)を使用した。調製された分析用サンプルの一部(10μL)を、AQCUITY UPLC BEH C18カラム(2.1×100mm、1.7μm)上にインジェクトした。このクロマトグラフィーによる分離を、0.5mL/分の移動相流速で表3に示すグラジエント条件で行った。
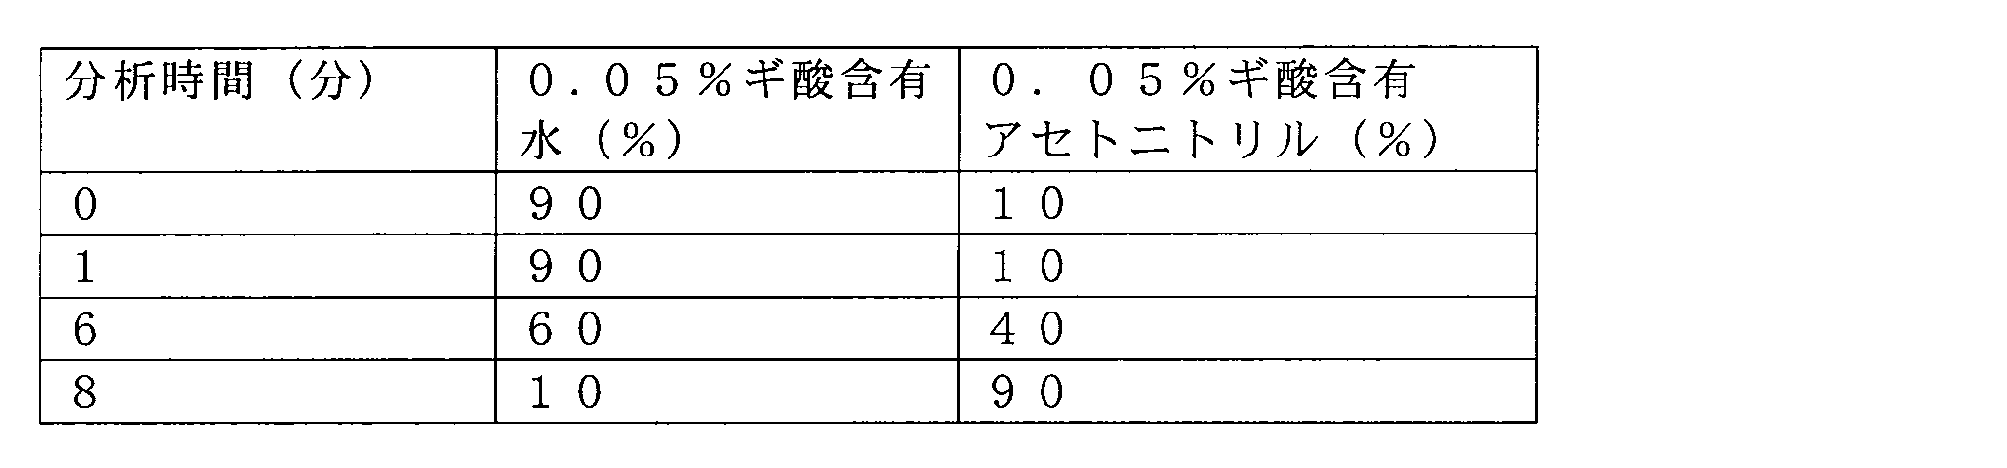
工程2-1で得られたLCカラム溶出液を、LTQ XL イオントラップ型質量分析計に導入した。イオン化は、ESIのポジティブモード(正に荷電したイオンを検出するモード)で行った。使用した測定条件を以下に示す(測定条件A)。
(測定条件A)
ISplay Voltage: 5.0kV
Capillary Temp: 350℃
Sheath Gas Flow Rate: 41
Aux Gas Flow Rate: 18
Sweep Gas Flow Rate: 6.5
同位体二重線を与える“3amuの差で1:0.7の強度比をもつイオン”のみを衝突活性化してMS/MS測定するアイソトピックデータディペンデントスキャンモードで測定し、第2スペクトルが得られた。使用した測定条件を以下に示す(測定条件E)。
(測定条件E)
Normalized Collision Energy:35
Mass Difference:3.00
Expected ratio: 0.7
Match tolerance:0.15
工程2-3のMS/MS測定により得られたデータセットに129Daのニュートラルロスフィルターを適用することにより、図46~52に示す最終クロマトグラムを取得した(コントロール:図46、オメプラゾール:図47、クロザピン:図48、イミプラミン:図49、チエニル酸:図50、アセトアミノフェン:図51、ケルセチン:図52)。
対象化合物:オメプラゾール
図47は、対象化合物について得られた最終クロマトグラムを示している。数種の成分が正の応答を示しているが、コントロールのクロマトグラム(図46)と比較し、保持時間1.13分、1.23分、1.95分、2.21分、2.74分、2.88分および3.61分においてサンプル特有のピークが認められる。このうち、1.13分、1.23分、1.95分、2.21分および3.61分のピークは、偽陽性ピークであり、2.74分および2.88分のピークがトラッピング試薬-反応性代謝物付加体のピークである。保持時間2.74分に対応する付加体を付加体Yとする。保持時間2.88分に対応する付加体を付加体Zとする。図53に示されるように、付加体Yについて、質量電荷比(m/z)が621および624Daである特徴的な同位体二重線が確認された。図54に示されるように、付加体Zについて、質量電荷比(m/z)が651および654Daである特徴的な同位体二重線が確認された。
対象化合物:ケルセチン
図52は、対象化合物について得られた最終クロマトグラムを示している。数種の成分が正の応答を示しているが、コントロールのクロマトグラム(図46)と比較し、保持時間2.82分および3.16分においてサンプル特有のピークが認められる。保持時間2.82分に対応する付加体を付加体AF、保持時間3.16分に対応する付加体を付加体AGとする。図60に示されるように、付加体AFについて、質量電荷比(m/z)が608および611Daである特徴的な同位体二重線が確認された。図61に示されるように、付加体AGについて、質量電荷比(m/z)が608および611Daである特徴的な同位体二重線が確認された。

以上のことから、本実施形態の同位体標識化合物は、従来においてトラッピング試薬として使用されていた化合物と比べ偽陰性および偽陽性と判定されるケースが少なく、トラッピング試薬としての使用においてより優れていることが分かる。
Claims (11)
- 一般式(1)で表されるグルタチオンアルキルエステル同位体置換体。

式(1)中、R1は、含有される炭素原子、酸素原子および水素原子のうち少なくとも1つが同位体標識されている炭素数が1~8である直鎖もしくは分岐のアルコキシ基、または含有される炭素原子、酸素原子および水素原子のうち少なくとも1つが同位体標識されている炭素数が3~8であるシクロアルコキシ基を示す。 - 一般式(2)で表され、星印*の付与されている炭素原子、酸素原子、および水素原子のうち少なくとも1つが同位体標識されている請求項1に記載のグルタチオンアルキルエステル同位体置換体。

- 一般式(3)で表される請求項1に記載のグルタチオンアルキルエステル同位体置換体。

式(3)中、Dは重水素(2H)を表す。 - 請求項1から3のいずれか一項に記載のグルタチオンアルキルエステル同位体置換体を用いて、反応性代謝物を検出する方法。
- 請求項4に記載の方法において、
請求項1から3のいずれか一項に記載の前記グルタチオンアルキルエステル同位体置換体、当該グルタチオンアルキルエステル同位体置換体が有する原子のうち少なくとも1つが質量数が異なる原子に置き換えられている化合物である検出補助化合物、および医薬品候補化合物を含む反応試料を、薬物代謝酵素の存在下においてインキュベートすることにより、グルタチオンアルキルエステル同位体置換体-反応性代謝物付加体および検出補助化合物-反応性代謝物付加体を生じさせ、
液体クロマトグラフィー-質量分析装置(LC-MS)を用いた分析において、生じたグルタチオンアルキルエステル同位体置換体-反応性代謝物付加体および検出補助化合物-反応性代謝物付加体の質量ピークを検出することを含む、反応性代謝物を検出する方法。 - 請求項5に記載の方法において、
前記反応試料中における請求項1から3のいずれか一項に記載の前記グルタチオンアルキルエステル同位体置換体と前記検出補助化合物のモル比率が2:1から1:2である、請求項5に記載の反応性代謝物を検出する方法。 - 請求項5または6に記載の方法において、
インキュベートすることにより得られた生成物にジチオスレイトール、2-メルカプトエタノール、またはトリス(2-カルボキシエチル)フォスフィンを添加した後、前記液体クロマトグラフィー-質量分析装置(LC-MS)を用いた分析を行うことをさらに含む、反応性代謝物を検出する方法。 - 請求項5から7のいずれか1項に記載の方法において、
前記液体クロマトグラフィー-質量分析装置(LC-MS)を用いた分析においてニュートラルロススキャン法またはフルスキャン法を行う、反応性代謝物を検出する方法。 - 請求項5から8のいずれか1項に記載の方法において、
前記検出補助化合物が、前記反応試料中に含まれる請求項1から3のいずれか一項に記載の前記グルタチオンアルキルエステル同位体置換体の非標識化合物である、反応性代謝物を検出する方法。 - グルタチオンに、重水素化アルコールを反応させることにより、請求項1から3のいずれか一項に記載の前記グルタチオンアルキルエステル同位体置換体を製造する方法。
- 請求項10に記載の方法において、
前記重水素化アルコールがエタノール-d6である前記グルタチオンアルキルエステル置換体を製造する方法。
Priority Applications (2)
| Application Number | Priority Date | Filing Date | Title |
|---|---|---|---|
| JP2013516202A JP5878170B2 (ja) | 2011-05-20 | 2012-05-21 | グルタチオンアルキルエステル同位体置換体および反応性代謝物の検出方法 |
| US14/117,169 US9164075B2 (en) | 2011-05-20 | 2012-05-21 | Glutathione alkylester isotopologue and method for detecting reactive metabolite |
Applications Claiming Priority (2)
| Application Number | Priority Date | Filing Date | Title |
|---|---|---|---|
| JP2011113846 | 2011-05-20 | ||
| JP2011-113846 | 2011-05-20 |
Publications (1)
| Publication Number | Publication Date |
|---|---|
| WO2012160798A1 true WO2012160798A1 (ja) | 2012-11-29 |
Family
ID=47216891
Family Applications (1)
| Application Number | Title | Priority Date | Filing Date |
|---|---|---|---|
| PCT/JP2012/003302 Ceased WO2012160798A1 (ja) | 2011-05-20 | 2012-05-21 | グルタチオンアルキルエステル同位体置換体および反応性代謝物の検出方法 |
Country Status (3)
| Country | Link |
|---|---|
| US (1) | US9164075B2 (ja) |
| JP (1) | JP5878170B2 (ja) |
| WO (1) | WO2012160798A1 (ja) |
Citations (1)
| Publication number | Priority date | Publication date | Assignee | Title |
|---|---|---|---|---|
| WO2006012154A1 (en) * | 2004-06-28 | 2006-02-02 | Janssen Pharmaceutica, N.V. | A method for detecting reactive metabolites using stable-isotope trapping and mass spectroscopy |
Family Cites Families (1)
| Publication number | Priority date | Publication date | Assignee | Title |
|---|---|---|---|---|
| US6830897B2 (en) | 2000-04-26 | 2004-12-14 | Pfizer Inc. | High throughput screen for reducing drug candidate attrition |
-
2012
- 2012-05-21 JP JP2013516202A patent/JP5878170B2/ja not_active Expired - Fee Related
- 2012-05-21 WO PCT/JP2012/003302 patent/WO2012160798A1/ja not_active Ceased
- 2012-05-21 US US14/117,169 patent/US9164075B2/en not_active Expired - Fee Related
Patent Citations (1)
| Publication number | Priority date | Publication date | Assignee | Title |
|---|---|---|---|---|
| WO2006012154A1 (en) * | 2004-06-28 | 2006-02-02 | Janssen Pharmaceutica, N.V. | A method for detecting reactive metabolites using stable-isotope trapping and mass spectroscopy |
Non-Patent Citations (3)
| Title |
|---|
| MUTLIB A. ET AL.: "Application of stable isotope labeled glutathione and rapid scanning mass spectrometers in detecting and characterizing reactive metabolites.", RAPID COMMUNICATIONS IN MASS SPECTROMETRY, vol. 19, 2005, pages 3482 - 3492 * |
| YAN Z. ET AL.: "Stable-isotope trapping and high-throughput screenings of reactive metabolites using the isotope MS signature.", ANALYTICAL CHEMISTRY, vol. 76, no. 23, 2004, pages 6835 - 6847 * |
| YAN Z. ET AL.: "Use of a trapping agent for simultaneous capturing and high-throughput screening of both ''soft'' and ''hard'' reactive metabolites.", ANALYTICAL CHEMISTRY, vol. 79, no. 11, 2007, pages 4206 - 4214 * |
Also Published As
| Publication number | Publication date |
|---|---|
| US20140193847A1 (en) | 2014-07-10 |
| JP5878170B2 (ja) | 2016-03-09 |
| US9164075B2 (en) | 2015-10-20 |
| JPWO2012160798A1 (ja) | 2014-07-31 |
Similar Documents
| Publication | Publication Date | Title |
|---|---|---|
| Brown et al. | Analysis of unsaturated lipids by ozone-induced dissociation | |
| US12153051B2 (en) | Reagents for quantitative mass spectrometry | |
| Akbal et al. | Effects of liquid post-column addition in electrospray ionization performance in supercritical fluid chromatography–mass spectrometry | |
| JP2022517161A (ja) | マイクロバイオータ関連代謝物の検出および定量のための質量分析検定法 | |
| CA2889411A1 (en) | Neutron encoded mass tags for analyte quantification | |
| EP3545314A1 (en) | Reagents and methods for analysis of proteins and metabolites targeted by covalent probes | |
| Higashi et al. | Application of 4-(4-nitrophenyl)-1, 2, 4-triazoline-3, 5-dione to analysis of 25-hydroxyvitamin D3 in human plasma by liquid chromatography/electron capture atmospheric pressure chemical ionization-mass spectrometry | |
| WO2005114700A2 (en) | Expression quantification using mass spectrometry | |
| Chu et al. | In vitro metabolic activation of triphenyl phosphate leading to the formation of glutathione conjugates by rat liver microsomes | |
| Castro-Perez et al. | Recent advances in mass spectrometric and other analytical techniques for the identification of drug metabolites | |
| Meesters et al. | Application of liquid chromatography-tandem mass spectrometry (LC–MS/MS) for the analysis of stable isotope enrichments of phenylalanine and tyrosine | |
| JP5878170B2 (ja) | グルタチオンアルキルエステル同位体置換体および反応性代謝物の検出方法 | |
| WO2006012154A1 (en) | A method for detecting reactive metabolites using stable-isotope trapping and mass spectroscopy | |
| Wellemans et al. | Tandem mass spectrometry for the determination of deoxyribonucleic acid damage by polycyclic aromatic hydrocarbons. Plenary lecture | |
| Li et al. | Two‐injection workflow for a liquid chromatography/LTQ‐Orbitrap system to complete in vivo biotransformation characterization: demonstration with buspirone metabolite identification | |
| JP2024051310A (ja) | インドールカルボン酸化合物、インドールカルボン酸化合物の混合物、及び分析方法 | |
| US20110118124A1 (en) | Method for improving the properties of a drug lead compound | |
| Lecchi et al. | Expanding the MR1 ligandome using chemical class-specific fragmentation and molecular networking | |
| EP1916521A1 (en) | Method for analysis of compound-binding ability of protein | |
| Piqueras et al. | Analyses of Cholesterol and Derivatives in Ocular Tissues Using LC-MS/MS Methods | |
| Hankin et al. | Lipid mediators and mass spectrometry: an historical perspective | |
| WO2026082575A1 (en) | Synthesis of stable isotope labeled versions of n-(4-hydroxyphenyl)acetamid | |
| Nie | Chemical labeling strategies for mass spectrometry-based biomolecular identification, characterization and quantification | |
| Wachsmuth et al. | Equipment and metabolite identification (ID) strategies for mass-based metabolomic analysis | |
| Flarakos | Applications of mass spectrometry techniques to the elucidation of novel metabolic pathways of Vitamin D and the quantification of DNA adducts |
Legal Events
| Date | Code | Title | Description |
|---|---|---|---|
| 121 | Ep: the epo has been informed by wipo that ep was designated in this application |
Ref document number: 12788803 Country of ref document: EP Kind code of ref document: A1 |
|
| ENP | Entry into the national phase |
Ref document number: 2013516202 Country of ref document: JP Kind code of ref document: A |
|
| NENP | Non-entry into the national phase |
Ref country code: DE |
|
| WWE | Wipo information: entry into national phase |
Ref document number: 14117169 Country of ref document: US |
|
| 122 | Ep: pct application non-entry in european phase |
Ref document number: 12788803 Country of ref document: EP Kind code of ref document: A1 |