WO2012160630A1 - Trajectory correction method, trajectory correction apparatus, and moving body apparatus - Google Patents

Trajectory correction method, trajectory correction apparatus, and moving body apparatus Download PDF

Info

Publication number
WO2012160630A1
WO2012160630A1 PCT/JP2011/061685 JP2011061685W WO2012160630A1 WO 2012160630 A1 WO2012160630 A1 WO 2012160630A1 JP 2011061685 W JP2011061685 W JP 2011061685W WO 2012160630 A1 WO2012160630 A1 WO 2012160630A1
Authority
WO
WIPO (PCT)
Prior art keywords
node
trajectory
measurement
unit
probability
Prior art date
Application number
PCT/JP2011/061685
Other languages
French (fr)
Japanese (ja)
Inventor
祥尭 原
大島 章
山本 健次郎
細田 祐司
Original Assignee
株式会社日立製作所
Priority date (The priority date is an assumption and is not a legal conclusion. Google has not performed a legal analysis and makes no representation as to the accuracy of the date listed.)
Filing date
Publication date
Application filed by 株式会社日立製作所 filed Critical 株式会社日立製作所
Priority to PCT/JP2011/061685 priority Critical patent/WO2012160630A1/en
Priority to DE112011105210.3T priority patent/DE112011105210T5/en
Priority to US14/118,899 priority patent/US9182235B2/en
Priority to JP2013516092A priority patent/JP5852645B2/en
Publication of WO2012160630A1 publication Critical patent/WO2012160630A1/en

Links

Images

Classifications

    • GPHYSICS
    • G01MEASURING; TESTING
    • G01CMEASURING DISTANCES, LEVELS OR BEARINGS; SURVEYING; NAVIGATION; GYROSCOPIC INSTRUMENTS; PHOTOGRAMMETRY OR VIDEOGRAMMETRY
    • G01C21/00Navigation; Navigational instruments not provided for in groups G01C1/00 - G01C19/00
    • G01C21/005Navigation; Navigational instruments not provided for in groups G01C1/00 - G01C19/00 with correlation of navigation data from several sources, e.g. map or contour matching
    • GPHYSICS
    • G01MEASURING; TESTING
    • G01CMEASURING DISTANCES, LEVELS OR BEARINGS; SURVEYING; NAVIGATION; GYROSCOPIC INSTRUMENTS; PHOTOGRAMMETRY OR VIDEOGRAMMETRY
    • G01C21/00Navigation; Navigational instruments not provided for in groups G01C1/00 - G01C19/00
    • G01C21/26Navigation; Navigational instruments not provided for in groups G01C1/00 - G01C19/00 specially adapted for navigation in a road network
    • G01C21/28Navigation; Navigational instruments not provided for in groups G01C1/00 - G01C19/00 specially adapted for navigation in a road network with correlation of data from several navigational instruments
    • G01C21/30Map- or contour-matching

Abstract

The purpose of the present invention is to calculate a highly accurate trajectory. A management unit (20) for correcting a trajectory traveled by a moving body (V) is characterized in comprising: an assessment function generation unit (21) for setting a plurality of nodes to trajectory data of the moving body (V) acquired by a wheel rotation amount measurement unit (16) and calculating positional data relating to the moving body (V) acquired by the wheel rotation amount measurement unit (16), positional data relating to the moving body (V) acquired by another measuring means which is associated with a node and is separate from the wheel rotation amount measurement unit (16), and an assessment function for indicating by a probability a position which is associated with a node and at which it is possible for a node to occur and for indicating by a probability a position at which it is possible for position data associated with a node to occur, the assessment function comprising the nodes and position data as variables on the basis of each of the probabilities; and a trajectory optimization computation unit (22) for calculating the trajectory at which there is the greatest probability for each of the nodes to occur, on the basis of the assessment function.

Description

軌跡補正方法、軌跡補正装置および移動体装置Trajectory correction method, trajectory correction device, and moving body device
 本発明は、移動体の軌跡を補正する軌跡補正方法、軌跡補正装置および移動体装置の技術に関する。 The present invention relates to a trajectory correction method for correcting a trajectory of a moving body, a trajectory correction apparatus, and a technology of the mobile body apparatus.
 従来、移動体に搭載された測定装置(内界センサや外界センサ)によって測定されたデータに基づいて、実環境に対応した地図を生成しながら、自己位置を推定して目標経路に従って移動する自律移動システム(例えば、特許文献1,2を参照)が開示されている。 Conventionally, autonomously moving according to a target route by estimating its own position while generating a map corresponding to the actual environment based on data measured by a measurement device (internal sensor or external sensor) mounted on a moving object A mobile system (see, for example, Patent Documents 1 and 2) is disclosed.
 特許文献1には、カメラを外界センサとして用いて、特定の形状をランドマーク(目印)として認識し、地図を生成しながら自律移動を行う環境同定装置、環境同定方法、プログラム、記録媒体およびロボット装置が開示されている。
 特許文献2には、レーザスキャナを外界センサとして用いて、現在時刻に取得した周辺物体の形状データと、1つ前の時刻に現在とは異なる位置で取得した周辺物体の形状データとを逐次的にマッチング(重ね合わせ)することにより、周辺物体の形状データを測定した領域を拡大していくことで地図を生成する環境地図生成方法および移動ロボットが開示されている。
Patent Document 1 discloses an environment identification device, an environment identification method, a program, a recording medium, and a robot that use a camera as an external sensor, recognize a specific shape as a landmark, and perform autonomous movement while generating a map. An apparatus is disclosed.
In Patent Document 2, using a laser scanner as an external sensor, the shape data of a peripheral object acquired at the current time and the shape data of the peripheral object acquired at a position different from the current time at the previous time are sequentially recorded. An environment map generation method and a mobile robot are disclosed in which a map is generated by enlarging a region where shape data of peripheral objects is measured by matching (superimposing) to a target object.
特開2004-110802号公報JP 2004-110802 A 特開2008-276348号公報JP 2008-276348 A
 移動体が走行し、取得した軌跡において、測定誤差(ずれ)が発生する。そのため、従来技術のような逐次的な地図生成の手法は、作成する地図の領域が拡大するにつれて累積誤差が大きくなるという問題がある。特に、以前に訪れた地点を異なる道順で再度通過した際や、複数台の車両で地図を生成した際に、測定誤差によって同一の地点が地図上では異なる地点として記憶され、整合性が保てずに齟齬が発生する場合がある。その結果、地図の正確性が悪化し、移動体が自己位置や目標経路を見失い、移動の継続が困難になるなどの問題点がある。 Measured error (deviation) occurs in the acquired trajectory when the moving body travels. Therefore, the sequential map generation method as in the prior art has a problem that the cumulative error increases as the area of the map to be created increases. In particular, when passing a previously visited point again with a different route or when generating a map with multiple vehicles, the same point is stored as a different point on the map due to measurement error, and consistency can be maintained. May cause wrinkles. As a result, there is a problem that the accuracy of the map is deteriorated, the moving body loses its own position or the target route, and it is difficult to continue the movement.
 このような背景に鑑みて本発明がなされたのであり、本発明は、精度の高い軌跡を算出することを目的とする。 The present invention has been made in view of such a background, and an object of the present invention is to calculate a highly accurate trajectory.
 前記課題を解決するため、本発明は、移動体が走行した軌跡を補正する軌跡補正装置による軌跡補正方法であって、前記軌跡補正装置は、1の測定手段が取得した前記移動体の軌跡データに、複数のノードを設定し、前記1の測定手段が取得した前記移動体の位置データを、前記ノードに対応付けるとともに、前記1の測定手段とは別の他の測定手段が取得した前記移動体の位置データを、前記ノードに対応付け、前記ノードが生起する可能性がある位置を確率で示し、前記ノードに対応付けられた位置データが生起する可能性がある位置を確率で示し、各確率を基に、前記ノードおよび前記位置データを変数として含む評価関数を算出し、前記評価関数を基に、各ノードが生起する確率が最も大きい軌跡を算出することを特徴とする。 In order to solve the above-described problem, the present invention provides a trajectory correction method by a trajectory correction apparatus that corrects a trajectory traveled by a mobile object, the trajectory correction apparatus including trajectory data of the mobile object acquired by a single measurement unit. In addition, a plurality of nodes are set, and the position data of the moving body acquired by the first measuring unit is associated with the node, and the moving body acquired by another measuring unit different from the first measuring unit The position data is associated with the node, the position where the node is likely to occur is represented by probability, the position where the position data associated with the node is likely to occur is represented by probability, and each probability An evaluation function including the node and the position data as variables is calculated based on the above, and a trajectory having the highest probability of occurrence of each node is calculated based on the evaluation function.
 本発明によれば、精度の高い軌跡を算出することができる。 According to the present invention, a highly accurate trajectory can be calculated.
本実施形態に係る自律移動システムの構成例を示す図である。It is a figure which shows the structural example of the autonomous mobile system which concerns on this embodiment. 本実施形態に係る自律移動システムの処理手順を示すフローチャートである。It is a flowchart which shows the process sequence of the autonomous mobile system which concerns on this embodiment. 周辺物体形状測定部による物体形状測定の説明を行うための図である(その1)。It is a figure for demonstrating the object shape measurement by a surrounding object shape measurement part (the 1). 周辺物体形状測定部による物体形状測定の説明を行うための図である(その2)。It is a figure for demonstrating the object shape measurement by a surrounding object shape measurement part (the 2). 移動体の走行軌跡の例を示す図である。It is a figure which shows the example of the driving | running | working locus | trajectory of a moving body. ノードとアークで構成される軌跡の例を示す図である。It is a figure which shows the example of the locus | trajectory comprised by a node and an arc. 本実施形態に係る各用語の定義を説明するための図である。It is a figure for demonstrating the definition of each term concerning this embodiment. 軌跡確定を説明するための図である。It is a figure for demonstrating locus | trajectory determination. 修正された軌跡の例を示す図である。It is a figure which shows the example of the corrected locus | trajectory. 周辺物体形状マッチング部による対応関係と差分測定の誤差の確率分布を算出する処理の手順を示すフローチャートである。It is a flowchart which shows the procedure of the process which calculates the probability distribution of the correspondence and the difference measurement error by a surrounding object shape matching unit. 地理情報システムマッチング部による対応関係と差分測定の誤差の確率分布を算出する処理の手順を示すフローチャートである。It is a flowchart which shows the procedure of the process which calculates the probability distribution of the correlation and the difference measurement difference | error by a geographic information system matching part. GNSS測位部による対応関係と差分測定の誤差の確率分布を算出する処理の手順を示すフローチャートである。It is a flowchart which shows the procedure of the process which calculates the probability distribution of the correlation by the GNSS positioning part, and the difference measurement error. 車輪回転量測定部による対応関係と差分測定の誤差の確率分布を算出する処理の手順を示すフローチャートである。It is a flowchart which shows the procedure of the process which calculates the probability distribution of the correspondence by the wheel rotation amount measurement part, and the difference measurement error. 本実施形態に係る自律走行システムの別の実施形態を示す図である(その1)。It is a figure which shows another embodiment of the autonomous running system which concerns on this embodiment (the 1). 本実施形態に係る自律走行システムの別の実施形態を示す図である(その2)。It is a figure which shows another embodiment of the autonomous running system which concerns on this embodiment (the 2).
 次に、本発明を実施するための形態(「実施形態」という)について、適宜図面を参照しながら詳細に説明する。 Next, modes for carrying out the present invention (referred to as “embodiments”) will be described in detail with reference to the drawings as appropriate.
[システム構成]
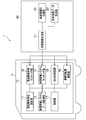
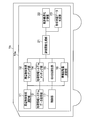
 図1は、本実施形態に係る自律移動システムの構成例を示す図である。
 自律移動システム1は、地図作成に必要な各データを収集する車載部10と、収集された各データを基に、軌跡補正を行う管理部20とを有する。
 車載部10は、例えば、自律移動ロボットや乗物などの移動体装置である移動体Vに搭載されている。また、管理部20は、例えば、オフィスビルなどの管理設備に設置されている。
 車載部10と、管理部20とは、無線ネットワークなどを介して通信可能である。
[System configuration]
FIG. 1 is a diagram illustrating a configuration example of an autonomous mobile system according to the present embodiment.
The autonomous mobile system 1 includes an in-vehicle unit 10 that collects data necessary for map creation, and a management unit 20 that performs trajectory correction based on the collected data.
The in-vehicle unit 10 is mounted on a moving body V that is a moving body device such as an autonomous mobile robot or a vehicle. The management unit 20 is installed in a management facility such as an office building.
The in-vehicle unit 10 and the management unit 20 can communicate via a wireless network or the like.
(車載部)
 車載部10は、周辺物体形状測定部11、周辺物体形状マッチング部12、地理情報システムデータ取得部13、地理情報システムマッチング部14、GNSS(Global Navigation Satellite System)測位部15、車輪回転量測定部16、制御部17などを有している。なお、周辺物体形状マッチング部12、地理情報システムマッチング部14、GNSS測位部15、車輪回転量測定部16をまとめて、測定手段と称することがある。
(In-vehicle unit)
The in-vehicle unit 10 includes a peripheral object shape measuring unit 11, a peripheral object shape matching unit 12, a geographic information system data acquiring unit 13, a geographic information system matching unit 14, a GNSS (Global Navigation Satellite System) positioning unit 15, and a wheel rotation amount measuring unit. 16, a control unit 17 and the like. The peripheral object shape matching unit 12, the geographic information system matching unit 14, the GNSS positioning unit 15, and the wheel rotation amount measuring unit 16 may be collectively referred to as measurement means.
 周辺物体形状測定部11は、移動体Vの周辺に存在する物体(建物や街路樹や電柱などの道路構造物、人や他の移動体Vなど)の形状を測定する。周辺物体形状測定部11として、例えば、レーザスキャナやステレオカメラやTOF(Time Of Flight)距離画像カメラなどを用いることができる。 The peripheral object shape measuring unit 11 measures the shape of an object (a building, a road tree, a road pole such as a power pole, a person, or another moving object V) existing around the moving object V. As the peripheral object shape measuring unit 11, for example, a laser scanner, a stereo camera, a TOF (Time Of Flight) distance image camera, or the like can be used.
 周辺物体形状マッチング部12は、現在位置において、移動体Vの周辺物体形状測定部11が測定した周辺物体の形状データ(構造物の形状データ)と、異なる位置で測定した周辺物体の形状データをマッチング(重ね合わせ)することにより、移動体Vの2地点間の相対的な位置について、前時刻からの差分を算出する。マッチングには、例えば、論文「距離データ処理 - 複数距離画像からの形状モデル生成技術」(著者:増田 健, 岡谷(清水)郁子, 佐川 立昌、学会会議:Proc. of the 146th CVIM、開催年:2004年)に記載の方法などを用いることができる。 The peripheral object shape matching unit 12 receives, at the current position, the peripheral object shape data (structure shape data) measured by the peripheral object shape measurement unit 11 of the moving object V and the peripheral object shape data measured at different positions. By matching (superimposing), the difference from the previous time is calculated for the relative position between the two points of the moving object V. For matching, for example, the paper “Distance Data Processing-Shape Model Generation Technology from Multiple Distance Images” (authors: Ken Masuda, Kyoko Okaya, Riksho Sagawa, Conference Meeting: Proc. Of the 146th CVIM, year held : 2004) can be used.
 地理情報システムデータ取得部13は、都市内の道路形状や、建物や、街路樹や、電柱などの道路構造物の地図形状データを、地図データなどを有する地理情報システムから取得する部分である。地図形状データのデータ形式として、近年のカーナビゲーションシステムにおいて利用されている都市3次元モデルや、OGC(Open Geospatial Consortium)により世界標準化されているCityGML(Geography Markup Language)などを用いることができる。 The geographic information system data acquisition unit 13 is a part that acquires map shape data of road structures in the city, road structures such as buildings, roadside trees, and utility poles from a geographic information system having map data. As a data format of the map shape data, a city three-dimensional model used in a recent car navigation system, City GML (Geography Markup Language) standardized by OGC (Open Geospatial Consortium), or the like can be used.
 地理情報システムマッチング部14は、現在位置において、移動体Vの周辺物体形状測定部11が測定した周辺物体の形状データと、地理情報システムデータ取得部13が取得した現在位置付近の周辺物体の地図形状データとをマッチング(重ね合わせ)することにより、地理情報システムが有している地図に対する移動体Vの現在位置の相対的な位置について、前時刻からの差分を算出する。マッチングには、周辺物体形状マッチング部12と同様の方法を用いることができる。 The geographic information system matching unit 14 maps the shape data of the surrounding object measured by the surrounding object shape measuring unit 11 of the moving object V at the current position and the surrounding object map near the current position acquired by the geographic information system data acquiring unit 13. By matching (superimposing) the shape data, the difference from the previous time is calculated for the relative position of the current position of the moving object V to the map of the geographic information system. For the matching, the same method as that of the peripheral object shape matching unit 12 can be used.
 GNSS測位部15は、GPS(Global Posioning System)などの測位システムを用いて、例えば、平面直角座標系などの基準座標系に対する移動体Vの現在位置を算出する。 The GNSS positioning unit 15 uses a positioning system such as GPS (Global Positioning System) to calculate the current position of the moving object V with respect to a reference coordinate system such as a planar rectangular coordinate system.
 車輪回転量測定部16は、車輪回転量を累積することで、前時刻における移動体Vの位置に対する現在位置の相対的な差分を算出する。算出には、IMU(Inertial Measurement Unit)と呼ばれる慣性センサやジャイロセンサを用いて、論文「Gyrodometry : A New Method for Combining Data from Gyros and Odometry in Mobile Robots」(著者:Johann Borenstein, and Liqiang Feng、学会会議:Proc. of ICRA’96、開催年:1996年)に記載の方法などを用いることができる。 The wheel rotation amount measuring unit 16 calculates the relative difference of the current position with respect to the position of the moving object V at the previous time by accumulating the wheel rotation amount. For calculation, an inertial sensor or gyro sensor called IMU (Inertial Measurement Unit) is used. The method described in the conference: Proc. OfRA ICRA '96, held year: 1996) can be used.
 なお、車載部10は、各部11~16のすべてを有していなくてもよく、これらのうち、最低2つを有していればよい。 Note that the in-vehicle unit 10 does not have to include all of the units 11 to 16 and only needs to have at least two of these units.
 制御部17は、各部11~16を統括制御する。 The control unit 17 performs overall control of the units 11 to 16.
 各部11~17は、ROM(Read Only Memory)などに格納されたプログラムが、CPU(Central Processing Unit)によって実行されることによって具現化する。 Each unit 11 to 17 is realized by a program stored in a ROM (Read Only Memory) or the like being executed by a CPU (Central Processing Unit).
(管理部)
 管理部20は、評価関数生成部21、軌跡最適化計算部22、形状地図データ生成部23を有している。
(Management Department)
The management unit 20 includes an evaluation function generation unit 21, a trajectory optimization calculation unit 22, and a shape map data generation unit 23.
 評価関数生成部21は、各測定手段11~16によって算出された移動体Vの前時刻に対する相対的な位置の差分(詳細は後記)を用いて、走行環境中を走行した際の移動体Vの軌跡に対して、それぞれの測定された相対的な位置の差分を変数とし、確率関数で表現した評価関数を生成する部分である。この評価関数を最適化したときの変数(つまり、相対的な位置の差)を求めることで、軌跡の誤差を訂正する。詳細は後記する。 The evaluation function generation unit 21 uses the difference in relative position (details will be described later) of the moving body V with respect to the previous time calculated by each of the measuring units 11 to 16 to move the moving body V when traveling in the traveling environment. This is a part for generating an evaluation function expressed by a probability function using a difference of each measured relative position as a variable. The trajectory error is corrected by obtaining a variable (that is, a relative position difference) when the evaluation function is optimized. Details will be described later.
 軌跡最適化計算部22は、評価関数生成部21が生成した評価関数を、相対的な位置の差を変数として最適化する。これにより、軌跡最適化計算部22は、累積誤差が発生している移動体Vの軌跡を、全体にわたって累積誤差がなく整合性を保った移動体Vの軌跡に修正する。詳細に関しては後記する。 The trajectory optimization calculation unit 22 optimizes the evaluation function generated by the evaluation function generation unit 21 using a relative position difference as a variable. As a result, the trajectory optimization calculation unit 22 corrects the trajectory of the moving object V in which the accumulated error has occurred to the trajectory of the moving object V that has no accumulated error and maintains consistency throughout. Details will be described later.
 形状地図データ生成部23は、軌跡最適化計算部22によって修正された移動体Vの軌跡に対して周辺物体形状測定部11が測定した周辺物体の形状データを貼付することで、累積誤差のない地図を生成する。 The shape map data generation unit 23 affixes the shape data of the peripheral object measured by the peripheral object shape measurement unit 11 to the trajectory of the moving object V corrected by the trajectory optimization calculation unit 22 so that there is no accumulated error. Generate a map.
 管理部20は、PC(Personal Computer)などで実現され、各部21~23はROMや、HDD(Hard Disk Drive)に格納されたプログラムが、RAM(Random Access Memory)に展開され、CPUによって実行されることによって具現化する。 The management unit 20 is realized by a PC (Personal Computer) or the like, and each of the units 21 to 23 is a program stored in a ROM or HDD (Hard Disk Drive) is expanded in a RAM (Random Access Memory) and executed by the CPU. By embodying it.
[フローチャート]
 次に、図1を参照しつつ、図2から図9に沿って本実施形態に係る自律移動システム1の具体的な処理内容について説明する。
 図2は、本実施形態に係る自律移動システムの処理手順を示すフローチャートである。
 自律移動システム1が図2に示すフローチャートの処理を実行することで正確な軌跡を算出し、さらにこの軌跡を基に地図を生成することで、移動体Vが自己位置や目標経路を見失うことなく目的地に到達することができる。
[flowchart]
Next, specific processing contents of the autonomous mobile system 1 according to the present embodiment will be described along FIGS. 2 to 9 with reference to FIG.
FIG. 2 is a flowchart showing a processing procedure of the autonomous mobile system according to the present embodiment.
The autonomous mobile system 1 calculates the exact trajectory by executing the processing of the flowchart shown in FIG. 2, and further generates a map based on this trajectory, so that the moving body V does not lose sight of its own position or target route. You can reach your destination.
 まず、移動体Vが対象となる走行環境を走行しつつ、周辺物体形状測定部11が移動体Vの周辺に存在する物体(建物や街路樹や電柱などの道路構造物、人や他の移動体Vなど)の形状(物体形状)を測定する(S101)。なお、ここでの走行とは、移動体Vによる自律走行でもよいし、操縦者によって操縦されてもよい。 First, while the mobile object V is traveling in the target travel environment, the surrounding object shape measuring unit 11 is an object (a road structure such as a building, a roadside tree, or a power pole, a person or another mobile object) that exists around the mobile object V. The shape (object shape) of the body V etc. is measured (S101). The traveling here may be autonomous traveling by the moving body V or may be steered by a pilot.
 図3および図4を参照して、周辺物体形状測定部による物体形状測定の説明を行う。
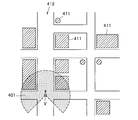
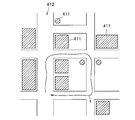
 図3における走行可能領域(道路)412を走行している移動体Vを中心とし、周辺物体形状測定部11が、自身の測定範囲401に入る道路構造物411などの物体形状を測定する。
 これは、例えば、周辺物体形状測定部11がレーザを周囲に放射し、その反射によって周囲の物体の形状を測定する。
 この際、人や他の移動体Vなどの移動体Vを地図に記憶してしまうことを避けるため、周辺物体形状測定部11は、図4に示すように所定の高さの領域501の周辺物体の形状データを抽出してもよい。あるいは、周辺物体形状測定部11は平面や円柱などの、特徴的な周辺物体の形状データを抽出するようにしてもよい。
With reference to FIGS. 3 and 4, the object shape measurement by the peripheral object shape measurement unit will be described.
The surrounding object shape measuring unit 11 measures the shape of an object such as a road structure 411 that falls within its own measurement range 401 with the moving body V traveling in the travelable region (road) 412 in FIG.
For example, the peripheral object shape measuring unit 11 emits a laser to the surroundings, and measures the shape of the surrounding objects by reflection thereof.
At this time, in order to avoid storing the moving body V such as a person or another moving body V in the map, the peripheral object shape measuring unit 11 is configured so that the periphery of the region 501 having a predetermined height as shown in FIG. Object shape data may be extracted. Alternatively, the peripheral object shape measurement unit 11 may extract characteristic peripheral object shape data such as a plane or a cylinder.
 そして、各測定手段12,14~16が、測定のデータを取得する(S102)。このとき、各測定手段12,14~16は管理部20へ測定のデータを送信する。
 次に、制御部17が、測定のデータが所定量蓄積されたか否かを判定する(S103)。
 ステップS103の結果、測定のデータが所定量蓄積されていない場合(S103→No)、制御部17はステップS101へ処理を戻す。
 ステップS103の結果、測定のデータが所定量蓄積されている場合(S103→Yes)、送信されたデータを基に作製される移動体Vが走行した軌跡に対して、評価関数生成部21がノードとアークを生成する(S104)ことによって、グラフ構造を生成する。
Then, each of the measuring means 12, 14 to 16 acquires measurement data (S102). At this time, each measurement means 12, 14 to 16 transmits measurement data to the management unit 20.
Next, the control unit 17 determines whether or not a predetermined amount of measurement data has been accumulated (S103).
As a result of step S103, when a predetermined amount of measurement data is not accumulated (S103 → No), the control unit 17 returns the process to step S101.
When a predetermined amount of measurement data is accumulated as a result of step S103 (S103 → Yes), the evaluation function generation unit 21 sets a node for the trajectory traveled by the moving object V created based on the transmitted data. A graph structure is generated by generating an arc (S104).
 ここで、図5および図6を参照して、評価関数生成部21によるノードとアークの生成を説明する。図5において、図3と同様の要素については、同一の符号を付して説明を省略する。
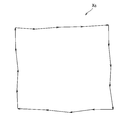
 走行軌跡tは移動体Vが実際に走行した際の走行軌跡の例を示す図である。
 図5に示すように、移動体Vが実際の走行軌跡tに沿って走行しているものとする。走行軌跡tは、車輪回転量測定部16による車輪の回転数から測定される距離を基に算出されるものである。なお、走行軌跡tは実際には閉じている。
Here, the generation of nodes and arcs by the evaluation function generation unit 21 will be described with reference to FIGS. 5 and 6. In FIG. 5, the same elements as those in FIG.
A travel locus t is a diagram illustrating an example of a travel locus when the moving body V actually travels.
As shown in FIG. 5, it is assumed that the moving object V is traveling along an actual travel locus t. The travel locus t is calculated based on the distance measured from the number of wheel rotations by the wheel rotation amount measuring unit 16. The travel locus t is actually closed.
 図6は、ノードとアークの関係を説明するための図である。
 図6に示すように、評価関数生成部21は、走行軌跡t(図5)を所定の長さ毎に区切り、区切った地点をノードpとし、ノードp間を直線のアークgで繋ぐことで、グラフ構造を生成し、軌跡Xを生成する。
 この際、評価関数生成部21は、車輪回転量測定部16が車輪回転量を累積することで算出した移動体Vの位置を初期位置として、ノードpとアークgを生成する。
 車輪回転量測定部16の測定には累積誤差が発生するため、図6に示す評価関数生成部21が生成したグラフ構造(軌跡X)には、図5に示す実際の環境での走行軌跡tとは測定誤差(ずれ)が発生してしまっている。自律移動システム1は、この測定誤差(ずれ)を修正して正確な地図を生成するために、図2に示す以降のフローチャートの処理手順(S105~S109)を実行する。
FIG. 6 is a diagram for explaining the relationship between nodes and arcs.
As shown in FIG. 6, the evaluation function generation unit 21 divides the travel locus t (FIG. 5) for each predetermined length, sets the divided point as a node p, and connects the nodes p with a straight arc g. Then, a graph structure is generated and a trajectory X is generated.
At this time, the evaluation function generation unit 21 generates the node p and the arc g with the position of the moving body V calculated by the wheel rotation amount measurement unit 16 accumulating the wheel rotation amount as an initial position.
Since a cumulative error occurs in the measurement of the wheel rotation amount measurement unit 16, the graph structure (trajectory X) generated by the evaluation function generation unit 21 shown in FIG. 6 shows the travel locus t in the actual environment shown in FIG. Measurement error (deviation) has occurred. In order to correct this measurement error (deviation) and generate an accurate map, the autonomous mobile system 1 executes the processing procedure (S105 to S109) of the subsequent flowchart shown in FIG.
 i番目のノードpをノードpと表現し、その位置をベクトルxで表現することとする。例えば2次元の地図を生成する場合、ノードpの位置であるベクトルxは式(1)のように表現される。 The i-th node p is expressed as a node p i and its position is expressed as a vector x i . For example, when generating a two-dimensional map, the vector x i that is the position of the node p i is expressed as in Expression (1).
=(u,v,θ) ・・・ (1) x i = (u i , v i , θ i ) (1)
 ここで、u,vは、例えば、世界座標であり、θは移動体Vの姿勢(向き)である。
 このとき、ノードpとアークgで表される軌跡Xは、式(2)に示すようにn個のノードpの位置を表すベクトルxの集合として表現される。
Here, u i and v i are, for example, world coordinates, and θ i is the posture (orientation) of the moving object V.
At this time, the trajectory X represented by the node p and the arc g is expressed as a set of vectors x i representing the positions of the n nodes p i as shown in Expression (2).
X=(x,・・・,x ・・・ (2) X = (x 1 ,..., X n ) T (2)
 ここで、nはノード数である。 Where n is the number of nodes.
 次に、評価関数生成部21によって、ステップS104で生成されたノードpとアークgから成るグラフ構造に対して、周辺物体形状マッチング部12、地理情報システムマッチング部14、GNSS測位部15、車輪回転量測定部16のそれぞれが、測定zと、ノードpとの対応関係を算出し、取得した測定zと、ノードp間の差分測定の誤差の確率分布を算出する(S105)。 Next, the peripheral function shape matching unit 12, the geographic information system matching unit 14, the GNSS positioning unit 15, the wheel rotation are applied to the graph structure composed of the node p and the arc g generated by the evaluation function generation unit 21 in step S 104. Each of the quantity measuring units 16 calculates the correspondence between the measurement z and the node p, and calculates the probability distribution of the difference measurement error between the acquired measurement z and the node p (S105).
 以下、図7を参照して、各測定手段による測定zと、ノードpとの対応関係の算出、および、その確率的表現について説明する。
 図7は、本実施形態に係る各用語の定義を説明するための図である。
 まず、図7(a)に示すように、車輪回転量測定部16が測定した位置として、ノードpとノードpを用いた例を示す。
 ノードpと、ノードpとを結ぶ線をアークg12と表現する。ノードpは、測定誤差を含んでいるので、その測定誤差は正規分布に従うと仮定すると、真のノードpは楕円yの範囲内に存在すると考えられる。ここで、ノードpの測定誤差の分布(楕円分布y)を正規分布の精度行列Ωによって表現される。ここで、楕円yは、精度行列Ωが表す共分散楕円である。精度行列Ωは情報行列とも呼ばれ、正規分布の共分散行列の逆行列に相当する。具体的には、図7(a)における楕円y1は、正規分布において、ノードpを中心とし、その中心から標準偏差σの範囲を示している。
 なお、小さな矢印qは、移動体Vの姿勢の向きを示すものであり、式(1)のθに相当する。
Hereinafter, with reference to FIG. 7, the calculation of the correspondence between the measurement z by each measurement means and the node p i and the probabilistic expression thereof will be described.
FIG. 7 is a diagram for explaining definitions of terms according to the present embodiment.
First, as shown in FIG. 7 (a), shown as the position of the wheel rotation quantity measuring unit 16 has measured, the example using the node p 1 and the node p 2.
The node p 1, representing a line connecting the node p 2 and the arc g 12. Since node p 2 contains a measurement error, assuming that the measurement error follows a normal distribution, true node p 2 is considered to be within the range of ellipse y 1 . Here, the measurement error distribution (elliptical distribution y 1 ) at the node p 2 is represented by a normal distribution accuracy matrix Ω. Here, the ellipse y 1 is a covariance ellipse represented by the accuracy matrix Ω. The accuracy matrix Ω is also called an information matrix and corresponds to an inverse matrix of a normal distribution covariance matrix. Specifically, elliptic y1 in FIG. 7 (a), the normal distribution centered on node p 2, indicates the range of the standard deviation σ from the center.
The small arrow q indicates the orientation of the moving body V and corresponds to θ i in the equation (1).
 次に、図7(b)を参照して、他の測定手段が測定した位置を車輪回転量測定部16が測定したノードに対応付ける方法を示す。
 図7(b)に示すように、車輪回転量測定部16以外の測定手段(例えば、GNSS測位部15)がある位置を測定したとする。この位置を測定z(m)(位置データ)と記載する。ここで、「m」とは、測定zを測定した測定手段(例えば、GNSS測位部15)を示す識別番号である。つまり、測定z(m)とは、測定手段mによって測定された測定zを意味する。
 そして、測定z(m)が、どのノードpに対応付けられるのかを評価関数生成部21が判定する。例えば、時刻などを基に、測定z(m)がノードpに対応すると評価関数生成部21によって判定されたとすると、この測定zを測定z(m)と表現することとする。
 ここで、ノードpと測定z(m)とを結ぶ線を相対的な位置の差分の測定(以下、差分測定と称する)をZ12(m)と表現することとする。差分測定Z12(m)の成分は、測定zと、ノードpとの差で表現される。
Next, with reference to FIG. 7B, a method of associating a position measured by another measuring unit with a node measured by the wheel rotation amount measuring unit 16 will be described.
As shown in FIG. 7B, it is assumed that a position where there is a measuring means (for example, the GNSS positioning unit 15) other than the wheel rotation amount measuring unit 16 is measured. This position is described as measurement z (m 1 ) (position data). Here, “m 1 ” is an identification number indicating the measurement means (for example, the GNSS positioning unit 15) that measured the measurement z. That is, the measurement z (m 1 ) means the measurement z measured by the measurement unit m 1 .
Then, the evaluation function generation unit 21 determines which node p is associated with the measurement z (m 1 ). For example, if the evaluation function generation unit 21 determines that the measurement z (m 1 ) corresponds to the node p 2 based on the time and the like, the measurement z is expressed as measurement z 2 (m 1 ).
Here, the node p 1 and the measurement z 2 (m 1) and the measurement of the relative position of the difference of the line connecting the (hereinafter, referred to as differential measurement) is and be expressed as Z 12 (m 1). The component of the difference measurement Z 12 (m 1 ) is represented by the difference between the measurement z 2 and the node p 1 .
 また、測定z(m)の共分散楕円がノードpと対応付けられている(言い換えれば、差分測定Z12(m)とアークg12が対応付けられている)ことを対応関係c1,2(m)と示すこととする。
 このように、車輪回転量測定部16によって測定されたノードpは、その他の測定手段によって測定された測定zとの対応関係の初期値、つまり基準値となる。
Further, the correspondence relationship is that the covariance ellipse of the measurement z 2 (m 1 ) is associated with the node p 2 (in other words, the difference measurement Z 12 (m 1 ) and the arc g 12 are associated). Let c 1, 2 (m 1 ).
Thus, the node p measured by the wheel rotation amount measuring unit 16 becomes an initial value of the correspondence relationship with the measurement z measured by other measuring means, that is, a reference value.
 測定z(m)も誤差を含んでいると考えられるので、測定z(m)は図7(a)と同様に精度行列Ωによる共分散楕円y2を有している。 Since the measurement z 2 (m 1 ) is also considered to contain an error, the measurement z 2 (m 1 ) has a covariance ellipse y2 with an accuracy matrix Ω as in FIG.
 なお、図7(c)に示すように、すべての測定z(m)が、すべてのノードpと対応付けられるわけではない。これは、各測定手段の測定間隔がまちまちであることに由来する。
 図7(c)のように、測定z(m)がノードpと対応付けられ、ノードp,pと対応付けられる測定z(m)が得られなかった場合、この測定z(m)は、測定z(m)となり、差分測定は、ノードpに対する差分測定はZ14(m)となる。
Incidentally, as shown in FIG. 7 (c), all measurements z i (m 1) is not associated with all the nodes p i. This is due to the fact that the measurement intervals of each measuring means are different.
As shown in FIG. 7 (c), the case where the measurement z 4 (m 1) is associated with node p 4, node p 2, p 3 and association is measured z (m 1) is not obtained, the measurement z (m 1 ) is the measurement z 4 (m 1 ), and the difference measurement is Z 14 (m 1 ) for the difference measurement for the node p 1 .
 なお、差分測定の差分元は、ユーザが任意に設定する。
 例えば、図7(d)に示すように、測定zと対応付けられているノードpの所定個前のノードpが差分元とされてもよい。図7(d)の例では、2つ前のノードpが差分元となっている。つまり、測定z(m)に対して生成される差分測定(Z13)の差分元は、測定z(m)と対応付けられているノードpの2つ前のノードpであるノードpとなっている。また、測定z(m)に対して生成される差分測定(Z24)の差分元は、測定z(m)と対応付けられているノードpの2つ前のノードpであるノードpとなっている。
The difference source for the difference measurement is arbitrarily set by the user.
For example, as shown in FIG. 7D, a predetermined number of nodes p before the node p associated with the measurement z may be set as the difference source. In the example of FIG. 7D, the previous node p is the difference source. That is, a difference source of differential measurement generated for measurement z 3 (m 1) (Z 13) is in two previous node p measurement z 3 (m 1) and are associated with the node p 3 and it has a certain node p 1. Further, a difference source of differential measurements are generated for measurement z 4 (m 1) (Z 24) is a measurement z 4 2 preceding node (m 1) and are associated with the node p 4 p and it has a certain node p 2.
 差分測定の差分元の決定方法は、図7(d)の方法に限らない。
 例えば、図7(e)に示すように、その前に測定zとが対応付けられたノードpが差分元とされてもよい。図7(e)に示されているように、測定z(m)とノードpとが対応付けられ、測定z(m)とノードpとが対応付けられ、測定z(m)とノードpとが対応付けられているとする。ここで、測定z(m)に対して生成される差分測定(Z13)の差分元は、その前に測定zと対応付けられているノードpとなる。同様に、測定z(m)に対して生成される差分測定(Z34)の差分元は、その前に測定zと対応付けられているノードpとなる。そして、測定z(m)は、他の差分測定の差分元となる。
The method of determining the difference source for the difference measurement is not limited to the method of FIG.
For example, as shown in FIG. 7 (e), a node p previously associated with the measurement z may be set as the difference source. As shown in FIG. 7E, the measurement z 1 (m 1 ) and the node p 1 are associated, the measurement z 3 (m 1 ) and the node p 3 are associated, and the measurement z 4 Assume that (m 1 ) and node p 4 are associated with each other. Here, the difference source of the difference measurement (Z 13 ) generated for the measurement z 3 (m 1 ) is the node p 1 associated with the measurement z before that. Similarly, the difference source of the difference measurement (Z 34 ) generated for the measurement z 4 (m 1 ) is the node p 3 associated with the measurement z before that. The measurement z 4 (m 1) is a difference source of other differential measurement.
 なお、車輪回転量測定部16も測定手段の1つであるので、ノードpも測定zとなる。例えば、図7(a)において、車輪回転量測定部16の識別番号をmとすると、ノードpは測定z(m)となる。つまり、測定z(m)と、ノードpとが対応付けられる(このとき、測定z(m)=ノードp)。この場合、測定z(m)と、ノードpとが対応付けられているので、対応関係c1,2(m)を定義することができる(図示せず)。 Since the wheel rotation amount measuring unit 16 is also one of the measuring means, the node p is also measured z. For example, in FIG. 7A, when the identification number of the wheel rotation amount measurement unit 16 is m 0 , the node p 1 becomes the measurement z 1 (m 0 ). That is, the measurement z 1 (m 0 ) and the node p 1 are associated (measurement z 2 (m 0 ) = node p 2 ). In this case, since the measurement z 1 (m 0 ) and the node p 1 are associated with each other, the correspondence relationship c 1,2 (m 0 ) can be defined (not shown).
 以上のように、各測定手段12,14~16は自身が測定した測定z(m)、差分測定Zij(m)、対応関係ci,j(m)を算出する。ここで、i,j,kは整数であり、i<jである。 As described above, each of the measuring means 12 and 14 to 16 calculates the measurement z j (m k ), the difference measurement Z ij (m k ), and the correspondence relationship c i, j (m k ) measured by itself. Here, i, j, and k are integers, and i <j.
 以下、差分測定の誤差の確率分布の生成について説明する。
 図7で説明した定義を基に、評価関数生成部21は軌跡Xを確定するための評価関数を算出し、この評価関数が最大となる各ノードpの各位置xを算出することにより、最も尤もらしい軌跡Xcを確定する。
 図8は、軌跡確定を説明するための図である。なお、図8における軌跡は、図6における軌跡Xと同じものである。
 図8では、ノードp,p,p,・・・が算出されており、それに対応する測定z(m),z(m),z(m),z(m),・・・が算出されている(図8では(m)は省略)。ここで、差分元のノードは、対応関係が定義されたノードから3つ前のノードとしている。
 なお、前記したようにノードp,p,p,・・・も、それぞれ測定z(m),z(m),z(m)とすることができるが、煩雑になるのを避けるため、ここでは図示省略してある(「m」は車輪回転量測定部16を示す識別番号)。
 ここで、対応関係ci,j(m)(図8において図示せず)が定義されている条件下におけるすべてのノードpの各位置x∈Xの確率を確率密度関数p(x|ci,j(m))で表すと、対応関係ci,j(m)は独立に生起すると見なされるため、位置xが生起する確率は、対応関係ci,j(m)が生起する条件におけるx(ノードpの位置)が生起する確率の混合分布で表現され、その式は式(3)で示される確率密度関数p(x)で示される。ここで、xは式(2)で定義されるxである。
Hereinafter, generation of a probability distribution of difference measurement errors will be described.
Based on the definition described with reference to FIG. 7, the evaluation function generation unit 21 calculates an evaluation function for determining the trajectory X, and calculates each position x of each node p where the evaluation function is maximized. A plausible trajectory Xc is determined.
FIG. 8 is a diagram for explaining locus determination. The trajectory in FIG. 8 is the same as the trajectory X in FIG.
In FIG. 8, nodes p 0 , p 1 , p 2 ,... Are calculated, and the corresponding measurements z 0 (m 1 ), z 1 (m 1 ), z 2 (m 1 ), z 5 are calculated. (M 1 ),... Are calculated ((m 1 ) is omitted in FIG. 8). Here, the difference source node is a node three nodes before the node for which the correspondence is defined.
As described above, the nodes p 0 , p 1 , p 2 ,... Can also be measured as z 0 (m 0 ), z 1 (m 0 ), and z 2 (m 0 ), respectively. In order to avoid complication, the illustration is omitted here (“m 0 ” is an identification number indicating the wheel rotation amount measuring unit 16).
Here, the probability of each position xεX of all the nodes p under the condition where the correspondence c i, j (m k ) (not shown in FIG. 8) is defined is expressed as a probability density function p (x | c i, j (m k )), since the correspondence c i, j (m k ) is considered to occur independently, the probability of the occurrence of the position x is the correspondence c i, j (m k ). X j (the position of the node p j ) in the condition that occurs is represented by a mixed distribution of the probability of occurrence, and the expression is represented by a probability density function p (x) represented by Expression (3). Here, x is x defined by Equation (2).
Figure JPOXMLDOC01-appb-M000001
 
Figure JPOXMLDOC01-appb-M000001
 
 ここで、<i,j>は、対応関係ci,j(m)が定義されるすべてのi,jの組み合わせの意味であり、Cは生じ得る対応関係ci,j(m)の集合であり、Mは、使用されているすべての測定手段の集合である。
 式(3)が意味するところは、対応関係ci,j(m)が生じたときに軌跡Xが生起する確率である。
 例えば、図8における測定手段の識別番号mに関する測定z(m)を例にすると、ノードとの間で対応関係がとれているのは、{z(m),z(m),z(m),z(m),z(m),z(m),z10(m),z13(m),z14(m)}であるので、式(3)にて乗算される確率密度関数は、{p(x|c16,0(m)),p(x|c14,1(m)),p(x|c15,2(m)),p(x|c2,5(m)),p(x|c3,6(m)),p(x|c6,9(m)),p(x|c7,10(m)),p(x|c10,13(m)),p(x|c11,14(m))}となる。なお、図8ではmに関する記載を省略している。
Here, <i, j> means the combination of all i, j for which the correspondence c i, j (m k ) is defined, and C is a possible correspondence c i, j (m k ). Where M is the set of all measurement means used.
What is meant by equation (3) is the probability that the locus X will occur when the correspondence c i, j (m k ) occurs.
For example, taking the measurement z j (m 1 ) related to the identification number m 1 of the measuring means in FIG. 8 as an example, the correspondence between the nodes is {z 0 (m 1 ), z 1 ( m 1 ), z 2 (m 1 ), z 5 (m 1 ), z 6 (m 1 ), z 9 (m 1 ), z 10 (m 1 ), z 13 (m 1 ), z 14 (m 1 )}, the probability density function multiplied by equation (3) is {p (x | c 16,0 (m 1 )), p (x | c 14,1 (m 1 )), p (x | c 15,2 (m 1 )), p (x | c 2,5 (m 1 )), p (x | c 3,6 (m 1 )), p (x | c 6,9 (M 1 )), p (x | c 7,10 (m 1 )), p (x | c 10,13 (m 1 )), p (x | c 11,14 (m 1 ))} . In FIG. 8, the description regarding m 1 is omitted.
 つまり、対応関係ci,j(m)を条件とした差分測定Zijは独立に生起するため、各位置xが同時に生起する確率の確率密度関数は、式(3)に示すようにp(x|ci,j(m))をすべての測定手段による測定に関して乗算することで示される。 That is, since the difference measurement Z ij under the condition of the correspondence relationship c i, j (m k ) occurs independently, the probability density function of the probability that each position x occurs simultaneously is p as shown in the equation (3). (X j | c i, j (m k )) is multiplied by the measurement by all measuring means.
 なお、前記したように車輪回転量測定部16によるノードpも測定z(m)となるため、式(3)ではp(x|ci,j(m))も乗算される。 As described above, since the node p j by the wheel rotation amount measurement unit 16 is also measured z j (m 0 ), p (x j | c i, j (m 0 )) is also multiplied in Expression (3). The
 評価関数生成部21は、式(3)で示される確率密度関数p(x)を最大化することで、全体にわたって累積誤差がなく整合性を保った移動体Vの軌跡Xcを求める。ここで、軌跡Xは補正前の軌跡を示し、軌跡Xcは補正後の軌跡を示している。つまり、式(3)で示される確率密度関数p(x)が最も大きいということは、各位置xが最も高い確率で生起することである。評価関数生成部21は、このような各位置xを求め、求められた各位置xをノードとして結ぶことで全体にわたって累積誤差がなく整合性を保った移動体Vの軌跡Xcを求める。 The evaluation function generation unit 21 maximizes the probability density function p (x) expressed by Equation (3) to obtain the trajectory Xc of the moving object V that has no accumulated error and maintains consistency throughout. Here, the trajectory X indicates a trajectory before correction, and the trajectory Xc indicates a trajectory after correction. That is, Equation (3) probability density function p (x) represented by the fact that the greatest is that each position x j is occurring at the highest probability. The evaluation function generation unit 21 obtains each position x as described above, and obtains a trajectory Xc of the moving object V that has no accumulated error and maintains consistency throughout by connecting the obtained positions x as nodes.
 以下、最尤推定法による軌跡Xcの算出方法を説明する。
 図7(b)で説明したように、軌跡Xにおける各ノードpの位置xが存在する確率的位置を、精度行列Ωの正規分布で表現すると、式(3)における確率密度関数p(x|ci,j(m))は、以下の式(4)で示される。
Hereinafter, a method of calculating the trajectory Xc by the maximum likelihood estimation method will be described.
As described with reference to FIG. 7B, when the probabilistic position where the position x of each node p exists in the trajectory X is expressed by a normal distribution of the accuracy matrix Ω, the probability density function p (x | c i, j (m k )) is expressed by the following equation (4).
Figure JPOXMLDOC01-appb-M000002
 
Figure JPOXMLDOC01-appb-M000002
 
 ここでN(・)は、正規分布を表す確率密度関数である。具体的には、後記する各参考文献に記載の方法で、式(4)が生成される。この式(4)が、差分測定の誤差の確率分布となる。 Here, N (•) is a probability density function representing a normal distribution. Specifically, the formula (4) is generated by the method described in each reference described later. This equation (4) is a probability distribution of difference measurement errors.
 次に、図2の説明へ戻り、周辺物体形状マッチング部12、地理情報システムマッチング部14、GNSS測位部15、車輪回転量測定部16のそれぞれによって生成された測定zとノードpとの対応関係、および、差分測定の誤差の確率分布を基に、評価関数生成部21が評価関数を生成する(S106)。
 評価関数生成部21は、評価関数F(x)を以下のような手順で導出する。
 まず、式(3)に式(4)を代入して正規分布の公式に従って展開すると、以下の式(5)が導かれる。
Next, returning to the description of FIG. 2, the correspondence between the measurement z generated by each of the surrounding object shape matching unit 12, the geographic information system matching unit 14, the GNSS positioning unit 15, and the wheel rotation amount measuring unit 16 and the node p. Based on the probability distribution of the difference measurement error, the evaluation function generation unit 21 generates an evaluation function (S106).
The evaluation function generation unit 21 derives the evaluation function F (x) by the following procedure.
First, when Expression (4) is substituted into Expression (3) and expanded according to the normal distribution formula, the following Expression (5) is derived.
Figure JPOXMLDOC01-appb-M000003
 
Figure JPOXMLDOC01-appb-M000003
 
 ここでηijは正規化変数、dij(x)はi番目のノードpから見たj番目のノードpに対応する測定zの相対的な位置の差分(差分測定Zij)を求めるための関数である。この関数はxの関数となっている。また、Ωijは、対応関係ci,jを有する測定z(m)における精度行列である。Ωijは、後記する各参考文献に記載の技術などの手段で算出される。
 式(5)に関して両辺の自然対数を求めると、式(6)が導かれる。
Here, η ij is a normalization variable, and d ij (x) is a relative position difference (difference measurement Z ij ) of the measurement z j corresponding to the j-th node p j viewed from the i-th node p i. This is a function to obtain. This function is a function of x. Ω ij is an accuracy matrix in the measurement z j (m k ) having the correspondence c i, j . Ω ij is calculated by means such as a technique described in each reference described later.
If the natural logarithm of both sides is calculated | required regarding Formula (5), Formula (6) will be guide | induced.
Figure JPOXMLDOC01-appb-M000004
 
Figure JPOXMLDOC01-appb-M000004
 
 ここで「const.」は定数である。式(3)に示した確率密度関数p(x)を最大化することは、式(6)に示した確率密度関数p(x)の自然対数(尤度関数)を最大化することと等価である。このため、式(6)から定数とマイナスの係数を除去することで、式(7)のように評価関数F(x)を定式化できる。 Here, “const.” Is a constant. Maximizing the probability density function p (x) shown in Equation (3) is equivalent to maximizing the natural logarithm (likelihood function) of the probability density function p (x) shown in Equation (6). It is. For this reason, the evaluation function F (x) can be formulated as shown in Expression (7) by removing constants and negative coefficients from Expression (6).
Figure JPOXMLDOC01-appb-M000005
 
Figure JPOXMLDOC01-appb-M000005
 
 なお、式(7)において、eijは、以下の式(8)で示されるものである。 In equation (7), e ij is represented by the following equation (8).
ij=dij(x)-Zij(m) ・・・ (8) e ij = d ij (x) −Z ij (m k ) (8)
 ここで、式(3)に示した確率密度関数p(x)を最大化することは、式(7)に示す評価関数F(x)を最小化することと等価となる。よって、評価関数F(x)を最小化することが、評価関数F(x)を最適化することに相当する。
 すなわち、図2のステップS106において、評価関数生成部21は、周辺物体形状マッチング部12、地理情報システムマッチング部14、GNSS測位部15、車輪回転量測定部16によって取得された測定z(m)を基に、式(7)に示す評価関数F(x)を算出する。
Here, maximizing the probability density function p (x) shown in Expression (3) is equivalent to minimizing the evaluation function F (x) shown in Expression (7). Therefore, minimizing the evaluation function F (x) corresponds to optimizing the evaluation function F (x).
That is, in step S106 of FIG. 2, the evaluation function generation unit 21 measures the measurement z j (m acquired by the surrounding object shape matching unit 12, the geographic information system matching unit 14, the GNSS positioning unit 15, and the wheel rotation amount measuring unit 16. k )), an evaluation function F (x) shown in Expression (7) is calculated.
 次に、制御部17が移動体Vが対象とする走行環境中の走行を完了したか否か、すなわち、移動体Vの走行が終了したか否かを判定する(S107)ことで、周辺物体の形状データを収集し終えたか否かを判定する。
 ステップS107の結果、走行終了していない場合(S107→No)、制御部17は、ステップS101へ処理を戻す。
Next, the control unit 17 determines whether or not the traveling in the traveling environment targeted by the moving object V has been completed, that is, whether or not the traveling of the moving object V has been completed (S107), so that the peripheral object It is determined whether or not the shape data has been collected.
If the result of step S107 is that the travel has not ended (S107 → No), the control unit 17 returns the process to step S101.
 ステップS107の結果、走行終了している場合(S107→Yes)、軌跡最適化計算部22が、式(7)に示される評価関数F(x)を最適化することで、累積誤差が発生している移動体Vの軌跡Xを、全体にわたって累積誤差がなく整合性を保った移動体Vの軌跡Xcに修正する(S108)。 As a result of step S107, when the traveling is finished (S107 → Yes), the trajectory optimization calculating unit 22 optimizes the evaluation function F (x) shown in the equation (7), thereby generating a cumulative error. The trajectory X of the moving object V is corrected to the trajectory Xc of the moving object V that has no accumulated error and maintains consistency throughout (S108).
 前記したように、式(3)の確率密度関数p(x)を最大化することは、式(7)および式(8)に示す評価関数F(x)を最小化することと等価となる。すなわち、軌跡最適化計算部22が、以下の式(9)によって、評価関数F(x)を最小化するノードpの位置xを求めることで、評価関数F(x)を最適化を行う。これにより、軌跡最適化計算部22は、車輪回転量測定部16によって取得された軌跡X(図6)を、図9に示されるような全体にわたって累積誤差がなく整合性を保った移動体Vの軌跡Xcに修正する。なお、軌跡最適化計算部22は、連立方程式解法や、非線形最適化法によって評価関数F(x)を最小化する。 As described above, maximizing the probability density function p (x) in Expression (3) is equivalent to minimizing the evaluation function F (x) shown in Expression (7) and Expression (8). . That is, the trajectory optimization calculation unit 22 optimizes the evaluation function F (x) by obtaining the position x of the node p that minimizes the evaluation function F (x) by the following equation (9). Accordingly, the trajectory optimization calculation unit 22 uses the trajectory X (FIG. 6) acquired by the wheel rotation amount measurement unit 16 as a moving object V having no accumulated error and maintaining consistency as shown in FIG. 9. To the locus Xc. The trajectory optimization calculation unit 22 minimizes the evaluation function F (x) by a simultaneous equation solving method or a nonlinear optimization method.
Figure JPOXMLDOC01-appb-M000006
 
Figure JPOXMLDOC01-appb-M000006
 
 そして、形状地図データ生成部23は、修正された移動体Vの軌跡Xcに対して周辺物体形状測定部11が測定した周辺物体の形状データを貼付することで、地図生成を行う(S109)。これにより、逐次的なマッチングにより自己位置を推定しながら地図を生成するのではなく、地図を生成する対象とする走行環境中における周辺物体の形状データをすべて収集した後に、測定データの全体にわたって累積誤差がなく整合性を保った移動体Vの軌跡Xcを推定し、この軌跡Xcに対して測定した周辺物体の形状データを貼付することで正確な地図を生成することができる。 Then, the shape map data generation unit 23 generates a map by attaching the shape data of the peripheral object measured by the peripheral object shape measurement unit 11 to the corrected trajectory Xc of the moving body V (S109). As a result, instead of generating a map while estimating its own position by sequential matching, all the shape data of surrounding objects in the driving environment for which the map is to be generated are collected and accumulated over the entire measurement data An accurate map can be generated by estimating the trajectory Xc of the moving object V having no error and maintaining consistency, and pasting the measured shape data of the surrounding objects to the trajectory Xc.
 なお、本実施形態では、車輪回転量測定部16による測定のデータからノードpを生成したが、他の測定手段による測定のデータからノードpを生成してもよい。つまり、他の測定手段による測定のデータを基準値としてもよい。 In the present embodiment, the node p is generated from the data measured by the wheel rotation amount measuring unit 16, but the node p may be generated from the data measured by other measuring means. That is, data measured by other measuring means may be used as the reference value.
(各測位手段における対応関係および差分測定の誤差の確率分布の算出)
 次に、図10~図15を参照して、図2のステップS105における各測定手段の処理を説明する。
(Calculation of probability distribution of correspondence and difference measurement error in each positioning means)
Next, with reference to FIGS. 10 to 15, the processing of each measuring means in step S105 of FIG. 2 will be described.
(周辺物体形状マッチング部)
 図10は、周辺物体形状マッチング部によるステップS105の処理の手順を示すフローチャートである。
 周辺物体形状マッチング部12は、i番目のノードpとj番目のノードpに対して、i番目のノードpの地点で周辺物体形状測定部11が測定した周辺物体の形状データと、j番目のノードpの地点で測定した周辺物体の形状データをマッチング(重ね合わせ)することにより、周辺物体形状マッチング部12が取得した測定zと、ノードp,pとの対応関係を算出する。
(Peripheral object shape matching part)
FIG. 10 is a flowchart showing the procedure of the process of step S105 by the peripheral object shape matching unit.
The peripheral object shape matching unit 12 has the shape data of the peripheral object measured by the peripheral object shape measuring unit 11 at the point of the i-th node p i for the i-th node p i and the j-th node p j , By matching (superimposing) the shape data of the surrounding object measured at the point of the j-th node p j , the correspondence between the measurement z acquired by the surrounding object shape matching unit 12 and the nodes p i and p j is expressed as follows. calculate.
 周辺物体形状測定部11は、現在対象としているi番目のノードpから所定の閾値以内の距離にあるノードpを探索し(S201)、対応するj番目のノードpを決定する。 The peripheral object shape measuring unit 11 searches for a node p that is within a predetermined threshold distance from the i-th node p i that is currently targeted (S201), and determines a corresponding j-th node p j .
 次に、周辺物体形状測定部11は、i番目のノードpの地点で周辺物体形状測定部11自身が測定した周辺物体の形状データと、j番目のノードpの地点で測定した周辺物体の形状データをマッチングする(S202)。このマッチングの結果が測定zとなる。マッチングには、例えば、「距離データ処理 - 複数距離画像からの形状モデル生成技術」(著者:増田 健, 岡谷(清水)郁子, 佐川 立昌、学会会議:Proc. of the 146th CVIM,開催年:2004年)に記載の方法などを用いることができる。 Next, the peripheral object shape measuring unit 11 measures the peripheral object shape data measured by the peripheral object shape measuring unit 11 itself at the point of the i-th node p i and the peripheral object measured at the point of the j-th node p j. Are matched with each other (S202). The result of this matching is measurement z. For matching, for example, "Distance data processing-Shape model generation technology from multiple distance images" (author: Takeshi Masuda, Kyoko Okaya (Shimizu), Ritsumasa Sagawa, conference: Proc. Of the 146th CVIM, 2004) can be used.
 次に、周辺物体形状測定部11は、ステップS202でのマッチング結果を用いて、測定zにおける差分測定の誤差の確率分布(確率密度関数:式(4))を算出する(S203)。測定zにおける差分測定の誤差の確率分布は、例えば、論文「スキャンマッチングにおけるロボット姿勢の尤度分布計算」(著者:友納 正裕、学会会議:Proc. of RSJ’10、開催年:2010年)に記載の方法などを用いることができる。 Next, the peripheral object shape measurement unit 11 calculates a probability distribution (probability density function: equation (4)) of the difference measurement error in the measurement z j by using the matching result in step S202 (S203). The probability distribution of the difference measurement error in the measurement z j is, for example, the paper “Calculation of likelihood distribution of robot posture in scan matching” (author: Masahiro Tomono, conference: Proc. Of RSJ'10, held year: 2010) Can be used.
 そして、周辺物体形状測定部11は、地図生成の対象である走行環境中のすべてのノードついて、ステップS201~S203の処理が完了したか否かを判定する(S204)。
 ステップS204の結果、完了していない場合(S204→No)、周辺物体形状測定部11はステップS201へ処理を戻す。
 ステップS204の結果、完了している場合(S204→Yes)、周辺物体形状測定部11は処理を終了する。
Then, the peripheral object shape measuring unit 11 determines whether or not the processing of steps S201 to S203 has been completed for all nodes in the travel environment that are targets of map generation (S204).
If the result of step S204 is not complete (S204 → No), the peripheral object shape measuring unit 11 returns the process to step S201.
If the result of step S204 is complete (S204 → Yes), the peripheral object shape measuring unit 11 ends the process.
(地理情報システムマッチング部)
 図11は、地理情報システムマッチング部によるステップS105の処理の手順を示すフローチャートである。
 地理情報システムマッチング部14は、地理情報システムデータ取得部13が取得した地図形状データを基準として、対象とするノードpで周辺物体形状測定部11が測定した周辺物体の形状データをマッチング(重ね合わせ)することにより、地理情報システムが有する地図データに対するノードとの対応関係および差分測定の誤差の確率分布(確率密度関数:式(4))を算出する。
(Geographic Information System Matching Department)
FIG. 11 is a flowchart showing the procedure of the process of step S105 by the geographic information system matching unit.
The geographic information system matching unit 14 matches (superimposes) the shape data of the surrounding objects measured by the surrounding object shape measuring unit 11 at the target node p with reference to the map shape data obtained by the geographic information system data obtaining unit 13. ) To calculate the correspondence relationship between the map data of the geographic information system and the probability distribution of the difference measurement error (probability density function: equation (4)).
 まず、地理情報システムマッチング部14は、地理情報システムデータ取得部13を介して現在対象としているノードpから所定の閾値以内の距離にある地理情報システムのデータを探索する(S301)。
 そして、地理情報システムマッチング部14は、探索したデータを地理情報システムデータ取得部13が取得した地図形状データを基準として、対象とするノードpで周辺物体形状測定部11が測定した周辺物体の形状データをマッチングする(S302)。このマッチングの結果が測定zとなる。マッチングには、図10のステップS202の処理と同様の方法を用いることができる。
First, geographical information system matching unit 14 searches for data of the geographic information system from the node p i which is currently the subject via the geographic information system data acquiring unit 13 within a distance of a predetermined threshold value (S301).
Then, the geographic information system matching unit 14 uses the searched object data with the map shape data acquired by the geographic information system data acquisition unit 13 as a reference, and the shape of the peripheral object measured by the peripheral object shape measurement unit 11 at the target node p. Data is matched (S302). The result of this matching is measurement z. For the matching, a method similar to the processing in step S202 of FIG. 10 can be used.
 次に、地理情報システムマッチング部14は、ステップS302でのマッチング結果を用いて、測定zとノードpとの対応関係を算出し、差分測定の誤差の確率分布(確率密度関数:式(4))を算出する(S303)。差分測定の誤差の確率分布の算出は、図10のステップS203と同様の方法を用いることができる。 Next, the geographic information system matching unit 14 calculates the correspondence relationship between the measurement z and the node p using the matching result in step S302, and calculates the probability distribution of the difference measurement error (probability density function: equation (4). ) Is calculated (S303). The calculation of the probability distribution of the difference measurement error can use the same method as in step S203 of FIG.
(GNSS測位部)
 図12は、GNSS測位部によるステップS105の処理の手順を示すフローチャートである。
 GNSS測位部15は、測位システムを用いて、例えば、平面直角座標系などの基準座標系に対する対応関係ci,jを算出する。
(GNSS positioning unit)
FIG. 12 is a flowchart showing the procedure of the process of step S105 by the GNSS positioning unit.
The GNSS positioning unit 15 calculates a correspondence c i, j with respect to a reference coordinate system such as a planar rectangular coordinate system, for example, using a positioning system.
 まず、GNSS測位部15は、現在対象としているノードpの基準座標系に対する測定zを、GNSSを用いて測位する(S401)。
 そして、GNSS測位部15は、ステップS401での測位結果(測定z)を用いて、ノードpに対する対応関係、および、測定zの誤差の確率分布を算出する(S402)。測定zの誤差の確率分布は、例えば、GNSSで用いられる通信プロトコルであるNMEA‐0183フォーマットのGSTセンテンスの情報などを用いることができる。
First, the GNSS positioning unit 15 measures the measurement z with respect to the reference coordinate system of the current target node p using GNSS (S401).
Then, the GNSS positioning unit 15 calculates the correspondence relationship with the node p and the probability distribution of the error of the measurement z using the positioning result (measurement z) in step S401 (S402). As the probability distribution of the error of the measurement z, for example, information on the GST sentence in the NMEA-0183 format, which is a communication protocol used in GNSS, can be used.
(車輪回転量測定部)
 図13は、車輪回転量測定部によるステップS105の処理の手順を示すフローチャートである。
 車輪回転量測定部16は、車輪回転量を累積することで、移動体Vが1つ前の時刻にいたノードpに対する現在位置のノードpを測定zとしたときの対応関係ci,jを算出する。
(Wheel rotation measurement unit)
FIG. 13 is a flowchart showing the procedure of the process of step S105 by the wheel rotation amount measuring unit.
The wheel rotation amount measuring unit 16 accumulates the wheel rotation amount, thereby obtaining a correspondence relationship c i, j when the node p at the current position with respect to the node p at which the moving object V was at the previous time is measured z. calculate.
 まず、車輪回転量測定部16は、移動体Vが1つ前の時刻にいたノードpを基準として、現在位置のノードpを測定zとし、その差分測定Zijを、車輪回転量を累積することで測定する(S501)。この際に、IMUと呼ばれる慣性センサやジャイロセンサを用いて、論文「Gyrodometry : A New Method for Combining Data from Gyros and Odometry in Mobile Robots」(著者:Johann Borenstein, and Liqiang Feng、学会会議:Proc. of ICRA’96、開催年:1996年)に記載の方法などを用いることができる。 First, the wheel rotation amount measurement unit 16 sets the node p j at the current position as the measurement z with reference to the node p i at which the moving object V was at the previous time, and the difference measurement Z ij as the wheel rotation amount. Measurement is performed by accumulating (S501). At this time, using an inertial sensor or gyro sensor called IMU, the paper “Gyrodometry: A New Method for Combining Data from Gyros and Odometry in Mobile Robots” (Author: Johann Borenstein, and Liqiang Feng, Conference Meeting: Proc. Of The method described in ICRA '96, held year: 1996) can be used.
 次に、車輪回転量測定部16は、ステップS501での測定結果を用いて、ノードpに対する測定zの対応関係ci,jと、差分測定Zijの誤差の確率分布(確率密度関数:式(4))を算出する(S502)。測定zの誤差の確率密度分布の算出は、例えば、書籍「ビークル」(著者:金井 喜美雄 ほか、出版社:コロナ社、出版年:2003年)に記載の方法などを用いることができる。 Next, the wheel rotation quantity measuring unit 16 uses the measurement result in the step S501, the node p j corresponding relation c i of the measurement z for, j and the probability distribution of the error in the difference measurement Z ij (probability density function: Equation (4)) is calculated (S502). For example, the method described in the book “Vehicle” (author: Kimio Kanai et al., Publisher: Corona, publication year: 2003) can be used to calculate the probability density distribution of measurement z errors.
[別の実施形態] [Another embodiment]
 図14は、本実施形態に係る自律走行システムの別の実施形態を示す図である。
 図1では、1台の移動体Vと、管理部20とが通信を行っているが、図14に示すように複数台の移動体V1,V2(V)に搭載された車載部10が、管理部20と通信を行うようにしてもよい。この場合、管理部20は、各々の車載部10から収集した測定のデータを基に、評価関数を生成し、軌跡Xcを求める。
 あるいは、各々の車載部10が、各部11~15を有していなくてもよい(ただし、車輪回転量測定部16は、すべての車載部10が有する必要がある)。この場合、管理部20は、各々の車載部10から収集した測定のデータを統合して、評価関数を生成し、軌跡Xcを求めるようにしてもよい。
FIG. 14 is a diagram illustrating another embodiment of the autonomous traveling system according to the present embodiment.
In FIG. 1, one mobile unit V and the management unit 20 communicate with each other. However, as shown in FIG. 14, the in-vehicle unit 10 mounted on a plurality of mobile units V1, V2 (V) Communication with the management unit 20 may be performed. In this case, the management unit 20 generates an evaluation function based on the measurement data collected from each in-vehicle unit 10 and obtains the trajectory Xc.
Alternatively, each in-vehicle unit 10 may not have the respective units 11 to 15 (however, all the in-vehicle units 10 need to have the wheel rotation amount measuring unit 16). In this case, the management unit 20 may integrate the measurement data collected from each in-vehicle unit 10 to generate an evaluation function and obtain the trajectory Xc.
 図15は、本実施形態に係る自律走行システムの別の実施形態を示す図である。
 図15に示すように、移動体Vの車載部10aに図1の車載部10および管理部20の機能が設けられてもよい。
 これにより、移動体Vaのみで軌跡の補正および地図の作成が可能となる。
FIG. 15 is a diagram showing another embodiment of the autonomous traveling system according to the present embodiment.
As shown in FIG. 15, the functions of the in-vehicle unit 10 and the management unit 20 in FIG. 1 may be provided in the in-vehicle unit 10 a of the moving body V.
Thereby, it is possible to correct the trajectory and create a map only by the moving body Va.
[まとめ]
 本実施形態によれば、複数の測定手段から得られたデータを基に、評価関数を生成し、その評価関数を最適化することにより、測定誤差を含む移動体Vの軌跡Xを、全体にわたって累積誤差がなく整合性を保った移動体Vの軌跡Xcを推定することができる。そして、その軌跡Xcに、周辺物体の形状データを貼付することで、誤差が累積しない正確な地図の生成が可能となる。
 これにより、このような地図を基に、移動体Vが自律移動することで、移動体Vは自己位置や目標経路を見失うことなく目的地に到達することができる。
[Summary]
According to the present embodiment, an evaluation function is generated based on data obtained from a plurality of measurement means, and the evaluation function is optimized, so that the trajectory X of the moving object V including a measurement error can be obtained throughout. It is possible to estimate the trajectory Xc of the moving object V that has no accumulated error and maintains consistency. Then, by pasting the shape data of the surrounding objects on the locus Xc, it is possible to generate an accurate map without accumulating errors.
Thereby, the moving body V can reach the destination without losing sight of its own position or the target route by moving the moving body V autonomously based on such a map.
 つまり、本実施形態によれば、逐次的なマッチングにより自己位置を推定しながら地図を生成するのではなく、地図を生成する対象とする走行環境中の形状データをすべて収集した後に、測定データの全体にわたって累積誤差がなく整合性を保った移動体の軌跡を推定し、当該軌跡に対して測定した周辺物体の形状データを貼付することで正確な地図を生成し、自己位置や目標経路を見失うことなく目的地に到達する自律移動システムを実現する。 That is, according to this embodiment, instead of generating a map while estimating its own position by sequential matching, after collecting all the shape data in the driving environment for which a map is to be generated, Estimate the trajectory of a moving object that has no accumulated error throughout and maintain consistency, and paste the shape data of the surrounding objects measured on the trajectory to generate an accurate map, losing sight of the self-position and target route Realize an autonomous mobile system that reaches the destination without any problems.
 1   自律移動システム
 10,10a 車載部
 11  周辺物体形状測定部
 12  周辺物体形状マッチング部
 13  地理情報システムデータ取得部
 14  地理情報システムマッチング部
 15  GNSS測位部
 16  車輪回転量測定部
 17  制御部
 20  管理部(軌跡補正装置)
 21  評価関数生成部
 22  軌跡最適化計算部
 23  形状地図データ生成部
 V,V1,V2,Va 移動体(移動体装置)
DESCRIPTION OF SYMBOLS 1 Autonomous mobile system 10, 10a Car-mounted part 11 Peripheral object shape measurement part 12 Peripheral object shape matching part 13 Geographic information system data acquisition part 14 Geographic information system matching part 15 GNSS positioning part 16 Wheel rotation amount measurement part 17 Control part 20 Management part (Track correction device)
21 Evaluation Function Generation Unit 22 Trajectory Optimization Calculation Unit 23 Shape Map Data Generation Unit V, V1, V2, Va Mobile Object (Mobile Object Device)

Claims (5)

  1.  移動体が走行した軌跡を補正する軌跡補正装置による軌跡補正方法であって、
     前記軌跡補正装置は、
     1の測定手段が取得した前記移動体の軌跡データに、複数のノードを設定し、
     前記1の測定手段が取得した前記移動体の位置データを、前記ノードに対応付けるとともに、前記1の測定手段とは別の他の測定手段が取得した前記移動体の位置データを、前記ノードに対応付け、
     前記ノードが生起する可能性がある位置を確率で示し、
     前記ノードに対応付けられた位置データが生起する可能性がある位置を確率で示し、
     各確率を基に、前記ノードおよび前記位置データを変数として含む評価関数を算出し、
     前記評価関数を基に、各ノードが生起する確率が最も大きい軌跡を算出する
     ことを特徴とする軌跡補正方法。
    A trajectory correction method using a trajectory correction apparatus that corrects a trajectory traveled by a moving object,
    The trajectory correction device includes:
    A plurality of nodes are set in the trajectory data of the moving body acquired by one measuring means;
    The position data of the moving body acquired by the one measuring unit is associated with the node, and the position data of the moving body acquired by another measuring unit different from the one measuring unit is associated with the node. With
    Indicates the probability that the node will occur,
    Indicates the position where the position data associated with the node may occur with probability,
    Based on each probability, an evaluation function including the node and the position data as variables is calculated,
    A trajectory correction method characterized by calculating a trajectory having the highest probability of occurrence of each node based on the evaluation function.
  2.  前記確率は、確率密度関数で示されており、
     前記評価関数は、尤度関数であり、
     前記軌跡補正装置は、
     最尤推定法によって、前記各ノードが生起する確率が最も大きい軌跡を算出する
     ことを特徴とする請求の範囲第1項に記載の軌跡補正方法。
    The probability is shown by a probability density function,
    The evaluation function is a likelihood function;
    The trajectory correction device includes:
    The trajectory correction method according to claim 1, wherein a trajectory having the highest probability of occurrence of each node is calculated by a maximum likelihood estimation method.
  3.  前記軌跡補正装置は、
     前記算出された軌跡の周囲に、構造物の形状データを貼付することにより、地図データを作成する
     ことを特徴とする請求の範囲第1項または請求の範囲第2項に記載の軌跡補正方法。
    The trajectory correction device includes:
    The trajectory correction method according to claim 1 or 2, wherein map data is created by pasting shape data of a structure around the calculated trajectory.
  4.  移動体が走行した軌跡を補正する軌跡補正装置であって、
     1の測定手段が取得した前記移動体の軌跡データに、複数のノードを設定し、
     前記1の測定手段が取得した前記移動体の位置データを、前記ノードに対応付けるとともに、前記1の測定手段とは別の他の測定手段が取得した前記移動体の位置データを、前記ノードに対応付け、
     前記ノードが生起する可能性がある位置を確率で示し、
     前記ノードに対応付けられた位置データが生起する可能性がある位置を確率で示し、
     各確率を基に、前記ノードおよび前記位置データを変数として含む評価関数を算出する評価関数生成部と、
     前記評価関数を基に、各ノードが生起する確率が最も大きい軌跡を算出する軌跡最適化計算部と、
     を有することを特徴とする軌跡補正装置。
    A trajectory correction device that corrects a trajectory traveled by a moving object,
    A plurality of nodes are set in the trajectory data of the moving body acquired by one measuring means;
    The position data of the moving body acquired by the one measuring unit is associated with the node, and the position data of the moving body acquired by another measuring unit different from the one measuring unit is associated with the node. With
    Indicates the probability that the node will occur,
    Indicates the position where the position data associated with the node may occur with probability,
    Based on each probability, an evaluation function generation unit that calculates an evaluation function including the node and the position data as variables;
    Based on the evaluation function, a trajectory optimization calculation unit that calculates a trajectory with the highest probability that each node occurs,
    A trajectory correction apparatus characterized by comprising:
  5.  請求の範囲第4項に記載の軌跡補正装置を搭載している
     ことを特徴とする移動体装置。
    A trajectory correction device according to claim 4 is mounted.
PCT/JP2011/061685 2011-05-20 2011-05-20 Trajectory correction method, trajectory correction apparatus, and moving body apparatus WO2012160630A1 (en)

Priority Applications (4)

Application Number Priority Date Filing Date Title
PCT/JP2011/061685 WO2012160630A1 (en) 2011-05-20 2011-05-20 Trajectory correction method, trajectory correction apparatus, and moving body apparatus
DE112011105210.3T DE112011105210T5 (en) 2011-05-20 2011-05-20 Locus correction method, locus correction device, and mobile object device
US14/118,899 US9182235B2 (en) 2011-05-20 2011-05-20 Locus correcting method, locus correcting apparatus, and mobile object equipment
JP2013516092A JP5852645B2 (en) 2011-05-20 2011-05-20 Trajectory correction method, trajectory correction device, and moving body device

Applications Claiming Priority (1)

Application Number Priority Date Filing Date Title
PCT/JP2011/061685 WO2012160630A1 (en) 2011-05-20 2011-05-20 Trajectory correction method, trajectory correction apparatus, and moving body apparatus

Publications (1)

Publication Number Publication Date
WO2012160630A1 true WO2012160630A1 (en) 2012-11-29

Family

ID=47216735

Family Applications (1)

Application Number Title Priority Date Filing Date
PCT/JP2011/061685 WO2012160630A1 (en) 2011-05-20 2011-05-20 Trajectory correction method, trajectory correction apparatus, and moving body apparatus

Country Status (4)

Country Link
US (1) US9182235B2 (en)
JP (1) JP5852645B2 (en)
DE (1) DE112011105210T5 (en)
WO (1) WO2012160630A1 (en)

Cited By (3)

* Cited by examiner, † Cited by third party
Publication number Priority date Publication date Assignee Title
JP2014122894A (en) * 2012-12-19 2014-07-03 Toyota Motor Engineering & Manufacturing North America Inc Apparatus and method for vehicle, and storage medium including instruction for executing the method
JP2018504650A (en) * 2014-12-26 2018-02-15 ヘーレ グローバル ベスローテン フェンノートシャップ Geometric fingerprinting for device location
CN108303075A (en) * 2017-12-29 2018-07-20 广州斯马特信息科技有限公司 Orbit generation method and system

Families Citing this family (4)

* Cited by examiner, † Cited by third party
Publication number Priority date Publication date Assignee Title
JP6878045B2 (en) * 2017-02-28 2021-05-26 国立研究開発法人理化学研究所 Point cloud data extraction method and point cloud data extraction device
DE102017212603A1 (en) * 2017-07-21 2019-01-24 Robert Bosch Gmbh A method of providing and improving a positional probability distribution for GNSS receive data
KR102063534B1 (en) * 2017-11-30 2020-01-09 주식회사 모빌테크 Method for building map using LiDAR
JP6974189B2 (en) * 2018-01-16 2021-12-01 株式会社豊田中央研究所 Map making device

Citations (4)

* Cited by examiner, † Cited by third party
Publication number Priority date Publication date Assignee Title
JP2002357437A (en) * 1984-06-07 2002-12-13 Tele Atlas North America Inc Device for providing traveling body tracking information
JP2008002906A (en) * 2006-06-21 2008-01-10 Toyota Motor Corp Positioning device
JP2008026282A (en) * 2006-07-25 2008-02-07 Toyota Motor Corp Positioning device and navigation system
JP2008175786A (en) * 2007-01-22 2008-07-31 Zhencheng Hu Moving object position detecting method and detector

Family Cites Families (4)

* Cited by examiner, † Cited by third party
Publication number Priority date Publication date Assignee Title
DE59501731D1 (en) * 1994-09-06 1998-04-30 Siemens Ag METHOD FOR DETERMINING THE POSITION OF A LANDMARK IN THE ENVIRONMENTAL MAP OF A SELF-MOVING UNIT, THE DISTANCE TO THE UNIT DYNAMICALLY DETERMINED BY IT
JP2004110802A (en) 2002-08-26 2004-04-08 Sony Corp Device, method for identifying environment, program, recording medium and robot device
JP2008076348A (en) 2006-09-25 2008-04-03 Dainippon Toryo Co Ltd Analytical method for hexavalent chromium in paint
JP4788722B2 (en) * 2008-02-26 2011-10-05 トヨタ自動車株式会社 Autonomous mobile robot, self-position estimation method, environmental map generation method, environmental map generation device, and environmental map data structure

Patent Citations (4)

* Cited by examiner, † Cited by third party
Publication number Priority date Publication date Assignee Title
JP2002357437A (en) * 1984-06-07 2002-12-13 Tele Atlas North America Inc Device for providing traveling body tracking information
JP2008002906A (en) * 2006-06-21 2008-01-10 Toyota Motor Corp Positioning device
JP2008026282A (en) * 2006-07-25 2008-02-07 Toyota Motor Corp Positioning device and navigation system
JP2008175786A (en) * 2007-01-22 2008-07-31 Zhencheng Hu Moving object position detecting method and detector

Cited By (4)

* Cited by examiner, † Cited by third party
Publication number Priority date Publication date Assignee Title
JP2014122894A (en) * 2012-12-19 2014-07-03 Toyota Motor Engineering & Manufacturing North America Inc Apparatus and method for vehicle, and storage medium including instruction for executing the method
JP2018504650A (en) * 2014-12-26 2018-02-15 ヘーレ グローバル ベスローテン フェンノートシャップ Geometric fingerprinting for device location
US10145956B2 (en) 2014-12-26 2018-12-04 Here Global B.V. Geometric fingerprinting for localization of a device
CN108303075A (en) * 2017-12-29 2018-07-20 广州斯马特信息科技有限公司 Orbit generation method and system

Also Published As

Publication number Publication date
JPWO2012160630A1 (en) 2014-07-31
US20140088863A1 (en) 2014-03-27
DE112011105210T5 (en) 2014-05-28
JP5852645B2 (en) 2016-02-03
US9182235B2 (en) 2015-11-10

Similar Documents

Publication Publication Date Title
JP5852645B2 (en) Trajectory correction method, trajectory correction device, and moving body device
JP6694395B2 (en) Method and system for determining position relative to a digital map
US11726208B2 (en) Autonomous vehicle localization using a Lidar intensity map
JP5927735B2 (en) Map data creation device, autonomous mobile system and autonomous mobile control device
KR101976241B1 (en) Map building system and its method based on multi-robot localization
US20190073794A1 (en) Survey data processing device, survey data processing method, and survey data processing program
US9098088B2 (en) Method for building outdoor map for moving object and apparatus thereof
WO2012086029A1 (en) Autonomous movement system
TW201118345A (en) Methods and apparatuses for correcting location measurements for a navigable feature
US20200364883A1 (en) Localization of a mobile unit by means of a multi-hypothesis kalman filter method
EP4124829B1 (en) Map construction method, apparatus, device and storage medium
CN110887493B (en) Track calculation method, medium, terminal and device based on local map matching
US11578991B2 (en) Method and system for generating and updating digital maps
JP2008065087A (en) Apparatus for creating stationary object map
US11798225B2 (en) 3D building generation using topology
US11670169B2 (en) Systems and methods for distributed cooperative localization in a connected vehicular platform
WO2024027350A1 (en) Vehicle positioning method and apparatus, computer device and storage medium
WO2017175433A1 (en) Map data generation system and method for generating map data
JP2019174191A (en) Data structure, information transmitting device, control method, program, and storage medium
KR102506411B1 (en) Method and apparatus for estimation of location and pose on vehicle and record medium for this
CN112747752B (en) Vehicle positioning method, device, equipment and storage medium based on laser odometer
WO2019188874A1 (en) Data structure, information processing device, and map data generation device
EP3663973A1 (en) Automatic detection and positioning of structure faces
Li et al. Lane Level Positioning Method Based on Vector Map Matching for Autonomous Driving: A Polynomial Fitting Method
Tang et al. Enhanced indoor positioning through human-robot collaboration

Legal Events

Date Code Title Description
121 Ep: the epo has been informed by wipo that ep was designated in this application

Ref document number: 11865972

Country of ref document: EP

Kind code of ref document: A1

ENP Entry into the national phase

Ref document number: 2013516092

Country of ref document: JP

Kind code of ref document: A

WWE Wipo information: entry into national phase

Ref document number: 14118899

Country of ref document: US

Ref document number: 1120111052103

Country of ref document: DE

Ref document number: 112011105210

Country of ref document: DE

122 Ep: pct application non-entry in european phase

Ref document number: 11865972

Country of ref document: EP

Kind code of ref document: A1