WO2012081825A1 - 신호 대 잡음 개선을 위한 이온 싸이클로트론 공명 질량 분석기 신호처리방법 - Google Patents
신호 대 잡음 개선을 위한 이온 싸이클로트론 공명 질량 분석기 신호처리방법 Download PDFInfo
- Publication number
- WO2012081825A1 WO2012081825A1 PCT/KR2011/008230 KR2011008230W WO2012081825A1 WO 2012081825 A1 WO2012081825 A1 WO 2012081825A1 KR 2011008230 W KR2011008230 W KR 2011008230W WO 2012081825 A1 WO2012081825 A1 WO 2012081825A1
- Authority
- WO
- WIPO (PCT)
- Prior art keywords
- signal
- noise
- value
- mass spectrometer
- cyclotron resonance
- Prior art date
- Legal status (The legal status is an assumption and is not a legal conclusion. Google has not performed a legal analysis and makes no representation as to the accuracy of the status listed.)
- Ceased
Links
Images
Classifications
-
- H—ELECTRICITY
- H01—ELECTRIC ELEMENTS
- H01J—ELECTRIC DISCHARGE TUBES OR DISCHARGE LAMPS
- H01J49/00—Particle spectrometers or separator tubes
- H01J49/0027—Methods for using particle spectrometers
- H01J49/0036—Step by step routines describing the handling of the data generated during a measurement
-
- H—ELECTRICITY
- H01—ELECTRIC ELEMENTS
- H01J—ELECTRIC DISCHARGE TUBES OR DISCHARGE LAMPS
- H01J49/00—Particle spectrometers or separator tubes
- H01J49/26—Mass spectrometers or separator tubes
- H01J49/34—Dynamic spectrometers
- H01J49/36—Radio frequency spectrometers, e.g. Bennett-type spectrometers, Redhead-type spectrometers
- H01J49/38—Omegatrons ; using ion cyclotron resonance
-
- G—PHYSICS
- G01—MEASURING; TESTING
- G01N—INVESTIGATING OR ANALYSING MATERIALS BY DETERMINING THEIR CHEMICAL OR PHYSICAL PROPERTIES
- G01N27/00—Investigating or analysing materials by the use of electric, electrochemical, or magnetic means
- G01N27/62—Investigating or analysing materials by the use of electric, electrochemical, or magnetic means by investigating the ionisation of gases, e.g. aerosols; by investigating electric discharges, e.g. emission of cathode
- G01N27/622—Ion mobility spectrometry
- G01N27/623—Ion mobility spectrometry combined with mass spectrometry
-
- H—ELECTRICITY
- H01—ELECTRIC ELEMENTS
- H01J—ELECTRIC DISCHARGE TUBES OR DISCHARGE LAMPS
- H01J49/00—Particle spectrometers or separator tubes
- H01J49/02—Details
- H01J49/022—Circuit arrangements, e.g. for generating deviation currents or voltages ; Components associated with high voltage supply
Definitions
- the present invention relates to a signal processing method of an ion cyclotron resonance mass spectrometer, and more particularly, to a signal processing method of an ion cyclotron resonance mass spectrometer for improving signal-to-noise components to attenuate noise components using a noise reduction algorithm. .
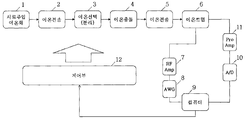
- a control device of a general ion cyclotron resonance mass spectrometer will be described in detail with reference to FIG. 1.
- FIG. 1 is an overall configuration diagram of a general ion cyclotron resonance mass spectrometer control device.
- a typical ion cyclotron resonance mass spectrometer includes a sample injection ionizer 1 for ionizing and releasing an injected sample, and a first ion for transmitting ions emitted from the sample injection ionizer 1.
- An ion selector (separation) unit 3 for selecting or separating and transmitting ions transmitted through the transmission unit 2 and the first ion transport unit 2 according to a specific purpose, and the ion selector (separation) unit 3 Ion bombardment part 4 which collides the ion selected or separated by impingement with the collision gas and emits it into smaller sizes, and a second ion transmitter 5 which transmits the ions divided by the ion bombardment part 4.
- ion trap 6 and the ion trap 6 which collects ions transmitted through the second ion transmitter 5 to an ion trap and detects an electrical signal representing a mass of ions meeting a specific purpose. Signal detection is carried out by the control program of the computer 10.
- An arbitrary waveform generator (AWG) 8 for generating an arbitrary waveform, an RF amplifier 7 for amplifying the generated arbitrary waveform, and an amplified waveform to the ion trap 6 to excite ions. .
- AMG arbitrary waveform generator
- the excited signal is passed through the digitizer (A / D) 10 through another electrode of the ion trap and amplified to a signal size suitable for detection through the preamplifier 11 shown in FIG.
- Signal processing is performed on the computer.
- a control signal is transmitted to the control device of each step through the control unit 12 by a control program operated by a computer.
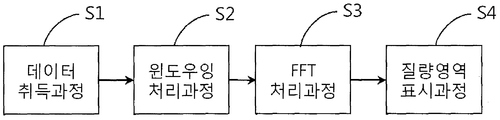
- the signal processor of the ion cyclotron resonance mass spectrometer according to the prior art is shown in FIG. 2.
- Figure 2 is a flow diagram of the signal processing process of the ion cyclotron resonance mass spectrometer
- the conventional ion cyclotron resonance mass spectrometer is a windowing technique to improve the signal-to-noise ratio of the data acquisition process (S1) to obtain data from the digitizer, the obtained data Windowing processing using S2, Fast Fourier Transformer (F3) processing time domain signal into frequency domain signal (S3), Mass domain display process converting frequency domain signal into m / z domain (S4) ), And performs a signal processing algorithm.
- the noise may be reduced when performing the signal processing of the windowing process S2, which is a signal processing process, signal loss occurs.
- the ion cyclotron resonance mass spectrometer according to the prior art has a problem in that signal loss is inevitable because the windowing process selects only a limited area.
- the present invention is to solve the above-mentioned problems, the signal loss generated during the windowing process of the ion cyclotron resonance mass spectrometer by processing the differential window to reduce the signal loss and increase the noise which is a disadvantage of the differential windowing noise reduction algorithm
- An object of the present invention is to provide an ion cyclotron resonance mass spectrometer signal processing method for improving signal-to-noise that is used to attenuate noise components.
- the ion cyclotron resonance mass spectrometer signal processing process for improving the signal-to-noise is performed after the signal-to-noise ratio of the data obtained from the digitizer is improved, and the time-domain signal is processed to the frequency-domain signal by FFT
- a signal processing method of an ion cyclotron resonance mass spectrometer for converting a frequency domain signal into a mass-to-charge ratio (m / z) region comprising: a data acquisition process of converting an analog signal obtained through the digitizer into a digital signal (S10); A DC voltage processing step (S20) of removing the DC voltage included in the signal component obtained from the data acquisition step (S10); A differential window processing step (S30) of reducing the loss of signal components through differential windowing signal processing of the signal obtained through the DC voltage processing step (S20); An FFT process (S40) for performing a fast fourier transformer (FFT) operation on the data in the time domain obtained in the differential window processing process
- the signal processing method of the ion cyclotron resonance mass spectrometer for signal-to-noise improvement performs a differential order windowing to reduce the loss of signal components and a noise reduction operation for increased noise components. It has a noise reduction effect.
- FIG. 1 is an overall configuration diagram of a general ion cyclotron resonance mass spectrometer control device
- Figure 2 is a flow diagram of the signal processing process of the ion cyclotron resonance mass spectrometer according to the prior art
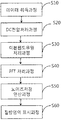
- FIG. 3 is a flowchart of a signal processing procedure of an ion cyclotron resonance mass spectrometer for signal-to-noise improvement according to an embodiment of the present invention
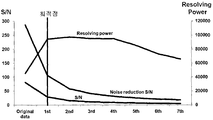
- FIG. 4 is a comparison chart for finding an optimal point for signal-to-noise ratio calculation and resolving power through a differential window process and a noise reduction operation process according to an embodiment of the present invention.
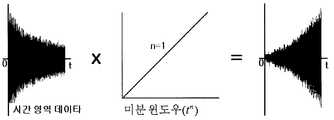
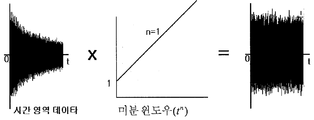
- 5 is a diagram to help understand the differential windowing operation.
- control signal generated by the signal processing algorithm in the computer 9 receiving the digital signal obtained through the digitizer 10 is transmitted to the control device of each stage through the control unit 12. .
- FIG. 3 is a flowchart of a signal processing procedure of an ion cyclotron resonance mass spectrometer for improving signal-to-noise according to an embodiment of the present invention, and a data acquisition process of converting an analog signal obtained through the digitizer 10 into a digital signal (S10). And a DC voltage process (S20) for removing a DC voltage included in the signal component obtained from the data acquisition process (S10), and a signal obtained through the DC voltage process (S20) through differential windowing signal processing.
- S10 DC voltage process
- a frequency domain signal of the data comprises a mass area display process (S60) to be converted to a mass to charge ratio (m / z) domain.
- Equation 2 is an expression for n derivatives.
- the problem is to multiply a few times to find a value that is optimized for signal components, noise and other signal characteristics (resolving power in mass spectrometers).
- the noise reduction calculation process (S50) is to calculate the noise value through the following equation (3).
- n i current noise component
- n i-1 previous noise component
- n mean of all data
- M i current data value
- n mean an average value for all data is calculated, and then a noise level for each data is calculated.
- M i is the current data value to be processed
- S i is the calculated current data value
- n i is the current noise component calculation.
- M i value is 3 to 5 times larger than n mean , it is preferably determined as 5.
- S i applies to M i .
- the noise subtraction in the same manner as in Equation 4 increases the noise level when the noise value included in the signal increases, and decreases the noise level when the noise value decreases, thereby performing the addition / decrement operation while increasing or decreasing the noise component. There is this.
- S / N is a comparison chart of signal-to-noise ratio calculation and resolving power through differential window processing and noise reduction according to an embodiment of the present invention, which is included in a signal component through the DC voltage processing (S20).
- the signal-to-noise ratio (S / N) for the first to seventh order derivatives is calculated through the raw data from which the DC voltage is removed and the differential window processing process (S30), and the signal through the noise reduction operation process (S50).
- Noise reduction S / N can be calculated and the optimum differential order can be determined by comparing the resolving power that characterizes the mass signal.
- the optimal signal improvement is obtained when the first derivative is performed.
- the optimum differential calculation point is the first derivative calculation point.
- 5A and 5B are explanatory diagrams for reducing signal loss due to differential windowing.
Landscapes
- Chemical & Material Sciences (AREA)
- Analytical Chemistry (AREA)
- Physics & Mathematics (AREA)
- Spectroscopy & Molecular Physics (AREA)
- Life Sciences & Earth Sciences (AREA)
- Health & Medical Sciences (AREA)
- Molecular Biology (AREA)
- Chemical Kinetics & Catalysis (AREA)
- Electrochemistry (AREA)
- Biochemistry (AREA)
- General Health & Medical Sciences (AREA)
- General Physics & Mathematics (AREA)
- Immunology (AREA)
- Pathology (AREA)
- Other Investigation Or Analysis Of Materials By Electrical Means (AREA)
Abstract
본 발명은 신호대 잡음 개선을 위한 이온 싸이클로트론 공명 질량 분석기 신호처리방법에 관한 것으로, 이온 싸이클로트론 공명 질량 분석기의 윈도우잉 과정에서 생기는 신호손실을 미분 윈도우잉으로 처리하여 신호손실을 줄이고 미분 윈도우잉의 단점인 노이즈 증가를 노이즈 저감 알고리즘을 사용하여 노이즈 성분을 감쇄하도록 하는 것이다. 본 발명은 데이터취득과정, DC전압처리과정, 미분윈도우처리과정, FFT처리과정, 노이즈저감연산과정, 질량영역표시과정을 포함하여 이루어진 것을 특징으로 한다.
Description
본 발명은 이온 싸이클로트론 공명 질량 분석기 신호처리방법에 관한 것이며, 더욱 상세하게는 노이즈 저감 알고리즘을 사용하여 노이즈 성분을 감쇄하도록 하는 신호 대 잡음 성분 개선을 위한 이온 싸이클로트론 공명 질량분석기의 신호처리방법에 관한 것이다.
일반적인 이온 싸이클로트론 공명 질량 분석기의 제어장치에 대하여 첨부된 도1을 참고하여 상세히 설명하면 다음과 같다.
도 1은 일반적인 이온 싸이클로트론 공명 질량 분석기 제어장치의 전체 구성도이다.
일반적인 이온 싸이클로트론 공명 질량 분석기는 도 1에 도시된 바와 같이, 주입된 시료를 이온화시켜 방출하는 시료주입 이온화부(1)와, 상기 시료주입 이온화부(1)로부터 방출된 이온을 전송하는 제1이온 전송부(2), 상기 제1이온 전송부(2)를 통해 전송된 이온을 특정 목적에 따라 선택하거나 분리하여 방출하는 이온선택(분리)부(3), 상기 이온선택(분리)부(3)에 의해 선택되거나 분리된 이온을 충돌 가스와 충돌시켜 더 작은 크기로 나누어 방출하는 이온 충돌부(4), 상기 이온 충돌부(4)에 의해 나누어진 이온을 전송하는 제2이온 전송부(5), 상기 제2이온 전송부(5)를 통해 전송된 이온을 이온 트랩에 수집한 후 특정 목적에 부합하는 이온의 질량을 나타내는 전기적 신호를 검출하는 이온트랩(6), 이온트랩(6)에서 신호 검출은 컴퓨터(10)의 제어 프로그램에 의하여 임의파형을 발생시키는 임의파형발생부(AWG)(8)와 발생된 임의 파형을 증폭시키는 고주파증폭기(RF Amp)(7), 증폭된 파형을 이온트랩(6)에 인가하여 이온을 여기시킨다.
여기된 신호는 이온트랩의 또 다른 전극을 통하여 도 1에서 나타나는 전치증폭기(Pre Amp)(11)를 통과하여 검출하기 적당한 신호크기로 증폭하여 디지타이저(A/D)(10)를 통과하여 디지털 신호가 되어 컴퓨터에서 신호처리가 이루어진다. 각 단계별로 이루어지는 제어는 컴퓨터에서 운영되는 제어프로그램에 의하여 제어 신호가 제어부(12)를 통하여 각 단계의 제어 장치에 신호가 전달된다.
종래기술에 따른 이온 싸이클로트론 공명 질량 분석기의 신호처리부는 도 2에 도시된 바와 같다.
즉, 도 2는 이온 싸이클로트론 공명 질량 분석기의 신호처리 과정 흐름도로서, 종래의 이온 싸이클로트론 공명 질량 분석기는 디지타이저에서 데이터를 얻는 데이터 취득과정(S1), 얻은 데이터의 신호 대 잡음 비 향상을 위하여 윈도우잉 기법을 사용하는 윈도우잉 처리과정(S2), 시간 영역 신호를 주파수 영역신호로 처리하는 FFT(Fast Fourier Transformer) 처리과정(S3), 주파수 영역 신호를 m/z 영역으로 변환하는 질량영역 표시과정(S4)으로 구성되어, 신호처리 알고리즘을 수행한다.
여기서, 신호처리 과정인 윈도우잉 처리과정(S2)의 신호처리를 수행할 때 잡음을 줄일 수는 있지만 신호의 손실이 발생한다.
따라서, 종래기술에 따른 이온 싸이클로트론 공명 질량 분석기는 윈도우잉 자체가 제한된 영역만을 선택하는 과정이므로 신호 손실이 불가피한 문제점이 있었다.
본 발명은 상기한 종래의 문제점을 해결하기 위한 것으로서, 이온 싸이클로트론 공명 질량 분석기의 윈도우잉 과정에서 생기는 신호손실을 미분 윈도우로 처리하여 신호손실을 줄이고 미분 윈도우잉의 단점인 노이즈 증가를 노이즈 저감 알고리즘을 사용하여 노이즈 성분을 감쇄하도록 하는 신호대 잡음 개선을 위한 이온 싸이클로트론 공명 질량 분석기 신호처리방법을 제공하는데 그 목적이 있다.
본 발명의 목적을 달성하기 위한 신호대 잡음 개선을 위한 이온 싸이클로트론 공명 질량 분석기 신호처리과정은 디지타이저에서 얻어진 데이터의 신호 대 잡음비 향상 후, 시간 영역 신호를 주파수 영역신호로 FFT(Fast Fourier Transformer) 처리하고, 주파수 영역신호를 질량대 전하비(m/z)영역으로 변환하는 이온 싸이클로트론 공명 질량분석기의 신호처리방법에 있어서, 상기 디지타이저를 통하여 얻어진 아날로그 신호를 디지털신호로 변환하는 데이터취득과정(S10); 상기 데이터취득과정(S10)으로부터 얻어진 신호 성분에 포함된 DC전압을 제거해 주는 DC전압처리과정(S20); 상기 DC전압처리과정(S20)을 통해 얻어진 신호를 미분 윈도우잉 신호처리를 통해 신호성분에 대한 손실을 줄이는 미분윈도우처리과정(S30); 상기 미분윈도우처리과정(S30)에서 얻어진 시간 영역의 데이터를 FFT(Fast Fourier Transformer) 연산을 수행하는 FFT처리과정(S40); 상기 FFT처리과정(S40)을 통해 연산되는 과정에서 증가된 노이즈성분을 제거하는 노이즈저감연산과정(S50); 및 상기 노이즈저감연산과정(S50)으로부터 노이즈 감소된 데이터의 주파수 영역 신호를 질량 대 전하비(m/z) 영역으로 변환하는 질량영역표시과정(S60);를 포함하여 이루어진 것을 특징으로 한다.
본 발명에 따른 신호 대 잡음 개선을 위한 이온 싸이클로트론 공명 질량 분석기의 신호처리방법은 신호 성분의 손실을 줄이기 위한 미분 차수 윈도우잉과 늘어난 노이즈 성분에 대한 노이즈 저감 연산과정을 수행하므로, 신호성분의 향상 및 노이즈 저감 효과가 있다.
도 1은 일반적인 이온 싸이클로트론 공명 질량 분석기 제어장치의 전체 구성도이고,
도 2은 종래기술에 따른 이온 싸이클로트론 공명 질량 분석기의 신호처리 과정 흐름도이고,
도 3는 본 발명의 실시예에 따른 신호 대 잡음 개선을 위한 이온 싸이클로트론 공명 질량 분석기의 신호처리과정의 흐름도이고,
도 4은 본 발명의 실시예에 따른 미분 윈도우과정 및 노이즈저감연산과정을 통해 신호 대 잡음비 산출 및 분해능(resolving power)에 대한 최적점을 찾기 위한 비교 도표이고,
도 5는 미분 윈도우잉 연산에 대한 이해를 돕기 위한 도면이다.
본 발명의 실시예에 따른 신호 대 잡음 개선을 위한 이온 싸이클로트론 공명 질량 분석기의 신호처리방법을 첨부된 도 3 내지 도 5를 참조하여 상세히 설명하면 다음과 같다.
본 발명을 구현하기 위한 온 싸이클로트론 공명 질량 분석기 제어장치는 도 1에 도시된 바와 같이 배경기술에서 설명하였으며, 본 발명은 동일부호를 부여하고 그 상세한 설명은 생략한다.
즉, 본 발명은 상기 디지타이저(10)를 통하여 얻어진 디지털신호를 수신한 컴퓨터(9)에서 신호처리 알고리즘에 의하여 발생된 제어 신호가 제어부(12)를 통하여 각 단계의 제어 장치에 신호가 전달하게 된다.
이와 같이, 상기 컴퓨터(9)에서 신호 대 잡음 개선을 위한 이온 싸이클로트론 공명 질량 분석기의 신호처리 과정에 대하여 다음 도 3을 참조하여 상세히 설명하면 다음과 같다.
도 3은 본 발명의 실시예에 따른 신호 대 잡음 개선을 위한 이온 싸이클로트론 공명 질량 분석기의 신호처리과정의 흐름도로서, 디지타이저(10)를 통하여 얻어진 아날로그 신호를 디지털신호로 변환하는 데이터취득과정(S10)과, 상기 데이터취득과정(S10)으로부터 얻어진 신호 성분에 포함된 DC전압을 제거해 주는 DC전압처리과정(S20)과, 상기 DC전압처리과정(S20)을 통해 얻어진 신호를 미분 윈도우잉 신호처리를 통해 신호성분에 대한 손실을 줄이는 미분윈도우처리과정(S30)과, 상기 미분윈도우처리과정(S30)에서 얻어진 시간 영역의 데이터를 FFT(Fast Fourier Transformer) 연산을 수행하는 FFT처리과정(S40)과, 상기 FFT처리과정(S40)을 통해 연산되는 과정에서 증가된 노이즈성분을 제거하는 노이즈저감연산과정(S50)과, 상기 노이즈저감연산과정(S50)으로부터 노이즈 감소된 데이터의 주파수 영역 신호를 질량 대 전하비(m/z) 영역으로 변환하는 질량영역표시과정(S60)으로 이루어진다.
이와 같이 이루어진 본 발명의 실시 예에 따른 신호 대 잡음 개선을 위한 이온 싸이클로트론 공명 질량 분석기의 신호처리방법에 대하여 상세히 설명하면 다음과 같다.
상기 미분윈도우 처리과정(30)에서 중요한 것은 몇 번의 미분을 행하는 가에 있다.
시간 영역에서의 신호 f(t)를 푸리에 변환식으로 표현하면 다음 수학식 1과 같으며,
수학식 1 
다음 수학식 2는 n번의 미분에 대한 식이다.
수학식 2 
결국, n번 미분을 행한다는 것은 시간영역에서 t를 n번 곱하는 것과 같다.
여기서, 문제는 몇 번 곱하는 것이 신호 성분과 노이즈 그 밖에 신호특성(질량분석기에서는 Resolving power 변수)에 최적화된 값을 찾아야 한다.
상기 노이즈 저감 연산과정(S50)은 다음 수학식 3을 통해 노이즈값을 산출하게 된다.
수학식 3 
ni : 현재의 노이즈 성분, ni-1 : 직전의 노이즈 성분,
nmean : 모든 데이터의 평균값, Mi : 현재의 처리하는 데이터 값,
n0 : 첫 노이즈 성분 계산
먼저, 전체 데이터에 대한 평균값(nmean)을 산출한 다음, 각 데이터에 대한 노이즈 레벨을 계산한다.
처음 데이터에 대한 처음 노이즈 성분(n0)을 구한다. 위의 식에 따르거나 아니면 적절한 값을 준다. α값에 대한 결정은 n0를 계산할 때, M1값이 nmean보다 크면 0보다 크고 1과 같거나 작은 수로 결정한다. 바람직하게는 1로 결정하며, 반대인 경우는 0보다 작고 -1과 같거나 큰 수, 바람직하게는 -1로 결정한다. 이와 같은 방법으로 전체 각 데이터에 대한 ni를 모두 구한다.
즉, 신호상태에 따라 다르나, 증가하면 +1, 감소하면 -1로 연산하나, 정밀도가 필요한 경우 알고리즘에 의하여 증가하면 0보다 크고 1과 같거나 작은 수, 감소하면 0보다 작거나 -1보다 크거나 같은 수로 결정한다.
상기 수학식 3에서 산출된 노이즈 값들은 다음 수학식 4를 통해 감산을 행하면 산출된 새로운 데이터값 Si가 구해진다.
수학식 4 
여기서, Mi는 현재의 처리하는 데이터 값이고, Si는 계산된 현재의 데이터 값이고, ni는 현재의 노이즈 성분 계산이다.
단, 여기서 Mi값이 nmean 보다 3~5 배 큰 경우, 바람직하게는 5로 결정한다. Si는 Mi를 적용한다.
즉, 상기 수학식 4에서와 같은 방식의 노이즈 감산은 신호에 포함된 노이즈 값이 증가되면 노이즈 레벨도 올라가고, 노이즈값이 감소하면 노이즈 레벨도 감소하여 노이즈 성분의 증감을 따라가며 가감 연산을 하는 특징이 있다.
도 4는 본 발명의 실시예에 따른 미분윈도우 처리과정 및 노이즈저감과정을 통해 신호 대 잡음비 산출 및 분해능(resolving power)에 대한 비교 도표로서, 상기 DC전압처리과정(S20)을 통해 신호 성분에 포함된 DC전압을 제거한 원 데이터와 상기 미분윈도우처리과정(S30)을 통해 1차~7차 미분 값들에 대한 신호 대 잡음비(S/N)를 산출하고, 상기 노이즈저감연산과정(S50)을 통한 신호 대 잡음비(Noise reduction S/N)를 산출하고, 질량신호를 특징짓는 분해능(Resolving power)에 대한 비교를 통하여 최적의 미분 차수를 결정지을 수 있다.
여기서, 도 4에서와 같이 1차 미분을 행하였을 때가 최적의 신호 향상을 가져옴을 알 수 있다. 즉, 최적 미분 연산점은 1차 미분 연산점이 된다.
도 5a, 5b는 미분 윈도우잉에 따른 신호손실 저감을 위한 설명도로서, 미분 윈도우잉을 행할 때 도 5b에서처럼 곱하는 함수의 시작점이 x=0일 때, y=1에서 시작하면 원신호를 살리는 결과가 나온다. 하지만 도 5a에서 처럼 x=0일 때, y=0인 원점에서 시작하여도 충분히 신호 손실은 있지만 결과값을 얻는데는 동일한 결과가 나옴을 알 수 있다.
본 발명은 상기한 실시 예에 한정되지 않고, 이하의 특허청구 범위에서 청구하는 본 발명의 요지를 벗어남이 없이 본 발명이 속하는 분야에서 통상의 지식을 가진 자라면 누구든지 다양한 변경 실시가 가능한 범위까지 본 발명의 기술적 정신이 있다고 할 것이다.
Claims (4)
- 디지타이저(10)에서 얻어진 데이터를 수신한 컴퓨터(9)에 의해 신호 대 잡음비 향상 후, 시간 영역 신호를 주파수 영역신호로 FFT(Fast Fourier Transformer) 처리하고, 주파수 영역신호를 질량대 전하비(m/z)영역으로 변환하는 이온 싸이클로트론 공명 질량분석기의 신호처리방법에 있어서,상기 디지타이저(10)를 통하여 얻어진 아날로그 신호를 디지털신호로 변환하는 데이터취득과정(S10);상기 컴퓨터(10)에 의하여 데이터취득과정(S10)으로부터 얻어진 신호 성분에 포함된 DC전압을 제거해 주는 DC전압처리과정(S20);상기 DC전압처리과정(S20)을 통해 얻어진 신호를 미분 윈도우잉 신호처리를 통해 신호성분에 대한 손실을 줄이는 미분윈도우처리과정(S30);상기 미분윈도우처리과정(S30)에서 얻어진 시간 영역의 데이터를 FFT(Fast Fourier Transformer) 연산을 수행하는 FFT처리과정(S40);상기 FFT처리과정(S40)을 통해 연산되는 과정에서 증가된 노이즈성분을 제거하는 노이즈저감연산과정(S50); 및상기 노이즈저감연산과정(S50)으로부터 노이즈 감소된 데이터의 주파수 영역 신호를 질량 대 전하비(m/z) 영역으로 변환하는 질량영역표시과정(S60);를 포함하여 이루어진 것을 특징으로 하는 신호대 잡음 개선을 위한 이온 싸이클로트론 공명 질량 분석기 신호처리방법.
- 제 1 항에 있어서,상기 미분윈도우처리과정(S30) 및 노이즈저감연산과정(S50)은 신호성분에 따른 노이즈 값의 증감을 통해 새로운 신호성분을 연산하여 신호 대 잡음비를 향상시킨 데이터와 n차의 미분연산에 대한 최적 미분 연산점을 산출하여 노이즈성분을 제거하는 것을 특징으로 하는 신호대 잡음 개선을 위한 이온 싸이클로트론 공명 질량 분석기 신호처리방법.
- 제 1 항에 있어서,상기 미분윈도우처리과정(S30)은 다음 수학식 1과 같이 n번의 미분을 수행하는 것을 특징으로 하는 신호대 잡음 개선을 위한 이온 싸이클로트론 공명 질량 분석기 신호처리방법.[수학식 1]
 여기서,는 시간영역에서의 신호 f(t)를 푸리에 변환식으로 표현한 것임.
- 제 1 항에 있어서,상기 노이즈저감연산과정(S50)은 전체 원래 신호 데이터에 대한 평균값(nmean)을 산출하는 단계;상기 전체 원래 신호 데이터에 대한 각 노이즈값(ni)를 다음 수학식 2에 의해 산출하는 단계;[수학식 2]
 여기서, ni은 현재의 노이즈값, ni-1는 직전의 노이즈 값, Mi는 현재의 처리하는 데이터 값, n0는 첫 노이즈 값이고, 상기 α값에 대한 결정은 n0를 계산할 때는 M1값이 nmean보다 크면 0 보다 크고 1과 같거나 작은 수 이며, 상기 산출된 노이즈 값들은 각 원래 신호 데이터 값에 대하여 다음 수학식 3에 의하여 노이즈 성분의 증감에 따라 가감 연산을 수행하는 단계;로 이루어진 것을 특징으로 하는 신호대 잡음 개선을 위한 이온 싸이클로트론 공명 질량 분석기 신호처리방법.[수학식 3]
 여기서, Mi 는 현재의 처리하는 데이터 값이고, Si는 계산된 현재의 데이터 값이고, ni 는 현재의 노이즈 값이고, 여기서 Mi 값이 nmean 보다 3~5 배 큰 경우, Si는 Mi를 적용함.
Applications Claiming Priority (2)
| Application Number | Priority Date | Filing Date | Title |
|---|---|---|---|
| KR10-2010-0129680 | 2010-12-17 | ||
| KR1020100129680A KR101162178B1 (ko) | 2010-12-17 | 2010-12-17 | 신호 대 잡음 개선을 위한 이온 싸이클로트론 공명 질량 분석기 신호처리방법 |
Publications (1)
| Publication Number | Publication Date |
|---|---|
| WO2012081825A1 true WO2012081825A1 (ko) | 2012-06-21 |
Family
ID=46244890
Family Applications (1)
| Application Number | Title | Priority Date | Filing Date |
|---|---|---|---|
| PCT/KR2011/008230 Ceased WO2012081825A1 (ko) | 2010-12-17 | 2011-10-31 | 신호 대 잡음 개선을 위한 이온 싸이클로트론 공명 질량 분석기 신호처리방법 |
Country Status (2)
| Country | Link |
|---|---|
| KR (1) | KR101162178B1 (ko) |
| WO (1) | WO2012081825A1 (ko) |
Cited By (1)
| Publication number | Priority date | Publication date | Assignee | Title |
|---|---|---|---|---|
| WO2021254272A1 (zh) * | 2020-06-14 | 2021-12-23 | 杭州谱育科技发展有限公司 | 降低aes检测中噪声的方法 |
Citations (3)
| Publication number | Priority date | Publication date | Assignee | Title |
|---|---|---|---|---|
| JP2000299083A (ja) * | 1999-04-15 | 2000-10-24 | Jeol Ltd | 質量分析装置用データ収集システム |
| KR20090073515A (ko) * | 2007-12-31 | 2009-07-03 | 한국기초과학지원연구원 | 푸리에변환 이온 싸이클로트론 공명 질량분석기의 제어신호 발생 제어 장치 및 그 방법 |
| KR20090073521A (ko) * | 2007-12-31 | 2009-07-03 | 한국기초과학지원연구원 | 푸리에변환 이온 싸이클로트론 공명 질량분석기의 데이터획득 장치 및 그 방법 |
-
2010
- 2010-12-17 KR KR1020100129680A patent/KR101162178B1/ko not_active Expired - Fee Related
-
2011
- 2011-10-31 WO PCT/KR2011/008230 patent/WO2012081825A1/ko not_active Ceased
Patent Citations (3)
| Publication number | Priority date | Publication date | Assignee | Title |
|---|---|---|---|---|
| JP2000299083A (ja) * | 1999-04-15 | 2000-10-24 | Jeol Ltd | 質量分析装置用データ収集システム |
| KR20090073515A (ko) * | 2007-12-31 | 2009-07-03 | 한국기초과학지원연구원 | 푸리에변환 이온 싸이클로트론 공명 질량분석기의 제어신호 발생 제어 장치 및 그 방법 |
| KR20090073521A (ko) * | 2007-12-31 | 2009-07-03 | 한국기초과학지원연구원 | 푸리에변환 이온 싸이클로트론 공명 질량분석기의 데이터획득 장치 및 그 방법 |
Cited By (1)
| Publication number | Priority date | Publication date | Assignee | Title |
|---|---|---|---|---|
| WO2021254272A1 (zh) * | 2020-06-14 | 2021-12-23 | 杭州谱育科技发展有限公司 | 降低aes检测中噪声的方法 |
Also Published As
| Publication number | Publication date |
|---|---|
| KR101162178B1 (ko) | 2012-07-04 |
| KR20120068181A (ko) | 2012-06-27 |
Similar Documents
| Publication | Publication Date | Title |
|---|---|---|
| JP2993931B2 (ja) | 部分放電検知方法 | |
| EP3163902A1 (en) | Information-processing device, information processing method, and program | |
| JP2014523003A5 (ko) | ||
| CN112866873A (zh) | 抑制啸叫的方法及相关模型的训练方法和设备、介质 | |
| US8637809B2 (en) | Tandem quadrupole mass spectrometer | |
| US7409065B2 (en) | Apparatus and method for detecting sound direction | |
| JP2015156577A (ja) | 放送受信装置及びノイズ除去方法 | |
| WO2012081825A1 (ko) | 신호 대 잡음 개선을 위한 이온 싸이클로트론 공명 질량 분석기 신호처리방법 | |
| CN108847905A (zh) | 一种多通道盲信号侦收中的自适应门限检测方法 | |
| CN114268531A (zh) | 一种单音干扰检测和消除方法 | |
| WO2012081826A1 (ko) | 이온 싸이클로트론 공명 질량 분석기 신호성능 향상 제어장치 | |
| JPWO2007043151A1 (ja) | マルチキャリア送信装置 | |
| CN106782614B (zh) | 音质检测方法及装置 | |
| JPH1164431A (ja) | 部分放電測定方法 | |
| JP6236755B2 (ja) | パッシブソーナー装置、トランジェント信号処理方法及びその信号処理プログラム | |
| CN118275788B (zh) | 一种参数估计方法、装置、设备及存储介质 | |
| JPWO2004095750A1 (ja) | チャネル推定回路およびチャネル推定方法 | |
| US10416130B2 (en) | Mass spectrometry data processing apparatus, mass spectrometry system, and method for processing mass spectrometry data | |
| CA2782879C (en) | Dynamic range improvement for mass spectrometry | |
| JP7047698B2 (ja) | 分析装置 | |
| CN114062992A (zh) | 一种电流互感器一次侧检测过程超声波提取方法及装置 | |
| CN109155883A (zh) | 噪声检测和噪声降低 | |
| WO2011081298A2 (ko) | 파이프라인방식의 이온 싸이클로트론 공명 질량 분석 제어장치 및 방법 | |
| WO2012120126A1 (en) | Radio frequency digital receiver system and method | |
| CN113923091A (zh) | 基于相位加权的偏移干扰检测方法及装置 |
Legal Events
| Date | Code | Title | Description |
|---|---|---|---|
| 121 | Ep: the epo has been informed by wipo that ep was designated in this application |
Ref document number: 11847903 Country of ref document: EP Kind code of ref document: A1 |
|
| NENP | Non-entry into the national phase |
Ref country code: DE |
|
| 122 | Ep: pct application non-entry in european phase |
Ref document number: 11847903 Country of ref document: EP Kind code of ref document: A1 |