WO2012063441A1 - Method for detecting nucleic acid, method for optically observing sample, and phosphor - Google Patents
Method for detecting nucleic acid, method for optically observing sample, and phosphor Download PDFInfo
- Publication number
- WO2012063441A1 WO2012063441A1 PCT/JP2011/006163 JP2011006163W WO2012063441A1 WO 2012063441 A1 WO2012063441 A1 WO 2012063441A1 JP 2011006163 W JP2011006163 W JP 2011006163W WO 2012063441 A1 WO2012063441 A1 WO 2012063441A1
- Authority
- WO
- WIPO (PCT)
- Prior art keywords
- fluorescence
- nucleic acid
- sample
- copper
- intensity
- Prior art date
Links
Images


Classifications
-
- C—CHEMISTRY; METALLURGY
- C12—BIOCHEMISTRY; BEER; SPIRITS; WINE; VINEGAR; MICROBIOLOGY; ENZYMOLOGY; MUTATION OR GENETIC ENGINEERING
- C12Q—MEASURING OR TESTING PROCESSES INVOLVING ENZYMES, NUCLEIC ACIDS OR MICROORGANISMS; COMPOSITIONS OR TEST PAPERS THEREFOR; PROCESSES OF PREPARING SUCH COMPOSITIONS; CONDITION-RESPONSIVE CONTROL IN MICROBIOLOGICAL OR ENZYMOLOGICAL PROCESSES
- C12Q1/00—Measuring or testing processes involving enzymes, nucleic acids or microorganisms; Compositions therefor; Processes of preparing such compositions
- C12Q1/68—Measuring or testing processes involving enzymes, nucleic acids or microorganisms; Compositions therefor; Processes of preparing such compositions involving nucleic acids
- C12Q1/6813—Hybridisation assays
- C12Q1/6816—Hybridisation assays characterised by the detection means
- C12Q1/6825—Nucleic acid detection involving sensors
-
- C—CHEMISTRY; METALLURGY
- C12—BIOCHEMISTRY; BEER; SPIRITS; WINE; VINEGAR; MICROBIOLOGY; ENZYMOLOGY; MUTATION OR GENETIC ENGINEERING
- C12Q—MEASURING OR TESTING PROCESSES INVOLVING ENZYMES, NUCLEIC ACIDS OR MICROORGANISMS; COMPOSITIONS OR TEST PAPERS THEREFOR; PROCESSES OF PREPARING SUCH COMPOSITIONS; CONDITION-RESPONSIVE CONTROL IN MICROBIOLOGICAL OR ENZYMOLOGICAL PROCESSES
- C12Q1/00—Measuring or testing processes involving enzymes, nucleic acids or microorganisms; Compositions therefor; Processes of preparing such compositions
- C12Q1/68—Measuring or testing processes involving enzymes, nucleic acids or microorganisms; Compositions therefor; Processes of preparing such compositions involving nucleic acids
- C12Q1/6813—Hybridisation assays
- C12Q1/6827—Hybridisation assays for detection of mutation or polymorphism
-
- C—CHEMISTRY; METALLURGY
- C12—BIOCHEMISTRY; BEER; SPIRITS; WINE; VINEGAR; MICROBIOLOGY; ENZYMOLOGY; MUTATION OR GENETIC ENGINEERING
- C12Q—MEASURING OR TESTING PROCESSES INVOLVING ENZYMES, NUCLEIC ACIDS OR MICROORGANISMS; COMPOSITIONS OR TEST PAPERS THEREFOR; PROCESSES OF PREPARING SUCH COMPOSITIONS; CONDITION-RESPONSIVE CONTROL IN MICROBIOLOGICAL OR ENZYMOLOGICAL PROCESSES
- C12Q1/00—Measuring or testing processes involving enzymes, nucleic acids or microorganisms; Compositions therefor; Processes of preparing such compositions
- C12Q1/68—Measuring or testing processes involving enzymes, nucleic acids or microorganisms; Compositions therefor; Processes of preparing such compositions involving nucleic acids
- C12Q1/6813—Hybridisation assays
- C12Q1/6816—Hybridisation assays characterised by the detection means
-
- G—PHYSICS
- G01—MEASURING; TESTING
- G01N—INVESTIGATING OR ANALYSING MATERIALS BY DETERMINING THEIR CHEMICAL OR PHYSICAL PROPERTIES
- G01N21/00—Investigating or analysing materials by the use of optical means, i.e. using sub-millimetre waves, infrared, visible or ultraviolet light
- G01N21/62—Systems in which the material investigated is excited whereby it emits light or causes a change in wavelength of the incident light
- G01N21/63—Systems in which the material investigated is excited whereby it emits light or causes a change in wavelength of the incident light optically excited
- G01N21/64—Fluorescence; Phosphorescence
- G01N21/6486—Measuring fluorescence of biological material, e.g. DNA, RNA, cells
-
- G—PHYSICS
- G01—MEASURING; TESTING
- G01N—INVESTIGATING OR ANALYSING MATERIALS BY DETERMINING THEIR CHEMICAL OR PHYSICAL PROPERTIES
- G01N21/00—Investigating or analysing materials by the use of optical means, i.e. using sub-millimetre waves, infrared, visible or ultraviolet light
- G01N21/62—Systems in which the material investigated is excited whereby it emits light or causes a change in wavelength of the incident light
- G01N21/63—Systems in which the material investigated is excited whereby it emits light or causes a change in wavelength of the incident light optically excited
- G01N21/64—Fluorescence; Phosphorescence
- G01N2021/6417—Spectrofluorimetric devices
- G01N2021/6421—Measuring at two or more wavelengths
-
- G—PHYSICS
- G01—MEASURING; TESTING
- G01N—INVESTIGATING OR ANALYSING MATERIALS BY DETERMINING THEIR CHEMICAL OR PHYSICAL PROPERTIES
- G01N2201/00—Features of devices classified in G01N21/00
- G01N2201/12—Circuits of general importance; Signal processing
-
- Y—GENERAL TAGGING OF NEW TECHNOLOGICAL DEVELOPMENTS; GENERAL TAGGING OF CROSS-SECTIONAL TECHNOLOGIES SPANNING OVER SEVERAL SECTIONS OF THE IPC; TECHNICAL SUBJECTS COVERED BY FORMER USPC CROSS-REFERENCE ART COLLECTIONS [XRACs] AND DIGESTS
- Y10—TECHNICAL SUBJECTS COVERED BY FORMER USPC
- Y10T—TECHNICAL SUBJECTS COVERED BY FORMER US CLASSIFICATION
- Y10T436/00—Chemistry: analytical and immunological testing
- Y10T436/14—Heterocyclic carbon compound [i.e., O, S, N, Se, Te, as only ring hetero atom]
- Y10T436/142222—Hetero-O [e.g., ascorbic acid, etc.]
- Y10T436/143333—Saccharide [e.g., DNA, etc.]
Definitions
- the present technology relates to a method of detecting a nucleic acid, a method of optically observing a sample, and a fluorophore. More particularly, the present invention relates to a method for detecting a nucleic acid based on fluorescence emitted from a nucleic acid in contact with copper, a method for observing a sample, and a phosphor comprising copper and a nucleic acid.
- nucleic acid detection there is a method of staining a nucleic acid using a fluorescent dye.
- fluorescent dyes are known such as hoechst 33342, DAPI, ethidium bromide, SYBR green and the like.
- hoechst 33342 and DAPI are used for the purpose of staining nucleic acid in cells and tissues in flow cytometry, a microscope and the like.
- ethidium bromide is frequently used to stain nucleic acid molecules in electrophoresis.
- SYBR green and the like are also used for detecting the amplification process of nucleic acid in real time in nucleic acid amplification techniques such as polymerase chain reaction.
- Non-patent Documents 2 to 4 and 7 The above orange fluorescence is observed in cells both in the cytoplasm and in the cell nucleus, and in particular, it is described that it is notably detected in cytoplasm granules (see Non-patent Documents 2 to 4 and 7).
- the wavelength range of fluorescence is 590-630 nm, the peak wavelength is 610 nm, and the maximum excitation wavelength is 340 nm (Non-patent Document 3).
- Cu-MT copper and metallothionein
- the wavelength characteristics of Cu-MT are an excitation wavelength of 305 nm and a fluorescence wavelength of 565 nm, and in the non-patent document 17, an excitation wavelength of 310 nm and a fluorescence wavelength of 570 nm.
- Cu-MT copper is considered to be present in the state of monovalent ions (Cu (I)) (see Non-Patent Documents 13, 15, 17, 19, and 23).
- Non-patent Documents 24 to 29 Non-patent Documents 24 to 29. reference.
- Non-Patent Document 30 the interaction between various metal ions and nucleic acids has been studied for a long time.
- copper monovalent ions and nucleic acids it is known that copper contained in a small amount in cell nuclei stabilizes the nucleic acid structure while damaging DNA in the presence of hydrogen peroxide.
- Non-Patent Document 30 it is reported that the absorption spectrum of DNA changes by interaction with copper (refer nonpatent literature 30, 31). Furthermore, it has also been reported that this change in absorption spectrum differs depending on the base sequence of DNA (specifically, polymer of GC pair and polymer of AT pair) (see Non-Patent Document 30).
- the present technology is mainly directed to providing a method capable of detecting a nucleic acid simply and not requiring complicated operations such as mixing or washing of a liquid, especially in a microscale channel or the like. To aim.
- the present technology provides a method of detecting a nucleic acid, which comprises a procedure of contacting a sample containing nucleic acid with copper, and a detection procedure of detecting fluorescence emitted from the sample.
- this nucleic acid detection method it is possible to simply detect the fluorescence derived from the complex of the nucleic acid and copper only by bringing the sample containing the nucleic acid into contact with the copper. Then, based on the detected intensity and / or spectrum of fluorescence, it is possible to obtain information on the concentration, distribution or shape of the nucleic acid contained in the sample.
- the intensity and spectrum of the fluorescence derived from the complex of nucleic acid and copper vary depending on the base sequence and length of the nucleic acid, and also vary depending on the presence or absence of a mismatch in double-stranded nucleic acid. Therefore, in this nucleic acid detection method, based on the intensity and / or spectrum of fluorescence detected in the detection procedure, the base sequence of the nucleic acid is analyzed, or the mismatch in the double strand formed by the nucleic acid is analyzed. be able to.
- the intensity of fluorescence derived from the complex of nucleic acid and copper is higher in uracil as compared to cytosine.
- bisulfate treatment selectively converts unmethylated cytosine in the nucleic acid contained in the sample to uracil, and the intensity and / or spectrum of fluorescence detected in the detection procedure accordingly.
- copper can be solid copper.
- the contact procedure is preferably a procedure in which a sample containing nucleic acid is contacted with copper in the presence of a salt.
- the detection procedure is preferably a procedure of detecting fluorescence emitted from the sample by irradiating the sample with light having a wavelength of 300 to 420 ⁇ m.
- the present technology also provides a method for optical observation of a sample, which includes a procedure of contacting a sample containing nucleic acid with copper and a detection procedure of detecting fluorescence emitted from the sample.
- the sample can be a cell.
- information on the distribution, position, number, size, shape, etc. of cell nuclei of cells can be obtained.
- the present technology also provides a phosphor consisting of a complex containing copper and a nucleic acid.
- fluorescent substance fluorescent substances having different spectra and intensities can be obtained by appropriately changing the base sequence and length of the nucleic acid in the complex.
- nucleic acid includes natural nucleic acids (DNA and RNA).
- nucleic acid widely includes artificial nucleic acids obtained by artificially modifying the chemical structure of ribose of natural nucleic acid or the chemical structure of phosphodiester bond.
- the artificial nucleic acid is not particularly limited, and examples thereof include peptide nucleic acid (PNA), phosphorothioate oligonucleotide (S-oligo), bridged nucleic acid (BNA) or locked nucleic acid (LNA).
- PNA peptide nucleic acid
- S-oligo phosphorothioate oligonucleotide
- BNA bridged nucleic acid
- LNA locked nucleic acid
- the present technology provides a method capable of detecting a nucleic acid simply and detecting a nucleic acid without requiring complicated operations such as mixing or washing of a liquid, especially in a microscale channel.
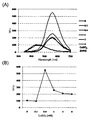
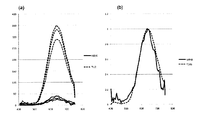
- the upper part shows the fluorescence spectrum with the RFU value (absolute value) on the vertical axis, the fluorescence spectrum with the RFU value (relative value) on the vertical axis and the absorption spectrum.
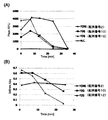
- It is a drawing-substituting graph showing the time-dependent change of the fluorescence spectrum and absorption spectrum acquired with oligo DNA of T (20), T (6), T (3) under the conditions of CuSO 4 concentration 0.4 mM and SA concentration 4 mM (( Example 1).
- A) shows the time-dependent change of peak RFU value
- (B) shows the time-dependent change of the light absorbency in wavelength 346 nm.
- ⁇ A> Nucleic Acid Detection Method The present inventor has newly found that a complex of a nucleic acid (DNA or RNA) and copper emits fluorescence as described in detail in the Examples. It was also found that the spectrum and intensity of fluorescence change depending on the base sequence and length of nucleic acid, and the spectrum and intensity of fluorescence change depending on the presence or absence of mismatch in double stranded nucleic acid. The present technology has been made based on these novel findings. As described above, conventionally, it has been known that the absorption spectrum of DNA changes due to the interaction with copper, and the change of this absorption spectrum differs depending on the base sequence of DNA. However, it has not been known that a complex of nucleic acid and copper emits fluorescence.
- the fluorescence emitted from the complex of nucleic acid and copper is similar to the fluorescence emitted from Cu-MT described above in the wavelength characteristics, but is observed in the reaction system using purified synthetic oligonucleotide which does not contain metallothionein, The fluorescence emitted by Cu-MT is completely different.
- the nucleic acid detection method according to the present technology, an application example thereof, and the phosphor according to the present technology will be specifically described.
- the nucleic acid detection method includes a procedure of bringing a sample containing nucleic acid into contact with copper, and a detection procedure of detecting fluorescence emitted from the sample.
- the base sequence of the nucleic acid is analyzed based on the intensity and / or spectrum of the fluorescence detected in the detection procedure, or a mismatch in the duplex formed by the nucleic acid Can be analyzed.
- Copper (Cu) The form of copper used in this procedure is preferably a solution containing copper or a solid containing copper. When simplicity of operation is required, it is preferable to use a solid.
- copper when nucleic acid detection is performed in a microscale flow path or the like provided in a microchip, by using a solid substance, copper can be embedded in the microchip, which is preferable in order to simplify the chip structure. Solids are more stable in shape and characteristics to vibration, shock, heat, light, time, etc. compared to solutions, less susceptible to chip manufacturing methods and storage conditions, and easy to handle It also has the advantage of being On the other hand, when shortening of reaction time is required, it may be preferable to use a solution.
- the form of copper can be appropriately selected according to the purpose.
- copper (I) ions When using copper in solution, it is preferable to use a sufficient amount of copper (I) ions in the solution. Copper ions generally exist stably in the state of divalent cations, and monovalent cations are unstable relative to divalent cations. For this reason, it is preferable to mix a reducing agent which reduces copper (II) ions to copper (I) ions, for example, to an aqueous solution containing divalent cations of copper such as a CuSO 4 aqueous solution. As the reducing agent, for example, sodium ascorbate can be used.
- solid copper solid copper
- an alloy containing copper can also be used.
- the shape is not particularly limited, and examples thereof include shapes such as powder, fine particles, rods, wires, plates, and foils.
- the shape and placement location of the solid copper is preferably configured so as not to block, reflect, etc. light detected in the detection procedure described later.
- a configuration in which a place where solid copper contacts the sample and a place where fluorescence emitted from the sample is measured is separated, and sample moving means capable of moving the sample between these two points is provided. It can also be done.
- the place where the fluorescence emitted from the sample is measured refers to the place where the fluorescence emitted from the sample is measured by irradiating the sample with light.
- the amount of copper contacted with the sample is not particularly limited as long as fluorescence from the sample is detected in the detection procedure.
- the amount of solid containing copper is the area of contact between the sample and the solid, the ratio of the area to the volume of the sample, the shape of the container for holding the sample, the copper contained in the solid It is appropriately set in accordance with the concentration and the type and amount of contaminants other than copper.
- the copper powder is preferably 37.5 milligrams or more with respect to 1 milliliter of the volume of the sample.
- nucleic acid any sample containing nucleic acid may be used as long as it can contain nucleic acid such as DNA or RNA.
- a nucleic acid extraction solution a solution containing a nucleic acid composition, a product of a nucleic acid amplification reaction such as PCR, an electrophoresis sample, etc. can be considered.
- reaction solution The contact of the sample with copper is preferably carried out in a reaction solution containing a salt.
- the type of salt is not particularly limited as long as the effect of the present technology is not impaired, and known salts can be freely selected and used. For example, one or more selected from sodium chloride (NaCl), potassium chloride (KCl), magnesium chloride (MgCl 2 ), etc. can be used freely (see Examples).
- the salt concentration is not particularly limited, and can be freely set as long as the effects of the present technology are not impaired.
- the salt concentration is preferably set to 0.025 M or more (see Examples).
- reaction solution does not contain a component such as a chelating agent that stabilizes a copper (II) ion (eg, EDTA, Tris, etc.).
- a component such as a chelating agent that stabilizes a copper (II) ion (eg, EDTA, Tris, etc.).
- the contact time of the sample and copper is not particularly limited, and can be freely set in accordance with the form of the sample and copper used.
- the contact time can be shortened by sufficiently stirring.
- the contact time can be shortened by devising the structure of the substrate or container to increase the contact area with the sample. .
- a light source of excitation light a mercury lamp, a halogen lamp, a xenon lamp, a laser, LED, sunlight etc. can be used, for example. It is also possible to provide a wavelength sorting means for selecting only the desired wavelength between the light source and the sample. In this case, examples of the wavelength selection means include an optical filter, a prism, a grating mirror and the like. Alternatively, if fluorescence emitted from a sample can be detected, energy transfer by, for example, FRET or BRET from adjacent molecules can be used instead of light irradiation.
- the excitation light preferably includes light of a wavelength of about 300 to 420 ⁇ m, and particularly preferably light of a wavelength of about 330 to 380 ⁇ m, in order to efficiently generate fluorescence from the sample. Furthermore, it is desirable that the excitation light has a sufficiently low intensity of light with a wavelength of about 420 ⁇ m or more, and that the intensity of light with a wavelength of about 500 nm or more is sufficiently low, so as not to interfere with fluorescence detection. desirable.
- the intensity of the excitation light is sufficient to detect the fluorescence emitted from the sample.
- the intensity of light necessary for detection includes the wavelength range of light to be irradiated, size, base sequence, higher order structure, amount and concentration of nucleic acid to be detected, signal amount to be acquired, wavelength range of light to be detected, detector It is preferable to set appropriately in accordance with the sensitivity, type, and configuration of the lens.
- the means for adjusting the intensity of the excitation light includes, for example, the type of light source and the intensity of light emitted from the light source, the configuration of focusing means such as a lens, the type and configuration of wavelength selecting means, the light intensity of an ND filter and an aperture It is possible to appropriately set the configuration of the optical system of light irradiation including the adjustment means and the like, and further, the density of the light to be irradiated, the irradiation range, the irradiation time, and the like.
- a light moving means constituted by an optical fiber, a mirror or the like.
- the container for holding the sample when light irradiation is performed it is preferable that the material and structure transmit a sufficient amount of irradiation light and fluorescence to be detected.
- Fluorescence detection Detection of fluorescence emitted from the sample is not particularly limited, and can be performed by a conventionally known means.
- a detection means for example, an element for converting an optical signal into an electrical signal, such as a photodetector, a photodiode, a photomultiplier, a CCD camera, or a CMOS camera, is used. Further, as the detection means, photographing using a film or the like, observation with the naked eye, etc. can be adopted.
- the fluorescence emitted from the sample can also be detected indirectly by inducing energy transfer such as FRET to fluorescent molecules in proximity to the sample and receiving the fluorescence emitted from the fluorescent molecules.
- a focusing means such as a lens between the sample and the detection means.
- a light transfer means constituted by an optical fiber, a mirror or the like.
- the fluorescence detection may be performed on the sample from the same direction as the light irradiation, or may be performed from a different direction.
- collection efficiency of the fluorescence emitted from the sample can be improved by providing light reflecting means such as a mirror surface in different directions. Even if the light irradiation and the fluorescence detection are in different directions, it is possible to provide light reflecting means of an arrangement and structure that does not interfere with the light detection, or the wavelength of the light to be irradiated is transmitted and the light to be detected is reflected.
- a light reflecting means such as a dichroic mirror having such wavelength selectivity can also be provided.
- light outside the detection target such as scattered light produced from light irradiated to the sample, autofluorescence from a container or the like holding the sample or the sample, leaked light produced from other sources, etc. May exist.
- the light sorting means include wavelength sorting means such as an optical filter, a prism, and a grating mirror.
- wavelength sorting means such as an optical filter, a prism, and a grating mirror.
- the light sorting means is preferably capable of sorting and detecting only fluorescence having a wavelength of about 420 nm or more according to the results of Examples described later, and capable of sorting and detecting only fluorescence having a wavelength of about 500 nm or more. Being particularly preferred.
- the nucleic acid detection method according to the present technology relatively long wavelength fluorescence with a center wavelength of about 600 nm is obtained for ultraviolet excitation with a wavelength of about 360 nm, and the stroke shift is long. Therefore, the nucleic acid detection method according to the present technology is also advantageous in that it is less susceptible to scattered light and autofluorescence emitted from other substances when detecting the target fluorescence.
- the light sorting means utilizing the property that fluorescence lifetime differs depending on each molecule, the time for performing fluorescence detection after light irradiation is appropriately set, light outside the detection target is excluded as much as possible, and necessary fluorescence is detected It is also possible to adopt a method of
- the wavelength of light to be irradiated to the sample is spatially or temporally changed and detected using wavelength selection means such as an optical filter, a prism, a grating mirror, etc. Measure spatial or temporal changes in fluorescence intensity.
- wavelength selection means such as an optical filter, a prism, a grating mirror, etc.
- the wavelength of the fluorescence emitted from the sample is spatially or temporally changed using the wavelength sorting means, and it is detected after being guided to the detection means Measure spatial or temporal changes in fluorescence intensity. Also, these methods can be combined to measure both the excitation spectrum and the emission spectrum.
- the wavelength selection means for spatially changing the wavelength of the light emitted to the sample or the fluorescence emitted from the sample for example, an optical system for changing the traveling direction of the light according to the wavelength of a prism or a grating mirror Elements can be used.
- the wavelength selection means for temporally changing the wavelength of the light emitted to the sample or the fluorescence emitted from the sample for example, the type of optical filter is switched or the wavelength of the electrically transmitted light is controlled Switching of the transmitted light wavelength by an optical filter that can be employed is employed.
- the light direction sorting means can be configured by appropriately combining optical elements such as a slit, a lens, a mirror, and an optical fiber.
- the wavelength of the light selected by the wavelength selection means is controlled by a computer and the photodetection means is used as a photodetection means.
- the measurement result is read into a computer using an element such as a detector that converts an optical signal into an electric signal, and the relationship between the wavelength of the irradiated light and the measured fluorescence intensity is correlated and recorded on the computer. preferable.
- the light detection means In the method of detecting the excitation and / or emission spectrum by spatially changing the wavelength of light by the wavelength selection means, as the light detection means, one in which light receiving elements are arrayed in a one-dimensional direction, a CCD, or It is possible to use one in which a light receiving element such as CMOS or the like is disposed on the surface.
- Detection of spatial distribution of fluorescence When obtaining information such as spatial distribution or shape of nucleic acid contained in a sample, light irradiation and fluorescence detection are collectively performed on a region having a certain spread, and at one time There are conceivable ways of obtaining spatial information. As another method, a method may be considered in which spatial information is obtained by changing a site to be detected with time and sequentially scanning the inside of a region having a predetermined spread.
- the light be irradiated over the entire area to be detected, and it is further preferable that the intensity of the light irradiated over the entire area be uniform.
- the light detection means in addition to observation using a naked eye or a film, it is also possible to use a light detection means such as a CCD camera CMOS camera in which light receiving elements for converting light signals into electric signals are two-dimensionally arrayed.
- the irradiation position of the laser light is temporally changed by a galvano mirror etc., and fluorescence emitted from the irradiation position of the laser is detected.
- spatial distribution of the fluorescence intensity is performed by controlling the light irradiation position by the galvano mirror or the like and recording the position with a computer and correlating the detected fluorescence intensity with the light irradiation position at that point in the computer. It is desirable to analyze automatically.
- one-dimensional distribution of fluorescence distribution is measured using a light source for irradiating light linearly and a light detection means in which light receiving elements such as a line sensor are arranged in a one-dimensional direction, and this position is sequentially
- a method of obtaining spatial distribution information by moving is a method of obtaining spatial distribution information by moving.
- a light receiving element such as a CCD camera or a CMOS camera capable of acquiring the spatial distribution of fluorescence intensity at one time, and further moving the spatial region to be observed further sequentially, the spatial distribution of fluorescence intensity in a wider region is obtained. You can also get it.
- the information on the fluorescence is specifically the intensity and / or spectrum (excitation spectrum or emission spectrum) of the fluorescence, and in addition, the fluorescence lifetime, the spatial distribution of the fluorescence and the time change, etc. may be mentioned. These pieces of information can be quantified, and for example, can be recorded on a computer, or can be subjected to calculation processing for analysis on a computer.
- the fluorescence intensity obtained in the detection procedure depends on the concentration, type, size, higher order structure, base sequence and the like of the nucleic acid as well as the reaction conditions and the optical system (see Examples).
- the reaction conditions, the entire optical system, the type, size, higher order structure, and base sequence of the nucleic acid are constant, information on the concentration of the nucleic acid can be obtained from the measurement results of the fluorescence intensity.
- information on the relationship between the concentration and the fluorescence intensity is obtained in advance using a nucleic acid to be detected whose concentration is known, and preferably the fluorescence intensity is measured for two or more nucleic acid concentrations.
- a calibration curve can be created, and the fluorescence intensity obtained as a result of detection can be applied to the relationship between the concentration and the intensity to calculate the nucleic acid concentration. Furthermore, it is also possible to automatically perform this work by recording the relationship between the nucleic acid concentration and the fluorescence intensity in advance on a computer and performing the process of calculating the nucleic acid concentration from the fluorescence intensity on a computer.
- the spectrum and intensity of the fluorescence obtained in the detection procedure depend on the base sequence and higher-order structure of the nucleic acid, in particular if the concentration, reaction conditions, optical system, etc. are constant (see Examples).
- the higher-order structure refers to a single-stranded structure or double-stranded structure of nucleic acid, presence or absence and position of double-strand formation by hybridization, presence or absence of mismatch in double-strand, and the like. Using this property, it is possible to obtain information on the base sequence and higher order structure of nucleic acid from the measurement results of fluorescence spectrum and intensity.
- the sequence and higher-order structure of the nucleic acid contained in the sample are any of a finite number of candidates known in advance
- the spectrum of fluorescence of the candidates in advance And by measuring the intensity and comparing with these measurement results, it is possible to estimate the sequence and higher-order structure of the nucleic acid contained in the sample subjected to fluorescence detection.
- a method of comparing two or more spectra there is, for example, a method of calculating a characteristic quantity, for example, a maximum fluorescence wavelength and its intensity, a ratio of fluorescence intensities in two or more wavelength regions, etc., and comparing those values.
- the similarity can be quantified by calculating differences between two spectra to be compared.
- the relationship between the sequence and higher-order structure of nucleic acid, and the relationship between the spectrum and intensity of fluorescence are recorded in advance on a computer, and the information on the nucleic acid sequence and higher-order is derived from the measured fluorescence spectrum and intensity information. It is also possible to automatically perform this work by performing the process of estimating the structure on a computer.
- the space can be visually confirmed to observe its features or perform qualitative classification.
- the fluorescent image can be captured on a computer and subjected to quantitative analysis by image processing.
- image processing for example, extraction of a region emitting fluorescence by binarization processing is performed, and the area and length of the region, circularity, positions such as the center and the center of gravity, and the like Numerical values such as the sum, average value, median value, variance, standard deviation, etc. of the fluorescence intensity at can be calculated.
- pattern matching, a learning algorithm or the like it is possible to identify a region of a specific shape or to classify the shape.
- the nucleic acid detection method according to the present technology can be used in various fields by combining the above-described contact procedure and fluorescence procedure, as needed, with analysis of a base sequence.
- application examples of the nucleic acid detection method according to the present technology will be described.
- SNPs single nucleotide polymorphisms
- analyzing the nucleotide sequence of nucleic acid is very useful in the diagnosis of diseases and the like. It is known that analyzing SNPs can diagnose the risk for various diseases such as heart disease.
- the method of limiting the range of the nucleic acid to be detected there is a method of taking out only the portion containing the sequence to be analyzed from the nucleic acid contained in the sample.
- a method by hybridization using probe DNA immobilized on a substrate, beads or the like, a method by electrophoresis, a method of amplifying only a target sequence using a nucleic acid amplification technique such as PCR, etc. may be mentioned.
- a second example is a method of selectively acquiring a signal from only a specific base among nucleic acids contained in a sample.
- a method using the phenomenon found in the present technology which is a phenomenon in which particularly strong fluorescence is detected from a thymine (T) sequence not forming a complementary strand.
- T thymine
- this method among the nucleic acids contained in the sample, at least one probe nucleic acid that hybridizes with a sequence other than the site where mutation detection is desired to form double-stranded nucleic acid is prepared in advance. What hybridized the nucleic acid which wants to detect the mutation of gene sequence is used as a sample.
- T is arranged in the sequence of the probe corresponding to the site.
- a base other than A is placed in the sequence of the probe corresponding to the site.
- the probe nucleic acid can be composed of, for example, DNA, RNA, peptide nucleic acid (PNA), phosphorothioate oligonucleotide, BNA (LNA) or the like.
- PNA peptide nucleic acid
- LNA BNA
- a third example is a method of limiting a physical region to be subjected to light irradiation or fluorescence detection in a detection procedure.
- a method in which light irradiation is performed only to a particularly limited specific area such as using near-field light such as evanescent light as light to be irradiated to a sample.
- This method can be further combined with means for holding or moving the nucleic acid at a specific position.
- a means for holding or moving a nucleic acid at a specific position for example, in addition to immobilizing on a solid surface, passing through a very fine channel such as nanopore or moving in a protein such as an enzyme can be mentioned. .
- a method utilizing energy transfer such as FRET or BRET can be mentioned.
- FRET energy transfer
- a molecule that induces FRET or BRET is disposed in the vicinity of a region to be detected, and local light irradiation can be performed by energy transfer from the molecule.
- fluorescence detection a fluorescent molecule capable of inducing FRET upon receiving energy of fluorescent light emitted from a sample is disposed in the vicinity of a region to be detected, and local fluorescent light is detected by detecting the fluorescence generated from the fluorescent molecule. It can be detected.
- cytosine (C) is known to be methylated in the genome of cells.
- the presence or absence of methylation of cytosine (C) can be detected by whether or not uracil (U) is substituted in the bisulfate reaction. That is, by bisulfite (bisulfite) treatment of nucleic acid under appropriate conditions, only unmethylated cytosine (C) can be selectively converted to uracil (U). Therefore, detection of uracil (U) can detect the presence of unmethylated cytosine.
- the fluorescence derived from the complex of nucleic acid and copper is high in uracil and thymine, and is not detected in cytosine and methylated cytosine (see Examples). Therefore, by selectively converting unmethylated cytosine in the nucleic acid contained in the sample to uracil by bisulfate treatment and examining the amount of change in the intensity and / or spectrum of fluorescence detected in the sample accordingly, The presence and amount of methylation or demethylation of cytosine in the nucleic acid can be analyzed.
- methylation analysis can be performed according to the following procedure. First, a sample containing nucleic acid is bisulfated according to a conventionally known method. Next, detection of the fluorescence intensity and / or spectrum is performed from the sample before bisulfate treatment and the sample after treatment. Then, the intensities and / or spectra of fluorescence detected from the sample before and after bisulfate treatment are compared. The greater the amount of unmethylated cytosine, the greater the amount of uracil produced by the bisulfate treatment, so by comparing the fluorescence of the sample before and after the bisulfate treatment, the cytosine methylation or demethylation in the nucleic acid You can get information about presence and quantity.
- the thymine-derived fluorescence may become noise and the signal-to-noise ratio of the fluorescence from uracil may be reduced.
- a method of amplifying or concentrating a region to be subjected to methylation analysis for nucleic acid contained in a sample after bisulfate treatment Specifically, a nucleic acid amplification method such as PCR or a nucleic acid concentration method using a nucleic acid hybridization reaction is used.
- the fluorescence derived from the complex of nucleic acid and copper is high in intensity with thymine in single-stranded DNA, and greatly suppressed in thymine in double-stranded DNA (see Examples). Therefore, complementary to the region not to be analyzed is caused by hybridizing the mask nucleic acid strand having the base sequence and suppressing the fluorescence from thymine present in the region not to be analyzed, from the region to be analyzed It becomes possible to detect fluorescence highly efficiently.
- a method of suppressing fluorescence generated from a region not to be analyzed using a quencher can also be adopted.
- the fluorescence derived from the complex of nucleic acid and copper can be suppressed by affixing a quencher (see Examples). Therefore, by arranging the quencher in a region not to be analyzed, it is possible to detect fluorescence from the region to be analyzed with high efficiency.
- a donor probe capable of causing fluorescence by exciting a complex of nucleic acid and copper is disposed adjacent to a region to be analyzed, and analysis is performed using energy transfer such as FRET or BRET. Selectively excite only the region of interest. By this, only fluorescence can be detected from the analysis target area.
- an acceptor probe which is excited by energy transfer of fluorescence from a complex of a nucleic acid and copper and emits fluorescence of a different wavelength is disposed adjacent to the analysis target region, and the analysis target region is detected by fluorescence detection of the acceptor probe.
- the fluorescence may be detected from The methods described above can be used in any combination.
- the nucleic acid detection method according to the present technology is performed on a sample containing nucleated cells, the spatial distribution of nucleic acid is detected, and the distribution and shape thereof are analyzed to analyze tissue slices, cells, etc. It is possible to obtain information on the distribution, position, number, size, shape, etc. of cell nuclei contained in.
- P. falciparum, P. vivax, P. falciparum, Ogata malaria parasite, etc. are known as a type of malaria parasite known as a parasite that causes a medical condition of malaria. .
- a ring form, a trophozoite, a schizont, a gametocyte and the like are known. Proper identification of these types is very important for proper treatment of infected patients.
- a simple method of detecting a gene or an antigen also exists as a means of discriminating the type of malarial parasite, but conventionally, it has been practiced to observe the shape of the nucleus by Giemsa staining in principle.
- this method has problems such as being prone to misdiagnosis when staining is insufficient.
- the nucleic acid detection method according to the present technology is applied to the means for discriminating the type of malaria parasite, conventional staining reagents are not required, so that the staining operation is simple and the cleaning operation is not necessary. It is possible to make a diagnosis of malaria etc.
- a liquid sample containing microparticles such as cells and beads is used to detect nucleic acid encapsulated or immobilized in the particles such as cells or beads
- the particles are in a stationary state. Although it may be, it may be in a state of flowing in the microchannel.
- a liquid sample can be introduced into a flow cell together with a sheath flow, and the liquid sample can be sandwiched by the sheath flow to form a laminar flow, and fluorescence emitted by particles flowing through the flow cell can be detected.
- a flow cell structure one that has been widely researched, developed, and put in practical use as a flow cytometry technique can be used.
- the nucleic acid detection method according to the present technology can be incorporated into Lab-On-Chip, which performs sample processing, detection, etc. in a container such as a microchannel chip. It is. In this case, the convenience can be further enhanced by introducing and combining sample pretreatment steps according to the purpose of use in the container.
- sample pretreatment steps for nucleic acid detection and sequence analysis include nucleic acid extraction, separation, amplification and the like. More specifically, separation by electrophoresis, gel filtration column, adsorption column, etc., amplification by PCR reaction, etc. may be mentioned. The incorporation of these means into the microchip can be performed by known techniques.
- a sample pretreatment step for observation detection, analysis and the like of nuclei contained in cells
- sorting and concentration of specific cells can be mentioned.
- methods utilizing properties which differ depending on the type of cells, such as size, specific gravity, robustness, binding ability to specific substances such as antibodies, etc. can be employed.
- an antibody that specifically binds to a cell to be observed or a cell to be excluded from observation is immobilized on the inner surface of a container or on a bead, and cells are sorted or concentrated using the presence or absence of binding to the antibody. can do.
- a magnetic particle in which an antibody is immobilized it is possible to prepare a magnetic particle in which an antibody is immobilized, and use magnetism to sort only cells to which the magnetic particle is bound or only cells to which the magnetic particle is not bound. is there.
- by placing the sample under conditions such as appropriate osmotic pressure change, acid, alkali, etc. only red blood cells can be destroyed and removed, and only white blood cells can be sorted.
- red blood cells infected with malaria parasites have long been known to form a magnetic substance called hemozoin in the red blood cells. It is possible to magnetically separate and concentrate such red blood cells. By combining this method with the nucleic acid detection method according to the present technology, malaria parasites can be observed easily and reliably.
- dyes that fluoresce various colors such as fluorescein and phycoerythrin are used. These fluorescent dyes obtain information on the localization of the biomolecule to which the dye is bound, and for example, by binding the dye to an antibody, a nucleic acid probe or the like, information on the location or amount of the target molecule that the antibody or nucleic acid probe identifies Used as a tool to obtain If a large number of fluorescent dye colors can be prepared, analysis can be performed on more target molecules.
- the complex of nucleic acid and copper emits different spectra and different intensities of fluorescence depending on the base sequence and length of the nucleic acid.
- the complex can be used as a phosphor emitting various spectra, for example, as a fluorescent dye labeled to an antibody.
- the nucleic acid detection method can also be configured as follows.
- a method for detecting a nucleic acid comprising the steps of: contacting a sample containing nucleic acid with copper; and detecting the fluorescence emitted from the sample.
- Example 1 when nucleic acid is mixed in a solution in which Cu (I) ions are generated by reducing Cu (II) ions with ascorbic acid, orange fluorescence is generated against ultraviolet irradiation under certain conditions. Was shown to be emitted.
- NanoDrop 3300 (Thermo Fisher Scientific, Inc., Waltham, Mass., USA) or F-4500 spectrofluorimeter (Hitachi High-Technologies Corporation) was used.
- a UV LED light source was used as the excitation light of the NanoDrop 3300, and the fluorescence spectrum when excited with the excitation light was measured.
- the relative fluorescence units (RFU) at the wavelength at which the spectral intensity is maximum were obtained as peak RFU values.
- F-4500 spectrofluorometer a quartz capillary manufactured by Helix Biomedical Accessories, Inc. and a dedicated adapter cell were used. In the following, NanoDrop 3300 was used unless otherwise noted.
- Absorbance meter The absorption spectrum was measured using a NanoDrop 1000 Spectrophotometer. Sample preparation and fluorescence measurement: sodium chloride (250 mM), CuSO 4 (0-4 mM), SA (4, 50 mM), ssDNA (1 mg / ml) or oligo DNA (50, 250, 500 ⁇ M) in 50 mM HEPPSO buffer Mix to make 20 ⁇ l of sample. It is known that SA has the function of reducing Cu (II) ions generated from CuSO 4 into Cu (I) ions in a mixed solution (see Non-Patent Document 31).
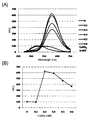
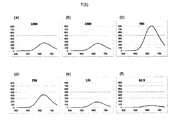
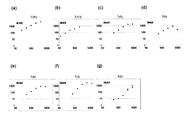
- FIG. 3 shows the results of oligo DNAs consisting of the nucleotide sequences set forth in SEQ ID NOS: 1-6.
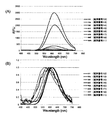
- the horizontal axis indicates the wavelength
- the vertical axis of (A) indicates the RFU value at each wavelength
- the vertical axis of (B) indicates the RFU value at each wavelength divided by the maximum value of RFU.
- T (20) shows the result (A) of the oligo DNA consisting of the nucleotide sequence of SEQ ID NO: 2 (hereinafter referred to as T (20)), the oligo DNA consisting of the nucleotide sequence of SEQ ID NO: 10 (T (6) B) results of oligo DNA (T (3)) consisting of the nucleotide sequence of SEQ ID NO: 12 (C), of oligo DNA (A (3)) consisting of the nucleotide sequence of SEQ ID NO: 11
- T (20) shows the result (A) of the oligo DNA consisting of the nucleotide sequence of SEQ ID NO: 2 (hereinafter referred to as T (20)), the oligo DNA consisting of the nucleotide sequence of SEQ ID NO: 10 (T (6) B) results of oligo DNA (T (3)) consisting of the nucleotide sequence of SEQ ID NO: 12 (C), of oligo DNA (A (3)) consisting of the nucleotide sequence of SEQ
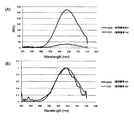
- FIG. 5 shows the fluorescence spectrum with the RFU value (absolute value) on the vertical axis, the fluorescence spectrum with the RFU value (relative value) on the vertical axis and the absorption spectrum.
- FIG. 6 shows the time-dependent change (A) of the peak RFU value and the time-dependent change (B) of the absorbance at a wavelength of 346 nm.
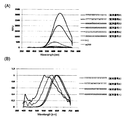
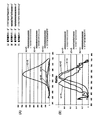
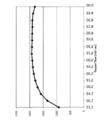
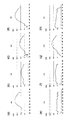
- FIG. 8 shows an excitation spectrum (broken line) and a fluorescence spectrum (solid line) of each oligo DNA. The spectrum was measured at 1 nm intervals for the fluorescence wavelength and at 2 nm intervals for the excitation wavelength.
- FIG. 9 The horizontal axis of FIG. 9 represents the wavelength
- the vertical axis of (A) represents the RFU value at each wavelength measured by Nanodrop
- the vertical axis of (B) represents the RFU value at each wavelength divided by the maximum value of RFU
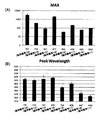
- FIG. 10 shows the average value and the standard error obtained by measuring the maximum value and peak wavelength of RFU three times.
- the result of the same measurement performed on the oligo DNA consisting of the sequence described in SEQ ID NO: 19 and SEQ ID NO: 20 is shown in FIG.
- the fluorescence intensity is weak compared to the oligo DNA consisting of the sequence described in SEQ ID NO: 19 containing only thymine (T), It was confirmed to emit fluorescence of similar spectral shape and peak position.
- the fluorescence was confirmed from oligo DNA containing at least thymine (T), adenine (A) or uracil (U).
- T thymine
- A adenine
- U uracil
- fluorescence was observed from any sequence, and in the fluorescence intensity and spectrum, thymine (T) to It was shown that not only the amount of adenine (A) but also the position (sequence order) on their oligo DNA was affected.
- Example 2 shows that when an aqueous solution containing nucleic acid is brought into contact with solid copper, orange fluorescence similar to that observed in Example 1 is emitted under ultraviolet irradiation under constant conditions.
- Copper powder (Copper, Powder, -75um, 99.9% / Cat. No. 030-18352 / Wako Pure Chemical Industries, Ltd., Osaka, Japan) manufactured by Wako Pure Chemical Industries, Ltd. is used as copper to be brought into contact with nucleic acid It was.
- RNA Rat Brain Total RNA (Cat. No. 636622, Takara Bio Inc., Otsu, Japan) is used, and this is used as DEPC treated water (Cat. No. 312-90201 / Wako Pure Chemical Industries, Ltd., Dissolved in Japan) was used.
- PIPES, ACES, BES, TAPSO, HEPPSO, EPPS, TAPS, CAPS, TES, Tricine and POPSO were purchased from DOJINDO Laboratories (Kumamoto, Japan) and adjusted to pH according to the protocol provided by the manufacturer. .
- the other reagents were the same as in Example 1.
- the contact between the nucleic acid and copper was carried out by mixing various nucleic acids, salts and copper powder in a total solution of 40 microliters and stirring for 15 minutes.
- the amount of copper powder added was 375 mg to 1 ml of aqueous solution unless otherwise noted.
- the amount of salt was 500 mM sodium chloride (NaCl) unless otherwise noted.
- the sample was centrifuged to precipitate copper powder, and the fluorescence spectrum and intensity were measured on the supernatant. The measurement of the fluorescence spectrum and the intensity was performed in the same manner as in Example 1.
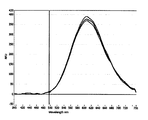
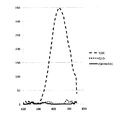
- FIG. 12 The result of performing fluorescence measurement three times on a reaction solution to which 1.5 mg / ml ssDNA was added is shown in FIG. 12 (horizontal axis: wavelength, vertical axis: RFU). As shown in the figure, when the sample containing nucleic acid was brought into contact with solid copper and then UV excited, fluorescence peaking around 600 nm from the sample could be detected.
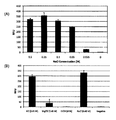
- FIG. (A) shows the intensity of fluorescence detected in a reaction solution to which sodium chloride (NaCl) at a concentration of 0.5, 0.25, 0.1, 0.05, 0.025, 0 M was added.
- (B) shows the intensity of fluorescence detected in a reaction solution to which 0.45 M sodium chloride (NaCl), 0.45 M potassium chloride (KCl), 0.45 M magnesium chloride (MgCl 2) and 45% ethanol (EtOH) were added.
- the fluorescence intensity shows the RFU at 604 nm, and the mean and standard error of the results of three measurements each are shown. As shown in the figure, the fluorescence intensity was dependent on sodium chloride concentration. Moreover, fluorescence was detected also when potassium chloride and magnesium chloride were made to coexist in addition to sodium chloride.
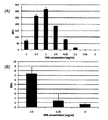
- FIG. 15 shows the results of comparison of fluorescence intensities detected when the concentration of nucleic acid added to the reaction solution is changed.
- A shows the intensity of fluorescence detected by adding ssDNA of 5, 2.5, 1, 0.5, 0.25, 0.1, 0.05, 0 mg / ml to the reaction solution.
- B shows the intensities of fluorescence detected by adding 2.5, 0.25, 0 mg / ml of RNA into the reaction solution.
- the horizontal axis shows nucleic acid concentration
- the vertical axis shows RFU at a fluorescence wavelength of 604 nm. The measurement was performed three times.
- the sodium chloride (NaCl) concentration was 0.25 M, and the amount of copper powder was 200 mg per 1 ml, and this condition was used in the following experiments unless otherwise specified. As shown in the figure, the fluorescence intensity was dependent on the DNA concentration and the RNA concentration.
- the vertical axis of (A) represents the RFU value measured by Nanodrop
- the vertical axis of (B) represents the RFU value at a relative value where the peak height is 1.
- the fluorescence intensity and the peak wavelength were influenced by the base sequence. In particular, it has been confirmed that when the proportion of thymine (T) is high, the fluorescence intensity is strong and the peak wavelength tends to be longer.
- FIG. 17 shows the result of measurement of a fluorescence spectrum (slit width 2.5 nm) at 400 nm to 700 nm when irradiated with excitation light of 360 nm (slit width 10 nm). Also in this case, it was confirmed that in the arrangement composed of a combination of thymine (T) and adenine (A), when the ratio of thymine (T) is high, the fluorescence intensity tends to be strong and the peak wavelength tends to be longer.
- T thymine
- A adenine
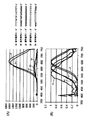
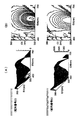
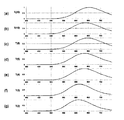
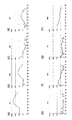
- FIG. 18 shows the results of measurement of an excitation-fluorescence spectrum by scanning excitation light at 330 nm to 390 nm (slit width 3 nm) and 400 nm to 700 nm (slit width 2.5 nm).
- (A) shows a three-dimensional display and
- (B) shows a contour display.
- the axis EX indicates the excitation wavelength (nm)
- the axis EM indicates the fluorescence wavelength (nm)
- the height direction indicates the fluorescence intensity. From these results, it was possible to read that the difference in the base sequence of DNA changes the spectrum and intensity of excitation and fluorescence.
- Both oligo DNAs were mixed at a final concentration of 0.5 mg / ml.
- the results are shown in FIG.
- the vertical axis of (A) indicates the RFU value measured by Nanodrop, and the vertical axis of (B) indicates the RFU value at a relative value where the peak height is 1.
- the horizontal axis shows the wavelength (nm).
- the fluorescence intensity is lower than that in the single-stranded, but strong fluorescence is confirmed in the double-stranded DNA in which a mismatch is inserted in thymine (T).
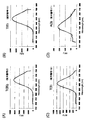
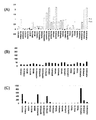
- FIG. 1 shows relative values of peak RFU values under each buffer condition in the sample (+) containing ssDNA and the sample ( ⁇ ) not containing nucleic acid.
- B shows relative values of peak RFU values under the same conditions in a sample containing oligo DNA consisting of the sequence shown in SEQ ID NO: 1.
- C shows relative values of peak RFU values under the same conditions in a sample containing oligo DNA consisting of the sequence shown in SEQ ID NO: 2.
- the concentration of each buffer was 50 mM, the final concentration of ssDNA was 0.5 mg / ml, and the final concentration of oligo DNA was 25 mM.
- the relative value of the peak RFU value represents a relative value with the peak RFU value measured under the condition that no buffer is included as 1.
- the fluorescence intensity was dependent on the type of buffer. In addition, almost no fluorescence was detected in the absence of nucleic acid in any of the buffers.
- the binding to the complementary sequence may be an inhibitory factor to the formation of a fluorophore due to the binding of the nucleic acid to copper.
- the increase in fluorescence intensity at the mismatch site was considered to be applicable to a method for detecting a mutation contained in the nucleotide sequence of a nucleic acid.
- fluorescence was observed in the buffers of PIPES, BES, HEPPSO, EPPS, TAPS, CAPS, TES, POPSO, especially strong in the PIPES, HEPPSO, EPPS, POPSO buffer Fluorescence was detected.
- the fluorescence could be observed in the pH range 7.0-10.5. It was found that the change in fluorescence intensity depending on the type of buffer and pH showed different patterns depending on the base sequence of the nucleic acid.
- Example 3 after the nucleic acid was brought into contact with copper sputtered on the glass surface, it was confirmed that the fluorescence could be detected, and the characteristics of the fluorescence were analyzed.
- the DNA used was ssDNA described in Example 1, and the RNA used was that described in Example 2.
- the copper sputtering on the glass surface was carried out using a UL-VAC, Inc. (Kanagawa, Tokyo) SH-350 and a Cu Target, 99.99% (Kojundo Chemical Laboratory Co., Ltd, Saitama, Japan). .
- the thickness of sputtering was 40 nm, and an appropriate sputtering time was determined based on the deposition rate measured in advance.
- As silver sputtered glass one manufactured by Kyodo International, Inc. (Kanagawa, Japan) was used.
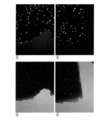
- the sample solution is placed on a copper or silver sputtered glass slide or an untreated glass slide, and gap cover glass made by Matsunami Glass Industry Co., Ltd. (Gap cover glass, 24 x 25 No. 4 / # CG 0002 4 / Matsunami) Covered Glass Ind., Ltd., Osaka, Japan). After standing for about 5 minutes, fluorescence was observed. An inverted microscope Ti-U (Nikon Co., Tokyo, Japan) manufactured by Nikon Corporation is used for observation, and a filter set UV-1A (Ex: 365/10, DM: 400, BA: 400) for fluorescence photography. / Nikon) was used. A digital CCD camera Retiga 2000R (QImaging, BC, Canada) and a 20x objective were used for taking and recording images.
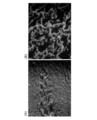
- FIG. 22A when a sample containing DNA was used, smooth fluorescence was observed from the entire imaging region.
- FIGS. 23A and 23B when a sample containing RNA was used, a distinctive pattern of fluorescence was observed spreading in a wavelike manner within the imaging region. The pattern unique to this RNA was expected to be caused by the fact that single-stranded RNAs hybridized to each other to form a higher-order structure.
- the fluorescence intensity in the imaging region was quantified.
- the image is divided into 9 as illustrated in FIG. 22B, and the area of the 1/9 section (indicated by symbol C in the drawing) of the central portion is the measurement range, and the average of the fluorescence intensity within the measurement range The value was calculated.
- arbitrary five places on a slide were image
- the mean and standard deviation were further calculated for the five mean values obtained.
- FIG. 1 The fluorescence intensities obtained when contacting a sample containing DNA or RNA with copper or silver sputtered on glass are shown in FIG.
- “DNA / Cu”, “RNA / Cu” and “( ⁇ ) / Cu” are samples containing 5 mg / ml DNA, 5 mg / ml RNA, and samples containing no nucleic acid, respectively. It is the result of measuring fluorescence intensity on glass.
- “DNA / Ag”, “RNA / Ag” and “( ⁇ ) / Ag” are fluorescence intensities on Ag sputtered glass for samples containing 5 mg / ml DNA, 5 mg / ml RNA and nucleic acid respectively The result of measuring Each sample contained 0.5 M NaCl.
- the exposure time was set to 1 second. The other exposure time was 5 seconds.
- the fluorescence intensity gradually increased in a few minutes after sample introduction and reached a maximum value in about 3 minutes.
- the fluorescence intensity gradually decreased for the first 50 seconds. This was considered to be due to fluorescence fading. In the next 50 seconds, the disappearance of fluorescence was observed at a rate distinctly different from fluorescence fading. After the heat block was removed and returned to room temperature conditions, the fluorescence gradually recovered. Furthermore, after 900 seconds, the fluorescence intensity returned to the level obtained by subtracting the fluorescence intensity of the fading from the original fluorescence intensity. From these results, it is shown that the fluorescence emitted from the nucleic acid in contact with copper is sensitive to heat, and the fluorescence disappears reversibly when the temperature rises.
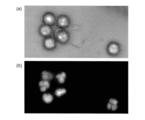
- Example 4 showed that fluorescence observation of cell nuclei was possible by introducing a sample containing cells on copper sputtered glass.
- IMMUNO-TROL Cells were washed with PBS, and the cells were pelleted with a centrifuge (1200 rpm, 5 min). Thereafter, the supernatant was discarded and the pellet was loosened, and the sample obtained by repeating the water hemolysis treatment twice was diluted in PBS to prepare a white blood cell sample.
- Water hemolysis treatment is carried out by thoroughly loosening the pellet obtained as a result of centrifugation, adding 9 ml of deionized water, inverting for 30 seconds, and mixing for 1 second, and further 1 ml of 10 ⁇ PBS Buffer (Nippon Gene Co., Ltd., The reaction was carried out by adding Tokyo, Japan), stirring well, and precipitating cells by centrifugation (1200 rpm, 5 min) and removing the supernatant.
- the white blood cell sample was spread on Cu sputtered glass, and a cover glass was placed from above to observe.
- Example 3 The same copper sputtered glass, cover glass and microscope as in Example 3 were used.
- the thickness of sputtering was 20, 40 or 100 nm. In the following experiments, the one with 40 nm was used unless otherwise noted.
- a sputtering process was performed in a state where a polyimide tape was attached to the surface of the slide glass except for a region of 5 mm around the central portion. Then, by removing the polyimide tape, a Cu sputtered glass in which a Cu layer was formed only in the central 5 mm square region was produced.
- excitation filter 365/10 nm
- dichroic mirror 400 nm
- fluorescence filter 590 LP
- a filter set UV-1A Example: 365/10, DM: 400, BA: 400 / Nikon
- FIG. 27 shows an image captured by fluorescence observation of onion thin skin on copper sputtered glass.
- (A) and (b) show the observation image on Cu sputtered glass
- (c) and (d) show the observation image on the slide glass which is not sputtered Cu.
- (a) and (c) are observed images of bright field
- (b) and (d) are fluorescence images. Note that (a) to (d) are images taken using a 10 ⁇ objective lens, and (e) is an image taken using a 40 ⁇ objective lens.
- FIG. (a) is an observation image of bright field
- (b) is a fluorescence image.
- An objective lens of 40 ⁇ was used.
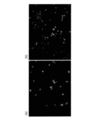
- FIG. 29 shows an image observed using Cu sputtered glass obtained by sputtering Cu only on a part of the slide glass surface.
- Jurkat cells a human leukocyte cell line
- a cover glass was placed from above, and observation was performed with a 20 ⁇ objective lens. Images were taken at the boundary between the Cu laminated region and the Cu non-laminated region of Cu sputtered glass.
- (A) and (c) are bright field observation images, and the black region occupying the majority in the image is a region through which light does not pass since the Cu layer is formed.
- (B) and (d) are fluorescence images.
- FIG. 30 shows the results of observation of Jurkat cells using Cu sputtered glass on which a Cu layer with a thickness of 20 nm (a) or 100 nm (b) is formed. The fluorescence from the cell nucleus was confirmed at any thickness.
- contact of the sample solution with air is considered to be a factor that inhibits the generation of fluorescence, and the nucleic acid detection method according to the present technology is, for example, a microchip It was considered preferable to operate in an environment where contact with air is limited.
- Example 5 under the same experimental conditions as in Example 1, it was confirmed that fluorescence was emitted even when using a 2-base oligo DNA.
- the fluorescence measurement experiment was performed using the same materials and methods as in Example 1 for seven types of oligo DNAs purchased from Invitrogen.
- the sequences of the oligo DNAs used were T (20) (SEQ ID NO: 1), T (10) (SEQ ID NO: 19), T (6) (SEQ ID NO: 10), T (5) (SEQ ID NO: 27), T ( 4) (SEQ ID NO: 28), T (3) (SEQ ID NO: 12), T (2) (SEQ ID NO: 29).
- the concentration of CuSO 4 was 0.4 mM
- the concentration of SA was 4 mM
- NanoDrop 3300 was used for measurement.
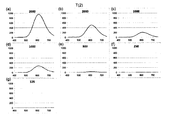
- the measurement result about T (20) is shown in FIG.
- the concentration of the oligo DNA is (a) 100 ⁇ M, (b) 50 ⁇ M, (c) 50 ⁇ M, (d) 25 ⁇ M, (e) 12.5 ⁇ M, (f) 6.25 ⁇ M.
- the horizontal axis represents wavelength (nm) and the vertical axis represents fluorescence intensity (RFU value).
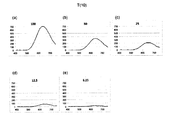
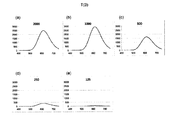
- 32 to 37 show the measurement results of each oligo DNA of T (10), T (6), T (5), T (4), T (3) and T (2).
- the numerical values shown in the graphs of each figure indicate the concentration conditions of oligo DNA.
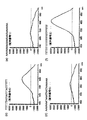
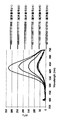
- FIG. 38 shows a fluorescence spectrum under the concentration condition in which the fluorescence intensity is highest for each oligo DNA.
- the horizontal axis shows the wavelength (nm), and the vertical axis shows the relative value of the fluorescence intensity (RFU value) (peak RFU value is 1).
- (a) T (20), (b) T (10), (c) T (6), (d) T (5), (e) T (4), (f) T (3) and (g) show the fluorescence spectrum of T (2).
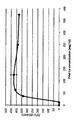
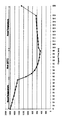
- concentration is shown in FIG. 39 about each oligo DNA.
- the horizontal axis shows the concentration ( ⁇ M) of oligo DNA, and the vertical axis shows the peak RFU value (log value).
- T (20), (b) T (10), (c) T (6), (d) T (5), (e) T (4), (f) T (3) and (g) show the results of T (2).
- Example 6 under the same experimental conditions as in Example 1, experiments were carried out using T and C, or an oligo DNA having a length of 3 bases consisting of T and G.
- oligo DNA purchased from Invitrogen, using the same materials and methods as in Example 1.
- the sequences of oligo DNAs used are TTT (SEQ ID NO: 12), TTC, TCT, CTT, TCC, CTC, CCT, CCT, CCC, TTG, TGT, GTT, TGG, GTG, GGT, GGG.
- the concentration of CuSO 4 was 0.4 mM
- the concentration of SA was 4 mM
- the concentration of oligo DNA was 0.5 mM
- NanoDrop 3300 was used for measurement.
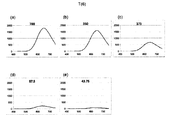
- FIG. 40 shows TTT (SEQ ID NO: 12), (b) TTC, (c) TCT, (d) CTT, (e) TCC, (f) CTC, (g) CCT, (h) shows the result of CCC.
- Figure 41 shows TTT (SEQ ID NO: 12), (b) TTG, (c) TGT, (d) GTT, (e) TGG, (f) GTG, (g) GGT, (h) shows the result of GGG.
- the horizontal axis indicates the wavelength (nm), and the vertical axis indicates the logarithmic value of the fluorescence intensity (RFU value).
- the fluorescence intensity was the highest at TTT, followed by CTT, CCT and TCT, and weak fluorescence was confirmed in TTC and CTC (see FIG. 40).
- TCC and CCC no fluorescence having a peak around 600 nm was observed.
- moderate intensity fluorescence was observed in TTG and weak fluorescence was observed in GTT, but in the other sequences, fluorescence having a peak around 600 nm was not observed ( See Figure 41).
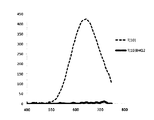
- Example 7 confirms that the fluorescence is quenched (quenched) by the quench dye.
- oligo DNA T (10) SEQ ID NO: 19
- T (10) BHQ2) modified with Black Hole Quencher-2 (BHQ2) at the 3 'end of the oligo DNA
- BHQ2 Black Hole Quencher-2
- BHQ 2 is a quencher known to absorb light of about 560 nm to about 650 nm particularly effectively.
- the fluorescence observed at T (10) was considered to be no longer observed at T (10) BHQ2 due to the effect of BHQ2. This result suggests that it is possible to combine fluorescence due to the action of copper with FRET.
- Example 8 the fluorescence intensity and spectral shape of thymine (T) and uracil (U) were compared again, and it was confirmed that the spectral shapes were identical while the intensities of both were different. Furthermore, the fluorescence of methylated cytosine (MeC) and inosine (I) was examined to reveal that both did not produce fluorescence.
- TeC methylated cytosine
- I inosine
- FIG. (a) is a graph in which the horizontal axis represents wavelength (nm) and the vertical axis represents fluorescence intensity (RFU), and (b) represents the average value of fluorescence intensity (RFU value) as a relative value (each oligo DNA The peak RFU value of is displayed in 1). It was confirmed that U (9) G emits fluorescence of similar spectral shape, although the intensity is inferior compared to T (10).
- T (10), C (10) and C (4) MeC (6) are shown in FIG.
- the horizontal axis represents wavelength (nm) and the vertical axis represents fluorescence intensity (RFU). Remarkable fluorescence was confirmed from T (10), but no fluorescence was confirmed for C (10) and C (4) MeC (6).
- the measurement results of T (10), A (10) and I (9) G are shown in FIG.
- the horizontal axis represents wavelength (nm) and the vertical axis represents fluorescence intensity (RFU). Remarkable fluorescence was confirmed from T (10) and weak fluorescence was confirmed from A (10), but no fluorescence was detected from I (9) G.
- ⁇ Discussion> The nucleic acid having a sequence consisting of uracil emitted a similar spectral shape of fluorescence although the intensity was inferior to the nucleic acid having a sequence consisting of thymine. This result is also confirmed in Example 1. In addition, it was confirmed that a nucleic acid having a sequence consisting of cytosine or a sequence consisting of cytosine and methylated cytosine does not emit fluorescence.
- uracil can be distinguished from cytosine and methylated cytosine by the detection of fluorescence using copper. This means that according to the nucleic acid detection method of the present invention, it is possible to detect substitution of cytosine (C) with uracil (U) by the bisulfate reaction, and analyze methylation of DNA molecules. was suggested.
- the present technology simply by contacting the sample with copper, the presence or absence and number of nucleic acids in the sample, and the base sequence thereof, and the shape, distribution, number, size, etc. of cell nuclei in the sample can be easily detected or measured. It is possible.
Abstract
[Problem] To provide a method capable of detecting a nucleic acid with which a nucleic acid can be simply detected particularly without requiring a complicated operation such as mixing of a liquid or washing in a microscale flow path or the like. [Solution] Provided is a method for detecting a nucleic acid, comprising a step of bringing a sample containing a nucleic acid into contact with copper and a step of detecting fluorescence emitted from the sample. According to the method for detecting a nucleic acid, merely by bringing a sample containing a nucleic acid into contact with copper, fluorescence derived from a complex between the nucleic acid and copper can be simply detected.
Description
本技術は、核酸の検出方法及びサンプルの光学観察方法並びに蛍光体に関する。より詳しくは、銅と接触した核酸が発する蛍光に基づいて核酸を検出する方法及びサンプルを観察する方法と、銅と核酸とを含んでなる蛍光体に関する。
The present technology relates to a method of detecting a nucleic acid, a method of optically observing a sample, and a fluorophore. More particularly, the present invention relates to a method for detecting a nucleic acid based on fluorescence emitted from a nucleic acid in contact with copper, a method for observing a sample, and a phosphor comprising copper and a nucleic acid.
近年、医療分野、創薬分野、臨床検査分野、食品分野、農業分野、工学分野、法医学分野、犯罪鑑識分野などの様々な分野で、核酸を用いた技術研究が広く進められている。最近では、核酸の染色、検出及び増幅などを、マイクロチップに設けたマイクロスケールの流路内で行うラボ・オン・チップの技術開発や実用化も進められている。
BACKGROUND ART In recent years, technical research using nucleic acids has been widely promoted in various fields such as medical field, drug discovery field, clinical examination field, food field, agriculture field, engineering field, forensic field, crime recognition field and the like. Recently, technological development and practical application of a lab-on-a-chip in which nucleic acid staining, detection, amplification and the like are performed in a microscale flow path provided in a microchip are being promoted.
核酸検出のために用いられる基本技術として、蛍光色素を用いて核酸を染色する方法がある。蛍光色素としては、hoechst33342、DAPI、エチジウムブロマイド、SYBR greenなど多くのものが知られている。例えば、hoechst33342及びDAPIは、フローサイトメトリーや顕微鏡などにおいて細胞や組織中の核酸を染色する目的で用いられている。また、エチジウムブロマイドは、電気泳動法において核酸分子を染色するために多用される。SYBR greenなどは、ポリメラーゼ・チェーン・リアクションなどの核酸増幅技術において、核酸の増幅過程をリアルタイムに検出する目的でも用いられる。
As a basic technique used for nucleic acid detection, there is a method of staining a nucleic acid using a fluorescent dye. Many fluorescent dyes are known such as hoechst 33342, DAPI, ethidium bromide, SYBR green and the like. For example, hoechst 33342 and DAPI are used for the purpose of staining nucleic acid in cells and tissues in flow cytometry, a microscope and the like. Also, ethidium bromide is frequently used to stain nucleic acid molecules in electrophoresis. SYBR green and the like are also used for detecting the amplification process of nucleic acid in real time in nucleic acid amplification techniques such as polymerase chain reaction.
本技術に関連して、蛍光観察の際に細胞が示す自家蛍光として、従来知られている蛍光について説明する。このような蛍光の一つに、銅の存在下においてUV照射された細胞が示すオレンジ色の自家蛍光がある。例えば、ショウジョウバエ幼虫中腸の特定部分の細胞が、銅を投与するとオレンジ色の蛍光を発することが報告されている(非特許文献1~8参照)。ショウジョウバエ幼虫中腸においてこのオレンジ色の蛍光が特に強く観察される細胞は、「copper cell」などと呼ばれている。投与する銅の濃度を高くすると、copper cellの周辺の細胞(非特許文献4)及び幼虫の体壁全体(非特許文献2)でも、蛍光が観察されることが報告されている。
In the context of the present technology, conventionally known fluorescence will be described as autofluorescence exhibited by cells in fluorescence observation. One such fluorescence is the orange autofluorescence of UV-irradiated cells in the presence of copper. For example, it has been reported that cells in a specific part of the Drosophila larval midgut emit orange fluorescence when copper is administered (see Non-Patent Documents 1 to 8). Cells in which this orange fluorescence is particularly strongly observed in the Drosophila larval midgut are called "copper cells" and the like. It has been reported that when the concentration of copper to be administered is increased, fluorescence is also observed in the cells around the copper cell (Non-patent Document 4) and the whole body wall of a larva (Non-patent document 2).
上記のオレンジ色の蛍光は、細胞内において、細胞質と細胞核の両方で観察され、特に細胞質の顆粒で顕著に検出されると記述されている(非特許文献2~4,7参照)。蛍光の波長範囲は590-630nmであり、ピーク波長は610nm、最大励起波長は340nmと記載されている(非特許文献3)。
The above orange fluorescence is observed in cells both in the cytoplasm and in the cell nucleus, and in particular, it is described that it is notably detected in cytoplasm granules (see Non-patent Documents 2 to 4 and 7). The wavelength range of fluorescence is 590-630 nm, the peak wavelength is 610 nm, and the maximum excitation wavelength is 340 nm (Non-patent Document 3).
また、ショウジョウバエ以外の生物種についても、同様な性質をもつ自家蛍光が観察されている。例えば、ラットの実験では、銅を与えた個体の肝臓において、UV励起(励起波長310nm)によってオレンジ色の蛍光(ピーク波長605nm)が見られることが報告されている(非特許文献9参照)。さらに、加齢に伴って腎臓及び肝臓に銅を蓄積するモデルラットの腎臓においても、類似の蛍光が観察されたことが報告されている(非特許文献10参照)。同様の性質をもつ自家蛍光は、酵母(非特許文献11参照)や、ヒトのWilson病患者の肝細胞(非特許文献12参照)においても報告されている。なお、Wilson病は、銅の排泄機能が不全となり、肝細胞内に銅が蓄積する遺伝性疾患である。
In addition, autofluorescence with similar properties is observed for species other than Drosophila. For example, in rat experiments, it has been reported that orange fluorescence (peak wavelength 605 nm) is observed by UV excitation (excitation wavelength 310 nm) in the liver of a copper-fed individual (see non-patent document 9). Furthermore, it has been reported that similar fluorescence was also observed in the kidneys of model rats that accumulate copper in the kidney and liver with age (see Non-patent Document 10). Autofluorescence with similar properties has also been reported in yeast (see non-patent document 11) and in hepatocytes of human Wilson disease patients (see non-patent document 12). Wilson's disease is a hereditary disease in which the excretion function of copper is impaired and copper accumulates in hepatocytes.
上記のオレンジ色の蛍光を発光する蛍光体としては、銅とmetallothionein (MT)との複合体(以下、「Cu-MT」と略記する)が推定されている(非特許文献14~23参照)。Cu-MTの波長特性は、非特許文献13では励起波長305nm、蛍光波長565nmとされ、非特許文献17では励起波長310nm、蛍光波長570nmとされている。また、Cu-MTにおいて銅は、一価イオン(Cu(I))の状態で存在していると考えられている(非特許文献13,15,17,19,23参照)。
A complex of copper and metallothionein (MT) (hereinafter abbreviated as “Cu-MT”) is presumed to be the above-mentioned orange fluorescent light-emitting phosphor (see Non-Patent Documents 14 to 23) . In the non-patent document 13, the wavelength characteristics of Cu-MT are an excitation wavelength of 305 nm and a fluorescence wavelength of 565 nm, and in the non-patent document 17, an excitation wavelength of 310 nm and a fluorescence wavelength of 570 nm. In Cu-MT, copper is considered to be present in the state of monovalent ions (Cu (I)) (see Non-Patent Documents 13, 15, 17, 19, and 23).
このような銅を含む蛍光体には、ピリミジン又はメルカプチドなどを含む化合物であって、ピリミジン又はメルカプチドが銅と作用することにより蛍光が発せられる化合物が広く報告されている(非特許文献24~29参照)。
Among such phosphors containing copper, compounds which include pyrimidine or mercaptide and the like, and which emit fluorescence when pyrimidine or mercaptide interacts with copper are widely reported (Non-patent Documents 24 to 29). reference).
一方、各種金属イオンと核酸との相互作用について、古くから研究がなされている。例えば、銅一価イオンと核酸との相互作用については、細胞核中に微量に含まれる銅が、核酸構造を安定化する一方、過酸化水素との共存下においてDNAにダメージを与えることが知られている(非特許文献30参照)。また、銅との相互作用により、DNAの吸収スペクトルが変化することが報告されている(非特許文献30,31参照)。さらに、この吸収スペクトルの変化が、DNAの塩基配列(具体的にはGCペアのポリマーとATペアのポリマー)に応じて異なることなども報告されている(非特許文献30参照)。
On the other hand, the interaction between various metal ions and nucleic acids has been studied for a long time. For example, with regard to the interaction between copper monovalent ions and nucleic acids, it is known that copper contained in a small amount in cell nuclei stabilizes the nucleic acid structure while damaging DNA in the presence of hydrogen peroxide. (See Non-Patent Document 30). Moreover, it is reported that the absorption spectrum of DNA changes by interaction with copper (refer nonpatent literature 30, 31). Furthermore, it has also been reported that this change in absorption spectrum differs depending on the base sequence of DNA (specifically, polymer of GC pair and polymer of AT pair) (see Non-Patent Document 30).
前述した既存の蛍光試薬を用いて核酸を染色する場合には、液状の試薬とサンプルを混合する必要があり、作業が煩雑になるという問題があった。特に、核酸の染色及び検出などをマイクロスケールの流路内で行うラボ・オン・チップにおいては、チップの製造や保存、使用時の作業が非常に煩雑になる。
When the nucleic acid is stained using the above-mentioned existing fluorescent reagent, it is necessary to mix the liquid reagent and the sample, and there is a problem that the operation becomes complicated. In particular, in a lab-on-a-chip in which nucleic acid staining, detection, and the like are performed in a microscale flow channel, operations for manufacturing, storing, and using the chip become very complicated.
そこで、本技術は、簡便に核酸を検出でき、特にマイクロスケールの流路内などにおいて液体の混合ないし洗浄などの煩雑な作業を必要とせずに核酸を検出可能な方法を提供することを主な目的とする。
Therefore, the present technology is mainly directed to providing a method capable of detecting a nucleic acid simply and not requiring complicated operations such as mixing or washing of a liquid, especially in a microscale channel or the like. To aim.
上記課題解決のため、本技術は、核酸を含むサンプルを銅と接触させる手順と、前記サンプルから発せられる蛍光を検出する検出手順と、を含む前記核酸の検出方法を提供する。この核酸検出方法によれば、核酸を含むサンプルと銅とを接触させるのみで、核酸と銅との複合体に由来する蛍光を簡便に検出できる。そして、検出された蛍光の強度及び/又はスペクトルに基づいて、サンプルに含まれる核酸の濃度、分布あるいは形状などに関する情報を得ることができる。
特に、核酸と銅との複合体に由来する蛍光の強度及びスペクトルは、核酸の塩基配列及び長さに依存して変化し、二本鎖核酸中のミスマッチの有無にも依存して変化する。このため、この核酸検出方法では、検出手順において検出された蛍光の強度及び/又はスペクトルに基づいて、核酸の塩基配列を解析したり、核酸が形成する二本鎖中のミスマッチを解析したりすることができる。
また、核酸と銅との複合体に由来する蛍光の強度は、シトシンに比してウラシルで高い。このため、この核酸検出方法では、バイサルフェート処理によってサンプルに含まれる核酸中の非メチル化シトシンを選択的にウラシルに変換し、これに伴って検出手順において検出される蛍光の強度及び/又はスペクトルの変化量を調べることで、核酸におけるシトシンのメチル化あるいは脱メチル化の有無及び量、並びに塩基配列中におけるメチル化シトシンあるいは脱メチル化シトシンの位置などを解析することができる。
この核酸検出方法において、銅は、固形の銅とすることができる。
この核酸検出方法において、接触手順は、塩の共存下で核酸を含むサンプルと銅とを接触させる手順とされることが好ましい。また、検出手順は、波長300~420μmの光を前記サンプルに照射することにより、該サンプルから発せられる蛍光を検出する手順とされることが好ましい。 In order to solve the above problems, the present technology provides a method of detecting a nucleic acid, which comprises a procedure of contacting a sample containing nucleic acid with copper, and a detection procedure of detecting fluorescence emitted from the sample. According to this nucleic acid detection method, it is possible to simply detect the fluorescence derived from the complex of the nucleic acid and copper only by bringing the sample containing the nucleic acid into contact with the copper. Then, based on the detected intensity and / or spectrum of fluorescence, it is possible to obtain information on the concentration, distribution or shape of the nucleic acid contained in the sample.
In particular, the intensity and spectrum of the fluorescence derived from the complex of nucleic acid and copper vary depending on the base sequence and length of the nucleic acid, and also vary depending on the presence or absence of a mismatch in double-stranded nucleic acid. Therefore, in this nucleic acid detection method, based on the intensity and / or spectrum of fluorescence detected in the detection procedure, the base sequence of the nucleic acid is analyzed, or the mismatch in the double strand formed by the nucleic acid is analyzed. be able to.
In addition, the intensity of fluorescence derived from the complex of nucleic acid and copper is higher in uracil as compared to cytosine. Therefore, in this nucleic acid detection method, bisulfate treatment selectively converts unmethylated cytosine in the nucleic acid contained in the sample to uracil, and the intensity and / or spectrum of fluorescence detected in the detection procedure accordingly. By examining the amount of change in, it is possible to analyze the presence or absence and amount of methylation or demethylation of cytosine in the nucleic acid, and the position of methylated cytosine or demethylated cytosine in the base sequence.
In this nucleic acid detection method, copper can be solid copper.
In this nucleic acid detection method, the contact procedure is preferably a procedure in which a sample containing nucleic acid is contacted with copper in the presence of a salt. The detection procedure is preferably a procedure of detecting fluorescence emitted from the sample by irradiating the sample with light having a wavelength of 300 to 420 μm.
また、本技術は、核酸を含むサンプルを銅と接触させる手順と、サンプルから発せられる蛍光を検出する検出手順と、を含むサンプルの光学観察方法を提供する。
この光学観察方法において、サンプルは細胞とすることができる。この場合、細胞の細胞核の分布、位置、数、大きさ、形状などに関する情報を得ることができる。 The present technology also provides a method for optical observation of a sample, which includes a procedure of contacting a sample containing nucleic acid with copper and a detection procedure of detecting fluorescence emitted from the sample.
In this optical observation method, the sample can be a cell. In this case, information on the distribution, position, number, size, shape, etc. of cell nuclei of cells can be obtained.
さらに、本技術は、銅と核酸とを含む複合体からなる蛍光体をも提供する。この蛍光体では、複合体中の核酸の塩基配列及び長さを適宜変更することで、スペクトルや強度が異なる蛍光体を得ることができる。
Furthermore, the present technology also provides a phosphor consisting of a complex containing copper and a nucleic acid. With this fluorescent substance, fluorescent substances having different spectra and intensities can be obtained by appropriately changing the base sequence and length of the nucleic acid in the complex.
本技術において、「核酸」には、天然の核酸(DNA及びRNA)が含まれる。また、「核酸」には、天然の核酸のリボースの化学構造又はホスホジエステル結合の化学構造を人為的に改変して得た人工核酸が広く包含される。人工核酸としては、特に限定されないが、例えばペプチド核酸(PNA)、ホスホロチオエート型オリゴヌクレオチド(S-oligo)、ブリッジド核酸(BNA)又はロックト核酸(LNA)などが挙げられる。
In the present technology, "nucleic acid" includes natural nucleic acids (DNA and RNA). In addition, “nucleic acid” widely includes artificial nucleic acids obtained by artificially modifying the chemical structure of ribose of natural nucleic acid or the chemical structure of phosphodiester bond. The artificial nucleic acid is not particularly limited, and examples thereof include peptide nucleic acid (PNA), phosphorothioate oligonucleotide (S-oligo), bridged nucleic acid (BNA) or locked nucleic acid (LNA).
本技術により、簡便に核酸を検出でき、特にマイクロスケールの流路内などにおいて液体の混合ないし洗浄などの煩雑な作業を必要とせずに核酸を検出可能な方法が提供される。
The present technology provides a method capable of detecting a nucleic acid simply and detecting a nucleic acid without requiring complicated operations such as mixing or washing of a liquid, especially in a microscale channel.
以下、本技術を実施するための好適な形態について詳細に説明する。以下に説明する実施形態は、本技術の代表的な実施形態の一例を示したものであり、これにより本技術の範囲が狭く解釈されることはない。なお、説明は以下の順序で行う。
〈A〉核酸検出方法
1.接触手順
(1)銅(Cu)
(2)サンプル
(3)反応溶液
(4)接触条件
2.検出手順
(1)光照射
(2)蛍光検出
(3)蛍光スペクトル検出
(4)蛍光の空間分布の検出
3.塩基配列の解析
4.応用例
(1)微細な遺伝子配列の違いの検出
(2)DNA分子のメチル化の解析
(3)細胞核の観察及び計測
(4)微小粒子の解析
(5)Lab-On-Chipへの適用
〈B〉蛍光色素 Hereinafter, preferred embodiments of the present technology will be described in detail. The embodiments described below show an example of a representative embodiment of the present technology, and the scope of the present technology is not narrowly interpreted. The description will be made in the following order.
<A> Nucleic acid detection method Contact procedure (1) Copper (Cu)
(2) Sample (3) Reaction solution (4)Contact condition 2. Detection procedure (1) light irradiation (2) fluorescence detection (3) fluorescence spectrum detection (4) detection of spatial distribution of fluorescence 3. Analysis of nucleotide sequence Application Examples (1) Detection of differences in minute gene sequences (2) Analysis of methylation of DNA molecules (3) Observation and measurement of cell nuclei (4) Analysis of microparticles (5) Application to Lab-On-Chip <B> Fluorescent dye
〈A〉核酸検出方法
1.接触手順
(1)銅(Cu)
(2)サンプル
(3)反応溶液
(4)接触条件
2.検出手順
(1)光照射
(2)蛍光検出
(3)蛍光スペクトル検出
(4)蛍光の空間分布の検出
3.塩基配列の解析
4.応用例
(1)微細な遺伝子配列の違いの検出
(2)DNA分子のメチル化の解析
(3)細胞核の観察及び計測
(4)微小粒子の解析
(5)Lab-On-Chipへの適用
〈B〉蛍光色素 Hereinafter, preferred embodiments of the present technology will be described in detail. The embodiments described below show an example of a representative embodiment of the present technology, and the scope of the present technology is not narrowly interpreted. The description will be made in the following order.
<A> Nucleic acid detection method Contact procedure (1) Copper (Cu)
(2) Sample (3) Reaction solution (4)
〈A〉核酸検出方法
本発明者は、実施例において詳しく後述するように、核酸(DNAもしくはRNA)と銅との複合体が蛍光を発することを新たに見出した。また、核酸の塩基配列及び長さに依存して蛍光のスペクトルや強度が変化すること、二本鎖核酸中のミスマッチの有無に依存して蛍光のスペクトルや強度が変化することを見出した。本技術は、これらの新規知見に基づきなされたものである。なお、前述したように、従来、銅との相互作用によりDNAの吸収スペクトルが変化することや、この吸収スペクトルの変化がDNAの塩基配列に応じて異なることが知られていた。しかしながら、核酸と銅との複合体が蛍光を発することはこれまで知られていなかった。また、核酸と銅との複合体が発する蛍光は、前述したCu-MTが発する蛍光と波長特性において類似したが、metallothioneinを含まない、精製合成オリゴヌクレオチドを用いた反応系においてみられることから、Cu-MTが発する蛍光とは全く異なるものである。以下、本技術に係る核酸検出方法とその応用例及び本技術に係る蛍光体について具体的に説明する。 <A> Nucleic Acid Detection Method The present inventor has newly found that a complex of a nucleic acid (DNA or RNA) and copper emits fluorescence as described in detail in the Examples. It was also found that the spectrum and intensity of fluorescence change depending on the base sequence and length of nucleic acid, and the spectrum and intensity of fluorescence change depending on the presence or absence of mismatch in double stranded nucleic acid. The present technology has been made based on these novel findings. As described above, conventionally, it has been known that the absorption spectrum of DNA changes due to the interaction with copper, and the change of this absorption spectrum differs depending on the base sequence of DNA. However, it has not been known that a complex of nucleic acid and copper emits fluorescence. Moreover, the fluorescence emitted from the complex of nucleic acid and copper is similar to the fluorescence emitted from Cu-MT described above in the wavelength characteristics, but is observed in the reaction system using purified synthetic oligonucleotide which does not contain metallothionein, The fluorescence emitted by Cu-MT is completely different. Hereinafter, the nucleic acid detection method according to the present technology, an application example thereof, and the phosphor according to the present technology will be specifically described.
本発明者は、実施例において詳しく後述するように、核酸(DNAもしくはRNA)と銅との複合体が蛍光を発することを新たに見出した。また、核酸の塩基配列及び長さに依存して蛍光のスペクトルや強度が変化すること、二本鎖核酸中のミスマッチの有無に依存して蛍光のスペクトルや強度が変化することを見出した。本技術は、これらの新規知見に基づきなされたものである。なお、前述したように、従来、銅との相互作用によりDNAの吸収スペクトルが変化することや、この吸収スペクトルの変化がDNAの塩基配列に応じて異なることが知られていた。しかしながら、核酸と銅との複合体が蛍光を発することはこれまで知られていなかった。また、核酸と銅との複合体が発する蛍光は、前述したCu-MTが発する蛍光と波長特性において類似したが、metallothioneinを含まない、精製合成オリゴヌクレオチドを用いた反応系においてみられることから、Cu-MTが発する蛍光とは全く異なるものである。以下、本技術に係る核酸検出方法とその応用例及び本技術に係る蛍光体について具体的に説明する。 <A> Nucleic Acid Detection Method The present inventor has newly found that a complex of a nucleic acid (DNA or RNA) and copper emits fluorescence as described in detail in the Examples. It was also found that the spectrum and intensity of fluorescence change depending on the base sequence and length of nucleic acid, and the spectrum and intensity of fluorescence change depending on the presence or absence of mismatch in double stranded nucleic acid. The present technology has been made based on these novel findings. As described above, conventionally, it has been known that the absorption spectrum of DNA changes due to the interaction with copper, and the change of this absorption spectrum differs depending on the base sequence of DNA. However, it has not been known that a complex of nucleic acid and copper emits fluorescence. Moreover, the fluorescence emitted from the complex of nucleic acid and copper is similar to the fluorescence emitted from Cu-MT described above in the wavelength characteristics, but is observed in the reaction system using purified synthetic oligonucleotide which does not contain metallothionein, The fluorescence emitted by Cu-MT is completely different. Hereinafter, the nucleic acid detection method according to the present technology, an application example thereof, and the phosphor according to the present technology will be specifically described.
本技術に係る核酸検出方法は、核酸を含むサンプルを銅と接触させる手順と、前記サンプルから発せられる蛍光を検出する検出手順と、を含む。本技術に係る核酸検出方法では、目的に応じて、検出手順において検出された蛍光の強度及び/又はスペクトルに基づいて、核酸の塩基配列を解析したり、核酸が形成する二本鎖中のミスマッチを解析したりすることができる。
The nucleic acid detection method according to the present technology includes a procedure of bringing a sample containing nucleic acid into contact with copper, and a detection procedure of detecting fluorescence emitted from the sample. In the nucleic acid detection method according to the present technology, depending on the purpose, the base sequence of the nucleic acid is analyzed based on the intensity and / or spectrum of the fluorescence detected in the detection procedure, or a mismatch in the duplex formed by the nucleic acid Can be analyzed.
1.接触手順
接触手順では、核酸を含むサンプルを銅と接触させる。 1. Contact Procedure In the contact procedure, a sample containing nucleic acid is contacted with copper.
接触手順では、核酸を含むサンプルを銅と接触させる。 1. Contact Procedure In the contact procedure, a sample containing nucleic acid is contacted with copper.
(1)銅(Cu)
本手順で用いる銅の形態は、銅を含む溶液か、もしくは銅を含む固形物が好ましい。操作の簡便性が求められる場合には、固形物を用いることが好ましい。また、マイクロチップに設けたマイクロスケールの流路内などで核酸検出を行う場合には、固形物を用いることで、マイクロチップへの銅の埋め込みが可能となり、チップ構造の簡素化のため好ましい。固形物は、溶液に比べて、形状や特性などが振動や衝撃、熱、光、時間経過などに対して安定的であり、チップの製造方法や保存条件などの影響を受け難く、取り扱いが容易である利点も有する。一方、反応時間の短縮化が必要な場合には、溶液を用いることが好ましい場合もある。銅の形態は、目的に応じて適宜選択することができる。 (1) Copper (Cu)
The form of copper used in this procedure is preferably a solution containing copper or a solid containing copper. When simplicity of operation is required, it is preferable to use a solid. In addition, when nucleic acid detection is performed in a microscale flow path or the like provided in a microchip, by using a solid substance, copper can be embedded in the microchip, which is preferable in order to simplify the chip structure. Solids are more stable in shape and characteristics to vibration, shock, heat, light, time, etc. compared to solutions, less susceptible to chip manufacturing methods and storage conditions, and easy to handle It also has the advantage of being On the other hand, when shortening of reaction time is required, it may be preferable to use a solution. The form of copper can be appropriately selected according to the purpose.
溶液状態の銅を用いる場合、十分量の銅(I)イオンが溶液中に存在した状態で用いることが好ましい。銅イオンは一般には二価陽イオンの状態において安定して存在し、一価陽イオンは二価陽イオンに比して不安定である。このため、例えばCuSO4水溶液など銅の二価陽イオンを含む水溶液に対し、銅(II)イオンを銅(I)イオンに還元する還元剤を混合することが好ましい。還元剤には、例えばアスコルビン酸ナトリウムを用いることができる。
When using copper in solution, it is preferable to use a sufficient amount of copper (I) ions in the solution. Copper ions generally exist stably in the state of divalent cations, and monovalent cations are unstable relative to divalent cations. For this reason, it is preferable to mix a reducing agent which reduces copper (II) ions to copper (I) ions, for example, to an aqueous solution containing divalent cations of copper such as a CuSO 4 aqueous solution. As the reducing agent, for example, sodium ascorbate can be used.
溶液中に十分量の銅(I)イオンを得るためのその他の方法としては、銅(II)イオンを含む水溶液に放射線を照射して銅(I)イオンを発生させる方法を例示することができる(非特許文献30参照)。あるいは、望ましくは無酸素条件下にて、acetonitrile及びnitrogen baseの等価物(2,6-lutidine, triethylamine, diisopropylethylamine, pyridineなど)を含む溶液に対して、CuI, CuOTf・C6H6, [Cu(NCCH3)4][PF6]などの塩を溶解することによって、銅(I)イオン溶液を得る方法も挙げられる(非特許文献31参照)。
As another method for obtaining a sufficient amount of copper (I) ions in the solution, a method of irradiating copper with an aqueous solution containing copper (II) ions to generate copper (I) ions can be exemplified. (Refer nonpatent literature 30). Alternatively, CuI, CuOTf · C 6 H 6 , [Cu to a solution containing an equivalent of acetonitrile and nitrogen base (2,6-lutidine, triethylamine, diisopropylethylamine, pyridine etc.), preferably under anoxic conditions, There is also a method of obtaining a copper (I) ion solution by dissolving a salt such as (NCCH 3 ) 4 ] [PF 6 ] (see Non-Patent Document 31).
固形状態の銅(固形銅)を用いる場合、純粋な銅のほか、銅を含む合金などを用いることもできる。形状は、特に限定されず、例えば、粉末や微粒子、ロッド、ワイヤ、板、ホイルなどの形状が挙げられる。また、サンプルを導入するマイクロチップの基板や容器などの表面(内面)に、スパッタリングや蒸着などの手段で銅を含む薄膜を形成することも可能である。
When solid copper (solid copper) is used, besides pure copper, an alloy containing copper can also be used. The shape is not particularly limited, and examples thereof include shapes such as powder, fine particles, rods, wires, plates, and foils. In addition, it is also possible to form a thin film containing copper on the surface (inner surface) of a substrate or container of a microchip into which a sample is introduced by means such as sputtering or evaporation.
固形銅の形状及び配置場所は、後述する検出手順において検出する光を遮断、反射等しないような構成とすることが好ましい。例えば、基板や容器などの内部あるいは表面の特定の領域にのみ固形銅を配置したり、検出に必要な十分量の光を透過しうる程度に十分に薄く調整したりする方法が挙げられる。また、例えば、固形銅とサンプルとが接触する場所と、サンプルから発せられる蛍光を計測する場所とが分かれており、それら2点間にてサンプルを移動させることのできるサンプル移動手段を兼ね備えた構成とすることもできる。ここで、サンプルが発する蛍光を計測する場所とは、サンプルに対して光を照射することにより、サンプルから発せられる蛍光を計測する場所を指す。
The shape and placement location of the solid copper is preferably configured so as not to block, reflect, etc. light detected in the detection procedure described later. For example, there is a method of disposing solid copper only in a specific region inside or on a surface of a substrate, a container or the like, or adjusting the thickness sufficiently thin enough to transmit a sufficient amount of light necessary for detection. Also, for example, a configuration in which a place where solid copper contacts the sample and a place where fluorescence emitted from the sample is measured is separated, and sample moving means capable of moving the sample between these two points is provided. It can also be done. Here, the place where the fluorescence emitted from the sample is measured refers to the place where the fluorescence emitted from the sample is measured by irradiating the sample with light.
サンプルと接触させる銅の量は、検出手順においてサンプルからの蛍光が検出される限り、特に限定されない。固形銅を用いる場合は、銅を含む固形物の量は、サンプルと固形物とが接触する面積、該面積のサンプルの容量に対する割合、サンプルを保持する容器の形状、固形物に含まれる銅の濃度及び銅以外の混入物の種類や量などに合わせて適宜設定される。例えば、実施例に挙げた銅粉末を用いる場合においては、サンプルの容量1ミリリットルに対して、銅粉末は37.5ミリグラム以上であることが好ましい。また、例えば、基板や容器などの表面(内面)に固形銅の薄膜を形成する場合において、二枚のガラス平板に挟まれた、深さが20マイクロメートル程度の空間にサンプルが保持される場合(実施例参照)には、空間を構成する面の少なくとも一面に厚さ20ナノメーター以上の銅をスパッタリングする。
The amount of copper contacted with the sample is not particularly limited as long as fluorescence from the sample is detected in the detection procedure. When solid copper is used, the amount of solid containing copper is the area of contact between the sample and the solid, the ratio of the area to the volume of the sample, the shape of the container for holding the sample, the copper contained in the solid It is appropriately set in accordance with the concentration and the type and amount of contaminants other than copper. For example, in the case of using the copper powder described in the examples, the copper powder is preferably 37.5 milligrams or more with respect to 1 milliliter of the volume of the sample. Also, for example, in the case of forming a thin film of solid copper on the surface (inner surface) of a substrate, a container, etc., when the sample is held in a space of about 20 micrometers in depth sandwiched between two glass flat plates In (see Example), copper having a thickness of 20 nm or more is sputtered on at least one side of a surface constituting a space.
(2)サンプル
核酸を含むサンプルとしては、DNAやRNAなどの核酸を含み得るサンプルであれば、いかなるものでもよい。例えば、核酸抽出溶液や、核酸合成物を含む溶液、PCRなどの核酸増幅反応の産物、電気泳動サンプルなどが考えられる。あるいは、核酸溶液サンプルに限らず、細胞自体、組織切片などの細胞を含むものなどをサンプルとして用いることがでる。 (2) Sample Any sample containing nucleic acid may be used as long as it can contain nucleic acid such as DNA or RNA. For example, a nucleic acid extraction solution, a solution containing a nucleic acid composition, a product of a nucleic acid amplification reaction such as PCR, an electrophoresis sample, etc. can be considered. Alternatively, not only the nucleic acid solution sample but cells themselves, those containing cells such as tissue sections can be used as samples.
核酸を含むサンプルとしては、DNAやRNAなどの核酸を含み得るサンプルであれば、いかなるものでもよい。例えば、核酸抽出溶液や、核酸合成物を含む溶液、PCRなどの核酸増幅反応の産物、電気泳動サンプルなどが考えられる。あるいは、核酸溶液サンプルに限らず、細胞自体、組織切片などの細胞を含むものなどをサンプルとして用いることがでる。 (2) Sample Any sample containing nucleic acid may be used as long as it can contain nucleic acid such as DNA or RNA. For example, a nucleic acid extraction solution, a solution containing a nucleic acid composition, a product of a nucleic acid amplification reaction such as PCR, an electrophoresis sample, etc. can be considered. Alternatively, not only the nucleic acid solution sample but cells themselves, those containing cells such as tissue sections can be used as samples.
(3)反応溶液
サンプルと銅との接触は、塩を含む反応溶液中で行うことが好ましい。塩の種類は、本技術の効果を損なわなければ特に限定されず、公知の塩を自由に選択して用いることができる。例えば、塩化ナトリウム(NaCl)、塩化カリウム(KCl)、塩化マグネシウム(MgCl2)などから1種又は2種以上自由に選択して用いることができる(実施例参照)。 (3) Reaction solution The contact of the sample with copper is preferably carried out in a reaction solution containing a salt. The type of salt is not particularly limited as long as the effect of the present technology is not impaired, and known salts can be freely selected and used. For example, one or more selected from sodium chloride (NaCl), potassium chloride (KCl), magnesium chloride (MgCl 2 ), etc. can be used freely (see Examples).
サンプルと銅との接触は、塩を含む反応溶液中で行うことが好ましい。塩の種類は、本技術の効果を損なわなければ特に限定されず、公知の塩を自由に選択して用いることができる。例えば、塩化ナトリウム(NaCl)、塩化カリウム(KCl)、塩化マグネシウム(MgCl2)などから1種又は2種以上自由に選択して用いることができる(実施例参照)。 (3) Reaction solution The contact of the sample with copper is preferably carried out in a reaction solution containing a salt. The type of salt is not particularly limited as long as the effect of the present technology is not impaired, and known salts can be freely selected and used. For example, one or more selected from sodium chloride (NaCl), potassium chloride (KCl), magnesium chloride (MgCl 2 ), etc. can be used freely (see Examples).
塩濃度は、特に限定されず、本技術の効果を損なわなければ自由に設定することができる。塩濃度は、0.025M以上に設定することが好ましい(実施例参照)。
The salt concentration is not particularly limited, and can be freely set as long as the effects of the present technology are not impaired. The salt concentration is preferably set to 0.025 M or more (see Examples).
また、反応溶液は、銅(II)イオンを安定化するキレート剤などの成分(例えば、EDTAやTrisなど)を含まないことが好ましい。
Furthermore, it is preferable that the reaction solution does not contain a component such as a chelating agent that stabilizes a copper (II) ion (eg, EDTA, Tris, etc.).
(4)接触条件
サンプルと銅との接触時間は、特に限定されず、用いるサンプルや銅の形態に合わせて自由に設定することができる。例えば、液状のサンプルと粉末銅を用いる場合には、十分に攪拌することで、接触時間を短縮することができる。また、銅を含む固形物の薄膜を形成した基板や容器などを用いる場合には、基板や容器の構造を工夫してサンプルとの接触面積を大きくすることで、接触時間を短縮することができる。また、サンプルと銅との接触の際には、反応液と酸素を含む空気との接触面積及び接触時間が極力限定されていることが望ましい。 (4) Contact conditions The contact time of the sample and copper is not particularly limited, and can be freely set in accordance with the form of the sample and copper used. For example, in the case of using a liquid sample and powdered copper, the contact time can be shortened by sufficiently stirring. In addition, in the case of using a substrate, a container, or the like on which a thin film of a solid substance containing copper is formed, the contact time can be shortened by devising the structure of the substrate or container to increase the contact area with the sample. . Further, in the case of contact between the sample and copper, it is desirable that the contact area and contact time between the reaction solution and the air containing oxygen be limited as much as possible.
サンプルと銅との接触時間は、特に限定されず、用いるサンプルや銅の形態に合わせて自由に設定することができる。例えば、液状のサンプルと粉末銅を用いる場合には、十分に攪拌することで、接触時間を短縮することができる。また、銅を含む固形物の薄膜を形成した基板や容器などを用いる場合には、基板や容器の構造を工夫してサンプルとの接触面積を大きくすることで、接触時間を短縮することができる。また、サンプルと銅との接触の際には、反応液と酸素を含む空気との接触面積及び接触時間が極力限定されていることが望ましい。 (4) Contact conditions The contact time of the sample and copper is not particularly limited, and can be freely set in accordance with the form of the sample and copper used. For example, in the case of using a liquid sample and powdered copper, the contact time can be shortened by sufficiently stirring. In addition, in the case of using a substrate, a container, or the like on which a thin film of a solid substance containing copper is formed, the contact time can be shortened by devising the structure of the substrate or container to increase the contact area with the sample. . Further, in the case of contact between the sample and copper, it is desirable that the contact area and contact time between the reaction solution and the air containing oxygen be limited as much as possible.
2.検出手順
検出手順では、接触手順後のサンプルから発せられる蛍光を検出する。 2. Detection Procedure In the detection procedure, the fluorescence emitted from the sample after the contact procedure is detected.
検出手順では、接触手順後のサンプルから発せられる蛍光を検出する。 2. Detection Procedure In the detection procedure, the fluorescence emitted from the sample after the contact procedure is detected.
(1)光照射
サンプルからの蛍光を検出するため、サンプルに対して照射される光(励起光)としては、核酸を含むサンプルと銅とを接触させた後に、サンプルから発せられる蛍光が検出できれば特に限定されない。 (1) Light irradiation As light (excitation light) irradiated to the sample in order to detect fluorescence from the sample, if light emitted from the sample can be detected after the sample containing nucleic acid is brought into contact with copper It is not particularly limited.
サンプルからの蛍光を検出するため、サンプルに対して照射される光(励起光)としては、核酸を含むサンプルと銅とを接触させた後に、サンプルから発せられる蛍光が検出できれば特に限定されない。 (1) Light irradiation As light (excitation light) irradiated to the sample in order to detect fluorescence from the sample, if light emitted from the sample can be detected after the sample containing nucleic acid is brought into contact with copper It is not particularly limited.
励起光の光源としては、例えば、水銀ランプ、ハロゲンランプ、キセノンランプ、レーザー、LED、太陽光などを用いることができる。また、光源とサンプルとの間に、望ましい波長のみを選択する波長選別手段を設置することも可能である。この場合、波長選別手段としては、例えば、光学フィルタ、プリズム、グレーティングミラーなどが挙げられる。あるいは、サンプルから発せられる蛍光が検出できれば、例えば近接する分子からのFRETやBRETなどによるエネルギー移動をもって、光照射の替わりとするともできる。
As a light source of excitation light, a mercury lamp, a halogen lamp, a xenon lamp, a laser, LED, sunlight etc. can be used, for example. It is also possible to provide a wavelength sorting means for selecting only the desired wavelength between the light source and the sample. In this case, examples of the wavelength selection means include an optical filter, a prism, a grating mirror and the like. Alternatively, if fluorescence emitted from a sample can be detected, energy transfer by, for example, FRET or BRET from adjacent molecules can be used instead of light irradiation.
励起光は、サンプルからの蛍光を効率よく発生させるため、300~420μm程度の波長の光を含むことが好ましく、330~380μm程度の波長の光を含むことが特に好ましい。また、蛍光検出の際の妨げとならないように、励起光は、波長が420μm程度以上の光の強度が十分に低いことが望ましく、波長が500nm程度以上の光の強度が十分に低いことが特に望ましい。
The excitation light preferably includes light of a wavelength of about 300 to 420 μm, and particularly preferably light of a wavelength of about 330 to 380 μm, in order to efficiently generate fluorescence from the sample. Furthermore, it is desirable that the excitation light has a sufficiently low intensity of light with a wavelength of about 420 μm or more, and that the intensity of light with a wavelength of about 500 nm or more is sufficiently low, so as not to interfere with fluorescence detection. desirable.
励起光の強度は、サンプルから発せられる蛍光を検出するのに十分な強度とされることが好ましい。検出に必要な光の強度は、照射する光の波長範囲、検出対象とする核酸の大きさ・塩基配列・高次構造・量及び濃度、取得したい信号量、検出する光の波長範囲、検出器の感度・種類及び構成などに合わせて適宜設定することが好ましい。励起光の強度を調整する手段としては、例えば、光源の種類及び光源から発せられる光の強度、レンズなどの集光手段の構成、波長選択手段の種類及び構成、NDフィルタ及び絞りなどの光強度調節手段などを含む光照射の光学系の構成、さらには照射する光の密度、照射範囲及び照射時間などを適宜設定することが挙げられる。
Preferably, the intensity of the excitation light is sufficient to detect the fluorescence emitted from the sample. The intensity of light necessary for detection includes the wavelength range of light to be irradiated, size, base sequence, higher order structure, amount and concentration of nucleic acid to be detected, signal amount to be acquired, wavelength range of light to be detected, detector It is preferable to set appropriately in accordance with the sensitivity, type, and configuration of the lens. The means for adjusting the intensity of the excitation light includes, for example, the type of light source and the intensity of light emitted from the light source, the configuration of focusing means such as a lens, the type and configuration of wavelength selecting means, the light intensity of an ND filter and an aperture It is possible to appropriately set the configuration of the optical system of light irradiation including the adjustment means and the like, and further, the density of the light to be irradiated, the irradiation range, the irradiation time, and the like.
励起光の光源とサンプルとの間には、光ファイバーやミラーなどによって構成される光移動手段が存在してもよい。光照射を行う際にサンプルを保持する容器については特に限定はされないが、十分量の照射光及び検出すべき蛍光を透過する材料及び構造であることが好ましい。
Between the light source of excitation light and the sample, there may be a light moving means constituted by an optical fiber, a mirror or the like. There is no particular limitation on the container for holding the sample when light irradiation is performed, but it is preferable that the material and structure transmit a sufficient amount of irradiation light and fluorescence to be detected.
(2)蛍光検出
サンプルから発せられる蛍光の検出は、特に限定されず、従来公知の手段によって行うことができる。検出手段としては、例えば、フォトディテクター、フォトダイオード、フォトマルチプライヤー、CCDカメラ、CMOSカメラなど、光信号を電気信号に変換する素子が用いられる。また、検出手段としては、フィルムなどを用いた撮影や、肉眼による観察なども採用できる。サンプルから発せられる蛍光は、サンプルに近接する蛍光分子に対するFRETなどのエネルギー移動を誘発し、蛍光分子から発せられる蛍光を受光することにより、間接的に検出することもできる。 (2) Fluorescence detection Detection of fluorescence emitted from the sample is not particularly limited, and can be performed by a conventionally known means. As a detection means, for example, an element for converting an optical signal into an electrical signal, such as a photodetector, a photodiode, a photomultiplier, a CCD camera, or a CMOS camera, is used. Further, as the detection means, photographing using a film or the like, observation with the naked eye, etc. can be adopted. The fluorescence emitted from the sample can also be detected indirectly by inducing energy transfer such as FRET to fluorescent molecules in proximity to the sample and receiving the fluorescence emitted from the fluorescent molecules.
サンプルから発せられる蛍光の検出は、特に限定されず、従来公知の手段によって行うことができる。検出手段としては、例えば、フォトディテクター、フォトダイオード、フォトマルチプライヤー、CCDカメラ、CMOSカメラなど、光信号を電気信号に変換する素子が用いられる。また、検出手段としては、フィルムなどを用いた撮影や、肉眼による観察なども採用できる。サンプルから発せられる蛍光は、サンプルに近接する蛍光分子に対するFRETなどのエネルギー移動を誘発し、蛍光分子から発せられる蛍光を受光することにより、間接的に検出することもできる。 (2) Fluorescence detection Detection of fluorescence emitted from the sample is not particularly limited, and can be performed by a conventionally known means. As a detection means, for example, an element for converting an optical signal into an electrical signal, such as a photodetector, a photodiode, a photomultiplier, a CCD camera, or a CMOS camera, is used. Further, as the detection means, photographing using a film or the like, observation with the naked eye, etc. can be adopted. The fluorescence emitted from the sample can also be detected indirectly by inducing energy transfer such as FRET to fluorescent molecules in proximity to the sample and receiving the fluorescence emitted from the fluorescent molecules.
サンプルから発せられた蛍光を効率的に検出するために、サンプルと検出手段との間に、レンズなどの集光手段を設けることが好ましい。また、サンプルと検出手段との間に、光ファイバーやミラーなどによって構成される光移動手段が存在してもよい。
In order to efficiently detect the fluorescence emitted from the sample, it is preferable to provide a focusing means such as a lens between the sample and the detection means. Further, between the sample and the detection means, there may be a light transfer means constituted by an optical fiber, a mirror or the like.
蛍光検出は、サンプルに対して光照射と同じ向きから行っても良いし、異なる向きから行ってもよい。特に光照射と蛍光検出とを同じ向きから行う場合においては、それとは異なる方向にミラー面などの光反射手段を設けることで、サンプルから発せられる蛍光の収集効率を向上させることができる。光照射と蛍光検出とが異なる方向であっても、光検出を妨げない配置及び構造の光反射手段を設けることもできるし、あるいは照射する光の波長は透過して検出対象とする光は反射するような波長選択性を有するダイクロイックミラーなどの光反射手段を設けることもできる。
The fluorescence detection may be performed on the sample from the same direction as the light irradiation, or may be performed from a different direction. In particular, when light irradiation and fluorescence detection are performed from the same direction, collection efficiency of the fluorescence emitted from the sample can be improved by providing light reflecting means such as a mirror surface in different directions. Even if the light irradiation and the fluorescence detection are in different directions, it is possible to provide light reflecting means of an arrangement and structure that does not interfere with the light detection, or the wavelength of the light to be irradiated is transmitted and the light to be detected is reflected. A light reflecting means such as a dichroic mirror having such wavelength selectivity can also be provided.
サンプルから発せられる蛍光を検出する際に、サンプルに照射した光からもたらされる散乱光、サンプル又はサンプルを保持する容器などからの自家蛍光、その他外部からもたらされる漏れこみ光などの検出対象外の光が存在する場合がある。この場合においては、検出対象外の光が検出手段に達しないよう、サンプルと光検出手段との間に、光選別手段を設けることが好ましい。
When detecting fluorescence emitted from a sample, light outside the detection target, such as scattered light produced from light irradiated to the sample, autofluorescence from a container or the like holding the sample or the sample, leaked light produced from other sources, etc. May exist. In this case, it is preferable to provide a light sorting means between the sample and the light detection means so that the light outside the detection target does not reach the detection means.
光選別手段としては、光学フィルタ、プリズム、グレーティングミラーなどの波長選別手段が挙げられる。また、サンプルを導入する基板や容器などの外面ないし内面のうち、光照射する際には影響がなく、蛍光検出の際に光が通過する領域に、望ましい波長の光のみが透過するように、あらかじめ加工を施しておくこともできる。
Examples of the light sorting means include wavelength sorting means such as an optical filter, a prism, and a grating mirror. In addition, among the outer surface or inner surface of a substrate or a container into which a sample is introduced, there is no effect when light is irradiated, and only light of a desired wavelength is transmitted to a region through which light passes in fluorescence detection. It can also be processed beforehand.
光選別手段は、後述する実施例の結果から、波長420nm程度以上の蛍光のみを選別して検出し得るものであることが好ましく、波長500nm程度以上の蛍光のみを選別して検出し得るものであることが特に好ましい。また、自家蛍光の影響を極力避けたい場合などにおいては、必要に応じて、例えば600nm程度以上の波長のみを検出することも可能である。本技術に係る核酸検出方法では、波長360nm程度の紫外線励起に対して中心波長600nm程度の比較的長波長の蛍光が得られ、ストロークシフトが長い。このため、本技術に係る核酸検出方法は、目的の蛍光を検出する際に、散乱光や他の物質から発せられる自家蛍光の影響を受けづらいことも利点である。
The light sorting means is preferably capable of sorting and detecting only fluorescence having a wavelength of about 420 nm or more according to the results of Examples described later, and capable of sorting and detecting only fluorescence having a wavelength of about 500 nm or more. Being particularly preferred. In addition, for example, when it is desired to avoid the influence of autofluorescence as much as possible, it is also possible to detect only a wavelength of, for example, about 600 nm or more, if necessary. In the nucleic acid detection method according to the present technology, relatively long wavelength fluorescence with a center wavelength of about 600 nm is obtained for ultraviolet excitation with a wavelength of about 360 nm, and the stroke shift is long. Therefore, the nucleic acid detection method according to the present technology is also advantageous in that it is less susceptible to scattered light and autofluorescence emitted from other substances when detecting the target fluorescence.
光選別手段の他の例として、分子ごとによって蛍光寿命が異なる性質を利用して、光照射後に蛍光検出を行う時間を適宜設定し、検出対象外の光を極力排除し、必要な蛍光を検出する方法も採用できる。
As another example of the light sorting means, utilizing the property that fluorescence lifetime differs depending on each molecule, the time for performing fluorescence detection after light irradiation is appropriately set, light outside the detection target is excluded as much as possible, and necessary fluorescence is detected It is also possible to adopt a method of
(3)蛍光スペクトル検出
サンプルから発せられる蛍光のスペクトル(エキサイテーション・スペクトルもしくはエミッション・スペクトル)を計測する場合においては、光照射及び蛍光検出においてスペクトル計測に適した手段を採用する。 (3) Detection of fluorescence spectrum In the case of measuring the spectrum (excitation spectrum or emission spectrum) of the fluorescence emitted from the sample, means suitable for spectrum measurement is employed in light irradiation and fluorescence detection.
サンプルから発せられる蛍光のスペクトル(エキサイテーション・スペクトルもしくはエミッション・スペクトル)を計測する場合においては、光照射及び蛍光検出においてスペクトル計測に適した手段を採用する。 (3) Detection of fluorescence spectrum In the case of measuring the spectrum (excitation spectrum or emission spectrum) of the fluorescence emitted from the sample, means suitable for spectrum measurement is employed in light irradiation and fluorescence detection.
エキサイテーション(励起)・スペクトルを計測したい場合には、光学フィルタ、プリズム、グレーティングミラーなどの波長選別手段を用いて、サンプルに照射する光の波長を空間的あるいは時間的に変化させ、検出される蛍光強度の空間的あるいは時間的な変化を計測する。エミッション(蛍光)・スペクトルを計測したい場合には、波長選別手段を用いてサンプルから発せられた蛍光の波長を空間的あるいは時間的に変化させ、それを検出手段に導光して、検出される蛍光強度の空間的あるいは時間的な変化を計測する。また、これらの方法を組み合わせて、エキサイテーション・スペクトル及びエミッション・スペクトルの双方を計測することもできる。
When it is desired to measure excitation (excitation) and spectrum, the wavelength of light to be irradiated to the sample is spatially or temporally changed and detected using wavelength selection means such as an optical filter, a prism, a grating mirror, etc. Measure spatial or temporal changes in fluorescence intensity. When it is desired to measure the emission (fluorescence) spectrum, the wavelength of the fluorescence emitted from the sample is spatially or temporally changed using the wavelength sorting means, and it is detected after being guided to the detection means Measure spatial or temporal changes in fluorescence intensity. Also, these methods can be combined to measure both the excitation spectrum and the emission spectrum.
サンプルに照射する光もしくはサンプルから発せられた蛍光の波長を空間的に変化させる波長選別手段の具体的な例としては、例えばプリズムやグレーティングミラーなどの波長に応じて光の進行方向を変異させる光学素子を用いることができる。
As a specific example of the wavelength selection means for spatially changing the wavelength of the light emitted to the sample or the fluorescence emitted from the sample, for example, an optical system for changing the traveling direction of the light according to the wavelength of a prism or a grating mirror Elements can be used.
サンプルに照射する光もしくはサンプルから発せられた蛍光の波長を時間的に変化させる波長選別手段の具体的な例としては、例えば光学フィルタの種類の切り替えや、電気的に透過する光の波長を制御できる光学フィルタによる透過光波長の切り替えが採用される。また、プリズムやグレーティングミラーなどの波長に応じて光の進行方向を変異させる光学素子、及びそれら光学素子を通過した光のうち一部の進行方向の光のみを選別することができる光方向選別手段を配置して、それら光学素子及び/又は光方向選別手段の配置や構造を時間的に制御して変化させる方法をとることもできる。これらの手段は電気的に制御することも可能であり、例えばコンピュータを用いて、自動的に選択する光の波長を時間変化させることも可能である。なお光方向選別手段は、スリットやレンズ、ミラー、光ファイバーなどの光学素子を適宜組み合わせて構成できる。
As a specific example of the wavelength selection means for temporally changing the wavelength of the light emitted to the sample or the fluorescence emitted from the sample, for example, the type of optical filter is switched or the wavelength of the electrically transmitted light is controlled Switching of the transmitted light wavelength by an optical filter that can be employed is employed. In addition, an optical element that changes the traveling direction of light according to the wavelength of a prism, a grating mirror, etc., and a light direction sorting unit that can sort only a part of the traveling direction of the light passing through the optical element. It is also possible to adopt a method of temporally controlling and changing the arrangement and structure of the optical elements and / or the light direction sorting means by disposing These means can also be controlled electrically, and it is also possible to time-vary the wavelength of light to be selected automatically, for example using a computer. The light direction sorting means can be configured by appropriately combining optical elements such as a slit, a lens, a mirror, and an optical fiber.
波長選択手段で光の波長を時間的に変化させてエキサイテーション及び/又はエミッション・スペクトルを検出する方法においては、波長選別手段によって選別される光の波長をコンピュータで制御し、光検出手段としてフォトディテクターなど光信号を電気信号に変換する素子を用いて計測結果をコンピュータに読み込み、さらに照射した光の波長と測定された蛍光強度との関係を対応づけてコンピュータ上に記録する構成とすることが好ましい。
In the method of detecting the excitation and / or emission spectrum by temporally changing the wavelength of light by the wavelength selection means, the wavelength of the light selected by the wavelength selection means is controlled by a computer and the photodetection means is used as a photodetection means. The measurement result is read into a computer using an element such as a detector that converts an optical signal into an electric signal, and the relationship between the wavelength of the irradiated light and the measured fluorescence intensity is correlated and recorded on the computer. preferable.
波長選択手段で光の波長を空間的に変異させてエキサイテーション及び/又はエミッション・スペクトルを検出する方法において、光検出手段としては受光素子が一次元方向にアレイ状に並べられたものや、CCDやCMOSなど受光素子が面上に配置されたものなどを用いることができる。
In the method of detecting the excitation and / or emission spectrum by spatially changing the wavelength of light by the wavelength selection means, as the light detection means, one in which light receiving elements are arrayed in a one-dimensional direction, a CCD, or It is possible to use one in which a light receiving element such as CMOS or the like is disposed on the surface.
(4)蛍光の空間分布の検出
サンプル中に含まれる核酸の空間的な分布や形状などの情報を得る場合、一定の広がりをもつ領域に対して光照射及び蛍光検出をまとめて行い、一度に空間的情報を得る方法が考えられる。また、別法として、検出対象とする部位を時間ごとに変化させ、一定の広がりをもつ領域の内部を順次スキャンしていくことで空間的情報を得る方法も考えられる。 (4) Detection of spatial distribution of fluorescence When obtaining information such as spatial distribution or shape of nucleic acid contained in a sample, light irradiation and fluorescence detection are collectively performed on a region having a certain spread, and at one time There are conceivable ways of obtaining spatial information. As another method, a method may be considered in which spatial information is obtained by changing a site to be detected with time and sequentially scanning the inside of a region having a predetermined spread.
サンプル中に含まれる核酸の空間的な分布や形状などの情報を得る場合、一定の広がりをもつ領域に対して光照射及び蛍光検出をまとめて行い、一度に空間的情報を得る方法が考えられる。また、別法として、検出対象とする部位を時間ごとに変化させ、一定の広がりをもつ領域の内部を順次スキャンしていくことで空間的情報を得る方法も考えられる。 (4) Detection of spatial distribution of fluorescence When obtaining information such as spatial distribution or shape of nucleic acid contained in a sample, light irradiation and fluorescence detection are collectively performed on a region having a certain spread, and at one time There are conceivable ways of obtaining spatial information. As another method, a method may be considered in which spatial information is obtained by changing a site to be detected with time and sequentially scanning the inside of a region having a predetermined spread.
前者の場合には、検出対象とする領域全体に渡って光が照射されることが好ましく、さらに領域全体に渡って照射する光の強度が均一であることがさらに好ましい。光検出手段としては肉眼やフィルムを用いた観察のほか、CCDカメラCMOSカメラなど光信号を電気信号に変換する受光素子が二次元に配列した光検出手段を用いることもできる。
In the former case, it is preferable that the light be irradiated over the entire area to be detected, and it is further preferable that the intensity of the light irradiated over the entire area be uniform. As the light detection means, in addition to observation using a naked eye or a film, it is also possible to use a light detection means such as a CCD camera CMOS camera in which light receiving elements for converting light signals into electric signals are two-dimensionally arrayed.
後者の場合の一例としては、例えば、照射する光としてレーザー光を用い、該レーザー光の照射位置をガルバノミラーなどによって時間変化させ、該レーザーの照射位置より発せられた蛍光を検出して、レーザー照射位置と検出された蛍光強度とを関連づけたデータから蛍光強度の空間分布を取得する方法が挙げられる。この場合、ガルバノミラーなどによる光照射位置の制御及びその記録をコンピュータで行い、検出された蛍光強度とその時点における光照射位置を関連づけたデータをコンピュータ内で構築することで、蛍光強度の空間分布を自動的に解析することが望ましい。
As an example of the latter case, for example, laser light is used as the light to be irradiated, the irradiation position of the laser light is temporally changed by a galvano mirror etc., and fluorescence emitted from the irradiation position of the laser is detected. There is a method of acquiring the spatial distribution of the fluorescence intensity from data in which the irradiation position and the detected fluorescence intensity are associated. In this case, spatial distribution of the fluorescence intensity is performed by controlling the light irradiation position by the galvano mirror or the like and recording the position with a computer and correlating the detected fluorescence intensity with the light irradiation position at that point in the computer. It is desirable to analyze automatically.
他の例としては、線状に光照射する光源と、ラインセンサなどの受光素子が一次元方向に配列した光検出手段などを用いて蛍光分布の一次元的分布を計測し、この位置を順次移動させることで空間分布の情報を得る方法が挙げられる。あるいは、蛍光強度の空間分布を一度に取得できるCCDカメラやCMOSカメラなどの受光素子を使用し、さらにその観察対象とする空間領域を順次移動させることで、さらに広い領域における蛍光強度の空間分布を取得することもできる。これらの場合についても、適宜コンピュータを用いて検出部位の制御及び蛍光検出結果の記録を行い、それらの情報をもとに蛍光強度の空間分布を自動的に解析することが望ましい。
As another example, one-dimensional distribution of fluorescence distribution is measured using a light source for irradiating light linearly and a light detection means in which light receiving elements such as a line sensor are arranged in a one-dimensional direction, and this position is sequentially There is a method of obtaining spatial distribution information by moving. Alternatively, by using a light receiving element such as a CCD camera or a CMOS camera capable of acquiring the spatial distribution of fluorescence intensity at one time, and further moving the spatial region to be observed further sequentially, the spatial distribution of fluorescence intensity in a wider region is obtained. You can also get it. Also in these cases, it is desirable to appropriately control the detection site and record the fluorescence detection result using a computer as appropriate, and analyze the spatial distribution of the fluorescence intensity automatically based on the information.
3.塩基配列の解析
次に、検出手順において検出された蛍光についての情報に基づいて、核酸の塩基配列を解析したり、核酸が形成する二本鎖中のミスマッチを解析する方法について説明する。 3. Analysis of Base Sequence Next, based on the information on the fluorescence detected in the detection procedure, a method of analyzing the base sequence of the nucleic acid or analyzing the mismatch in the double strand formed by the nucleic acid will be described.
次に、検出手順において検出された蛍光についての情報に基づいて、核酸の塩基配列を解析したり、核酸が形成する二本鎖中のミスマッチを解析する方法について説明する。 3. Analysis of Base Sequence Next, based on the information on the fluorescence detected in the detection procedure, a method of analyzing the base sequence of the nucleic acid or analyzing the mismatch in the double strand formed by the nucleic acid will be described.
蛍光についての情報としては、具体的には蛍光の強度及び/又はスペクトル(エキサイテーション・スペクトルもしくはエミッション・スペクトル)であり、加えて蛍光寿命や、蛍光の空間分布及び時間変化などが挙げられる。これらの情報は数値化されることが可能であり、例えばコンピュータ上に記録したり、コンピュータ上で解析のための計算処理を行ったりすることなども可能である。
The information on the fluorescence is specifically the intensity and / or spectrum (excitation spectrum or emission spectrum) of the fluorescence, and in addition, the fluorescence lifetime, the spatial distribution of the fluorescence and the time change, etc. may be mentioned. These pieces of information can be quantified, and for example, can be recorded on a computer, or can be subjected to calculation processing for analysis on a computer.
検出手順において取得される蛍光強度は、反応条件や光学系などのほか、核酸の濃度、種類、大きさ、高次構造、塩基配列などに依存する(実施例参照)。特に反応条件及び光学系全体、核酸の種類、大きさ、高次構造、塩基配列が一定である場合には、蛍光強度の計測結果から核酸の濃度について情報を得ることができる。この場合の解析方法としては、あらかじめ濃度が既知の検出対象の核酸を用いて濃度と蛍光強度との関係について情報を得ておき、望ましくは2以上の核酸濃度に対して蛍光強度を測定してキャリブレーションカーブを作成し、検出の結果得られた蛍光強度をこの濃度と強度の関係にあてはめて核酸濃度を計算する、という手順によって行うことができる。さらに核酸濃度と蛍光強度との関係をあらかじめコンピュータ上に記録しておき、蛍光強度から核酸濃度を算出する工程をコンピュータ上で行うことで、この作業を自動的に行うことも可能である。
The fluorescence intensity obtained in the detection procedure depends on the concentration, type, size, higher order structure, base sequence and the like of the nucleic acid as well as the reaction conditions and the optical system (see Examples). In particular, when the reaction conditions, the entire optical system, the type, size, higher order structure, and base sequence of the nucleic acid are constant, information on the concentration of the nucleic acid can be obtained from the measurement results of the fluorescence intensity. As an analysis method in this case, information on the relationship between the concentration and the fluorescence intensity is obtained in advance using a nucleic acid to be detected whose concentration is known, and preferably the fluorescence intensity is measured for two or more nucleic acid concentrations. A calibration curve can be created, and the fluorescence intensity obtained as a result of detection can be applied to the relationship between the concentration and the intensity to calculate the nucleic acid concentration. Furthermore, it is also possible to automatically perform this work by recording the relationship between the nucleic acid concentration and the fluorescence intensity in advance on a computer and performing the process of calculating the nucleic acid concentration from the fluorescence intensity on a computer.
また、検出手順において取得される蛍光のスペクトル及び強度は、特に濃度や反応条件、光学系などが一定であれば、核酸の塩基配列及び高次構造に依存する(実施例参照)。ここで高次構造とは、核酸の一本鎖構造あるいは二本鎖構造、ハイブリダイゼーションによる二本鎖形成の有無及び部位、二本鎖中のミスマッチの有無及び部位などを指す。この性質を利用して、蛍光スペクトル及び強度の計測結果から、核酸の塩基配列や高次構造について情報を得ることができる。より具体的には、例えばサンプル中に含まれる核酸の配列及び高次構造が、あらかじめ既知の有限個の候補のうちのいずれかであることが分かっている場合において、あらかじめそれら候補について蛍光のスペクトル及び強度を計測しておき、これらの計測結果との比較を行うことで、蛍光検出したサンプルに含まれる核酸の配列及び高次構造を推定することができる。2以上のスペクトルを比較する方法としては、例えば特徴量、例えば蛍光最大波長及びその強度や、2以上の波長領域における蛍光強度の比などを計算し、それらの値の比較を行う方法がある。また、比較を行う2つのスペクトルについて差分を計算するなどして類似度を定量化することもできる。あるいは、例えばスペクトルの形状の比較にのみ着目してスペクトルの比較を行う場合において、あらかじめ計測したスペクトルをその最大強度が一定値となるように補正した上で比較を行うこともできる。さらには、例えば蛍光強度に対して変数をかけて最小二乗法などの手法を利用することによって、2つのスペクトルの差異が最小となる変数値及びその点における2スペクトルの差異の大きさを定量化することもできる。これらの手法については、核酸の配列及び高次構造と、蛍光のスペクトル及び強度との関係を、あらかじめコンピュータ上に記録しておき、計測された蛍光スペクトル及び強度の情報から核酸の配列及び高次構造を推定する工程をコンピュータ上で行うことで、この作業を自動的に行うことも可能である。
In addition, the spectrum and intensity of the fluorescence obtained in the detection procedure depend on the base sequence and higher-order structure of the nucleic acid, in particular if the concentration, reaction conditions, optical system, etc. are constant (see Examples). Here, the higher-order structure refers to a single-stranded structure or double-stranded structure of nucleic acid, presence or absence and position of double-strand formation by hybridization, presence or absence of mismatch in double-strand, and the like. Using this property, it is possible to obtain information on the base sequence and higher order structure of nucleic acid from the measurement results of fluorescence spectrum and intensity. More specifically, for example, when it is known that the sequence and higher-order structure of the nucleic acid contained in the sample are any of a finite number of candidates known in advance, the spectrum of fluorescence of the candidates in advance And by measuring the intensity and comparing with these measurement results, it is possible to estimate the sequence and higher-order structure of the nucleic acid contained in the sample subjected to fluorescence detection. As a method of comparing two or more spectra, there is, for example, a method of calculating a characteristic quantity, for example, a maximum fluorescence wavelength and its intensity, a ratio of fluorescence intensities in two or more wavelength regions, etc., and comparing those values. Also, the similarity can be quantified by calculating differences between two spectra to be compared. Alternatively, for example, in the case of comparing spectra by focusing attention only on the comparison of the shapes of the spectra, it is also possible to perform the comparison after correcting the spectrum measured in advance so that its maximum intensity becomes a constant value. Furthermore, quantify the magnitude of the difference between the two spectra at the point where the difference between the two spectra is minimized and the difference between the two spectra, for example, by applying a variable to the fluorescence intensity and using a method such as the least squares method. You can also Regarding these techniques, the relationship between the sequence and higher-order structure of nucleic acid, and the relationship between the spectrum and intensity of fluorescence are recorded in advance on a computer, and the information on the nucleic acid sequence and higher-order is derived from the measured fluorescence spectrum and intensity information. It is also possible to automatically perform this work by performing the process of estimating the structure on a computer.
検出手順において取得される蛍光の空間分布及び時間変化を解析したい場合においては、例えばその空間を目視で確認し、その特徴を観察したり、定性的な分類をおこなったりすることができる。あるいは蛍光像をコンピュータ上に取り込み、画像処理によって定量的な解析を行うことができる。ここで画像処理の例としては、例えば二値化処理などによる蛍光を発している領域の抽出を行い、それら領域の面積及び輪郭線の長さ、円形度、中心や重心などの位置、領域中における蛍光強度の総和、平均値、中央値、分散、標準偏差などの数値を計算することができる。あるいはパターンマッチングや学習アルゴリズムなどを応用することで、特定の形状の領域を識別したり、形状の分類を行ったりすることもできる。
When it is desired to analyze the spatial distribution and time change of the fluorescence acquired in the detection procedure, for example, the space can be visually confirmed to observe its features or perform qualitative classification. Alternatively, the fluorescent image can be captured on a computer and subjected to quantitative analysis by image processing. Here, as an example of the image processing, for example, extraction of a region emitting fluorescence by binarization processing is performed, and the area and length of the region, circularity, positions such as the center and the center of gravity, and the like Numerical values such as the sum, average value, median value, variance, standard deviation, etc. of the fluorescence intensity at can be calculated. Alternatively, by applying pattern matching, a learning algorithm or the like, it is possible to identify a region of a specific shape or to classify the shape.
4.応用例
本技術に係る核酸検出方法は、上述の接触手順及び蛍光手順に、必要に応じて塩基配列の解析を組み合わせることで、様々な分野で利用することができる。以下に、本技術に係る核酸検出方法の応用例について説明する。 4. Application Examples The nucleic acid detection method according to the present technology can be used in various fields by combining the above-described contact procedure and fluorescence procedure, as needed, with analysis of a base sequence. Hereinafter, application examples of the nucleic acid detection method according to the present technology will be described.
本技術に係る核酸検出方法は、上述の接触手順及び蛍光手順に、必要に応じて塩基配列の解析を組み合わせることで、様々な分野で利用することができる。以下に、本技術に係る核酸検出方法の応用例について説明する。 4. Application Examples The nucleic acid detection method according to the present technology can be used in various fields by combining the above-described contact procedure and fluorescence procedure, as needed, with analysis of a base sequence. Hereinafter, application examples of the nucleic acid detection method according to the present technology will be described.
(1)微細な遺伝子配列の違いの検出
本技術では蛍光スペクトル及び/又は強度を計測することによって、サンプルに含まれる核酸の塩基配列について情報を得ることが可能である。しかしながらサンプルに多数の核酸が含まれると、検出される蛍光スペクトル及び/又は強度が平均化され、微細な遺伝子配列の違いを識別できなくなる可能性があることから、必要に応じて以下に例示するような、検出対象とする核酸の範囲を限定するための方法を組み合わせることが好ましい。 (1) Detection of Difference in Fine Gene Sequence In the present technology, it is possible to obtain information on the base sequence of the nucleic acid contained in the sample by measuring the fluorescence spectrum and / or the intensity. However, if a large number of nucleic acids are contained in the sample, detected fluorescence spectra and / or intensities may be averaged, and differences in fine gene sequences may not be distinguishable. It is preferable to combine such methods for limiting the range of nucleic acids to be detected.
本技術では蛍光スペクトル及び/又は強度を計測することによって、サンプルに含まれる核酸の塩基配列について情報を得ることが可能である。しかしながらサンプルに多数の核酸が含まれると、検出される蛍光スペクトル及び/又は強度が平均化され、微細な遺伝子配列の違いを識別できなくなる可能性があることから、必要に応じて以下に例示するような、検出対象とする核酸の範囲を限定するための方法を組み合わせることが好ましい。 (1) Detection of Difference in Fine Gene Sequence In the present technology, it is possible to obtain information on the base sequence of the nucleic acid contained in the sample by measuring the fluorescence spectrum and / or the intensity. However, if a large number of nucleic acids are contained in the sample, detected fluorescence spectra and / or intensities may be averaged, and differences in fine gene sequences may not be distinguishable. It is preferable to combine such methods for limiting the range of nucleic acids to be detected.
ここで、微細な遺伝子配列の違いとして、例えば一塩基多型(SNPs)などを挙げることができる。核酸の塩基配列を解析することは疾患の診断などにおいて非常に有用であることが知られている。SNPsを解析することで、心臓病など種々の疾患に対するリスクが診断できることが公知である。
Here, for example, single nucleotide polymorphisms (SNPs) and the like can be mentioned as fine differences in gene sequences. It is known that analyzing the nucleotide sequence of nucleic acid is very useful in the diagnosis of diseases and the like. It is known that analyzing SNPs can diagnose the risk for various diseases such as heart disease.
検出対象とする核酸の範囲を限定する方法の第一の例として、サンプルに含まれる核酸から、解析対象としたい配列を含む部分のみを取り出す方法が挙げられる。具体的には、例えば基板上やビーズなどに固定化したプローブDNAを用いたハイブリダイゼーションによる方法、電気泳動による方法、PCRなど核酸増幅技術を用いて対象配列のみを増幅する方法などが挙げられる。また、これらの方法に対して、制限酵素反応やライゲーション反応などを組み合わせてもよい。
As a first example of the method of limiting the range of the nucleic acid to be detected, there is a method of taking out only the portion containing the sequence to be analyzed from the nucleic acid contained in the sample. Specifically, for example, a method by hybridization using probe DNA immobilized on a substrate, beads or the like, a method by electrophoresis, a method of amplifying only a target sequence using a nucleic acid amplification technique such as PCR, etc. may be mentioned. Moreover, you may combine a restriction enzyme reaction, a ligation reaction, etc. with these methods.
第二の例として、サンプルに含まれる核酸のうち、特定の塩基のみからのシグナルを選択的に取得する方法が挙げられる。具体的には、本技術において見出された現象である、相補鎖を形成していないチミン(T)配列から特に強い蛍光が検出される現象を利用する方法が挙げられる。この方法では、サンプルに含まれる核酸のうち、変異検出を行いたい部位を除く配列とハイブリダイズして二本鎖核酸を形成するような1つ以上のプローブ核酸をあらかじめ準備しておき、これと遺伝子配列の変異を検出したい核酸とをハイブリダイズさせたものをサンプルとして用いる。プローブ核酸は、例えば解析対象配列中のアデニン(A)がその他の塩基と置き換わる変異がある場合、当該部位に相当するプローブの配列にTを配置しておく。これにより、当該部位の塩基がA以外に置き換わった際にTのミスマッチが生じ、強い蛍光が測定される。あるいは解析対象配列中のTがその他の塩基と置き換わる変異がある場合は、当該部位に相当するプローブの配列にA以外の塩基を配置しておく。これにより、変異が存在しない場合にのみ、二本鎖を形成していないTから強い蛍光が測定される。
A second example is a method of selectively acquiring a signal from only a specific base among nucleic acids contained in a sample. Specifically, there is a method using the phenomenon found in the present technology, which is a phenomenon in which particularly strong fluorescence is detected from a thymine (T) sequence not forming a complementary strand. In this method, among the nucleic acids contained in the sample, at least one probe nucleic acid that hybridizes with a sequence other than the site where mutation detection is desired to form double-stranded nucleic acid is prepared in advance. What hybridized the nucleic acid which wants to detect the mutation of gene sequence is used as a sample. In the probe nucleic acid, for example, when there is a mutation in which adenine (A) in the sequence to be analyzed is replaced with another base, T is arranged in the sequence of the probe corresponding to the site. As a result, when the base at the relevant site is replaced with something other than A, a T mismatch occurs and strong fluorescence is measured. Alternatively, when there is a mutation that replaces T in the analysis target sequence with another base, a base other than A is placed in the sequence of the probe corresponding to the site. Thereby, strong fluorescence is measured from T not forming a double strand only when no mutation is present.
プローブ核酸は、例えばDNA、RNAのほか、ペプチド核酸(PNA)、ホスホロチオエート型オリゴヌクレオチド、BNA (LNA)などで構成することができる。
The probe nucleic acid can be composed of, for example, DNA, RNA, peptide nucleic acid (PNA), phosphorothioate oligonucleotide, BNA (LNA) or the like.
第三の例として、検出手順において、光照射ないし蛍光検出の対象となる物理的な領域を限定する方法が挙げられる。例えばサンプルに照射する光としてエバネッセント光などの近接場光を用いるなど、特に限定された特定の領域にのみ光照射がなされる方式を採用することが挙げられる。この方法はさらに、核酸を特定位置に保持ないし移動させる手段と組み合わせることができる。核酸を特定位置に保持ないし移動させる手段としては、例えば固体表面上に固定化するほか、ナノポアなど非常に微細な流路を通過させたり、酵素などのたんぱく質中を移動させたりすることが挙げられる。
A third example is a method of limiting a physical region to be subjected to light irradiation or fluorescence detection in a detection procedure. For example, it is possible to employ a method in which light irradiation is performed only to a particularly limited specific area, such as using near-field light such as evanescent light as light to be irradiated to a sample. This method can be further combined with means for holding or moving the nucleic acid at a specific position. As a means for holding or moving a nucleic acid at a specific position, for example, in addition to immobilizing on a solid surface, passing through a very fine channel such as nanopore or moving in a protein such as an enzyme can be mentioned. .
光照射ないし蛍光検出の対象となる物理的な領域を限定するその他の方法としては、例えばFRETやBRETなどのエネルギー移動を利用する方法が挙げられる。光照射においては、例えば検出したい領域の近傍にFRETやBRETなどを誘発する分子を配置しておき、該分子からのエネルギー移動をもって局所的な光照射とできる。蛍光検出においては、検出したい領域の近傍に、サンプルから発せられる蛍光のエネルギーを受けてFRETを誘発できる蛍光分子を配置し、該蛍光分子から発生される蛍光を検出することでもって局所的な蛍光検出とできる。
As another method of limiting a physical region to be a target of light irradiation or fluorescence detection, for example, a method utilizing energy transfer such as FRET or BRET can be mentioned. In light irradiation, for example, a molecule that induces FRET or BRET is disposed in the vicinity of a region to be detected, and local light irradiation can be performed by energy transfer from the molecule. In fluorescence detection, a fluorescent molecule capable of inducing FRET upon receiving energy of fluorescent light emitted from a sample is disposed in the vicinity of a region to be detected, and local fluorescent light is detected by detecting the fluorescence generated from the fluorescent molecule. It can be detected.
(2)DNA分子のメチル化の解析
DNA分子のうちシトシン(C)は、細胞内のゲノム中においてメチル化されることが知られている。シトシン(C)のメチル化の有無は、バイサルフェート反応においてウラシル(U)に置換されるかどうかで検出することが可能である。すなわち、適切な条件下で核酸のバイサルフェート(亜硫酸水素塩)処理を行うと、メチル化されていないシトシン(C)のみを選択的にウラシル(U)に変換できる。このため、ウラシル(U)の検出により、非メチル化シトシンの存在を検出できる。 (2) Analysis of methylation of DNA molecule Among DNA molecules, cytosine (C) is known to be methylated in the genome of cells. The presence or absence of methylation of cytosine (C) can be detected by whether or not uracil (U) is substituted in the bisulfate reaction. That is, by bisulfite (bisulfite) treatment of nucleic acid under appropriate conditions, only unmethylated cytosine (C) can be selectively converted to uracil (U). Therefore, detection of uracil (U) can detect the presence of unmethylated cytosine.
DNA分子のうちシトシン(C)は、細胞内のゲノム中においてメチル化されることが知られている。シトシン(C)のメチル化の有無は、バイサルフェート反応においてウラシル(U)に置換されるかどうかで検出することが可能である。すなわち、適切な条件下で核酸のバイサルフェート(亜硫酸水素塩)処理を行うと、メチル化されていないシトシン(C)のみを選択的にウラシル(U)に変換できる。このため、ウラシル(U)の検出により、非メチル化シトシンの存在を検出できる。 (2) Analysis of methylation of DNA molecule Among DNA molecules, cytosine (C) is known to be methylated in the genome of cells. The presence or absence of methylation of cytosine (C) can be detected by whether or not uracil (U) is substituted in the bisulfate reaction. That is, by bisulfite (bisulfite) treatment of nucleic acid under appropriate conditions, only unmethylated cytosine (C) can be selectively converted to uracil (U). Therefore, detection of uracil (U) can detect the presence of unmethylated cytosine.
核酸と銅との複合体に由来する蛍光は、ウラシルとチミンで強度が高く、シトシン及びメチル化シトシンでは検出されない(実施例参照)。従って、バイサルフェート処理によってサンプルに含まれる核酸中の非メチル化シトシンを選択的にウラシルに変換し、これに伴ってサンプルで検出される蛍光の強度及び/又はスペクトルの変化量を調べることで、核酸におけるシトシンのメチル化あるいは脱メチル化の有無及び量を解析することができる。さらに、上記の「微細な遺伝子配列の違いの検出」で説明した方法を組み合わせて用いることで、核酸の塩基配列中におけるメチル化シトシンあるいは脱メチル化シトシンの位置などのより詳細な解析を行うこともできる。
The fluorescence derived from the complex of nucleic acid and copper is high in uracil and thymine, and is not detected in cytosine and methylated cytosine (see Examples). Therefore, by selectively converting unmethylated cytosine in the nucleic acid contained in the sample to uracil by bisulfate treatment and examining the amount of change in the intensity and / or spectrum of fluorescence detected in the sample accordingly, The presence and amount of methylation or demethylation of cytosine in the nucleic acid can be analyzed. Furthermore, by combining and using the methods described in the above-mentioned “Detection of differences in gene sequences”, more detailed analysis of the position of methylated cytosine or demethylated cytosine in the base sequence of nucleic acid, etc. You can also.
メチル化解析は、具体的には以下の手順により行うことができる。まず、核酸を含むサンプルを、従来公知の手法に従って、バイサルフェート処理する。次に、バイサルフェート処理前のサンプル及び処理後のサンプルから蛍光の強度及び/又はスペクトルの検出を行う。そして、バイサルフェート処理の前後のサンプルから検出された蛍光の強度及び/又はスペクトルを比較する。メチル化されていないシトシンの量が多いほど、バイサルフェート処理によって生じるウラシルの量が多くなるため、バイサルフェート処理前後のサンプルの蛍光を比較することにより、核酸におけるシトシンのメチル化あるいは脱メチル化の有無及び量についての情報を得ることができる。
Specifically, methylation analysis can be performed according to the following procedure. First, a sample containing nucleic acid is bisulfated according to a conventionally known method. Next, detection of the fluorescence intensity and / or spectrum is performed from the sample before bisulfate treatment and the sample after treatment. Then, the intensities and / or spectra of fluorescence detected from the sample before and after bisulfate treatment are compared. The greater the amount of unmethylated cytosine, the greater the amount of uracil produced by the bisulfate treatment, so by comparing the fluorescence of the sample before and after the bisulfate treatment, the cytosine methylation or demethylation in the nucleic acid You can get information about presence and quantity.
サンプルに含まれる核酸の塩基配列中にチミンが多く含まれると、チミン由来の蛍光がノイズとなって、ウラシルからの蛍光のシグナル・ノイズ比が低下するおそれがある。また、核酸の塩基配列中にバイサルフェート処理によってウラシルに変換される非メチル化シトシンが複数存在する場合がある。これらの場合において、核酸の塩基配列の特定領域におけるメチル化解析を行うためには、以下の方法を組み合わせて用いることが有効である。
When a large amount of thymine is contained in the base sequence of the nucleic acid contained in the sample, the thymine-derived fluorescence may become noise and the signal-to-noise ratio of the fluorescence from uracil may be reduced. In addition, there may be a plurality of unmethylated cytosines converted to uracil by bisulfate treatment in the base sequence of nucleic acid. In these cases, it is effective to use the following methods in combination in order to analyze the methylation in a specific region of the base sequence of the nucleic acid.
第一に、バイサルフェート処理後のサンプルに含まれる核酸について、メチル化解析の対象とする領域を増幅あるいは濃縮する方法が挙げられる。具体的には、PCRなどの核酸増幅方法や、核酸ハイブリダイズ反応を利用した核酸濃縮方法が用いられる。
First, there is a method of amplifying or concentrating a region to be subjected to methylation analysis for nucleic acid contained in a sample after bisulfate treatment. Specifically, a nucleic acid amplification method such as PCR or a nucleic acid concentration method using a nucleic acid hybridization reaction is used.
第二に、メチル化解析の対象とする領域以外から発生する蛍光を抑制する方法がある。核酸と銅との複合体に由来する蛍光は、一本鎖DNA中のチミンで強度が高く、二本鎖DNA中のチミンでは大きく抑制される(実施例参照)。従って、解析対象外の領域に対して相補的は塩基配列を有するマスク用の核酸鎖をハイブリダイズさせ、解析対象外の領域に存在するチミンからの蛍光を抑制することで、解析対象領域からの蛍光を高効率に検出することが可能となる。あるいは、クエンチャーを用いて解析対象外の領域から発生する蛍光を抑制する方法も採用できる。核酸と銅との複合体に由来する蛍光は、クエンチャーを隣接させることで抑制が可能である(実施例参照)。従って、解析対象外の領域に対してクエンチャーを配置することで、解析対象領域からの蛍光を高効率に検出することが可能となる。
Second, there is a method of suppressing fluorescence generated from regions other than the region targeted for methylation analysis. The fluorescence derived from the complex of nucleic acid and copper is high in intensity with thymine in single-stranded DNA, and greatly suppressed in thymine in double-stranded DNA (see Examples). Therefore, complementary to the region not to be analyzed is caused by hybridizing the mask nucleic acid strand having the base sequence and suppressing the fluorescence from thymine present in the region not to be analyzed, from the region to be analyzed It becomes possible to detect fluorescence highly efficiently. Alternatively, a method of suppressing fluorescence generated from a region not to be analyzed using a quencher can also be adopted. The fluorescence derived from the complex of nucleic acid and copper can be suppressed by affixing a quencher (see Examples). Therefore, by arranging the quencher in a region not to be analyzed, it is possible to detect fluorescence from the region to be analyzed with high efficiency.
第三に、メチル化解析の対象とする領域のみを選択的に励起するか、該領域からの蛍光のみを選択的に検出する方法がある。具体的には、核酸と銅との複合体を励起して蛍光を生じさせることが可能なドナープローブを解析対象領域に隣接するように配置し、FRETやBRETなどによるエネルギー移動を利用して解析対象領域のみを選択的に励起する。これによって、解析対象領域から蛍光のみを検出することができる。または、核酸と銅との複合体からの蛍光のエネルギー移動によって励起され、異なる波長の蛍光を発するアクセプタープローブを解析対象領域に隣接するように配置し、アクセプタープローブの蛍光検出によって解析対象領域から蛍光を検出してもよい。なお、以上に説明した方法は、任意に組み合わせて用いることが可能である。
Third, there is a method of selectively exciting only a region to be subjected to methylation analysis or selectively detecting only fluorescence from the region. Specifically, a donor probe capable of causing fluorescence by exciting a complex of nucleic acid and copper is disposed adjacent to a region to be analyzed, and analysis is performed using energy transfer such as FRET or BRET. Selectively excite only the region of interest. By this, only fluorescence can be detected from the analysis target area. Alternatively, an acceptor probe which is excited by energy transfer of fluorescence from a complex of a nucleic acid and copper and emits fluorescence of a different wavelength is disposed adjacent to the analysis target region, and the analysis target region is detected by fluorescence detection of the acceptor probe. The fluorescence may be detected from The methods described above can be used in any combination.
(3)細胞核の観察及び計測
有核細胞を含むサンプルについて本技術に係る核酸検出方法を行い、核酸の空間分布の検出を行って、その分布及び形状を解析することによって、組織切片や細胞などの中に含まれる細胞核の分布、位置、数、大きさ、形状などに関する情報を得ることができる。 (3) Observation and measurement of cell nucleus The nucleic acid detection method according to the present technology is performed on a sample containing nucleated cells, the spatial distribution of nucleic acid is detected, and the distribution and shape thereof are analyzed to analyze tissue slices, cells, etc. It is possible to obtain information on the distribution, position, number, size, shape, etc. of cell nuclei contained in.
有核細胞を含むサンプルについて本技術に係る核酸検出方法を行い、核酸の空間分布の検出を行って、その分布及び形状を解析することによって、組織切片や細胞などの中に含まれる細胞核の分布、位置、数、大きさ、形状などに関する情報を得ることができる。 (3) Observation and measurement of cell nucleus The nucleic acid detection method according to the present technology is performed on a sample containing nucleated cells, the spatial distribution of nucleic acid is detected, and the distribution and shape thereof are analyzed to analyze tissue slices, cells, etc. It is possible to obtain information on the distribution, position, number, size, shape, etc. of cell nuclei contained in.
これらの情報から有核細胞の数を算出することも可能であり、さらにサンプルを導入する容器などの内部形状を適切に設計し、一定領域内に一定の容積のサンプルが保持されるように設計することで、サンプルに含まれる有核細胞の濃度計測にも利用可能である。また、細胞の核の形状と数とを合わせて計測することにより、細胞核の形状が異なる複数種類の細胞の識別やカウントを行うこともできる。例えば、白血球は顆粒球、単球、リンパ球と種類によって核の形状が異なることが知られている。これら白血球の種類を識別したり、これら各々のカウントを行ったりする用途において、本技術に係る核酸検出方法が利用可能である。
It is also possible to calculate the number of nucleated cells from these pieces of information, and also design the internal shape of the container etc. for introducing the sample appropriately so that a certain volume of sample can be retained in a certain area By doing this, it can also be used to measure the concentration of nucleated cells contained in the sample. Also, by measuring the shape and number of cell nuclei together, it is possible to identify and count a plurality of types of cells having different cell nucleus shapes. For example, it is known that white blood cells differ in their nuclear shape depending on their type from granulocytes, monocytes and lymphocytes. The nucleic acid detection method according to the present technology can be used in applications that identify the types of these white blood cells and count each of these.
また、例えば、マラリアの病状を引き起こす原因となる寄生虫として知られるマラリア原虫の種類として、熱帯熱マラリア原虫、三日熱マラリア原虫、四日熱マラリア原虫、卵形マラリア原虫などが知られている。さらに、ステージとして輪状体(ring form)、栄養体(trophozoite)、分裂体(schizont)、生殖母体(gametocyte)などが知られている。これら種類を適切に鑑別することは、感染患者の治療方針を適切に行うためには非常に重要である。マラリア原虫の種類の鑑別手段として、遺伝子や抗原を検出する簡便な方法も存在するが、従来は、原則としてギムザ染色により核の形状を観察することが行われている。しかしながら、この方法では、染色が不十分なときに診断ミスを引き起こしやすいなどの問題があった。これに対し、本技術に係る核酸検出方法をマラリア原虫の種類の鑑別手段に応用すれば、従来の染色試薬を必要としないため、染色作業が簡便で洗浄作業も必要としない、より簡便かつ確実な方法でマラリアなどの診断を行うことが可能となる。
Also, for example, P. falciparum, P. vivax, P. falciparum, Ogata malaria parasite, etc. are known as a type of malaria parasite known as a parasite that causes a medical condition of malaria. . Furthermore, as a stage, a ring form, a trophozoite, a schizont, a gametocyte and the like are known. Proper identification of these types is very important for proper treatment of infected patients. A simple method of detecting a gene or an antigen also exists as a means of discriminating the type of malarial parasite, but conventionally, it has been practiced to observe the shape of the nucleus by Giemsa staining in principle. However, this method has problems such as being prone to misdiagnosis when staining is insufficient. On the other hand, if the nucleic acid detection method according to the present technology is applied to the means for discriminating the type of malaria parasite, conventional staining reagents are not required, so that the staining operation is simple and the cleaning operation is not necessary. It is possible to make a diagnosis of malaria etc.
(4)微小粒子の解析
細胞やビーズなどの微小粒子を含む液状サンプルを用いて、これら細胞やビーズなどの粒子に内包あるいは固定化された核酸を検出する場合、粒子は静止した状態であってもよいが、マイクロ流路中に通流させた状態であってもよい。例えば、液状サンプルをシース流とともにフローセル内に導入して、液体サンプルをシース流で挟み込みラミナフローを形成し、そのフローセル中を流れる粒子が発する蛍光を検出できる。このようなフローセルの構造としては、フローサイトメトリー技術として広く研究開発及び実用化がなされているものを用いることができる。 (4) Analysis of microparticles When a liquid sample containing microparticles such as cells and beads is used to detect nucleic acid encapsulated or immobilized in the particles such as cells or beads, the particles are in a stationary state. Although it may be, it may be in a state of flowing in the microchannel. For example, a liquid sample can be introduced into a flow cell together with a sheath flow, and the liquid sample can be sandwiched by the sheath flow to form a laminar flow, and fluorescence emitted by particles flowing through the flow cell can be detected. As such a flow cell structure, one that has been widely researched, developed, and put in practical use as a flow cytometry technique can be used.
細胞やビーズなどの微小粒子を含む液状サンプルを用いて、これら細胞やビーズなどの粒子に内包あるいは固定化された核酸を検出する場合、粒子は静止した状態であってもよいが、マイクロ流路中に通流させた状態であってもよい。例えば、液状サンプルをシース流とともにフローセル内に導入して、液体サンプルをシース流で挟み込みラミナフローを形成し、そのフローセル中を流れる粒子が発する蛍光を検出できる。このようなフローセルの構造としては、フローサイトメトリー技術として広く研究開発及び実用化がなされているものを用いることができる。 (4) Analysis of microparticles When a liquid sample containing microparticles such as cells and beads is used to detect nucleic acid encapsulated or immobilized in the particles such as cells or beads, the particles are in a stationary state. Although it may be, it may be in a state of flowing in the microchannel. For example, a liquid sample can be introduced into a flow cell together with a sheath flow, and the liquid sample can be sandwiched by the sheath flow to form a laminar flow, and fluorescence emitted by particles flowing through the flow cell can be detected. As such a flow cell structure, one that has been widely researched, developed, and put in practical use as a flow cytometry technique can be used.
(5)Lab-On-Chipへの適用
本技術に係る核酸検出方法は、マイクロ流路チップなどの容器内においてサンプルの処理や検出などを行う、Lab-On-Chipの中に組み込むことが可能である。この場合、当該容器中に、使用目的に応じてサンプル前処理工程を導入し組み合わせることによって、より利便性を高めることができる。 (5) Application to Lab-On-Chip The nucleic acid detection method according to the present technology can be incorporated into Lab-On-Chip, which performs sample processing, detection, etc. in a container such as a microchannel chip. It is. In this case, the convenience can be further enhanced by introducing and combining sample pretreatment steps according to the purpose of use in the container.
本技術に係る核酸検出方法は、マイクロ流路チップなどの容器内においてサンプルの処理や検出などを行う、Lab-On-Chipの中に組み込むことが可能である。この場合、当該容器中に、使用目的に応じてサンプル前処理工程を導入し組み合わせることによって、より利便性を高めることができる。 (5) Application to Lab-On-Chip The nucleic acid detection method according to the present technology can be incorporated into Lab-On-Chip, which performs sample processing, detection, etc. in a container such as a microchannel chip. It is. In this case, the convenience can be further enhanced by introducing and combining sample pretreatment steps according to the purpose of use in the container.
核酸の検出や配列解析のためのサンプル前処理工程として、例えば核酸の抽出や、分離、増幅などを挙げることができる。より具体的には、例えば電気泳動、ゲル濾過カラム及び吸着カラムなどによる分離や、PCR反応などによる増幅などが挙げられる。これらの手段をマイクロチップ中に込みこむことは、既知の技術によって行うことができる。
Examples of sample pretreatment steps for nucleic acid detection and sequence analysis include nucleic acid extraction, separation, amplification and the like. More specifically, separation by electrophoresis, gel filtration column, adsorption column, etc., amplification by PCR reaction, etc. may be mentioned. The incorporation of these means into the microchip can be performed by known techniques.
あるいは、細胞に含まれる核などの観察、検出、解析などのためのサンプル前処理工程として、例えば特定の細胞の選別、濃縮を挙げることができる。特定の細胞を選別ないし濃縮する手段としては、細胞の種類によって異なる性質、例えば大きさ、比重、頑丈さ、抗体など特定物質への結合力など、を利用する方法を採用できる。一例として、観察したい細胞もしくは観察対象から除外したい細胞に対して特異的に結合する抗体を容器内面ないしビーズなどに固定化しておき、当該抗体への結合の有無を利用して細胞を選別ないし濃縮することができる。また、例えば、磁性体の微粒子に抗体が固定化されたものを用意し、磁気を用いてその磁性体が結合した細胞のみ、もしくは磁性体が結合していない細胞のみを選別することも可能である。さらに、例えば、例えばサンプルを適当な浸透圧変化や酸、アルカリなどの条件下に置くことで、赤血球のみを破壊し取り除いて、白血球のみを選別することもできる。他の例として、例えば、ヒト血液中のマラリア原虫を観察する場合において、マラリア原虫が感染した赤血球は、その赤血球内にヘモゾインと呼ばれる磁性体が形成されることが以前より知られており、このような赤血球を磁気によって分離、濃縮することが可能である。この方法を本技術に係る核酸検出方法と組み合わせることで、簡便かつ確実にマラリア原虫を観察することが可能となる。
Alternatively, as a sample pretreatment step for observation, detection, analysis and the like of nuclei contained in cells, for example, sorting and concentration of specific cells can be mentioned. As a means for selecting or concentrating specific cells, methods utilizing properties which differ depending on the type of cells, such as size, specific gravity, robustness, binding ability to specific substances such as antibodies, etc. can be employed. As an example, an antibody that specifically binds to a cell to be observed or a cell to be excluded from observation is immobilized on the inner surface of a container or on a bead, and cells are sorted or concentrated using the presence or absence of binding to the antibody. can do. Also, for example, it is possible to prepare a magnetic particle in which an antibody is immobilized, and use magnetism to sort only cells to which the magnetic particle is bound or only cells to which the magnetic particle is not bound. is there. Furthermore, for example, by placing the sample under conditions such as appropriate osmotic pressure change, acid, alkali, etc., only red blood cells can be destroyed and removed, and only white blood cells can be sorted. As another example, when observing malaria parasites in human blood, for example, red blood cells infected with malaria parasites have long been known to form a magnetic substance called hemozoin in the red blood cells. It is possible to magnetically separate and concentrate such red blood cells. By combining this method with the nucleic acid detection method according to the present technology, malaria parasites can be observed easily and reliably.
〈B〉蛍光色素
次に、本技術に係る蛍光体について具体的に説明する。 <B> Fluorescent dye Next, the phosphor according to the present technology will be specifically described.
次に、本技術に係る蛍光体について具体的に説明する。 <B> Fluorescent dye Next, the phosphor according to the present technology will be specifically described.
蛍光顕微鏡やフローサイトメーター、遺伝子増幅反応、遺伝子シーケンシング反応、タンパク質など生体分子の定量、タンパク質など生体分子同士の結合能の計測などの目的で、細胞や組織、生体分子などを観察、解析するため、フルオロセインやフィコエリスリンなど様々な色の蛍光を発する色素が利用されている。これら蛍光色素は、その色素が結合した生体分子の局在について情報を得るほか、例えば色素を抗体や核酸プローブなどに結合させることで、抗体や核酸プローブが識別する対象分子の所在や量について情報を得るためのツールとして用いられる。蛍光色素の色を数多く用意できると、より多くの対象分子について解析を行うことができる。
Observe and analyze cells, tissues, biomolecules, etc. for the purpose of fluorescence microscopy, flow cytometer, gene amplification reaction, gene sequencing reaction, quantification of biomolecules such as proteins, and measurement of the binding ability of biomolecules such as proteins. Therefore, dyes that fluoresce various colors such as fluorescein and phycoerythrin are used. These fluorescent dyes obtain information on the localization of the biomolecule to which the dye is bound, and for example, by binding the dye to an antibody, a nucleic acid probe or the like, information on the location or amount of the target molecule that the antibody or nucleic acid probe identifies Used as a tool to obtain If a large number of fluorescent dye colors can be prepared, analysis can be performed on more target molecules.
上述した本技術に係る核酸検出方法の技術を用いることで、様々なスペクトルの蛍光体を形成できる。すなわち、核酸と銅との複合体は、核酸の塩基配列及び長さに依存して異なるスペクトルや異なる強度の蛍光を発する。核酸と銅との複合体のこの性質を利用することで、該複合体を様々なスペクトルを発する蛍光体として用いることができ、例えば抗体にラベルされる蛍光色素として用いることができる。
By using the technology of the nucleic acid detection method according to the present technology described above, phosphors of various spectra can be formed. That is, the complex of nucleic acid and copper emits different spectra and different intensities of fluorescence depending on the base sequence and length of the nucleic acid. By using this property of a complex of nucleic acid and copper, the complex can be used as a phosphor emitting various spectra, for example, as a fluorescent dye labeled to an antibody.
本技術に係る核酸の検出方法は以下のような構成をとることもできる。
(1)核酸を含むサンプルを銅と接触させる手順と、前記サンプルから発せられる蛍光を検出する検出手順と、を含む前記核酸の検出方法。
(2)前記検出手順において検出された蛍光の強度及び/又はスペクトルに基づいて、前記核酸の塩基配列を解析する上記(1)記載の検出方法。
(3)前記検出手順において検出された蛍光の強度及び/又はスペクトルに基づいて、前記核酸が形成する二本鎖中のミスマッチを解析する上記(1)記載の検出方法。
(4)前記サンプルをバイサルフェート処理する手順を含み、前記検出手順においてバイサルフェート処理前のサンプルから検出された蛍光の強度及び/又はスペクトルと、バイサルフェート処理後のサンプルから検出された蛍光の強度及び/又はスペクトルと、の差分に基づいて、前記核酸におけるシトシンのメチル化を解析する上記(1)記載の検出方法。
(5)前記銅は、固形の銅である上記(1)~(4)のいずれかに記載の検出方法。
(6)前記接触手順は、塩の共存下で前記サンプルと銅とを接触させる手順である上記(1)~(5)のいずれかに記載の検出方法。
(7)前記検出手順は、波長300~420μmの光を前記サンプルに照射することにより、サンプルから発せられる蛍光を検出する手順である上記(1)~(6)のいずれかに記載の検出方法。 The nucleic acid detection method according to the present technology can also be configured as follows.
(1) A method for detecting a nucleic acid comprising the steps of: contacting a sample containing nucleic acid with copper; and detecting the fluorescence emitted from the sample.
(2) The detection method according to the above (1), wherein the base sequence of the nucleic acid is analyzed based on the intensity and / or spectrum of the fluorescence detected in the detection procedure.
(3) The detection method according to the above (1), wherein a mismatch in the double strand formed by the nucleic acid is analyzed based on the intensity and / or spectrum of the fluorescence detected in the detection procedure.
(4) A procedure for bisulfate treatment of the sample, wherein the intensity and / or spectrum of fluorescence detected from the sample before bisulfate treatment in the detection procedure and the intensity of fluorescence detected from the sample after bisulfate treatment The detection method according to the above (1), wherein the methylation of cytosine in the nucleic acid is analyzed based on the difference with the spectrum and / or the spectrum.
(5) The method according to any one of the above (1) to (4), wherein the copper is solid copper.
(6) The method according to any one of the above (1) to (5), wherein the contacting step is a step of contacting the sample with copper in the coexistence of a salt.
(7) The detection method according to any one of (1) to (6), wherein the detection step is a step of detecting fluorescence emitted from a sample by irradiating the sample with light having a wavelength of 300 to 420 μm. .
実施例1では、Cu(II)イオンをアスコルビン酸で還元することでCu(I)イオンを発生させた溶液中に核酸を混合すると、一定の条件下にて紫外線照射に対してオレンジ色の蛍光が発せられることを示した。
In Example 1, when nucleic acid is mixed in a solution in which Cu (I) ions are generated by reducing Cu (II) ions with ascorbic acid, orange fluorescence is generated against ultraviolet irradiation under certain conditions. Was shown to be emitted.
<材料と方法>
銅:CuSO4水溶液と(+)-Sodium L-ascorbate(以下、「S.A.」と表記する)は、Sigma-Aldrichより購入した。
核酸:BioDynamics laboratory Inc. (Tokyo, Japan)より購入したSonicated Salmon Sperm DNA(以下、「ssDNA」と表記する)を用いた。また、オリゴDNAには、Invitrogen社より購入したカスタムオリゴを用いた。
緩衝液(バッファー):DOJINDO Laboratories(Kumamoto, Japan)より購入したHEPPSOを、メーカー提供のプロトコルに準じてpH8.5に調製して用いた。
蛍光測定器:NanoDrop 3300(Thermo Fisher Scientific, Inc., Waltham, MA, USA)又はF-4500形分光蛍光光度計(株式会社日立ハイテクノロジーズ)を用いた。NanoDrop 3300の励起光にはUV LED光源を用い、励起光で励起した際の蛍光スペクトルを計測した。付属のソフトウェアを用いて、スペクトル強度が最大となる波長でのRelative Fluorescence Units(RFU)をピークRFU値として取得した。F-4500形分光蛍光光度計には、Helix Biomedical Accessories, Inc.社製の石英キャピラリーと専用アダプターセルを使用した。なお以下で特に断りがない場合は、NanoDrop3300を使用した。
吸光測定器:NanoDrop 1000 Spectrophotometerを用いて吸収スペクトルを計測した。
サンプル調製と蛍光測定:50mMのHEPPSOバッファーに、塩化ナトリウム(250mM)、CuSO4(0~4mM)、S.A.(4, 50mM)、ssDNA(1mg/ml)あるいはオリゴDNA(50, 250, 500μM)を混合してサンプル20μlとした。なお、S.A.は混合液中においてCuSO4から生じるCu(II)イオンをCu(I)イオンに還元する作用を有することが知られている(非特許文献31参照)。 <Materials and Methods>
Copper: CuSO 4 aqueous solution and (+)-Sodium L-ascorbate (hereinafter referred to as “SA”) were purchased from Sigma-Aldrich.
Nucleic acid: Sonicated Salmon Sperm DNA (hereinafter referred to as "ssDNA") purchased from BioDynamics laboratory Inc. (Tokyo, Japan) was used. In addition, as oligo DNA, a custom oligo purchased from Invitrogen was used.
Buffer solution (HEPPSO) purchased from DOJINDO Laboratories (Kumamoto, Japan) was adjusted to pH 8.5 and used according to the protocol provided by the manufacturer.
Fluorometer: NanoDrop 3300 (Thermo Fisher Scientific, Inc., Waltham, Mass., USA) or F-4500 spectrofluorimeter (Hitachi High-Technologies Corporation) was used. A UV LED light source was used as the excitation light of the NanoDrop 3300, and the fluorescence spectrum when excited with the excitation light was measured. Using the attached software, the relative fluorescence units (RFU) at the wavelength at which the spectral intensity is maximum were obtained as peak RFU values. For the F-4500 spectrofluorometer, a quartz capillary manufactured by Helix Biomedical Accessories, Inc. and a dedicated adapter cell were used. In the following, NanoDrop 3300 was used unless otherwise noted.
Absorbance meter: The absorption spectrum was measured using aNanoDrop 1000 Spectrophotometer.
Sample preparation and fluorescence measurement: sodium chloride (250 mM), CuSO 4 (0-4 mM), SA (4, 50 mM), ssDNA (1 mg / ml) or oligo DNA (50, 250, 500 μM) in 50 mM HEPPSO buffer Mix to make 20 μl of sample. It is known that SA has the function of reducing Cu (II) ions generated from CuSO 4 into Cu (I) ions in a mixed solution (see Non-Patent Document 31).
銅:CuSO4水溶液と(+)-Sodium L-ascorbate(以下、「S.A.」と表記する)は、Sigma-Aldrichより購入した。
核酸:BioDynamics laboratory Inc. (Tokyo, Japan)より購入したSonicated Salmon Sperm DNA(以下、「ssDNA」と表記する)を用いた。また、オリゴDNAには、Invitrogen社より購入したカスタムオリゴを用いた。
緩衝液(バッファー):DOJINDO Laboratories(Kumamoto, Japan)より購入したHEPPSOを、メーカー提供のプロトコルに準じてpH8.5に調製して用いた。
蛍光測定器:NanoDrop 3300(Thermo Fisher Scientific, Inc., Waltham, MA, USA)又はF-4500形分光蛍光光度計(株式会社日立ハイテクノロジーズ)を用いた。NanoDrop 3300の励起光にはUV LED光源を用い、励起光で励起した際の蛍光スペクトルを計測した。付属のソフトウェアを用いて、スペクトル強度が最大となる波長でのRelative Fluorescence Units(RFU)をピークRFU値として取得した。F-4500形分光蛍光光度計には、Helix Biomedical Accessories, Inc.社製の石英キャピラリーと専用アダプターセルを使用した。なお以下で特に断りがない場合は、NanoDrop3300を使用した。
吸光測定器:NanoDrop 1000 Spectrophotometerを用いて吸収スペクトルを計測した。
サンプル調製と蛍光測定:50mMのHEPPSOバッファーに、塩化ナトリウム(250mM)、CuSO4(0~4mM)、S.A.(4, 50mM)、ssDNA(1mg/ml)あるいはオリゴDNA(50, 250, 500μM)を混合してサンプル20μlとした。なお、S.A.は混合液中においてCuSO4から生じるCu(II)イオンをCu(I)イオンに還元する作用を有することが知られている(非特許文献31参照)。 <Materials and Methods>
Copper: CuSO 4 aqueous solution and (+)-Sodium L-ascorbate (hereinafter referred to as “SA”) were purchased from Sigma-Aldrich.
Nucleic acid: Sonicated Salmon Sperm DNA (hereinafter referred to as "ssDNA") purchased from BioDynamics laboratory Inc. (Tokyo, Japan) was used. In addition, as oligo DNA, a custom oligo purchased from Invitrogen was used.
Buffer solution (HEPPSO) purchased from DOJINDO Laboratories (Kumamoto, Japan) was adjusted to pH 8.5 and used according to the protocol provided by the manufacturer.
Fluorometer: NanoDrop 3300 (Thermo Fisher Scientific, Inc., Waltham, Mass., USA) or F-4500 spectrofluorimeter (Hitachi High-Technologies Corporation) was used. A UV LED light source was used as the excitation light of the NanoDrop 3300, and the fluorescence spectrum when excited with the excitation light was measured. Using the attached software, the relative fluorescence units (RFU) at the wavelength at which the spectral intensity is maximum were obtained as peak RFU values. For the F-4500 spectrofluorometer, a quartz capillary manufactured by Helix Biomedical Accessories, Inc. and a dedicated adapter cell were used. In the following, NanoDrop 3300 was used unless otherwise noted.
Absorbance meter: The absorption spectrum was measured using a
Sample preparation and fluorescence measurement: sodium chloride (250 mM), CuSO 4 (0-4 mM), SA (4, 50 mM), ssDNA (1 mg / ml) or oligo DNA (50, 250, 500 μM) in 50 mM HEPPSO buffer Mix to make 20 μl of sample. It is known that SA has the function of reducing Cu (II) ions generated from CuSO 4 into Cu (I) ions in a mixed solution (see Non-Patent Document 31).
<結果>
ssDNAについて、S.A.濃度50mMの条件下でCuSO4の濃度を変化させて取得された蛍光スペクトル及びRFU値を、図1及び図2にそれぞれ示す。(A)は蛍光スペクトルを示し、(B)はピークRFU値を示す。 <Result>
For ssDNA, fluorescence spectra and RFU values obtained by changing the concentration of CuSO 4 under the condition of 50 mM SA concentration are shown in FIG. 1 and FIG. 2 respectively. (A) shows a fluorescence spectrum, (B) shows a peak RFU value.
オリゴDNAについて、CuSO4濃度0.4mM、S.A.濃度4mMの条件下で取得された蛍光スペクトルを、図3及び図4に示す。オリゴDNA濃度は、20, 10, 6, 3塩基長のものについてそれぞれ50, 50, 250, 500μM, とした。図3は、配列番号1~6に記載の塩基配列からなるオリゴDNAの結果を示す。横軸は波長を示し、(A)の縦軸は各波長でのRFU値、(B)の縦軸は各波長でのRFU値をRFUの最大値で除した値を示す。図4は、配列番号2に記載の塩基配列からなるオリゴDNA(以下、T(20)と表記する)の結果(A)、配列番号10に記載の塩基配列からなるオリゴDNA(T(6))の結果(B)、配列番号12に記載の塩基配列からなるオリゴDNA(T(3))の結果(C)、配列番号11に記載の塩基配列からなるオリゴDNA(A(3))の結果(D)を示す。横軸は波長を示し、縦軸は各波長でのRFU値を示す。
The fluorescence spectra obtained for the oligo DNA under conditions of CuSO 4 concentration 0.4 mM and SA concentration 4 mM are shown in FIG. 3 and FIG. The oligo DNA concentrations were 50, 50, 250 and 500 μM, respectively, for those of 20, 10, 6, and 3 bases long. FIG. 3 shows the results of oligo DNAs consisting of the nucleotide sequences set forth in SEQ ID NOS: 1-6. The horizontal axis indicates the wavelength, the vertical axis of (A) indicates the RFU value at each wavelength, and the vertical axis of (B) indicates the RFU value at each wavelength divided by the maximum value of RFU. FIG. 4 shows the result (A) of the oligo DNA consisting of the nucleotide sequence of SEQ ID NO: 2 (hereinafter referred to as T (20)), the oligo DNA consisting of the nucleotide sequence of SEQ ID NO: 10 (T (6) B) results of oligo DNA (T (3)) consisting of the nucleotide sequence of SEQ ID NO: 12 (C), of oligo DNA (A (3)) consisting of the nucleotide sequence of SEQ ID NO: 11 The results (D) are shown. The horizontal axis indicates the wavelength, and the vertical axis indicates the RFU value at each wavelength.
図に示されるように、核酸の塩基配列に依存して蛍光スペクトルのパターン(ピーク波長や強度)が変化していることが確認された。
As shown in the figure, it was confirmed that the pattern (peak wavelength or intensity) of the fluorescence spectrum was changed depending on the base sequence of the nucleic acid.
次に、T(20)、T(6)、T(3)のオリゴDNAについて、CuSO4濃度0.4mM、S.A.濃度4mMの条件下で蛍光スペクトル及び吸収スペクトルの経時変化を測定した。S.A.の添加は、初回の蛍光スペクトル及び吸収スペクトルの測定直前に行い、その後、8, 14, 24, 35分後に蛍光スペクトルあるいは吸収スペクトルの測定を行った。結果を図5及び図6に示す。図5上段は縦軸をRFU値(絶対値)とした蛍光スペクトル、中段は縦軸をRFU値(相対値)とした蛍光スペクトル、下段は吸収スペクトルを示す。図6は、ピークRFU値の経時変化(A)と、波長346nmにおける吸光度の経時変化(B)を示す。
Next, with respect to oligo DNAs of T (20), T (6) and T (3), the time-dependent changes of fluorescence spectrum and absorption spectrum were measured under the conditions of CuSO 4 concentration 0.4 mM and SA concentration 4 mM. The addition of SA was performed immediately before the measurement of the first fluorescence spectrum and absorption spectrum, and thereafter, the measurement of the fluorescence spectrum or absorption spectrum was performed after 8, 14, 24, 35 minutes. The results are shown in FIG. 5 and FIG. The upper part of FIG. 5 shows the fluorescence spectrum with the RFU value (absolute value) on the vertical axis, the fluorescence spectrum with the RFU value (relative value) on the vertical axis and the absorption spectrum. FIG. 6 shows the time-dependent change (A) of the peak RFU value and the time-dependent change (B) of the absorbance at a wavelength of 346 nm.
図に示されるように、T(20)、T(6)、T(3)の全てのオリゴDNAで、30分を経過後、蛍光がほとんど消失した。特に、塩基長が短いオリゴDNAでは、蛍光の消失が早かった。35分後の蛍光スペクトルの測定直後に、サンプルに44mMのS.A.溶液を1.8μl再添加し測定を行ったところ、蛍光を再度検出できた。このことから、蛍光の消失は、Cu(I)イオンのCu(II)イオンへの酸化によるものと考えられた。なお、T(6)及びT(3)のオリゴDNAの蛍光スペクトルでは、ピーク強度の減少とともに、短波長側に新たなピークの出現がみられた。
As shown in the figure, in all oligo DNAs of T (20), T (6) and T (3), the fluorescence almost disappeared after 30 minutes. In particular, in the case of an oligo DNA having a short base length, the fluorescence disappeared quickly. Immediately after the measurement of the fluorescence spectrum after 35 minutes, 1.8 μl of 44 mM SA solution was re-added to the sample and measurement was performed, and the fluorescence could be detected again. From this, it is considered that the disappearance of the fluorescence is due to the oxidation of Cu (I) ion to Cu (II) ion. In the fluorescence spectra of T (6) and T (3) oligo DNAs, appearance of a new peak on the short wavelength side was observed along with the decrease in peak intensity.
一方、各オリゴDNAの吸光スペクトルについても経時的にピーク強度の減少が認められた。吸光スペクトルの減衰は、蛍光スペクトルの減衰に比して緩徐であった。
On the other hand, a decrease in peak intensity was also observed with time for the absorption spectrum of each oligo DNA. The decay of the absorption spectrum was slow relative to the decay of the fluorescence spectrum.
T(20)、T(6)、T(3)のオリゴDNAについて、F-4500形分光蛍光光度計で取得した2次元蛍光スペクトルを、それぞれ図7(A)~(C)に示す。また、図8に、各オリゴDNAでの励起スペクトル(破線)と蛍光スペクトル(実線)を示す。スペクトルの測定は、蛍光波長については1nm間隔、励起波長については2nm間隔で行った。
The two-dimensional fluorescence spectra obtained with the F-4500 spectrofluorimeter for the oligo DNAs of T (20), T (6) and T (3) are shown in FIGS. 7 (A) to (C), respectively. Further, FIG. 8 shows an excitation spectrum (broken line) and a fluorescence spectrum (solid line) of each oligo DNA. The spectrum was measured at 1 nm intervals for the fluorescence wavelength and at 2 nm intervals for the excitation wavelength.
図に示されるように、オリゴDNAの塩基長に依存して蛍光スペクトルのパターンが異なることが確認される。また、励起スペクトルについても、塩基長に依存してパターンが異なっていることが確認された。
As shown in the figure, it is confirmed that the patterns of fluorescence spectra differ depending on the base length of the oligo DNA. In addition, it was also confirmed that the excitation spectra had different patterns depending on the base length.
塩基配列とスペクトルとの関係をさらに調べるため、配列番号11~18に記載する、アデニン(A)及びチミン(T)の組み合わせによってなる3塩基長の配列からなるオリゴDNAについて、蛍光の計測実験を行った。結果を、図9及び図10に示す。図9の横軸は波長を示し、(A)の縦軸はNanodropで計測した各波長でのRFU値、(B)の縦軸は各波長でのRFU値をRFUの最大値で除した値を示す。図10には、RFUの最大値及びピーク波長を3回計測して得た平均値及び標準誤差を示す。
In order to further investigate the relationship between the base sequence and the spectrum, the fluorescence measurement experiment was carried out for the oligo DNA consisting of a 3-base sequence consisting of a combination of adenine (A) and thymine (T) described in SEQ ID NO: 11 to 18 went. The results are shown in FIG. 9 and FIG. The horizontal axis of FIG. 9 represents the wavelength, the vertical axis of (A) represents the RFU value at each wavelength measured by Nanodrop, and the vertical axis of (B) represents the RFU value at each wavelength divided by the maximum value of RFU Indicates FIG. 10 shows the average value and the standard error obtained by measuring the maximum value and peak wavelength of RFU three times.
図に示されるように、オリゴDNAの塩基配列によって蛍光の強度やピーク波長が変化することが確認された。
As shown in the figure, it was confirmed that the intensity and peak wavelength of fluorescence change depending on the base sequence of the oligo DNA.
配列番号19及び配列番号20に記載する配列からなるオリゴDNAについて同様の計測を行った結果を、図11に示す。ウラシル(U)を含む配列番号20に記載する配列からなるオリゴDNAでは、チミン(T)のみを含む配列番号19に記載する配列からなるオリゴDNAと比較して、蛍光強度が微弱であるものの、類似のスペクトル形状及びピーク位置の蛍光を発することが確認された。
The result of the same measurement performed on the oligo DNA consisting of the sequence described in SEQ ID NO: 19 and SEQ ID NO: 20 is shown in FIG. In the oligo DNA consisting of the sequence described in SEQ ID NO: 20 containing uracil (U), the fluorescence intensity is weak compared to the oligo DNA consisting of the sequence described in SEQ ID NO: 19 containing only thymine (T), It was confirmed to emit fluorescence of similar spectral shape and peak position.
<考察>
本実施例では、CuSO4とS.A.を混合した、塩化ナトリウムを含むHEPPSOバッファー溶液中にDNAを混合すると、紫外線照射によって波長500nm~700nm程度のオレンジ色の蛍光が観察されることを示した。また、蛍光の強度はCuSO4濃度に依存し、蛍光強度及びスペクトルは核酸の塩基配列による影響も受けることが確認された。 <Discussion>
In this example, when DNA was mixed in a HEPPSO buffer solution containing sodium chloride mixed with CuSO 4 and SA, it was shown that orange fluorescence with a wavelength of about 500 nm to 700 nm was observed by ultraviolet irradiation. Further, it was confirmed that the fluorescence intensity depends on the CuSO 4 concentration, and the fluorescence intensity and the spectrum are also influenced by the base sequence of the nucleic acid.
蛍光は少なくともチミン(T)、アデニン(A)もしくはウラシル(U)を含むオリゴDNAより確認された。また、チミン(T)とアデニン(A)よりなる3塩基長のオリゴDNAを用いた実験からは、いずれの配列からも蛍光は観察され、しかもその蛍光強度及びスペクトルには、チミン(T)ないしアデニン(A)の量のみでなく、それらのオリゴDNA上における位置(配列順序)も影響することが示された。
The fluorescence was confirmed from oligo DNA containing at least thymine (T), adenine (A) or uracil (U). In addition, from the experiment using a 3-base oligo DNA consisting of thymine (T) and adenine (A), fluorescence was observed from any sequence, and in the fluorescence intensity and spectrum, thymine (T) to It was shown that not only the amount of adenine (A) but also the position (sequence order) on their oligo DNA was affected.
また、S.A.添加後に時間が経過すると、蛍光強度は経時的に減衰したが、これはS.A.再添加により回復した。ところでCu(I)イオンは酸素存在下では非常に不安定で、S.A.による還元の効果が消えると速やかにCu(II)や固形の銅に変化する。このことから、蛍光は、Cu(I)イオンと核酸との複合体から発生するものであると考えられた。また、銅と核酸との作用による蛍光を検出するためには、反応溶液と空気中の酸素との接触を極力避けることが望ましいと考えられた。
In addition, as time elapsed after the S.A. addition, the fluorescence intensity decayed with time, but this was recovered by the S.A. readdition. By the way, Cu (I) ion is very unstable in the presence of oxygen, and changes rapidly to Cu (II) or solid copper when the effect of reduction by S.A. disappears. From this, it was considered that the fluorescence was generated from a complex of Cu (I) ion and nucleic acid. Moreover, in order to detect the fluorescence by the effect | action of copper and a nucleic acid, it was thought that it was desirable to avoid the contact with the reaction solution and oxygen in air as much as possible.
実施例2では、核酸を含む水溶液と固体の銅とを接触させると、一定条件の下で紫外線照射に対し、実施例1で観察されたのと同様のオレンジ色の蛍光が発せられることを示した。
Example 2 shows that when an aqueous solution containing nucleic acid is brought into contact with solid copper, orange fluorescence similar to that observed in Example 1 is emitted under ultraviolet irradiation under constant conditions. The
<方法と材料>
核酸に接触させる銅として、和光純薬工業株式会社製の銅粉末(Copper, Powder, -75um, 99.9% / Cat.No.030-18352 / Wako Pure Chemical Industries, Ltd., Osaka, Japan)を用いた。
RNAとしては、Rat Brain Total RNA (Cat.No.636622, Takara Bio Inc., Otsu, Japan)を使用し、これをDEPC treated water (Cat.No.312-90201/Wako Pure Chemical Industries, Ltd., Japan)に溶解したものを用いた。
PIPES, ACES, BES, TAPSO, HEPPSO, EPPS, TAPS, CAPS, TES, Tricine及びPOPSOはDOJINDO Laboratories(Kumamoto, Japan)より購入したものを用い、メーカー提供のプロトコルに準じてpHを調整して用いた。その他の試薬は実施例1と同じものを用いた。 <Method and Materials>
Copper powder (Copper, Powder, -75um, 99.9% / Cat. No. 030-18352 / Wako Pure Chemical Industries, Ltd., Osaka, Japan) manufactured by Wako Pure Chemical Industries, Ltd. is used as copper to be brought into contact with nucleic acid It was.
As RNA, Rat Brain Total RNA (Cat. No. 636622, Takara Bio Inc., Otsu, Japan) is used, and this is used as DEPC treated water (Cat. No. 312-90201 / Wako Pure Chemical Industries, Ltd., Dissolved in Japan) was used.
PIPES, ACES, BES, TAPSO, HEPPSO, EPPS, TAPS, CAPS, TES, Tricine and POPSO were purchased from DOJINDO Laboratories (Kumamoto, Japan) and adjusted to pH according to the protocol provided by the manufacturer. . The other reagents were the same as in Example 1.
核酸と銅との接触は、総量40マイクロリットルの水溶液中に、各種の核酸、塩、及び銅粉末を混合し、15分間攪拌することにより行った。加えた銅粉末の量は、特に断りがない限り水溶液1mlに対して375mgとした。また塩の量は、特に断りがなければ500mMの塩化ナトリウム(NaCl)とした。
The contact between the nucleic acid and copper was carried out by mixing various nucleic acids, salts and copper powder in a total solution of 40 microliters and stirring for 15 minutes. The amount of copper powder added was 375 mg to 1 ml of aqueous solution unless otherwise noted. Also, the amount of salt was 500 mM sodium chloride (NaCl) unless otherwise noted.
サンプルを遠心機にかけて銅粉末を沈殿させた後、その上清について蛍光のスペクトルと強度の計測を行った。蛍光スペクトルと強度の測定は、実施例1と同様の手順で行った。
The sample was centrifuged to precipitate copper powder, and the fluorescence spectrum and intensity were measured on the supernatant. The measurement of the fluorescence spectrum and the intensity was performed in the same manner as in Example 1.
<結果>
1.5 mg/mlのssDNAを加えた反応溶液について、蛍光測定を3回行った結果を図12に示す(横軸:波長、縦軸:RFU)。図に示されるように、核酸を含むサンプルを固形の銅と接触させた後にUV励起すると、サンプルから600nm付近をピークとする蛍光が検出できた。 <Result>
The result of performing fluorescence measurement three times on a reaction solution to which 1.5 mg / ml ssDNA was added is shown in FIG. 12 (horizontal axis: wavelength, vertical axis: RFU). As shown in the figure, when the sample containing nucleic acid was brought into contact with solid copper and then UV excited, fluorescence peaking around 600 nm from the sample could be detected.
次に、銅粉末の量を反応液1mLに対して375mg、250mg、125 mg、62.5 mg、37.5 mg、12.5 mg及び0 mgとした反応溶液に1.5 mg/mlのssDNAを加え、蛍光測定を3回行った結果を図13に示す。図に示されるように、蛍光強度は、銅粉末の量に依存した。本実施例で用いたCu粉末では、37.5 mg/ml以上の量があれば明白な蛍光が観察された。一方、12.5 mg/ml以下では明白な蛍光は確認されなかった。
Next, 1.5 mg / ml of ssDNA was added to the reaction solution in which the amount of copper powder was 375 mg, 250 mg, 125 mg, 62.5 mg, 37.5 mg, 12.5 mg and 0 mg per 1 mL of the reaction solution, and the fluorescence measurement was 3 The results of the round are shown in FIG. As shown in the figure, the fluorescence intensity was dependent on the amount of copper powder. In the Cu powder used in this example, clear fluorescence was observed when the amount was 37.5 mg / ml or more. On the other hand, no apparent fluorescence was confirmed at 12.5 mg / ml or less.
続いて、反応溶液中の塩の種類及び濃度を変更し、1.5 mg/mlのssDNAを加えた場合に検出される蛍光強度を比較した。結果を図14に示す。(A)は濃度0.5、0.25、0.1、0.05、0.025、0Mの塩化ナトリウム(NaCl)を添加した反応溶液で検出された蛍光の強度を示す。(B)は0.45M塩化ナトリウム(NaCl)、0.45M塩化カリウム(KCl)、0.45M塩化マグネシウム(MgCl2)及び45%エタノール(EtOH)を添加した反応溶液で検出された蛍光の強度を示す。蛍光強度は604nmにおけるRFUを示し、各々3回ずつ測定を行った結果の平均及び標準誤差を図示した。図に示されるように、蛍光強度は、塩化ナトリウム濃度に依存した。また、塩化ナトリウムのほか、塩化カリウムや塩化マグネシウムを共存させた場合においても、蛍光が検出された。
Subsequently, the type and concentration of salt in the reaction solution were changed, and the fluorescence intensities detected when 1.5 mg / ml ssDNA was added were compared. The results are shown in FIG. (A) shows the intensity of fluorescence detected in a reaction solution to which sodium chloride (NaCl) at a concentration of 0.5, 0.25, 0.1, 0.05, 0.025, 0 M was added. (B) shows the intensity of fluorescence detected in a reaction solution to which 0.45 M sodium chloride (NaCl), 0.45 M potassium chloride (KCl), 0.45 M magnesium chloride (MgCl 2) and 45% ethanol (EtOH) were added. The fluorescence intensity shows the RFU at 604 nm, and the mean and standard error of the results of three measurements each are shown. As shown in the figure, the fluorescence intensity was dependent on sodium chloride concentration. Moreover, fluorescence was detected also when potassium chloride and magnesium chloride were made to coexist in addition to sodium chloride.
図15には、反応溶液に添加する核酸濃度を変化させた場合に検出される蛍光強度を比較した結果を示す。(A)は、反応液中に5、2.5、1、0.5、0.25、0.1、0.05、0 mg/mlのssDNAを加えて検出された蛍光の強度を示す。(B)は、反応液中に2.5、0.25、0 mg/mlのRNA加えて検出された蛍光の強度を示す。横軸は核酸濃度を示し、縦軸は蛍光波長604nmにおけるRFUを示す。計測は3回行った。なお、塩化ナトリウム(NaCl)濃度は0.25M、銅粉末の量は1mlに対して200mgの割合とし、以下の実験でも特に断りがなければこの条件を用いた。図に示されるように、蛍光強度は、DNA濃度及びRNA濃度に依存した。
FIG. 15 shows the results of comparison of fluorescence intensities detected when the concentration of nucleic acid added to the reaction solution is changed. (A) shows the intensity of fluorescence detected by adding ssDNA of 5, 2.5, 1, 0.5, 0.25, 0.1, 0.05, 0 mg / ml to the reaction solution. (B) shows the intensities of fluorescence detected by adding 2.5, 0.25, 0 mg / ml of RNA into the reaction solution. The horizontal axis shows nucleic acid concentration, and the vertical axis shows RFU at a fluorescence wavelength of 604 nm. The measurement was performed three times. The sodium chloride (NaCl) concentration was 0.25 M, and the amount of copper powder was 200 mg per 1 ml, and this condition was used in the following experiments unless otherwise specified. As shown in the figure, the fluorescence intensity was dependent on the DNA concentration and the RNA concentration.
次に、配列番号1,2,5,6,9に記載する、異なる配列よりなるオリゴDNAを0.1mM添加した反応溶液について蛍光測定を行った。結果を図16に示す。(A)の縦軸はNanodropで計測したRFU値、(B)の縦軸はピーク高さを1とした相対値でのRFU値を示す。図に示されるように、蛍光強度及びピーク波長は、塩基配列の影響を受けた。特にチミン(T)の割合が高いと蛍光強度が強く、ピーク波長が長めになる傾向があることが確認できた。
Next, the fluorescence measurement was performed about the reaction solution which added 0.1 mM of oligo DNA which consists of a different arrangement | sequence which is described in sequence number 1, 2, 5, 6 and 9. The results are shown in FIG. The vertical axis of (A) represents the RFU value measured by Nanodrop, and the vertical axis of (B) represents the RFU value at a relative value where the peak height is 1. As shown in the figure, the fluorescence intensity and the peak wavelength were influenced by the base sequence. In particular, it has been confirmed that when the proportion of thymine (T) is high, the fluorescence intensity is strong and the peak wavelength tends to be longer.
配列番号1,2,5,6に記載する配列よりなるオリゴDNAを添加した反応溶液については、F-4500形分光蛍光光度計を用いた計測も行った。図17は、360nm(スリット幅10nm)の励起光を照射した際の、400nm~700nmにおける蛍光スペクトル(スリット幅2.5nm)を計測した結果である。ここでも、チミン(T)及びアデニン(A)の組み合わせによりなる配列では、チミン(T)の割合が高いと蛍光強度が強く、ピーク波長が長めになる傾向があることが確認できた。図18は、励起光を330nm~390nm(スリット幅3nm)及び400nm~700nm(スリット幅2.5nm)でスキャンして励起-蛍光スペクトルを計測した結果である。(A)は3次元表示、(B)は等高線表示を示す。軸EXは励起波長(nm)、軸EMは蛍光波長(nm)を示し、高さ方向が蛍光強度を示す。これらの結果から、DNAの塩基配列の違いによって励起及び蛍光のスペクトル及び強度が変化することを読み取ることができた。
The reaction solution to which the oligo DNA consisting of the sequence described in SEQ ID NO: 1, 2, 5 or 6 was added was also measured using an F-4500 spectrofluorimeter. FIG. 17 shows the result of measurement of a fluorescence spectrum (slit width 2.5 nm) at 400 nm to 700 nm when irradiated with excitation light of 360 nm (slit width 10 nm). Also in this case, it was confirmed that in the arrangement composed of a combination of thymine (T) and adenine (A), when the ratio of thymine (T) is high, the fluorescence intensity tends to be strong and the peak wavelength tends to be longer. FIG. 18 shows the results of measurement of an excitation-fluorescence spectrum by scanning excitation light at 330 nm to 390 nm (slit width 3 nm) and 400 nm to 700 nm (slit width 2.5 nm). (A) shows a three-dimensional display and (B) shows a contour display. The axis EX indicates the excitation wavelength (nm), the axis EM indicates the fluorescence wavelength (nm), and the height direction indicates the fluorescence intensity. From these results, it was possible to read that the difference in the base sequence of DNA changes the spectrum and intensity of excitation and fluorescence.
塩基配列とスペクトルとの関係をさらに調べるため、配列番号21~26に記載する、8塩基のシトシン(C)と12塩基のチミン(T)の組み合わせ配列からなるオリゴDNAについて、蛍光の計測実験を行った。結果を図19に示す。図に示されるように、オリゴDNAの塩基組成が同じであっても配列が異なる場合、蛍光強度が異なった。
In order to further investigate the relationship between the nucleotide sequence and the spectrum, fluorescence measurement experiments were carried out on an oligo DNA consisting of a combination of cytosine (C) of 8 bases and thymine (T) of 12 bases described in SEQ ID NOs: 21 to 26 went. The results are shown in FIG. As shown in the figure, when the base composition of the oligo DNA is the same but the sequence is different, the fluorescence intensity is different.
次に、ミスマッチを含む二本鎖のDNAについて、蛍光スペクトルのパターンを計測する実験を行った。二本鎖DNAには、配列番号1に示す配列からなるオリゴDNAと配列番号2に示す配列からなるオリゴDNAの混合物((e)+(f))、配列番号5に示す配列からなるオリゴDNAと配列番号2に示す配列からなるオリゴDNAの混合物((d)+(f))、及び配列番号1に示す配列からなるオリゴDNAと配列番号6に示す配列からなるオリゴDNAの混合物((e)+(c))、の3種類を用いた。いずれのオリゴDNAも、最終濃度0.5 mg/mlで混合した。結果を図20に示す。(A)の縦軸はNanodropで計測したRFU値を示し、(B)の縦軸はピーク高さを1とした相対値でのRFU値を示す。横軸は波長(nm)を示す。図に示されるように、二本鎖DNAでは一本鎖と比較すると蛍光強度は低くなっているが、チミン(T)にミスマッチが入った二本鎖DNAで強い蛍光が確認された。
Next, an experiment was performed to measure the pattern of the fluorescence spectrum for double-stranded DNA containing a mismatch. For double-stranded DNA, a mixture of oligo DNA consisting of the sequence shown in SEQ ID NO: 1 and oligo DNA consisting of the sequence shown in SEQ ID NO: 2 ((e) + (f)), oligo DNA consisting of the sequence shown in SEQ ID NO: 5 And a mixture of oligo DNAs consisting of the sequence shown in SEQ ID NO: 2 ((d) + (f)), and a mixture of an oligo DNA consisting of the sequence shown in SEQ ID NO: 1 and an oligo DNA consisting of the sequence shown in SEQ ID NO: 6 ((e Three types of () + (c)) were used. Both oligo DNAs were mixed at a final concentration of 0.5 mg / ml. The results are shown in FIG. The vertical axis of (A) indicates the RFU value measured by Nanodrop, and the vertical axis of (B) indicates the RFU value at a relative value where the peak height is 1. The horizontal axis shows the wavelength (nm). As shown in the figure, in the double-stranded DNA, the fluorescence intensity is lower than that in the single-stranded, but strong fluorescence is confirmed in the double-stranded DNA in which a mismatch is inserted in thymine (T).
反応溶液のバッファーの種類及びpHを変更した場合に検出される蛍光強度を比較した。結果を図21に示す。(A)は、ssDNAを含むサンプル(+)及び核酸を含まないサンプル(-)における、各バッファー条件下でのピークRFU値の相対値を示す。(B)は、配列番号1に示す配列からなるオリゴDNAを含むサンプルにおける同条件下でのピークRFU値の相対値を示す。(C)は配列番号2に示す配列からなるオリゴDNAを含むサンプルにおける同条件下でのピークRFU値の相対値を示す。各バッファーの濃度は50mMとし、ssDNAの終濃度は0.5 mg/ml 、オリゴDNAの終濃度は25mMとした。なお、ピークRFU値の相対値とは、バッファーを含まない条件下で計測したピークRFU値を1とした相対値を表す。蛍光強度は、バッファーの種類に依存した。また、いずれのバッファーにおいても核酸が存在しない場合には蛍光はほとんど検出されなかった。
The fluorescence intensities detected when the buffer type and pH of the reaction solution were changed were compared. The results are shown in FIG. (A) shows relative values of peak RFU values under each buffer condition in the sample (+) containing ssDNA and the sample (−) not containing nucleic acid. (B) shows relative values of peak RFU values under the same conditions in a sample containing oligo DNA consisting of the sequence shown in SEQ ID NO: 1. (C) shows relative values of peak RFU values under the same conditions in a sample containing oligo DNA consisting of the sequence shown in SEQ ID NO: 2. The concentration of each buffer was 50 mM, the final concentration of ssDNA was 0.5 mg / ml, and the final concentration of oligo DNA was 25 mM. The relative value of the peak RFU value represents a relative value with the peak RFU value measured under the condition that no buffer is included as 1. The fluorescence intensity was dependent on the type of buffer. In addition, almost no fluorescence was detected in the absence of nucleic acid in any of the buffers.
<考察>
本実施例の結果から、核酸を固形の銅粉末と接触させた場合にも、適切な塩濃度などの条件下において、核酸をCu(I)イオンと接触させた場合と同様に、蛍光を検出できることが示された。イオンによる場合と固形の銅による場合では、波長特性や配列依存性などの性質がほぼ同一であることから、これらで観察されている蛍光は同じメカニズムによるものと考えられた。また、核酸としてRNAを用いても蛍光が観察された。さらに、二本鎖DNAにおいては、特にチミン(T)にミスマッチが存在している場合に強い蛍光が観察された。このことから、相補配列との結合は、核酸の銅との結合による蛍光体の形成に対して阻害要因となる可能性が示唆された。また、ミスマッチ部位での蛍光強度の上昇は、核酸の塩基配列に含まれる変異を検出する方法への応用が可能と考えられた。 <Discussion>
From the results of this example, even when nucleic acid is brought into contact with solid copper powder, fluorescence is detected as in the case where nucleic acid is brought into contact with Cu (I) ions under conditions such as appropriate salt concentration. It was shown that it was possible. Since the properties such as wavelength characteristics and sequence dependence are almost the same between the case of the ion and the case of solid copper, it is considered that the fluorescence observed in these is due to the same mechanism. In addition, fluorescence was observed even if RNA was used as the nucleic acid. Furthermore, in double-stranded DNA, strong fluorescence was observed, particularly when thymine (T) had a mismatch. From this, it was suggested that the binding to the complementary sequence may be an inhibitory factor to the formation of a fluorophore due to the binding of the nucleic acid to copper. In addition, the increase in fluorescence intensity at the mismatch site was considered to be applicable to a method for detecting a mutation contained in the nucleotide sequence of a nucleic acid.
また、各種バッファー条件での蛍光を比較した実験では、PIPES, BES, HEPPSO, EPPS, TAPS, CAPS, TES, POPSOのバッファー中で蛍光が観察され、特にPIPES, HEPPSO, EPPS, POPSOのバッファーで強い蛍光が検出された。蛍光は、pH範囲7.0~10.5の範囲で観察することができた。バッファーの種類とpHに依存した蛍光強度の変化は、核酸の塩基配列に応じて異なるパターンを示すことが見出された。一方、Cu(II)イオンをキレートして安定化する性質を有するバッファーを含む溶液中では蛍光が観察されない傾向が認められ、本実施例中にデータは掲載していないが例えばトリスバッファーや、EDTAなどを含む反応液を用いた場合では、蛍光はほとんど観察されなかった。
Also, in experiments comparing fluorescence under various buffer conditions, fluorescence was observed in the buffers of PIPES, BES, HEPPSO, EPPS, TAPS, CAPS, TES, POPSO, especially strong in the PIPES, HEPPSO, EPPS, POPSO buffer Fluorescence was detected. The fluorescence could be observed in the pH range 7.0-10.5. It was found that the change in fluorescence intensity depending on the type of buffer and pH showed different patterns depending on the base sequence of the nucleic acid. On the other hand, there is a tendency that fluorescence is not observed in a solution containing a buffer having a property of chelating and stabilizing a Cu (II) ion, and data are not listed in this example, but, for example, Tris buffer, EDTA, In the case of using a reaction solution containing and the like, almost no fluorescence was observed.
実施例3では、ガラス表面にスパッタリングした銅に核酸を接触させた後に蛍光が検出できることを確認し、蛍光の特性を解析した。
In Example 3, after the nucleic acid was brought into contact with copper sputtered on the glass surface, it was confirmed that the fluorescence could be detected, and the characteristics of the fluorescence were analyzed.
<材料と方法>
DNAは実施例1に記載のssDNAを、RNAは実施例2に記載のものを用いた。
ガラス表面への銅スパッタリングは、装置にULVAC, Inc. (Kanagawa, Tokyo)のSH-350を用い、Cu Target, 99.99% (Kojundo Chemical Laboratory Co., Ltd, Saitama, Japan)を装着して実施した。スパッタリングの厚みは40 nmとし、事前に計測した堆積速度をもとに適切なスパッタ時間を定めた。銀スパッタガラスとしては、株式会社協同インターナショナル (Kyodo International, Inc., Kanagawa, Japan)に作製のものを用いた。 <Materials and Methods>
The DNA used was ssDNA described in Example 1, and the RNA used was that described in Example 2.
The copper sputtering on the glass surface was carried out using a UL-VAC, Inc. (Kanagawa, Tokyo) SH-350 and a Cu Target, 99.99% (Kojundo Chemical Laboratory Co., Ltd, Saitama, Japan). . The thickness of sputtering was 40 nm, and an appropriate sputtering time was determined based on the deposition rate measured in advance. As silver sputtered glass, one manufactured by Kyodo International, Inc. (Kanagawa, Japan) was used.
銅ないし銀をスパッタしたスライドガラス、もしくは未処理のスライドガラスに、サンプル溶液をのせて、その上から松浪硝子工業株式会社製のギャップカバーガラス(Gap cover glass, 24x25 No.4 / #CG00024 / Matsunami Glass Ind., Ltd., Osaka, Japan)を被せた。5分程度静置した後、蛍光の観察を行った。観察には、Nikon社製の倒立顕微鏡 Ti-U (Nikon Co., Tokyo, Japan)を使用し、蛍光撮影には、フィルタセットUV-1A (Ex: 365/10, DM: 400, BA: 400 / Nikon)を使用した。画像の撮影及び記録にはデジタルCCDカメラRetiga 2000R (QImaging, BC, Canada)及び20倍の対物レンズを使用した。
The sample solution is placed on a copper or silver sputtered glass slide or an untreated glass slide, and gap cover glass made by Matsunami Glass Industry Co., Ltd. (Gap cover glass, 24 x 25 No. 4 / # CG 0002 4 / Matsunami) Covered Glass Ind., Ltd., Osaka, Japan). After standing for about 5 minutes, fluorescence was observed. An inverted microscope Ti-U (Nikon Co., Tokyo, Japan) manufactured by Nikon Corporation is used for observation, and a filter set UV-1A (Ex: 365/10, DM: 400, BA: 400) for fluorescence photography. / Nikon) was used. A digital CCD camera Retiga 2000R (QImaging, BC, Canada) and a 20x objective were used for taking and recording images.
<結果>
5 mg/mlのDNA及び0.5MのNaClを含むサンプルを、銅スパッタガラス上に5分間静置した後に撮影した画像を図22に示す。また、5 mg/mlのRNA及び0.5MのNaClを含むサンプルを、銅スパッタガラス上に5分間静置した後に撮影した画像を図23に示す。 <Result>
An image of a sample containing 5 mg / ml of DNA and 0.5 M NaCl after being allowed to stand on copper sputtered glass for 5 minutes is shown in FIG. In addition, an image taken after a sample containing 5 mg / ml of RNA and 0.5 M of NaCl was allowed to stand on copper sputtered glass for 5 minutes is shown in FIG.
図22(A)に示すように、DNAを含むサンプルを用いた場合には、撮像領域全体から滑らかな蛍光が観察された。一方、図23(A)及び(B)に示すように、RNAを含むサンプルを用いた場合には、撮像領域内に波状に広がる、特有のパターンの蛍光が観察された。このRNAに特有のパターンは、一本鎖のRNAが互いにハイブリダイズして高次構造を形成したことが要因と予想された。
As shown in FIG. 22A, when a sample containing DNA was used, smooth fluorescence was observed from the entire imaging region. On the other hand, as shown in FIGS. 23A and 23B, when a sample containing RNA was used, a distinctive pattern of fluorescence was observed spreading in a wavelike manner within the imaging region. The pattern unique to this RNA was expected to be caused by the fact that single-stranded RNAs hybridized to each other to form a higher-order structure.
次に、撮像領域内の蛍光強度を数値化した。撮影した各々の画像において、図22(B)に例示ように9分割し、中央部の9分の1区画(図中符号C部分)の領域を計測範囲として、計測範囲内の蛍光強度の平均値を算出した。各サンプルについて、スライド上の任意の5ヶ所を撮影し、各画像から上記平均値を算出した。得られた5つの平均値について、さらに平均と標準偏差を計算した。
Next, the fluorescence intensity in the imaging region was quantified. In each of the captured images, the image is divided into 9 as illustrated in FIG. 22B, and the area of the 1/9 section (indicated by symbol C in the drawing) of the central portion is the measurement range, and the average of the fluorescence intensity within the measurement range The value was calculated. About each sample, arbitrary five places on a slide were image | photographed, and the said average value was computed from each image. The mean and standard deviation were further calculated for the five mean values obtained.
DNAあるいはRNAを含むサンプルをガラス上にスパッタリングした銅あるいは銀に接触させた場合に取得された蛍光強度を図24に示す。図中、「DNA/Cu」、「RNA/Cu」、「(-)/Cu」は、それぞれ5 mg/ml DNA含むサンプル、5 mg/ml RNA含むサンプル、核酸を含まないサンプルについて、Cuスパッタガラス上で蛍光強度を計測した結果である。また、「DNA/Ag」、「RNA/Ag」、「(-)/Ag」は、それぞれ5 mg/ml DNA、5 mg/ml RNA、核酸を含まないサンプルについて、Agスパッタガラス上で蛍光強度を計測した結果である。なお、各サンプルには、0.5MのNaClを含有させた。また、「DNA/Cu」は、他と比較して蛍光強度が特に大きいため、露光時間を1秒とした。その他の露光時間は、5秒とした。
The fluorescence intensities obtained when contacting a sample containing DNA or RNA with copper or silver sputtered on glass are shown in FIG. In the figure, “DNA / Cu”, “RNA / Cu” and “(−) / Cu” are samples containing 5 mg / ml DNA, 5 mg / ml RNA, and samples containing no nucleic acid, respectively. It is the result of measuring fluorescence intensity on glass. In addition, “DNA / Ag”, “RNA / Ag” and “(−) / Ag” are fluorescence intensities on Ag sputtered glass for samples containing 5 mg / ml DNA, 5 mg / ml RNA and nucleic acid respectively The result of measuring Each sample contained 0.5 M NaCl. In addition, since "DNA / Cu" has a particularly large fluorescence intensity as compared to the others, the exposure time was set to 1 second. The other exposure time was 5 seconds.
図に示されるように、Cuスパッタガラスでは、「(-)/Cu」と比較して「DNA/Cu」及び「RNA/Cu」の蛍光強度が高く、特にDNAサンプルにおいて強い蛍光が検出された。一方、Agスパッタガラスでは、「(-)/Ag」と比較して「DNA/Ag」及び「RNA/Ag」ともに蛍光強度の上昇を示さなかった。なお、「(-)/Cu」と比較して「(-)/Ag」の方が高い計測値を示しているが、これはAgスパッタ面の反射光又は散乱光あるいは自家蛍光に由来するバックグラウンドが原因と考えられた。
As shown in the figure, in the Cu sputtered glass, the fluorescence intensity of "DNA / Cu" and "RNA / Cu" is high compared to "(-) / Cu", and particularly strong fluorescence is detected in the DNA sample . On the other hand, Ag sputtered glass showed no increase in fluorescence intensity for both “DNA / Ag” and “RNA / Ag” as compared to “(−) / Ag”. Note that although “(−) / Ag” shows a higher measured value compared to “(−) / Cu”, this is a back derived from the reflected light or scattered light of the Ag sputtered surface or autofluorescence The ground was considered to be the cause.
次に、核酸と銅との接触時間の経過に伴う蛍光強度の時間的変化を検討した。Cuスパッタガラスとギャップカバーガラスの間に、5 mg/mlのssDNAと0.5MのNaClを含むサンプルを入れた時点を起点とし、所定時間の経過ごとに蛍光強度の計測を行った。撮影は15秒おきに行い、励起光のシャッタは撮影ごとに開閉した。対物レンズは10倍、露光時間は1秒とした。各時間において撮像した画像を1枚ずつ用いて、蛍光強度の計測を行った。結果を図25に示す。
Next, temporal changes in fluorescence intensity with the lapse of contact time between nucleic acid and copper were examined. Starting from the point of time when a sample containing 5 mg / ml ssDNA and 0.5 M NaCl was inserted between the Cu sputtered glass and the gap cover glass, the fluorescence intensity was measured at predetermined time intervals. Photographing was performed every 15 seconds, and the shutter for excitation light was opened and closed every photographing. The objective lens was 10 ×, and the exposure time was 1 second. The fluorescence intensity was measured using one image each captured at each time. The results are shown in FIG.
図に示されるように、蛍光強度は、サンプル導入後の数分間で徐々に上昇し、3分程度で最大値に達した。
As shown in the figure, the fluorescence intensity gradually increased in a few minutes after sample introduction and reached a maximum value in about 3 minutes.
続いて、核酸と銅とを接触させて所定時間が経過した後、温度を変化させた場合の蛍光強度の変化を計測した。撮影開始直後は室温のままとし、50秒後に65℃に熱したヒートブロックをCuスパッタガラスの上に静かに載せ、100秒後にそのヒートブロックを除去した。撮影は5秒おき行った。計測は150秒後に一度打ち切って励起光のシャッタを閉じた。さらに、900秒後に改めて計測を行った。結果を図26に示す。
Subsequently, the nucleic acid and copper were brought into contact with each other, and after a predetermined time elapsed, a change in fluorescence intensity was measured when the temperature was changed. Immediately after the start of imaging, the temperature was kept at room temperature, and after 50 seconds, a heat block heated to 65 ° C. was gently placed on Cu sputtered glass, and after 100 seconds, the heat block was removed. I went shooting every 5 seconds. The measurement was interrupted once after 150 seconds to close the shutter of the excitation light. Furthermore, it measured again after 900 seconds. The results are shown in FIG.
図に示されるように、最初の50秒間は、徐々に蛍光強度が減衰した。これは蛍光退色によるものと考えられた。次の50秒間では、蛍光退色とは明らかに異なる速度で蛍光の消失が観察された。ヒートブロックを除去して室温条件下に戻した後は徐々に蛍光が回復した。さらに、900秒後では、当初の蛍光強度から退色分の蛍光強度を差し引いた水準にまで蛍光強度が戻った。これらの結果から、銅と接触した核酸が発する蛍光は、熱に対して感受性であり、温度が上昇すると可逆的に蛍光が消失することが示された。
As shown in the figure, the fluorescence intensity gradually decreased for the first 50 seconds. This was considered to be due to fluorescence fading. In the next 50 seconds, the disappearance of fluorescence was observed at a rate distinctly different from fluorescence fading. After the heat block was removed and returned to room temperature conditions, the fluorescence gradually recovered. Furthermore, after 900 seconds, the fluorescence intensity returned to the level obtained by subtracting the fluorescence intensity of the fading from the original fluorescence intensity. From these results, it is shown that the fluorescence emitted from the nucleic acid in contact with copper is sensitive to heat, and the fluorescence disappears reversibly when the temperature rises.
実施例4では、銅スパッタガラス上に、細胞を含むサンプルを導入することで、細胞核の蛍光観察が可能であることを示した。
Example 4 showed that fluorescence observation of cell nuclei was possible by introducing a sample containing cells on copper sputtered glass.
<材料と方法>
PBSには、Dulbecco’s Phosphate Buffered Saline, Ca/Mg free (Invitrogen Corporation, CA, USA)を用いた。
タマネギ薄皮の実験では、市販のタマネギの薄皮を、ピンセットを用いて丁寧に剥がして、蒸留水中に浸してすすいで用いた。タマネギの薄皮をCuスパッタガラス上に載せ、PBSに浸した状態で上からカバーガラスを被せて観察した。
ヒト白血球サンプルの実験では、IMMUNO-TROL Cells (Cat.No.6607077, Beckman Coulter, Inc., Fullerton, CA, USA) を次の手順で処理したものを用いた。まず、IMMUNO-TROL Cellsを、500マイクロリットル取り分けてPBSで洗浄し、遠心分離機で細胞を沈殿させた(1200rpm,5min)。その後、上清を捨ててペレットをほぐし、水溶血処理を2回繰り返して得られたサンプルをPBSに希釈し、白血球サンプルを調製した。水溶血処理は、遠心分離の結果得られたペレットを良くほぐした後に、脱イオン水を9ミリリットル添加して30秒間転倒混和し、さらに1ミリリットルの10x PBS Buffer (Nippon Gene Co., Ltd., Tokyo, Japan)を添加してよく攪拌し、遠心分離 (1200rpm, 5min)で細胞を沈殿させて上清を除去することにより行った。白血球サンプルをCuスパッタガラス上に撒き、上からカバーガラスを被せて観察した。 <Materials and Methods>
As PBS, Dulbecco's Phosphate Buffered Saline, Ca / Mg free (Invitrogen Corporation, CA, USA) was used.
In the onion peel experiment, a commercially available onion peel was carefully peeled off using tweezers, dipped in distilled water and used for rinsing. A thin onion was placed on Cu sputtered glass, and was observed while covered with a cover glass from above while immersed in PBS.
In the experiments of human leukocyte samples, IMMUNO-TROL Cells (Cat. No. 6607077, Beckman Coulter, Inc., Fullerton, Calif., USA) treated according to the following procedure were used. First, 500 μL aliquots of IMMUNO-TROL Cells were washed with PBS, and the cells were pelleted with a centrifuge (1200 rpm, 5 min). Thereafter, the supernatant was discarded and the pellet was loosened, and the sample obtained by repeating the water hemolysis treatment twice was diluted in PBS to prepare a white blood cell sample. Water hemolysis treatment is carried out by thoroughly loosening the pellet obtained as a result of centrifugation, adding 9 ml of deionized water, inverting for 30 seconds, and mixing for 1 second, and further 1 ml of 10 × PBS Buffer (Nippon Gene Co., Ltd., The reaction was carried out by adding Tokyo, Japan), stirring well, and precipitating cells by centrifugation (1200 rpm, 5 min) and removing the supernatant. The white blood cell sample was spread on Cu sputtered glass, and a cover glass was placed from above to observe.
銅スパッタガラス、カバーガラス及び顕微鏡などは、実施例3と同一のものを用いた。スパッタリングの厚みは、20、40あるいは100 nmとした。以下の実験では特に断りがない場合は40 nmのものを用いた。スライドガラス表面の一部にのみCuをスパッタリングする場合には、まず、スライドガラス表面に、中央部5ミリメートル四方の領域を除いて、ポリイミドテープを貼付した状態でスパッタリング処理を行った。そして、ポリイミドテープを除去することで、中央部5ミリメートル四方の領域のみにCu層が形成されたCuスパッタガラスを作成した。
The same copper sputtered glass, cover glass and microscope as in Example 3 were used. The thickness of sputtering was 20, 40 or 100 nm. In the following experiments, the one with 40 nm was used unless otherwise noted. In the case of sputtering Cu only on a part of the surface of the slide glass, first, a sputtering process was performed in a state where a polyimide tape was attached to the surface of the slide glass except for a region of 5 mm around the central portion. Then, by removing the polyimide tape, a Cu sputtered glass in which a Cu layer was formed only in the central 5 mm square region was produced.
タマネギ薄皮の蛍光観察には、励起フィルタ:365/10nm、ダイクロイックミラー:400nm、蛍光フィルタ:590LPを使用した。白血球サンプル及びジャーカット細胞の蛍光観察には、フィルタセットUV-1A (Ex: 365/10, DM: 400, BA: 400 / Nikon)を使用した。
For fluorescence observation of onion thin skin, excitation filter: 365/10 nm, dichroic mirror: 400 nm, fluorescence filter: 590 LP was used. A filter set UV-1A (Ex: 365/10, DM: 400, BA: 400 / Nikon) was used for fluorescence observation of white blood cell samples and Jurkat cells.
<結果>
図27に、銅スパッタガラス上でタマネギ薄皮を蛍光観察して撮像した画像を示す。(a)及び(b)はCuスパッタガラス上での観察像を示し、(c)及び(d)はCuをスパッタしていないスライドガラス上での観察像を示す。(a)及び(c)は明視野の観察像、(b)及び(d)は蛍光像である。なお、(a)~(d)は10倍の対物レンズを用いて撮像した画像であり、(e)は40倍の対物レンズを用いて撮像した画像である。 <Result>
FIG. 27 shows an image captured by fluorescence observation of onion thin skin on copper sputtered glass. (A) and (b) show the observation image on Cu sputtered glass, (c) and (d) show the observation image on the slide glass which is not sputtered Cu. (a) and (c) are observed images of bright field, (b) and (d) are fluorescence images. Note that (a) to (d) are images taken using a 10 × objective lens, and (e) is an image taken using a 40 × objective lens.
図に示されるように、Cuスパッタガラス上の細胞では、細胞核に特異的な強い蛍光が観察された。なお、一部の細胞壁などからも若干の蛍光が確認されたが、これはCuをスパッタしていないスライドガラス上の細胞でも確認されたことから、細胞壁などの自家蛍光と考えられた。
As shown in the figure, in the cells on Cu sputtered glass, strong fluorescence specific to cell nuclei was observed. In addition, although some fluorescence was confirmed also from the cell wall etc. of a part, since this was confirmed also with the cell on the slide glass which has not sputtered Cu, it was considered to be auto-fluorescence, such as a cell wall.
次に、動物細胞の観察を行った。銅スパッタガラス上でヒト白血球サンプルを蛍光観察して撮像した画像を図28に示す。(a)は明視野の観察像、(b)は蛍光像である。対物レンズには40倍のものを用いた。
Next, animal cells were observed. An image captured by fluorescence observation of a human leukocyte sample on copper sputtered glass is shown in FIG. (a) is an observation image of bright field, (b) is a fluorescence image. An objective lens of 40 × was used.
蛍光像において、好中球などの白血球に特有な分葉核の形状が明確に確認された。
In the fluorescence image, the shape of the lobed nucleus peculiar to white blood cells such as neutrophils was clearly confirmed.
図29には、スライドガラス表面の一部にのみCuをスパッタリングしたCuスパッタガラスを用いて観察された像を示す。Cuスパッタガラス上に、ヒト白血球細胞株であるジャーカット細胞を撒き、上からカバーガラスを被せて、20倍の対物レンズで観察を行った。画像は、CuスパッタガラスのCu積層領域とCu非積層領域との境界で撮像した。(a)及び(c)は明視野の観察像であり、画像中の過半を占める黒い領域は、Cu層が形成されているため光が透過しない領域である。(b)及び(d)は蛍光像である。
FIG. 29 shows an image observed using Cu sputtered glass obtained by sputtering Cu only on a part of the slide glass surface. Jurkat cells, a human leukocyte cell line, were spread on Cu sputtered glass, a cover glass was placed from above, and observation was performed with a 20 × objective lens. Images were taken at the boundary between the Cu laminated region and the Cu non-laminated region of Cu sputtered glass. (A) and (c) are bright field observation images, and the black region occupying the majority in the image is a region through which light does not pass since the Cu layer is formed. (B) and (d) are fluorescence images.
Cu積層領域に存在する細胞の細胞核のみから強い蛍光が観察された。図30は、厚み20 nm(a)あるいは100 nm(b)のCu層を形成したCuスパッタガラスを用いて、ジャーカット細胞の観察を行った結果である。いずれの厚みにおいても細胞核からの蛍光が確認された。
Strong fluorescence was observed only from cell nuclei of cells present in the Cu layering region. FIG. 30 shows the results of observation of Jurkat cells using Cu sputtered glass on which a Cu layer with a thickness of 20 nm (a) or 100 nm (b) is formed. The fluorescence from the cell nucleus was confirmed at any thickness.
<考察>
本実施例の結果から、細胞核についても銅との接触によって蛍光検出が可能となることが示された。この現象は、銅をスパッタリングしたガラス基板上でのみみられたこと、細胞核と銅との作用による結果であることは明らかである。 <Discussion>
From the results of this example, it was shown that contact of the cell nucleus with copper also enables fluorescence detection. It is clear that this phenomenon is seen only on a copper sputtered glass substrate and is the result of the action of cell nuclei and copper.
また、タマネギ薄皮細胞と白血球細胞の蛍光観察の結果、両者の細胞の細胞核形状の相違を明確に観察できた。このことから、本技術に係る核酸検出方法によれば、細胞の種類ごとに異なる細胞核形状を識別可能であることが示された。
In addition, as a result of fluorescence observation of onion skin cells and white blood cells, it was possible to clearly observe the difference in the cell nucleus shape of both cells. From this, it was shown that according to the nucleic acid detection method according to the present technology, it is possible to distinguish different cell nucleus shapes for each cell type.
実施例中に図では示さなかったが、スライドガラス表面の一部にのみ銅をスパッタしたスライドガラスを用いた実験において、Cu積層領域に存在する細胞のみから蛍光が観察される様子を確認したのち、スライドガラスを傾けてCu積層領域からCu非積層領域に細胞を移動させたところ、移動後にも引き続き蛍光が観察された。このことから、銅と細胞を接触させる部位と、細胞の蛍光観察を行う部位とを離して設けても、両部位の間にサンプルを移動させる手段を設けることによって蛍光検出が可能であることが判明した。
Although not shown in the drawings in the examples, in an experiment using a slide glass in which copper was sputtered only on a part of the slide glass surface, it was confirmed that fluorescence was observed only from cells present in the Cu lamination region. When the slide glass was tilted to move the cells from the Cu lamination region to the Cu non-lamination region, fluorescence was observed even after the movement. From this, it is possible to detect fluorescence by providing a means for moving the sample between the two sites even if the site where copper is in contact with the cell and the site where the fluorescence observation of the cell is provided separately. found.
Cuスパッタガラスとカバーガラスの間に細胞が存在する状態で細胞核からの蛍光を確認した後に、カバーガラスを取り除いて細胞を含む溶液を空気中に暴露すると、蛍光が速やかに消失した。実施例1のCu(II)イオンとS.A.を用いた実験においても、反応溶液が空気に長時間暴露されると蛍光が消失することが見出されている。この蛍光の消失は、空気との接触によってCu(I)イオンが酸化されるためと考察された。従って、サンプル溶液の空気との接触(特に空気中に含まれる酸素への暴露)は、蛍光の発生を阻害する要因となると考えられ、本技術に係る核酸検出方法は、例えばマイクロチップなどの、空気との接触が限定された環境下で行うことが好ましいと考えられた。
After confirming the fluorescence from cell nuclei in the presence of cells between the Cu sputtered glass and the cover glass, when the cover glass was removed and the solution containing the cells was exposed to the air, the fluorescence disappeared rapidly. Also in the experiment using Cu (II) ion and SA of Example 1, it is found that the fluorescence disappears when the reaction solution is exposed to air for a long time. The disappearance of this fluorescence was considered to be due to oxidation of Cu (I) ions by contact with air. Therefore, contact of the sample solution with air (in particular, exposure to oxygen contained in the air) is considered to be a factor that inhibits the generation of fluorescence, and the nucleic acid detection method according to the present technology is, for example, a microchip It was considered preferable to operate in an environment where contact with air is limited.
実施例5では、実施例1と同様の実験条件下において、2塩基長のオリゴDNAを用いても蛍光が発せられることを確認した。
In Example 5, under the same experimental conditions as in Example 1, it was confirmed that fluorescence was emitted even when using a 2-base oligo DNA.
<材料と方法>
Invitrogen社より購入した7種類のオリゴDNAについて、実施例1と同様の材料と方法を用いて蛍光計測実験を行った。使用したオリゴDNAの配列は、T(20)(配列番号1)、T(10)(配列番号19)、T(6)(配列番号10)、T(5)(配列番号27)、T(4)(配列番号28)、T(3)(配列番号12)、T(2)(配列番号29)である。ここではCuSO4濃度は0.4mM、S.A.濃度は4mMとし、計測にはNanoDrop3300を使用した。 <Materials and Methods>
The fluorescence measurement experiment was performed using the same materials and methods as in Example 1 for seven types of oligo DNAs purchased from Invitrogen. The sequences of the oligo DNAs used were T (20) (SEQ ID NO: 1), T (10) (SEQ ID NO: 19), T (6) (SEQ ID NO: 10), T (5) (SEQ ID NO: 27), T ( 4) (SEQ ID NO: 28), T (3) (SEQ ID NO: 12), T (2) (SEQ ID NO: 29). Here, the concentration of CuSO 4 was 0.4 mM, the concentration of SA was 4 mM, and NanoDrop 3300 was used for measurement.
<結果>
図31に、T(20)についての測定結果を示す。オリゴDNAの濃度は、(a)100μM、(b)50μM、(c)50μM、(d)25μM、(e)12.5μM、(f)6.25μMである。各グラフは横軸が波長(nm)、縦軸が蛍光強度(RFU値)を示す。図32~図37に、T(10), T(6), T(5), T(4), T(3), T(2)の各オリゴDNAについての測定結果を示す。各図のグラフ中に表記の数値は、オリゴDNAの濃度条件を示す。 <Result>
The measurement result about T (20) is shown in FIG. The concentration of the oligo DNA is (a) 100 μM, (b) 50 μM, (c) 50 μM, (d) 25 μM, (e) 12.5 μM, (f) 6.25 μM. In each graph, the horizontal axis represents wavelength (nm) and the vertical axis represents fluorescence intensity (RFU value). 32 to 37 show the measurement results of each oligo DNA of T (10), T (6), T (5), T (4), T (3) and T (2). The numerical values shown in the graphs of each figure indicate the concentration conditions of oligo DNA.
図38に、各オリゴDNAについて、最も蛍光強度の高かった濃度条件での蛍光スペクトルを示す。横軸は波長(nm)を、縦軸は蛍光強度(RFU値)の相対値(ピークRFU値を1)を示す。(a)がT(20)、(b)がT(10)、(c)がT(6)、(d)がT(5)、(e)がT(4)、(f)がT(3)、(g)がT(2)の蛍光スペクトルを示す。
FIG. 38 shows a fluorescence spectrum under the concentration condition in which the fluorescence intensity is highest for each oligo DNA. The horizontal axis shows the wavelength (nm), and the vertical axis shows the relative value of the fluorescence intensity (RFU value) (peak RFU value is 1). (a) T (20), (b) T (10), (c) T (6), (d) T (5), (e) T (4), (f) T (3) and (g) show the fluorescence spectrum of T (2).
また、図39に、各オリゴDNAについて、各濃度におけるピークRFU値をプロットしたグラフを示す。横軸はオリゴDNAの濃度(μM)を、縦軸はピークRFU値(対数値)を示す。(a)がT(20)、(b)がT(10)、(c)がT(6)、(d)がT(5)、(e)がT(4)、(f)がT(3)、(g)がT(2)の結果を示す。
Moreover, the graph which plotted the peak RFU value in each density | concentration is shown in FIG. 39 about each oligo DNA. The horizontal axis shows the concentration (μM) of oligo DNA, and the vertical axis shows the peak RFU value (log value). (a) T (20), (b) T (10), (c) T (6), (d) T (5), (e) T (4), (f) T (3) and (g) show the results of T (2).
<考察>
本実施例の結果から、チミン2塩基からなる塩基配列のオリゴDNAでも、蛍光が観察されることが明らかとなった。蛍光スペクトルの形状は、オリゴDNAの濃度が変わってもほとんど変化しないが、塩基長が短くなるほど蛍光ピークが短波長側にシフトする傾向があることが見出された(図38参照)。また、蛍光スペクトルの強度は、オリゴDNAの濃度に依存する傾向が認められたが、一定濃度以上ではプラトーに達し、逆に減少する場合も観察された(図39参照)。なお、DNA濃度が高すぎる場合に蛍光強度が低下する現象は、実施例2の銅粉末を用いた実験でも観察されていた(図15参照)。 <Discussion>
From the results of this example, it is clear that fluorescence is observed even with an oligo DNA of a nucleotide sequence consisting ofthymine 2 bases. It was found that the shape of the fluorescence spectrum hardly changes even if the concentration of the oligo DNA changes, but as the base length becomes shorter, the fluorescence peak tends to shift to the short wavelength side (see FIG. 38). In addition, the intensity of the fluorescence spectrum tended to depend on the concentration of the oligo DNA, but reached a plateau at a certain concentration or higher, and in the opposite case was also observed (see FIG. 39). The phenomenon that the fluorescence intensity decreases when the DNA concentration is too high has been observed in the experiment using the copper powder of Example 2 (see FIG. 15).
本実施例の結果から、チミン2塩基からなる塩基配列のオリゴDNAでも、蛍光が観察されることが明らかとなった。蛍光スペクトルの形状は、オリゴDNAの濃度が変わってもほとんど変化しないが、塩基長が短くなるほど蛍光ピークが短波長側にシフトする傾向があることが見出された(図38参照)。また、蛍光スペクトルの強度は、オリゴDNAの濃度に依存する傾向が認められたが、一定濃度以上ではプラトーに達し、逆に減少する場合も観察された(図39参照)。なお、DNA濃度が高すぎる場合に蛍光強度が低下する現象は、実施例2の銅粉末を用いた実験でも観察されていた(図15参照)。 <Discussion>
From the results of this example, it is clear that fluorescence is observed even with an oligo DNA of a nucleotide sequence consisting of
実施例6では、実施例1と同様の実験条件下において、TとC、あるいはTとGから構成される3塩基長のオリゴDNAを用いて実験を行った。
In Example 6, under the same experimental conditions as in Example 1, experiments were carried out using T and C, or an oligo DNA having a length of 3 bases consisting of T and G.
<材料と方法>
Invitrogen社より購入したオリゴDNAについて、実施例1と同様の材料と方法を用いて蛍光計測実験を行った。使用したオリゴDNAの配列は、TTT(配列番号12)、TTC、TCT、CTT、TCC、CTC、CCT、CCC、TTG、TGT、GTT、TGG、GTG、GGT、GGGである。CuSO4濃度は0.4mM、S.A.濃度は4mM、オリゴDNA濃度は0.5mMとし、計測にはNanoDrop3300を使用した。 <Materials and Methods>
A fluorescence measurement experiment was performed using oligo DNA purchased from Invitrogen, using the same materials and methods as in Example 1. The sequences of oligo DNAs used are TTT (SEQ ID NO: 12), TTC, TCT, CTT, TCC, CTC, CCT, CCT, CCC, TTG, TGT, GTT, TGG, GTG, GGT, GGG. The concentration of CuSO 4 was 0.4 mM, the concentration of SA was 4 mM, the concentration of oligo DNA was 0.5 mM, and NanoDrop 3300 was used for measurement.
<結果>
結果を図40及び図41に示す。図40の(a)がTTT(配列番号12)、(b)がTTC、(c)がTCT、(d)がCTT、(e)がTCC、(f)がCTC、(g)がCCT、(h)がCCCの結果を示す。図41の(a)がTTT(配列番号12)、(b)がTTG、(c)がTGT、(d)がGTT、(e)がTGG、(f)がGTG、(g)がGGT、(h)がGGGの結果を示す。横軸は波長(nm)を示し、縦軸は蛍光強度(RFU値)の対数値を示す。 <Result>
The results are shown in FIGS. 40 and 41. FIG. 40 (a) shows TTT (SEQ ID NO: 12), (b) TTC, (c) TCT, (d) CTT, (e) TCC, (f) CTC, (g) CCT, (h) shows the result of CCC. Figure 41 (a) shows TTT (SEQ ID NO: 12), (b) TTG, (c) TGT, (d) GTT, (e) TGG, (f) GTG, (g) GGT, (h) shows the result of GGG. The horizontal axis indicates the wavelength (nm), and the vertical axis indicates the logarithmic value of the fluorescence intensity (RFU value).
TとCの混合配列のオリゴDNAでは、TTTで最も蛍光強度が強く、次いでCTT、CCT及びTCTであり、TTC及びCTCでは弱い蛍光が確認された(図40参照)。一方、TCC及びCCCでは、600nm付近をピークとする蛍光は認められなかった。また、TとGの混合配列のオリゴDNAでは、TTGで中程度の強度の蛍光、GTTにおいて微弱な蛍光が認められたが、その他の配列では600nm付近をピークとする蛍光は認められなかった(図41参照)。
In the oligo DNA of the mixed sequence of T and C, the fluorescence intensity was the highest at TTT, followed by CTT, CCT and TCT, and weak fluorescence was confirmed in TTC and CTC (see FIG. 40). On the other hand, in TCC and CCC, no fluorescence having a peak around 600 nm was observed. In addition, in the case of the oligo DNA of the mixed sequence of T and G, moderate intensity fluorescence was observed in TTG and weak fluorescence was observed in GTT, but in the other sequences, fluorescence having a peak around 600 nm was not observed ( See Figure 41).
<考察>
TとCの混合配列のオリゴDNAでは、2番目及び3番目にTが存在するCTTが、TCT及びTTCに比較して高い蛍光強度を示した。また、3番目にTが存在するTCT及びCCTが、2番目にTが存在するTTC及びCTCに比較して高い蛍光強度を示した。これらのことから、TとCの混合配列のオリゴDNAでは、3塩基目のTが最も蛍光への寄与が高く、次に2塩基目のTが寄与していると考えられた。 <Discussion>
In the oligo DNA of the mixed sequence of T and C, CTT in which T exists in the 2nd and 3rd places showed high fluorescence intensity compared with TCT and TTC. In addition, TCT and CCT in which T is present third showed higher fluorescence intensity as compared to TTC and CTC in which T is present second. From these facts, it is considered that in the oligo DNA of the mixed sequence of T and C, the third base T has the highest contribution to fluorescence, and the second base T next contributes.
また、TとGの混合配列のオリゴDNAでは、TTG及びGTTを除いて、600nm付近をピークとする蛍光は認められず、CとTの混合配列のオリゴDNAと比較して全般的に蛍光強度が低かった。このことから、Gは、蛍光エネルギーを吸収し、蛍光をクエンチする作用があるものと考えられた。
Moreover, in the oligo DNA of the mixed sequence of T and G, except for TTG and GTT, no fluorescence having a peak around 600 nm is observed, and the fluorescence intensity is generally compared with the oligo DNA of the mixed sequence of C and T. Was low. From this, G was considered to have the action of absorbing fluorescence energy and quenching the fluorescence.
実施例7では、蛍光がクエンチ色素によってクエンチ(消光)されることを確認した。
Example 7 confirms that the fluorescence is quenched (quenched) by the quench dye.
<材料と方法>
Invitrogen社より購入したオリゴDNAであるT(10)(配列番号19)及び同オリゴDNAの3’末端にBlack Hole Quencher-2 (BHQ2)を修飾したオリゴDNA(T(10)BHQ2)(シグマ・アルドリッチ社)を用い、実施例1と同様の材料及び方法によって蛍光計測実験を行った。CuSO4濃度は0.4mM、S.A.濃度は4mM、オリゴDNA濃度は0.05mMとし、計測にはNanoDrop3300を使用した。 <Materials and Methods>
An oligo DNA T (10) (SEQ ID NO: 19), which is an oligo DNA purchased from Invitrogen, and an oligo DNA (T (10) BHQ2) modified with Black Hole Quencher-2 (BHQ2) at the 3 'end of the oligo DNA A fluorescence measurement experiment was conducted using the same materials and methods as in Example 1 using Aldrich. CuSO 4 concentration was 0.4 mM,SA concentration 4 mM, Oligo DNA concentration and 0.05 mM, the measurement was used NanoDrop 3300.
Invitrogen社より購入したオリゴDNAであるT(10)(配列番号19)及び同オリゴDNAの3’末端にBlack Hole Quencher-2 (BHQ2)を修飾したオリゴDNA(T(10)BHQ2)(シグマ・アルドリッチ社)を用い、実施例1と同様の材料及び方法によって蛍光計測実験を行った。CuSO4濃度は0.4mM、S.A.濃度は4mM、オリゴDNA濃度は0.05mMとし、計測にはNanoDrop3300を使用した。 <Materials and Methods>
An oligo DNA T (10) (SEQ ID NO: 19), which is an oligo DNA purchased from Invitrogen, and an oligo DNA (T (10) BHQ2) modified with Black Hole Quencher-2 (BHQ2) at the 3 'end of the oligo DNA A fluorescence measurement experiment was conducted using the same materials and methods as in Example 1 using Aldrich. CuSO 4 concentration was 0.4 mM,
<結果>
結果を図42に示す。横軸は波長(nm)を、縦軸は蛍光強度(RFU値)を示す。T(10)からは明白な蛍光が確認されたが、クエンチャーを修飾したT(10)BHQ2からは蛍光は検出されなかった。 <Result>
The results are shown in FIG. The horizontal axis represents wavelength (nm) and the vertical axis represents fluorescence intensity (RFU value). Although clear fluorescence was confirmed from T (10), no fluorescence was detected from the quencher-modified T (10) BHQ2.
<考察>
BHQ2は560nm~650nm程度の光を特に効果的に吸収することで知られるクエンチャーである。T(10)で観察されていた蛍光は、このBHQ2の効果によって、T(10)BHQ2では観察されなくなったものと考えられた。この結果から、銅の作用による蛍光とFRETとを組み合わせることが可能であることが示唆された。 <Discussion>
BHQ 2 is a quencher known to absorb light of about 560 nm to about 650 nm particularly effectively. The fluorescence observed at T (10) was considered to be no longer observed at T (10) BHQ2 due to the effect of BHQ2. This result suggests that it is possible to combine fluorescence due to the action of copper with FRET.
BHQ2は560nm~650nm程度の光を特に効果的に吸収することで知られるクエンチャーである。T(10)で観察されていた蛍光は、このBHQ2の効果によって、T(10)BHQ2では観察されなくなったものと考えられた。この結果から、銅の作用による蛍光とFRETとを組み合わせることが可能であることが示唆された。 <Discussion>
実施例8では、チミン(T)及びウラシル(U)の蛍光の強度及びスペクトル形状の比較を再度行い、両者の強度が異なる一方、スペクトル形状は一致していることを確認した。さらに、メチル化シトシン(MeC)及びイノシン(I)の蛍光を調べ、両者が蛍光を生じないことを明らかにした。
In Example 8, the fluorescence intensity and spectral shape of thymine (T) and uracil (U) were compared again, and it was confirmed that the spectral shapes were identical while the intensities of both were different. Furthermore, the fluorescence of methylated cytosine (MeC) and inosine (I) was examined to reveal that both did not produce fluorescence.
<材料と方法>
各種のオリゴDNAについて、実施例1と同様の材料及び方法を用いて蛍光計測実験を行った。オリゴDNAには、Invitrogen社より購入したT(10)(配列番号19)、U(9)G(配列番号20)、A(10)(配列番号30)、I(9)G(配列番号31)を用いた。また、オリゴDNAとして、シグマ・アルドリッチ社より購入したC(10)(配列番号32)、C(4)MeC(6)(配列番号33、MeCは5-メチル2-デオキシシチジン)も用いた。CuSO4濃度は0.4mM、S.A.濃度は4mM、オリゴDNA濃度0.05mMとし、計測にはNanoDrop3300を使用した。 <Materials and Methods>
For various oligo DNAs, fluorescence measurement experiments were conducted using the same materials and methods as in Example 1. As oligo DNA, T (10) (SEQ ID NO: 19), U (9) G (SEQ ID NO: 20), A (10) (SEQ ID NO: 30), I (9) G (SEQ ID NO: 31) purchased from Invitrogen. Was used. In addition, C (10) (SEQ ID NO: 32) and C (4) MeC (6) (SEQ ID NO: 33, MeC is 5-methyl 2-deoxycytidine) purchased from Sigma-Aldrich were also used as oligo DNAs. CuSO 4 concentration was 0.4 mM,SA concentration 4 mM, the oligo DNA concentration 0.05 mM, the measurement was used NanoDrop 3300.
各種のオリゴDNAについて、実施例1と同様の材料及び方法を用いて蛍光計測実験を行った。オリゴDNAには、Invitrogen社より購入したT(10)(配列番号19)、U(9)G(配列番号20)、A(10)(配列番号30)、I(9)G(配列番号31)を用いた。また、オリゴDNAとして、シグマ・アルドリッチ社より購入したC(10)(配列番号32)、C(4)MeC(6)(配列番号33、MeCは5-メチル2-デオキシシチジン)も用いた。CuSO4濃度は0.4mM、S.A.濃度は4mM、オリゴDNA濃度0.05mMとし、計測にはNanoDrop3300を使用した。 <Materials and Methods>
For various oligo DNAs, fluorescence measurement experiments were conducted using the same materials and methods as in Example 1. As oligo DNA, T (10) (SEQ ID NO: 19), U (9) G (SEQ ID NO: 20), A (10) (SEQ ID NO: 30), I (9) G (SEQ ID NO: 31) purchased from Invitrogen. Was used. In addition, C (10) (SEQ ID NO: 32) and C (4) MeC (6) (SEQ ID NO: 33, MeC is 5-methyl 2-deoxycytidine) purchased from Sigma-Aldrich were also used as oligo DNAs. CuSO 4 concentration was 0.4 mM,
<結果>
T(10)及びU(9)Gの測定を各々3回行った結果を図43に示す。(a)は横軸を波長(nm)、縦軸を蛍光強度(RFU)としたグラフであり、(b)は縦軸に蛍光強度(RFU値)の平均値を相対値(それぞれのオリゴDNAのピークRFU値を1)で表示したグラフである。U(9)Gは、T(10)に比較して、強度は劣るが、類似したスペクトル形状の蛍光を発することが確認された。 <Result>
The results of three measurements of T (10) and U (9) G each are shown in FIG. (a) is a graph in which the horizontal axis represents wavelength (nm) and the vertical axis represents fluorescence intensity (RFU), and (b) represents the average value of fluorescence intensity (RFU value) as a relative value (each oligo DNA The peak RFU value of is displayed in 1). It was confirmed that U (9) G emits fluorescence of similar spectral shape, although the intensity is inferior compared to T (10).
T(10)、C(10)及びC(4)MeC(6)の測定結果を図44に示す。横軸は波長(nm)、縦軸は蛍光強度(RFU)を示す。T(10)からは顕著な蛍光が確認されたが、C(10)及びC(4)MeC(6)では、蛍光は確認されなかった。
The measurement results of T (10), C (10) and C (4) MeC (6) are shown in FIG. The horizontal axis represents wavelength (nm) and the vertical axis represents fluorescence intensity (RFU). Remarkable fluorescence was confirmed from T (10), but no fluorescence was confirmed for C (10) and C (4) MeC (6).
T(10)、A(10)及びI(9)Gの測定結果を図45に示す。横軸は波長(nm)、縦軸は蛍光強度(RFU)を示す。T(10)からは顕著な蛍光が確認され、A(10)からは微弱な蛍光が確認されたが、I(9)Gからは蛍光は検出されなかった。
The measurement results of T (10), A (10) and I (9) G are shown in FIG. The horizontal axis represents wavelength (nm) and the vertical axis represents fluorescence intensity (RFU). Remarkable fluorescence was confirmed from T (10) and weak fluorescence was confirmed from A (10), but no fluorescence was detected from I (9) G.
<考察>
ウラシルからなる配列を有する核酸では、チミンからなる配列を有する核酸に比して、強度は劣るが、類似したスペクトル形状の蛍光を発した。この結果は、実施例1においても確認されている。また、シトシンからなる配列、あるいはシトシンとメチル化シトシンとからなる配列を有する核酸は、蛍光を発しないことが確認された。 <Discussion>
The nucleic acid having a sequence consisting of uracil emitted a similar spectral shape of fluorescence although the intensity was inferior to the nucleic acid having a sequence consisting of thymine. This result is also confirmed in Example 1. In addition, it was confirmed that a nucleic acid having a sequence consisting of cytosine or a sequence consisting of cytosine and methylated cytosine does not emit fluorescence.
これらの結果から、銅を用いた蛍光の検出によって、ウラシルを、シトシン及びメチル化シトシンから識別可能であることが示された。このことは、本発明に係る核酸検出方法によれば、バイサルフェート反応によるシトシン(C)のウラシル(U)への置換を検出し、DNA分子のメチル化の解析を行うことが可能であることが示唆された。
From these results, it was shown that uracil can be distinguished from cytosine and methylated cytosine by the detection of fluorescence using copper. This means that according to the nucleic acid detection method of the present invention, it is possible to detect substitution of cytosine (C) with uracil (U) by the bisulfate reaction, and analyze methylation of DNA molecules. Was suggested.
本技術によれば、サンプルと銅とを接触させるだけで、サンプル中の核酸の有無や数、及びその塩基配列、サンプル中の細胞核の形状、分布、数、大きさなどを簡便に検出又は計測することが可能である。
According to the present technology, simply by contacting the sample with copper, the presence or absence and number of nucleic acids in the sample, and the base sequence thereof, and the shape, distribution, number, size, etc. of cell nuclei in the sample can be easily detected or measured. It is possible.
この技術を用いることで、医療分野(病理学、腫瘍免疫学、移植学、遺伝学、再生医学、化学療法など)、創薬分野、臨床検査分野、食品分野、農業分野、工学分野、法医学分野、犯罪鑑識分野、など様々な分野において、核酸あるいは細胞の分析・解析技術の向上
に貢献できる。 Using this technology, medical fields (pathology, tumor immunology, transplantation, genetics, regenerative medicine, chemotherapy etc.), drug discovery fields, clinical examination fields, food fields, agriculture fields, engineering fields, forensic fields It can contribute to the improvement of nucleic acid or cell analysis / analysis technology in various fields such as crime crime identification field.
に貢献できる。 Using this technology, medical fields (pathology, tumor immunology, transplantation, genetics, regenerative medicine, chemotherapy etc.), drug discovery fields, clinical examination fields, food fields, agriculture fields, engineering fields, forensic fields It can contribute to the improvement of nucleic acid or cell analysis / analysis technology in various fields such as crime crime identification field.
Claims (10)
- 核酸を含むサンプルを銅と接触させる手順と、
前記サンプルから発せられる蛍光を検出する検出手順と、を含む前記核酸の検出方法。 Contacting the sample containing the nucleic acid with copper;
A detection procedure for detecting fluorescence emitted from the sample. - 前記検出手順において検出された蛍光の強度及び/又はスペクトルに基づいて、前記核酸の塩基配列を解析する請求項1記載の検出方法。 The detection method according to claim 1, wherein the base sequence of the nucleic acid is analyzed based on the intensity and / or spectrum of the fluorescence detected in the detection procedure.
- 前記検出手順において検出された蛍光の強度及び/又はスペクトルに基づいて、前記核酸が形成する二本鎖中のミスマッチを解析する請求項1記載の検出方法。 The detection method according to claim 1, wherein a mismatch in the double strand formed by the nucleic acid is analyzed based on the intensity and / or spectrum of the fluorescence detected in the detection procedure.
- 前記サンプルをバイサルフェート処理する手順を含み、
前記検出手順においてバイサルフェート処理前のサンプルから検出された蛍光の強度及び/又はスペクトルと、バイサルフェート処理後のサンプルから検出された蛍光の強度及び/又はスペクトルと、の差分に基づいて、
前記核酸におけるシトシンのメチル化あるいは脱メチル化を解析する請求項1記載の検出方法。 Including the step of bisulfate treating the sample;
Based on the difference between the intensity and / or spectrum of fluorescence detected from the sample before bisulfate treatment in the detection procedure and the intensity and / or spectrum of fluorescence detected from the sample after bisulfate treatment
The detection method according to claim 1, wherein methylation or demethylation of cytosine in the nucleic acid is analyzed. - 前記銅は、固形の銅である請求項2記載の検出方法。 The detection method according to claim 2, wherein the copper is solid copper.
- 前記接触手順は、塩の共存下で前記サンプルと銅とを接触させる手順である請求項5記載の検出方法。 The detection method according to claim 5, wherein the contacting step is a step of contacting the sample with copper in the coexistence of a salt.
- 前記検出手順は、波長300~420μmの光を前記サンプルに照射することにより、サンプルから発せられる蛍光を検出する手順である請求項6記載の検出方法。 The detection method according to claim 6, wherein the detection procedure is a procedure for detecting fluorescence emitted from a sample by irradiating the sample with light having a wavelength of 300 to 420 μm.
- 核酸を含むサンプルを銅と接触させる手順と、
前記サンプルから発せられる蛍光を検出する検出手順と、を含む前記サンプルの光学観察方法。 Contacting the sample containing the nucleic acid with copper;
A detection procedure for detecting fluorescence emitted from the sample. - 前記サンプルが細胞である請求項8記載の光学観察方法。 The optical observation method according to claim 8, wherein the sample is a cell.
- 銅と核酸とを含む複合体からなる蛍光体。 A phosphor comprising a complex containing copper and a nucleic acid.
Priority Applications (5)
| Application Number | Priority Date | Filing Date | Title |
|---|---|---|---|
| CN2011800532046A CN103189509A (en) | 2010-11-11 | 2011-11-04 | Method for detecting nucleic acid, method for optically observing sample, and phosphor |
| EP17170998.3A EP3269810B1 (en) | 2010-11-11 | 2011-11-04 | Method of detecting nucleic acids, method of optically observing sample and fluorescent substance |
| US13/882,909 US9459213B2 (en) | 2010-11-11 | 2011-11-04 | Method of detecting nucleic acids, method of optically observing sample and fluorescent substance |
| EP11839814.8A EP2639304B1 (en) | 2010-11-11 | 2011-11-04 | Method for detecting a nucleic acid |
| US15/257,690 US10081830B2 (en) | 2010-11-11 | 2016-09-06 | Method of detecting nucleic acids, method of optically observing sample and fluorescent substance |
Applications Claiming Priority (4)
| Application Number | Priority Date | Filing Date | Title |
|---|---|---|---|
| JP2010-252517 | 2010-11-11 | ||
| JP2010252517 | 2010-11-11 | ||
| JP2011-201542 | 2011-09-15 | ||
| JP2011201542A JP6003033B2 (en) | 2010-11-11 | 2011-09-15 | Nucleic acid detection method, sample optical observation method, and phosphor |
Related Child Applications (2)
| Application Number | Title | Priority Date | Filing Date |
|---|---|---|---|
| US13/882,909 A-371-Of-International US9459213B2 (en) | 2010-11-11 | 2011-11-04 | Method of detecting nucleic acids, method of optically observing sample and fluorescent substance |
| US15/257,690 Continuation US10081830B2 (en) | 2010-11-11 | 2016-09-06 | Method of detecting nucleic acids, method of optically observing sample and fluorescent substance |
Publications (1)
| Publication Number | Publication Date |
|---|---|
| WO2012063441A1 true WO2012063441A1 (en) | 2012-05-18 |
Family
ID=46050610
Family Applications (1)
| Application Number | Title | Priority Date | Filing Date |
|---|---|---|---|
| PCT/JP2011/006163 WO2012063441A1 (en) | 2010-11-11 | 2011-11-04 | Method for detecting nucleic acid, method for optically observing sample, and phosphor |
Country Status (5)
| Country | Link |
|---|---|
| US (2) | US9459213B2 (en) |
| EP (2) | EP2639304B1 (en) |
| JP (1) | JP6003033B2 (en) |
| CN (1) | CN103189509A (en) |
| WO (1) | WO2012063441A1 (en) |
Cited By (2)
| Publication number | Priority date | Publication date | Assignee | Title |
|---|---|---|---|---|
| JP2013233126A (en) * | 2012-05-10 | 2013-11-21 | Sony Corp | Microchip for nucleic acid analysis |
| CN111323396A (en) * | 2018-12-14 | 2020-06-23 | 中国林业科学研究院资源昆虫研究所 | Method for determining laccaic acid A content |
Families Citing this family (4)
| Publication number | Priority date | Publication date | Assignee | Title |
|---|---|---|---|---|
| JP6414238B2 (en) * | 2017-01-12 | 2018-10-31 | ソニー株式会社 | Microchip for nucleic acid analysis |
| EP3840758A1 (en) * | 2018-08-21 | 2021-06-30 | Deep Genomics Incorporated | Therapeutic splice-switching oligonucleotides |
| CA3111019A1 (en) * | 2019-05-31 | 2020-12-03 | Freenome Holdings, Inc. | Methods and systems for high-depth sequencing of methylated nucleic acid |
| JP2021097648A (en) * | 2019-12-23 | 2021-07-01 | 横河電機株式会社 | Nucleic acid sequence measurement device and nucleic acid sequence measurement method |
Family Cites Families (18)
| Publication number | Priority date | Publication date | Assignee | Title |
|---|---|---|---|---|
| NL8403691A (en) | 1984-12-05 | 1986-07-01 | Philips Nv | OPTICAL CONNECTING DEVICE. |
| US4969924A (en) | 1989-05-18 | 1990-11-13 | General Motors Corporation | Electro-optical connector plug |
| ES2089319T3 (en) | 1991-09-04 | 1996-10-01 | Furukawa Electric Co Ltd | OPTICAL CONNECTOR OF MULTIPLE CORES. |
| US20040086917A1 (en) * | 1995-09-27 | 2004-05-06 | Nanogen, Inc. | Methods for electronic fluorescent perturbation for analysis and electronic perturbation catalysis for synthesis |
| JP3975042B2 (en) * | 1999-12-27 | 2007-09-12 | 富士フイルム株式会社 | Method for immobilizing DNA fragment on solid support surface and DNA chip |
| DE10019058A1 (en) | 2000-04-06 | 2001-12-20 | Epigenomics Ag | Designing primers and probes for analyzing diseases associated with cytosine methylation state e.g. arthritis, cancer, aging, arteriosclerosis comprising fragments of chemically modified genes associated with cell cycle |
| EP1282824B1 (en) * | 2000-05-05 | 2006-03-15 | Bayer Technology Services GmbH | Doped nanoparticles as biolabels |
| US20020160400A1 (en) * | 2001-02-14 | 2002-10-31 | Lakowicz Joseph R. | Radiative decay engineering |
| US20030022150A1 (en) * | 2001-07-24 | 2003-01-30 | Sampson Jeffrey R. | Methods for detecting a target molecule |
| WO2003064701A2 (en) * | 2002-01-30 | 2003-08-07 | Epigenomics Ag | Method for the analysis of cytosine methylation patterns |
| DE10314579A1 (en) | 2003-03-31 | 2004-10-14 | Carl Zeiss Jena Gmbh | Apparatus for sequence analysis of nucleic acids has channels with fixed metal particles, where the sample is moved past them with an excitation beam for fluorescence to be passed through spectral analysis for evaluation |
| US7820385B2 (en) * | 2006-03-22 | 2010-10-26 | The United States Of America As Represented By The Department Of Health And Human Services, Centers For Disease Control And Prevention | Method for retaining methylation pattern in globally amplified DNA |
| JP2008157932A (en) * | 2006-12-01 | 2008-07-10 | Ebara Corp | Micro fluid device and temperature control system for micro fluid device |
| CN101168773B (en) * | 2007-10-16 | 2010-06-02 | 东南大学 | Nucleic acid sequencing method based on fluorescence quenching |
| US8380028B2 (en) | 2009-05-18 | 2013-02-19 | Hitachi Cable, Ltd. | Composite cable |
| CN102043204B (en) | 2009-10-20 | 2012-12-19 | 富士康(昆山)电脑接插件有限公司 | Connector |
| JP2013522688A (en) | 2010-03-19 | 2013-06-13 | コーニング インコーポレイテッド | Optical fiber interface device for electronic equipment |
| US9046671B2 (en) | 2010-05-14 | 2015-06-02 | Sumitomo Electric Industries, Ltd. | Composite optical fiber cable and composite optical fiber cable assembly providing protection by flexure |
-
2011
- 2011-09-15 JP JP2011201542A patent/JP6003033B2/en active Active
- 2011-11-04 WO PCT/JP2011/006163 patent/WO2012063441A1/en active Application Filing
- 2011-11-04 CN CN2011800532046A patent/CN103189509A/en active Pending
- 2011-11-04 US US13/882,909 patent/US9459213B2/en active Active
- 2011-11-04 EP EP11839814.8A patent/EP2639304B1/en not_active Not-in-force
- 2011-11-04 EP EP17170998.3A patent/EP3269810B1/en active Active
-
2016
- 2016-09-06 US US15/257,690 patent/US10081830B2/en active Active
Non-Patent Citations (35)
Cited By (4)
| Publication number | Priority date | Publication date | Assignee | Title |
|---|---|---|---|---|
| JP2013233126A (en) * | 2012-05-10 | 2013-11-21 | Sony Corp | Microchip for nucleic acid analysis |
| US20150086992A1 (en) * | 2012-05-10 | 2015-03-26 | Sony Corporation | Microchip for nucleic acid analysis |
| US10982255B2 (en) | 2012-05-10 | 2021-04-20 | Sony Corporation | Microchip for nucleic acid analysis |
| CN111323396A (en) * | 2018-12-14 | 2020-06-23 | 中国林业科学研究院资源昆虫研究所 | Method for determining laccaic acid A content |
Also Published As
| Publication number | Publication date |
|---|---|
| US20170081711A1 (en) | 2017-03-23 |
| US9459213B2 (en) | 2016-10-04 |
| US10081830B2 (en) | 2018-09-25 |
| EP2639304A1 (en) | 2013-09-18 |
| EP2639304A4 (en) | 2014-03-26 |
| JP2012118051A (en) | 2012-06-21 |
| EP3269810B1 (en) | 2021-03-17 |
| JP6003033B2 (en) | 2016-10-05 |
| EP2639304B1 (en) | 2017-05-17 |
| CN103189509A (en) | 2013-07-03 |
| EP3269810A1 (en) | 2018-01-17 |
| US20140038176A1 (en) | 2014-02-06 |
Similar Documents
| Publication | Publication Date | Title |
|---|---|---|
| JP5716406B2 (en) | Cell nucleus observation substrate and cell nucleus observation apparatus | |
| US10081830B2 (en) | Method of detecting nucleic acids, method of optically observing sample and fluorescent substance | |
| US10656149B2 (en) | Analyte detection enhancement by targeted immobilization, surface amplification, and pixelated reading and analysis | |
| US20180088048A1 (en) | Devices, methods, and systems relating to super resolution imaging | |
| WO2014144133A1 (en) | Analyte detection enhancement by targeted immobilization, surface amplification, and pixelated reading and analysis | |
| JP2010517026A (en) | Analyte detection method using both optical measurement method and electrical measurement method | |
| Chen et al. | Fabrication of metal nanoshell quantum-dot barcodes for biomolecular detection | |
| Connally | A device for gated autosynchronous luminescence detection | |
| US10982255B2 (en) | Microchip for nucleic acid analysis | |
| JP6414238B2 (en) | Microchip for nucleic acid analysis | |
| WO2023114209A1 (en) | Methods for loading and data acquisition | |
| JP4677254B2 (en) | Cell separation method, cell identification method and cell inspection method | |
| JP6013339B2 (en) | Method for detecting target particles in a biological sample containing pancreatic juice | |
| Jin | Background-free cytometry using rare earth complex bioprobes | |
| Leif et al. | Increasing lanthanide luminescence by use of the RETEL effect | |
| Yuen et al. | Towards malaria field diagnosis based on surface-enhanced Raman scattering with on-chip sample preparation and near-analyte nanoparticle synthesis | |
| Hawa | Application of Fluorescence in Life Sciences for Basic Research and Medical Diagnostics | |
| EP1831698B9 (en) | Analytical composition and method | |
| Ngo | Development of Nucleic Acid Detection Methods and Systems Using Nanobiosensors and Surface-enhanced Raman Spectroscopy for In Vitro Molecular Diagnostics | |
| Valta | Spectrally Tuned Lanthanide Photoluminescence for Point-of-Care Testing |
Legal Events
| Date | Code | Title | Description |
|---|---|---|---|
| 121 | Ep: the epo has been informed by wipo that ep was designated in this application |
Ref document number: 11839814 Country of ref document: EP Kind code of ref document: A1 |
|
| REEP | Request for entry into the european phase |
Ref document number: 2011839814 Country of ref document: EP |
|
| WWE | Wipo information: entry into national phase |
Ref document number: 2011839814 Country of ref document: EP |
|
| WWE | Wipo information: entry into national phase |
Ref document number: 13882909 Country of ref document: US |
|
| NENP | Non-entry into the national phase |
Ref country code: DE |