WO2012011427A1 - Gnssログ解析プログラム、gnssログ解析装置 - Google Patents
Gnssログ解析プログラム、gnssログ解析装置 Download PDFInfo
- Publication number
- WO2012011427A1 WO2012011427A1 PCT/JP2011/066067 JP2011066067W WO2012011427A1 WO 2012011427 A1 WO2012011427 A1 WO 2012011427A1 JP 2011066067 W JP2011066067 W JP 2011066067W WO 2012011427 A1 WO2012011427 A1 WO 2012011427A1
- Authority
- WO
- WIPO (PCT)
- Prior art keywords
- log
- gnss
- analysis program
- data
- gps
- Prior art date
- Legal status (The legal status is an assumption and is not a legal conclusion. Google has not performed a legal analysis and makes no representation as to the accuracy of the status listed.)
- Ceased
Links
Images


Classifications
-
- G—PHYSICS
- G01—MEASURING; TESTING
- G01C—MEASURING DISTANCES, LEVELS OR BEARINGS; SURVEYING; NAVIGATION; GYROSCOPIC INSTRUMENTS; PHOTOGRAMMETRY OR VIDEOGRAMMETRY
- G01C21/00—Navigation; Navigational instruments not provided for in groups G01C1/00 - G01C19/00
- G01C21/26—Navigation; Navigational instruments not provided for in groups G01C1/00 - G01C19/00 specially adapted for navigation in a road network
- G01C21/34—Route searching; Route guidance
- G01C21/36—Input/output arrangements for on-board computers
- G01C21/3667—Display of a road map
- G01C21/3676—Overview of the route on the road map
Definitions
- the present invention mainly relates to a GNSS log analysis program for analyzing a log file of a GNSS receiver.
- GPS Global Positioning System
- the GPS receiver performs positioning based on signals received from a plurality of GPS satellites.
- the output of the GPS receiver can be used in real time by, for example, a car navigation system, or can be stored in a log file by a device called a GPS logger. Then, by analyzing the recorded log file at a later date, various information such as the movement locus of the GPS receiver and the positioning status can be confirmed.
- the GPS log analysis program for performing such log analysis is widely distributed, although there are no examples described in the publicly known literature, and there is an example used especially for hobby use. For example, if the output of the in-vehicle GPS is stored in a log file during a holiday drive, the drive route and the like can be confirmed at a later date by performing log analysis of the log file.
- the log file may be subjected to log analysis in order to evaluate the performance of the GPS receiver.
- the conventional GPS log analysis program can only analyze a log file of one type of GPS receiver. Not considered. In other words, in the conventional GPS log analysis program, it is not considered that the log files of a plurality of types of GPS receivers are compared with each other.
- the present invention has been made in view of the above circumstances, and a main object of the present invention is to provide a GNSS log analysis program capable of analyzing a log in which outputs of a plurality of GNSS receivers are compared with each other. There is.
- a computer includes a process including a data reading step of reading log data in which an output of a GNSS receiver is recorded, and a display step of displaying information acquired based on the log data.
- the following GNSS log analysis program is provided. That is, the GNSS log analysis program can read log data of each of a plurality of GNSS receivers in the data reading step.
- the display step information acquired based on the log data of each of the plurality of GNSS receivers is displayed on one screen.
- the GNSS log analysis program displays the information related to the positioning result acquired based on the log data of each of the plurality of GNSS receivers in a manner superimposed on a coordinate system indicating a position on the earth. Is preferred.
- the GNSS log analysis program preferably displays a time series graph of information acquired based on log data of each of the plurality of GNSS receivers in the display step.
- the GNSS log analysis program preferably causes the computer to execute the following processing. That is, the GNSS log analysis program includes a time range setting step for setting a time range. And in the said display step, only the information acquired based on the log data contained in the said set time range is displayed among the information acquired based on each log data of these several GNSS receivers.
- the GNSS log analysis program can gradually change the time range.
- the GNSS log analysis program sets the time range within a range set by a time range settable range setting unit for setting a range in which the time range can be set, and the range set by the time range settable range setting unit. It is preferable to display the time range setting unit.
- the time range can be set more finely by setting the time range in two stages.
- the GNSS log analysis program preferably displays information acquired based on log data of each of the plurality of GNSS receivers in synchronization with the UTC time of the log data.
- the GNSS log analysis program includes a log file analysis step of analyzing log data included in the log file and obtaining statistical information of the log file. In the display step, the statistical information of each log file is displayed side by side on one screen.
- a GNSS comprising: a data capturing unit that captures log data recording an output of a GNSS receiver; and a display unit that displays information acquired based on the log data.
- the following GNSS log analyzer is provided as a log analyzer. That is, the GNSS log analysis apparatus can capture log data of each of a plurality of GNSS receivers by the data capturing unit. In the display unit, information acquired based on log data of each of the plurality of GNSS receivers is displayed on one screen.
- FIG. 1 shows a state in which outputs of a plurality of GPS receivers (GNSS receivers) are recorded in a log file and taken into a GPS log analysis device (GNSS log analysis device) according to an embodiment of the present invention. ing.
- the performance of three GPS receivers (the first GPS receiver 11, the second GPS receiver 12, and the third GPS receiver 13) having different manufacturers, models, and the like are compared with the performance of the GPS log analyzer according to the present embodiment.
- a case where a comparative evaluation is performed using 1 will be described.
- the user mounts the three GPS receivers 11, 12, and 13 in, for example, an automobile and simultaneously performs positioning by the three GPS receivers 11, 12, and 13 while appropriately driving the automobile. Since the three GPS receivers 11, 12, and 13 are mounted on the same car, ideally they should show the same positioning results, but each GPS receiver 11, 12, and 13 has different performance, The results output by the GPS receivers 11, 12, and 13 are different.
- each GPS receiver 11, 12, 13 When each GPS receiver 11, 12, 13 receives a radio wave from a GPS satellite and calculates a positioning result, it outputs the positioning result and various statuses when the positioning is performed as output data. Output data output from each GPS receiver 11, 12, 13 is input to the corresponding GPS logger 21, 22, 23. Note that the format of output data output from the GPS receivers 11, 12, and 13 is standardized by the NMEA (National Marine Electronics Association) (NMEA-0183 format). Therefore, even if the types and manufacturers of the GPS receivers 11, 12, and 13 are different, the output data can be handled uniformly.
- NMEA National Marine Electronics Association
- This output data includes the following information, for example. That is, information indicating a positioning result (latitude, longitude, altitude), information indicating UTC time when the positioning is performed, information indicating a positioning state (positioning impossible, single positioning, or DGPS), positioning mode (2D positioning) Or 3D positioning), information indicating the number of GPS satellites tracked at the time of positioning, information on each GPS satellite (signal-to-noise ratio, etc.), information indicating ground speed, information indicating traveling direction , Etc.
- Each GPS logger 21, 22, 23 has a log file for storing the output data. Output data newly input to each GPS logger is added to the end of the log file and stored. Thereby, output data is preserve
- the log file is prepared for each GPS receiver. Accordingly, in the present embodiment, three log files are generated corresponding to the three GPS receivers 11, 12, and 13. The name of the log file storing the output data of the first GPS receiver 11 is “file1.log”, the name of the log file storing the output data of the second GPS receiver 12 is “file2.log”, and the third The name of the log file storing the output data of the GPS receiver 13 is “file3.log”. In the following description, each piece of output data stored in the log file is referred to as log data.
- the GPS log analysis apparatus 1 includes a hardware configured as a general PC (personal computer) 30 and a GPS log analysis program (GNSS log) stored in a hard disk or the like of the PC 30. Analysis software). The hardware and the software cooperate to allow the PC 30 to function as the GPS log analysis device 1.
- the PC 30 includes an external connection unit 31 configured as, for example, a USB (Universal Serial Bus) connector.
- the GPS loggers 21, 22, and 23 are configured to be connected to the external connection unit 31.
- the user who wants to perform log analysis brings back the GPS loggers 21, 22, and 23 in which the log files are recorded
- the log file in the GPS loggers 21, 22, 23 is transferred to the PC 30 by connecting to the external connection unit 31 of the PC 30.
- the external connection unit 31 is a data take-in unit.
- the log files acquired from the GPS loggers 21, 22, and 23 are recorded, for example, on a hard disk (not shown) included in the PC 30.
- the PC includes a display unit 32 such as a liquid crystal display and an input unit 33 including a mouse and a keyboard.
- the user can start the GPS log analysis program by appropriately operating the input unit 33.
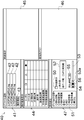
- a log analysis screen 40 as shown in FIG.
- a log file selection unit 41 is displayed on the log analysis screen 40.
- the log file selection unit 41 includes a file name designation field 42 and an analysis start button 43.
- the user can designate a log file for log analysis by inputting the file path of the log file in the file name designation field 42.
- the analysis start button 43 after inputting the file path in the file name designation column 42, the data read step of the GPS log analysis program is executed, and the designated log file is read. Thereby, the log data included in the log file can be used by the GPS log analysis program.
- a plurality of file name designation fields 42 are displayed in the log file selection section 41, and different file names can be designated in the respective file name designation fields 42, 42, 42. That is, the GPS log analysis program of this embodiment can simultaneously read and analyze a plurality of log files. For example, in the example of FIG. 2, three log files “file1.log”, “file2.log”, and “file3.log” described in FIG. 1 are designated. In this state, when the user operates the analysis start button 43, three log files are read. Thereby, the log data of three different GPS receivers, that is, the first GPS receiver 11, the second GPS receiver 12, and the third GPS receiver 13, can be used in the GPS log analysis program. Become.
- the log file analysis step of the GPS analysis program is executed.
- log data included in the log file is analyzed, and statistical information (for example, an average value of various status information) of the log file is acquired.
- the log data is analyzed for each log file, and statistical information about each log file is acquired.
- the display step of the GPS log analysis program is executed.
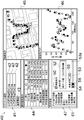
- the GPS log analysis device 1 displays various information acquired based on the log data in the log analysis screen 40 displayed on the display unit 32 (FIG. 3). State).
- the information acquired based on the log data includes statistical information of the log file (information acquired in the log file analysis step) in addition to the information obtained from the individual log data.
- information acquired based on the log data of a plurality of different log files is displayed in one screen (log analysis screen 40).
- log analysis screen 40 information acquired based on the log data of a plurality of different log files is displayed in one screen.
- the log analysis screen 40 includes an analysis result display unit 44, a track display unit 45, a time series graph display unit 46, a display setting unit 47, Are arranged side by side in one screen.
- the analysis result display unit 44, the wake display unit 45, and the time series graph display unit 46 information acquired from the log data of each of the plurality of GPS receivers 11, 12, and 13 is displayed.
- the analysis result display unit 44 displays statistical information of each log file (information acquired in the log file analysis step). For example, in this embodiment, 2D positioning rate, 3D positioning rate, positioning rate, speed detection rate, average tracking satellite number, average positioning satellite number, and the like are displayed as statistical information of the log file.
- the 3D positioning rate indicates a ratio of three-dimensional positioning (latitude, longitude, and altitude positioning) among the positioning performed by the GPS receivers 11, 12, and 13. Further, the 2D positioning rate indicates a ratio at which only the latitude and longitude are determined because the three-dimensional positioning cannot be performed due to a small number of GPS satellites that can receive signals.
- the positioning rate is the sum of the 3D positioning rate and the 2D positioning rate.
- the speed detection rate indicates the ratio of positioning at which the speed can be acquired.
- the average number of tracking satellites indicates an average value of the number of satellites tracked at the time of positioning, and the average number of positioning satellites indicates the average number of satellites used for positioning.
- the wake display unit 45 will be specifically described.
- a two-dimensional coordinate system indicating a position on the earth is set so that the vertical axis is latitude and the horizontal axis is longitude.
- the GPS log analysis program plots and displays the positioning results acquired from each log data in the two-dimensional coordinate system. That is, the plotted points displayed on the wake display unit 45 indicate the positioning positions on the earth surface.
- the positioning results output from the GPS receivers 11, 12, and 13 also move every moment. Therefore, by plotting each positioning result on the wake display unit 45, as shown in FIG. 3, the traces (wakes) of the movement of the GPS receivers 11, 12, and 13 can be visually displayed.
- the positioning results obtained from a plurality of log files are plotted in a common two-dimensional coordinate system.
- wakes obtained from a plurality of log files are superimposed and displayed in the same drawing area.
- a plurality of different GPS receivers 11, 12, 13 are mounted on the same vehicle and are positioned, ideally, the positioning positions of the respective GPS receivers 11, 12, 13 match.
- the tracks displayed on the track display unit 45 should overlap. However, the positioning position may be displaced due to factors such as differences in performance of the GPS receivers 11, 12, and 13. As a result, the tracks displayed on the track display unit 45 may be shifted from each other.
- the positioning performance of each of the GPS receivers 11, 12, and 13 can be evaluated by checking how much the wakes are deviated from each other. In this way, since the wake obtained from each log file is displayed superimposed on one screen, it is visually determined how much the positioning results of the GPS receivers 11, 12, and 13 are different from each other. It becomes possible to grasp and it becomes easy to evaluate the positioning performance of each GPS receiver 11,12,13.
- a map is displayed on the wake display unit 45 and the wake is superimposed on the map. That is, when the GPS receivers 11, 12, and 13 are mounted on an automobile and positioning is performed as described above, each wake should pass on the road. Therefore, when the wake passes through a position off the road, it can be determined that the positioning result of the GPS receiver corresponding to the wake is bad. In addition, when the map displayed on the wake display unit 45 is confirmed and it is found that there is a large building in the vicinity of the position where the positioning result is bad, the positioning result is adversely affected by the multipath due to the building. It can be judged that it is.
- Whether or not to display the map can be switched by the user depending on whether or not the map display check box 50 displayed on the display setting unit 47 is checked. Even when the measurement result is superimposed and displayed on the map as described above, it can be said that the measurement result is superimposed and displayed on the two-dimensional coordinate system indicating the position on the earth.
- the symbols displayed at the plot points when plotting the positioning results in the two-dimensional coordinate system are different for each log file. Which symbol corresponds to which log file is displayed in the analysis result display unit 44.
- the positioning result obtained from “file1.log” is a square symbol
- the positioning result obtained from “file2.log” is a triangle symbol
- the results are displayed as circular symbols.
- the time series graph display unit 46 displays a time series graph of log data.
- the vertical axis of this time series graph is the value of information obtained from each log data, and the horizontal axis is the time when the log data is acquired.
- the GPS log analysis program plots and displays information obtained from each log data on a time series graph.
- the data output from each GPS receiver includes information indicating positioning results, information indicating positioning status, information indicating the number of GPS satellites, information on GPS satellites, information indicating ground speed, progress It contains a lot of information, such as direction information. Since such a large amount of information cannot be displayed on one time series graph, the GPS log analysis program of the present embodiment allows the user to select the type of information to be displayed on the time series graph.
- the time series graph of the selected item is displayed as the time series graph display. It can be displayed on the part 46.
- the positioning state As the information to be displayed on the time-series graph display unit 46, the positioning state, the number of tracking satellites, the number of positioning satellites (the number of satellites used for positioning), and the speed (ground speed) , Height, information of each satellite, position error information, true direction (traveling direction) can be selected.
- the position error information is information indicating how much the positioning result of a certain GPS receiver is deviated from the positioning results of other GPS receivers.
- the speed (ground speed) is selected as information to be displayed on the time series graph display unit 46.
- the vertical axis of the time series graph is the speed [km / h]
- the horizontal axis is the time when the speed is observed. Therefore, in this case, by looking at the time-series graph displayed on the time-series graph display unit 46, the moving speed at each time, acceleration and deceleration are performed, and the time can be confirmed.
- the symbols displayed at the plot points when information is plotted on the time-series graph display unit 46 are different for each log file.
- the correspondence between the symbols of the time-series graph display unit 46 and the log file is the same as the symbols plotted on the track display unit 45. That is, in the example of FIG. 3, the information obtained from “file1.log” is a square symbol, the information obtained from “file2.log” is a triangular symbol, and the information obtained from “file3.log” is a circle. Each symbol is displayed.
- the log display unit 45 and the time-series graph display unit 46 display the common log symbols for each log file. It becomes easy to compare the contents.
- the plot points of the time series graph display unit 46 are plotted on the horizontal axis corresponding to the order (data order) in which the log data is read from the top of each log file. That is, as described above, new log data is added to the end of the log file, so plot the information obtained from the log data in the order in which the log data was read from the top of the log file.
- a graph along the time series can be generated.
- the plot points of each log file Therefore, it is difficult to compare the logs of the GPS receivers 11, 12, and 13.
- the UTC time of each log data corresponds to the horizontal axis of the time series graph instead of the configuration in which the information is plotted on the time series graph display unit 46 in the data order as described above.
- the information obtained from the log data can be plotted.
- information obtained at the same UTC time can be displayed on the time-series graph display unit 46 with the horizontal axis matched. That is, the information obtained from the log data can be displayed in synchronization with the UTC time.
- the logs of the GPS receivers 11, 12, 13 are easily compared. be able to.
- the time range setting function of the GPS log analysis program will be described. That is, in the GPS log analysis program of this embodiment, the user can set the time range of information displayed on the track display unit 45 and the time series graph display unit 46.
- the time range is set by operating the knob 53a of the time range setting slider 53 displayed on the display setting unit 47 so that the user slides left and right.
- the left end of FIG. 3 represents the logging start time
- the right end represents the logging end time.
- An arbitrary time between the logging start time and the logging end time can be specified by operating the knob 53a to slide left and right.
- the time range setting step of the GPS log analysis program is executed.
- a time range is set based on the position of the knob 53a. Specifically, a range from the logging start time to the time set by the knob 53a is set as the time range. Therefore, it can be said that the logging start time is the start time of the time range, and the time range setting slider 53 sets the end time of the time range.
- the display step of the GPS log analysis program is executed.
- the display step only the information obtained from the log data within the specified time range is plotted and displayed on the track display unit 45 and the time series graph display unit 46.
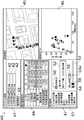
- the position of the knob 53a of the time range setting slider 53 is set to about one third of the position from the left end position, the log data is within one third of the range from the logging start time. Only the information based on the wake display unit 45 and the time series graph display unit 46 is displayed.
- the relationship between the positioning result at the desired time and the time series graph can be compared. That is, it is possible to confirm what value the time series graph had when a certain positioning result was obtained. For example, when the positioning result is bad, by sliding the knob 53a to a position corresponding to the time when the bad result was obtained, the environment where the bad result was measured (displayed on the wake display unit 45) Check the map to find out the environment in which the positioning was performed) and the time-series graph value at that time (the value of the item specified by the graph display switching radio button 51 such as the positioning state and the number of tracking satellites) And the relationship can be easily confirmed. Thereby, evaluation of the performance of each GPS receiver 11, 12, 13 can be performed more appropriately.
- the end time of the above time range can be automatically and gradually changed.
- a playback button 54 is displayed on the display setting unit 47. Then, when the user operates the playback button 54, the end time is gradually delayed (the knob 53a automatically moves toward the right side).
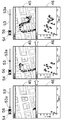
- the time range is gradually widened, and as shown in FIG. 5, a state in which the plot points are gradually plotted according to the time series of the log data is displayed on the wake display unit 45 and the time series graph display unit 46. be able to. Thereby, the transition of a wake and a time-sequential graph can be confirmed easily.
- the speed at which the end time is changed can be numerically designated by the display speed setting unit 55. Further, the above-described processing for automatically changing the end time can be interrupted by the user operating the stop button 56.
- only the end time of the time range can be set by the time range setting slider 53.
- the start time of the time range can be set.
- FIG. 1 A modification of the user interface for setting the time range is shown in FIG.
- the specification of the time range by the slider is intuitive, there is a problem that it is difficult to set the time range in detail.
- this modification is configured to set the time range in two stages. Specifically, in this modification, in addition to the time range setting slider 153, a time range settable range setting slider 57 is displayed on the display setting unit 47.
- the time range settable range setting slider 57 includes two knobs 57a and 57b that can slide to the left and right.
- the first knob 57a can set the start time of the time range settable range
- the second knob 57b can set the end time of the time range settable range.
- the time range setting slider 153 of the modified example includes a knob 153a that can slide to the left and right, like the time range setting slider 53 of the above embodiment.
- the left end in FIG. 6 represents the start time of the time range settable range
- the right end represents the end time of the time range settable range.
- the time range setting slider 153 of the modified example is a slider in which the range between the first knob 57a and the second knob 57b of the time range settable range setting slider 57 is enlarged. Therefore, the time range can be finely specified by the time range setting slider 153.
- the time range can be set by specifying a range (time range settable range), and the time range can be set by the user interface shown by expanding the time range settable range. The range can be set intuitively and more finely.
- the GPS log analysis program of this embodiment includes a data reading step for reading log data in which the output of the GPS receiver is recorded, and a display step for displaying information acquired based on the log data.
- the PC 30 is caused to execute processing including
- the GNSS log analysis program can read log data of each of the plurality of GNSS receivers in the data reading step.
- information acquired based on the log data of each of the plurality of GNSS receivers is displayed on one screen (log analysis screen 40).
- the GPS log analysis device 1 of the present embodiment includes an external connection unit 31 that captures log data that records the output of a GPS receiver, and a display unit 32 that displays information acquired based on the log data. ing.
- the GPS log analysis device 1 can take in log data of each of a plurality of GPS receivers through the external connection unit 31.
- the display unit 32 information acquired based on the log data of each of the plurality of GPS receivers is displayed on one screen (log analysis screen 40).
- the GPS log analysis program of the present embodiment displays the information related to the positioning result acquired based on the log data of each of the plurality of GPS receivers in the display step by superimposing the information on the coordinate system indicating the position on the earth. is doing.
- the GPS log analysis program of the present embodiment displays a time series graph of information acquired based on the log data of each of the plurality of GPS receivers.
- the GPS log analysis program of this embodiment includes a time range setting step for setting a time range. And in the said display step, only the information acquired based on the log data contained in the said set time range is displayed among the information acquired based on each log data of several GPS receiver. .
- the GPS log analysis program of this embodiment can gradually change the time range.
- the GNSS log analysis program includes a time range settable range setting slider 57 for setting a range in which the time range can be set, and a time range within the range set by the time range settable range setting slider 57.
- a time range setting slider 153 to be set is displayed.
- the time range can be set more finely by setting the time range in two stages.
- the GPS log analysis program of this embodiment can display the information acquired based on each log data of a plurality of GPS receivers in synchronization with the UTC time of each log data in the display step. is there.
- log data of each GPS receiver is recorded in a log file prepared for each GPS receiver.
- the GPS log analysis program according to the present embodiment includes a log file analysis step of analyzing log data included in the log file and obtaining statistical information of the log file. In the display step, the statistical information of each log file is displayed side by side on one screen.
- the GPS is used as the GNSS, but other GNSS may be used.
- the function of the GPS log analysis device has been described as being realized by software and hardware. However, part or all of the function of the GPS log analysis device may be realized by dedicated hardware. .
- the display content of the log analysis screen 40 described in the above embodiment is an example, and the present invention is not limited to this.
- the screen layout, the configuration of the graphical user interface, and the like can be changed as appropriate.
- the time range is not limited to the configuration set by the slider, but may be a configuration in which the time range is designated by numerical input, for example.
- the log file selection unit 41, the analysis result display unit 44, the wake display unit 45, the time series graph display unit 46, and the display setting unit 47 do not need to display all in one screen. You may make it display separately.
- the display setting unit 47 can be omitted if there is no need to change the items to be displayed. Further, only one of the analysis result display unit 44, the wake display unit 45, and the time series graph display unit 46 may be provided. In short, it is only necessary that the contents of a plurality of log files can be compared with each other in one screen, and the present invention is not limited to the above embodiment. However, it is particularly preferable that the track display unit 45 and the time-series graph display unit 46 are displayed side by side in one screen because plot points can be compared with each other.
- the symbols of the plot points in the wake display unit 45 and the time-series graph display unit 46 have different shapes for each log file, but for example, the colors of the symbols may be different.
- the wake display unit 45 has been described as plotting the positioning result in the two-dimensional coordinate system.
- the positioning result may be displayed three-dimensionally, for example.
- the output of the GPS receiver is logged by the GPS logger and then the log file is taken into the PC.
- the GPS receiver is directly connected to the PC, and the PC Logging may be performed. That is, the GPS log analyzer may also serve as a logger.
- the number of GPS receivers that record log data is three, but may be two or four or more.
- the number of log files read at one time by the GPS log analysis program may be three as described above, or two, four or more. That is, the number of log files analyzed by the GPS log analysis program of the present embodiment is not particularly limited.
- the plurality of log files can be compared and examined. Note that if it is not necessary to compare and examine the performance of GPS receivers as described above, only one log file may be analyzed by the GPS log analysis program of the present embodiment.
- the GPS receiver need not be mounted on an automobile or the like and moved, and positioning may be performed at a fixed point. Even in this case, the positioning result of each GPS receiver may fluctuate slightly due to the influence of jamming radio waves or the like. Therefore, the performance of each GPS receiver can be compared by analyzing the log file of each GPS receiver measured at a fixed point with the GPS log analysis program of this embodiment.
Landscapes
- Engineering & Computer Science (AREA)
- Radar, Positioning & Navigation (AREA)
- Remote Sensing (AREA)
- Automation & Control Theory (AREA)
- Physics & Mathematics (AREA)
- General Physics & Mathematics (AREA)
- Position Fixing By Use Of Radio Waves (AREA)
Abstract
複数のGNSS受信機の出力を記録したログを、互いに比較しながら解析することのできる、GNSSログ解析プログラムを提供することを目的とする。GPSログ解析プログラムは、GPS受信機の出力を記録したログデータを読み込むデータ読込ステップと、前記ログデータに基づいて取得された情報を表示する表示ステップと、を含む処理をPCに実行させる。また、このGNSSログ解析プログラムは、データ読込ステップにおいて、複数のGNSS受信機それぞれのログデータを読み込み可能である。そして、表示ステップにおいては、複数のGNSS受信機それぞれのログデータに基づいて取得された情報を、1つの画面(ログ解析画面40)に表示している。
Description
本発明は、主として、GNSS受信機のログファイルを解析するためのGNSSログ解析プログラムに関する。
近年、GPS(Global Positioning System)等のGNSS(Global Navigation Satellite System:全地球航法衛星システム)を利用した測位が広く行われている。GPS受信機は、複数のGPS衛星から受信した信号に基づいて、測位を行う。GPS受信機の出力は、例えばカーナビゲーションシステム等によってリアルタイムに利用することができるほか、GPSロガーと呼ばれる装置によってログファイルに記憶することができる。そして、記録されたログファイルを後日ログ解析することにより、GPS受信機の移動軌跡や測位状況などの各種情報を確認することができる。
このようなログ解析を行うGPSログ解析プログラムは、公知文献に記載された例は見あたらないものの、広く一般に配布されており、特にホビーユースで利用されている例が見られる。例えば、休日のドライブのときに車載GPSの出力をログファイルに保存しておけば、当該ログファイルのログ解析を行うことにより、ドライブの道程等を後日確認することができる。
一方で、上記ログファイルは、GPS受信機の出力が逐次記録されたものであるから、当該GPS受信機の性能等を評価するためにログファイルのログ解析を行うことが考えられる。
ところで、GPS受信機の性能を評価する際には、複数の機種で同時に測位を行って、それぞれの測位結果を相互に比較することにより、各GPS受信機の測位精度の良否等を判断する場合がある。というのも、GPS受信機の測位結果は、GPS受信機の性能のみならず、測位を行ったときの周囲の環境にも大きく影響を受けるものであるから、GPS受信機の性能を正しく評価するためには、同じ環境で測位を行った別のGPS受信機の測位結果との比較評価が不可欠となるのである。
しかしながら、GPS受信機の一般的な用途においては、測位に用いるGPS受信機は1つで十分であるから、従来のGPSログ解析プログラムは、1種類のGPS受信機のログファイルを解析することしか考慮されていない。即ち、従来のGPSログ解析プログラムでは、複数の機種のGPS受信機それぞれのログファイルを、相互に比較するということは考慮されていなかった。
このため、従来のGPSログ解析プログラムを用いたログ解析では、GPS受信機の性能を正しく評価することが著しく困難、ないし不可能であった。
本発明は以上の事情に鑑みてされたものであり、その主要な目的は、複数のGNSS受信機の出力を記録したログを、互いに比較しながら解析することのできるGNSSログ解析プログラムを提供することにある。
本発明の解決しようとする課題は以上の如くであり、次にこの課題を解決するための手段とその効果を説明する。
本発明の第1の観点によれば、GNSS受信機の出力を記録したログデータを読み込むデータ読込ステップと、前記ログデータに基づいて取得された情報を表示する表示ステップと、を含む処理をコンピュータに実行させるGNSSログ解析プログラムであって、以下のGNSSログ解析プログラムが提供される。即ち、このGNSSログ解析プログラムは、前記データ読込ステップにおいて、複数のGNSS受信機それぞれのログデータを読み込み可能である。そして、前記表示ステップにおいて、前記複数のGNSS受信機それぞれのログデータに基づいて取得された情報を、1つの画面に表示する。
このように、複数のGNSS受信機それぞれのログデータから得られた情報を1つの画面に表示することができるので、当該ログデータを相互に比較しながら検討することが容易になる。
前記のGNSSログ解析プログラムは、前記表示ステップにおいて、前記複数のGNSS受信機それぞれのログデータに基づいて取得された測位結果に関する情報を、地球上の位置を示す座標系に重畳させて表示することが好ましい。
これにより、複数のGNSS受信機の測位結果を、重畳させた状態で視覚化することができるので、例えば測位結果のズレを容易に確認することができる。
前記のGNSSログ解析プログラムは、前記表示ステップにおいて、前記複数のGNSS受信機それぞれのログデータに基づいて取得された情報の時系列グラフを表示することが好ましい。
これにより、複数のGNSS受信機の出力の経時変化を、重畳させた状態で視覚化することができるので、例えば特定の時間における各GNSS受信機の出力の違いを容易に確認することができる。
前記のGNSSログ解析プログラムは、以下の処理を前記コンピュータに実行させることが好ましい。即ち、このGNSSログ解析プログラムは、時間範囲を設定する時間範囲設定ステップを含む。そして、前記表示ステップにおいて、前記複数のGNSS受信機それぞれのログデータに基づいて取得された情報のうち、前記設定された時間範囲に含まれるログデータに基づいて取得された情報のみを表示する。
これにより、所望の時間範囲のログデータのみを表示することができるので、特定の時間におけるログデータを容易に確認することができる。
前記のGNSSログ解析プログラムは、前記時間範囲を徐々に変化させることが可能であることが好ましい。
これにより、ログデータが時間の経過によって刻一刻と変化する様子を視覚化することができる。
前記のGNSSログ解析プログラムは、前記時間範囲を設定可能な範囲を設定する時間範囲設定可能範囲設定部と、前記時間範囲設定可能範囲設定部で設定された範囲の中で前記時間範囲を設定する時間範囲設定部と、を表示することが好ましい。
このように、時間範囲の設定を2段階で行うことにより、時間範囲をより細かく設定することができる。
前記のGNSSログ解析プログラムは、前記表示ステップにおいて、前記複数のGNSS受信機それぞれのログデータに基づいて取得された情報を、前記ログデータのUTC時刻で同期させて表示することが好ましい。
これにより、ログデータに漏れがある場合や、ログデータの記録開始時刻や記録間隔が異なる場合であっても、同時刻におけるログデータの比較を容易に行うことができる。
前記のGNSSログ解析プログラムにおいて、各GNSS受信機のログデータは、GNSS受信機ごとに用意されたログファイルに記録されているとともに、以下の処理を前記コンピュータに実行させることが好ましい。即ち、このGNSSログ解析プログラムは、前記ログファイルに含まれるログデータを解析して、当該ログファイルの統計的な情報を取得するログファイル解析ステップを含む。そして、前記表示ステップにおいて、各ログファイルの前記統計的な情報を、1つの画面に並べて表示する。
これにより、ログデータから得られた統計的な情報を、容易に比較することができる。
本発明の第2の観点によれば、GNSS受信機の出力を記録したログデータを取り込むデータ取込部と、前記ログデータに基づいて取得された情報を表示する表示部と、を備えたGNSSログ解析装置であって、以下のGNSSログ解析装置が提供される。即ち、このGNSSログ解析装置は、前記データ取込部によって、複数のGNSS受信機それぞれのログデータを取り込み可能である。そして、前記表示部において、前記複数のGNSS受信機それぞれのログデータに基づいて取得された情報を、1つの画面に表示する。
このように、複数のGNSS受信機それぞれのログデータから得られた情報を1つの画面に表示することができるので、当該ログデータを相互に比較しながら検討することが容易になる。
次に、図面を参照して本発明の実施の形態を説明する。図1には、複数のGPS受信機(GNSS受信機)の出力をログファイルに記録して、本発明の一実施形態に係るGPSログ解析装置(GNSSログ解析装置)に取り込んでいる様子を示している。
以下、メーカや型式等が異なる3つのGPS受信機(第1のGPS受信機11、第2のGPS受信機12、第3のGPS受信機13)の性能を、本実施形態のGPSログ解析装置1を利用して比較評価する場合について説明する。この場合、ユーザは、当該3つのGPS受信機11,12,13を、例えば自動車に搭載して、当該自動車を適宜走行させつつ、3つのGPS受信機11,12,13による測位を同時に行う。3つのGPS受信機11,12,13は同じ自動車に搭載されているため、理想的には同じ測位結果を示すはずであるが、各GPS受信機11,12,13は性能が異なるために、それぞれのGPS受信機11,12,13が出力する結果は異なる。
各GPS受信機11,12,13は、GPS衛星からの電波を受信して測位結果を算出すると、当該測位結果、及び当該測位を行ったときの各種ステータス等を、出力データとして出力する。各GPS受信機11,12,13が出力する出力データは、それぞれ対応するGPSロガー21,22,23に入力される。なお、GPS受信機11,12,13が出力する出力データの形式は、NMEA(National Marine Electronics Association:米国海洋電子機器協会)によって統一されている(NMEA-0183フォーマット)。従って、各GPS受信機11,12,13の型式やメーカが異なる場合であっても、前記出力データを統一的に扱うことができる。
この出力データには、例えば以下のような情報が含まれている。即ち、測位の結果(緯度、経度、高度)を示す情報、当該測位を行ったときのUTC時刻を示す情報、測位状態(測位不能、単独測位、又はDGPS)を示す情報、測位モード(2D測位か3D測位)を示す情報、測位を行った際に追尾していたGPS衛星の数を示す情報、各GPS衛星の情報(信号対雑音比など)、対地速度を示す情報、進行方向を示す情報、などである。
各GPSロガー21,22,23においては、前記出力データを保存するためのログファイルが用意されている。各GPSロガーに新しく入力された出力データは、ログファイルの最後尾に追加して保存される。これにより、出力データが時間に沿ってログファイルに保存される。なお、前記ログファイルは、GPS受信機ごとに用意される。従って本実施形態の場合は、3つのGPS受信機11,12,13に対応して3つのログファイルが生成される。第1のGPS受信機11の出力データを保存したログファイルの名前を“file1.log”、第2のGPS受信機12の出力データを保存したログファイルの名前を“file2.log”、第3のGPS受信機13の出力データを保存したログファイルの名前を“file3.log”とする。なお以下の説明では、ログファイルに保存された個々の出力データのことを、ログデータと呼ぶ。
一方、本発明の一実施形態に係るGPSログ解析装置1は、一般的なPC(パーソナルコンピュータ)30として構成されたハードウェアと、当該PC30のハードディスク等に保存されたGPSログ解析プログラム(GNSSログ解析プログラム)等のソフトウェアと、からなっている。そして、前記ハードウェアと前記ソフトウェアとが協働することにより、前記PC30を、GPSログ解析装置1として機能させることができる。このPC30は、例えばUSB(Universal Serial Bus)コネクタとして構成された外部接続部31を備えている。前記GPSロガー21,22,23は、この外部接続部31に接続することができるように構成されている。
前記GPS受信機11,12,13による測位が終了すると、ログ解析を実施しようとするユーザは、ログファイルが記録されたGPSロガー21,22,23を持ち帰り、当該GPSロガー21,22,23をPC30の外部接続部31に接続して、当該GPSロガー21,22,23内のログファイルをPC30に転送する。このように、ログデータが保存されたログファイルを、外部接続部31を介してPC30内に取り込むことができるので、外部接続部31はデータ取込部であると言うことができる。なお、GPSロガー21,22,23から取得されたログファイルは、例えばPC30が備える図略のハードディスク等に記録される。
PCは、図1に示すように、液晶ディスプレイ等の表示部32と、マウス及びキーボード等からなる入力部33と、を備えている。ユーザは、入力部33を適宜操作することにより、前記GPSログ解析プログラムを起動することができる。GPSログ解析プログラムが起動されると、表示部32には、図2のようなログ解析画面40が表示される。
図2に示すように、ログ解析画面40には、ログファイル選択部41が表示される。ログファイル選択部41は、ファイル名指定欄42と、解析開始ボタン43と、を含んでいる。ユーザは、ファイル名指定欄42にログファイルのファイルパスを入力することにより、ログ解析を行うログファイルを指定することができる。ファイル名指定欄42にファイルパスを入力したうえで、ユーザが解析開始ボタン43を操作すると、GPSログ解析プログラムのデータ読込ステップが実行されて、指定されたログファイルが読み込まれる。これにより、ログファイルに含まれるログデータを、GPSログ解析プログラムで利用することが可能になる。
図2に示すように、ログファイル選択部41には、ファイル名指定欄42が複数表示されており、それぞれのファイル名指定欄42,42,42で異なるファイル名を指定することができる。即ち、本実施形態のGPSログ解析プログラムでは、複数のログファイルを同時に読み込んで解析することができる。例えば図2の例では、図1で説明した“file1.log”、“file2.log”、“file3.log”、の3つのログファイルが指定されている。この状態で、ユーザが解析開始ボタン43を操作することにより、3つのログファイルが読み込まれる。これにより、第1のGPS受信機11、第2のGPS受信機12、第3のGPS受信機13、の3つの異なるGPS受信機のログデータを、GPSログ解析プログラムで利用することが可能になる。
また、解析開始ボタン43が操作されてログファイルが読み込まれると、GPS解析プログラムのログファイル解析ステップが実行される。このログファイル解析ステップでは、ログファイルに含まれているログデータの解析が行われて、当該ログファイルの統計的な情報(例えば各種ステータス情報の平均値等)が取得される。なお、図2のように複数のログファイルが選択されている場合、前記ログデータの解析はそれぞれのログファイルごとに行い、それぞれのログファイルについての統計的な情報が取得される。
上記ログファイルの統計的な情報が取得されると、GPSログ解析プログラムの表示ステップが実行される。この表示ステップが実行されると、GPSログ解析装置1は、ログデータに基づいて取得された各種の情報を、表示部32に表示されている前記ログ解析画面40の中に表示する(図3の状態)。ここで、ログデータに基づいて取得された情報とは、個々のログデータから得られた情報に加え、ログファイルの統計的な情報(ログファイル解析ステップで取得された情報)も含む。
本実施形態のGPSログ解析プログラムでは、異なる複数のログファイルのログデータに基づいて取得された情報を、1つの画面(ログ解析画面40)の中に表示する。このように、複数のログファイルの内容を1つの画面にまとめて表示することにより、複数のGPS受信機11,12,13のログを互いに比較しながら検討することが容易になる。
以下、ログ解析画面40に表示される情報について詳しく説明する。図3に示すように、ログ解析画面40は、前記ログファイル選択部41に加えて、解析結果表示部44と、航跡表示部45と、時系列グラフ表示部46と、表示設定部47と、を1つの画面内に並べて表示した構成となっている。解析結果表示部44と、航跡表示部45と、時系列グラフ表示部46には、それぞれ、複数のGPS受信機11,12,13それぞれのログデータから取得された情報が表示されている。
解析結果表示部44には、各ログファイルの統計的な情報(前記ログファイル解析ステップで取得された情報)が表示される。例えば本実施形態では、前記ログファイルの統計的な情報として、2D測位率、3D測位率、測位率、速度検出率、平均追尾衛星数、平均測位衛星数等が表示されている。
3D測位率とは、GPS受信機11,12,13が行った測位のうち、3次元測位(緯度、経度、高度の測位)を行った割合を示す。また、2D測位率とは、信号を受信できたGPS衛星の数が少なかった等の理由により、3次元測位が行えず、緯度と経度のみの測位となってしまった割合を示す。なお、測位率は、3D測位率と2D測位率の合計である。また、速度検出率とは、速度を取得することができた測位の割合を示す。また、平均追尾衛星数とは、測位をした際に追尾していた衛星の数の平均値を示し、平均測位衛星数とは、測位に用いた衛星の数の平均数を示す。
これら統計的な情報は、各ログファイルに対応付けて表示される。例えば図3に示すように、解析結果表示部において、「ファイル名」の欄には、ログファイル解析ステップで解析が行われた各ログファイルの名称(“file1.log”、“file2.log”、“file3.log”)が表示されており、当該表示されたファイル名の下に、当該ログファイルの統計的な情報が表示されている。また、ログファイルそれぞれの統計的な情報は、項目ごとに並べて表示されている。これにより、各ログファイルの統計的な情報を、互いに比較することが容易になる。
次に、航跡表示部45と時系列グラフ表示部46の表示内容について説明する。航跡表示部45と時系列グラフ表示部46では、個々のログデータから得られた情報を画面上にプロットして表示している。これにより、測位を行った瞬間瞬間においてそれぞれのGPS受信機11,12,13がどのようなデータを出力したかを、視覚的に確認することができる。
まず、航跡表示部45について具体的に説明する。航跡表示部45の描画領域には、縦軸が緯度、横軸が経度となるように地球上の位置を示す二次元座標系が設定されている。GPSログ解析プログラムは、前記表示ステップにおいて、各ログデータから取得された測位結果を、前記二次元座標系にプロットして表示する。即ち、航跡表示部45に表示されたプロット点は、地球表面上における測位位置を示している。ここで、GPS受信機11,12,13を前述のように自動車に搭載して移動しながら測位を行った場合、GPS受信機11,12,13が出力する測位結果も刻々と移動する。従って、各々の測位結果を航跡表示部45にプロットすることにより、図3に示すように、GPS受信機11,12,13が移動した跡(航跡)を視覚的に表示することができる。
なお、本実施形態のGPSログ解析プログラムでは、複数のログファイルから得られた測位結果を、共通の二次元座標系にプロットしている。言い換えれば、複数のログファイルから得られた航跡を、同じ描画領域内で重畳させて表示している。ここで、異なる複数のGPS受信機11,12,13は同じ自動車に搭載されて測位していたのであるから、理想的には、それぞれのGPS受信機11,12,13の測位位置は一致し、航跡表示部45に表示される航跡は重なり合うはずである。しかしながら、GPS受信機11,12,13の性能の違いなどの要因によって、測位位置にズレが発生することがある。この結果、航跡表示部45に表示される各航跡が互いにズレる場合がある。そこで、航跡が互いにどの程度ズレているかを確認することにより、それぞれのGPS受信機11,12,13の測位性能を評価することができる。このように、各ログファイルから得られた航跡を1つの画面内に重畳させて表示しているので、各GPS受信機11,12,13の測位結果が互いにどの程度ズレているかを視覚的に把握することが可能となり、各GPS受信機11,12,13の測位性能を評価することが容易になる。
この場合においては、図3に示すように、航跡表示部45に地図を表示させ、当該地図の上に上記航跡を重畳させて表示すれば更に好適である。即ち、上記のようにGPS受信機11,12,13を自動車に搭載して測位を行った場合、各航跡は道路上を通過するはずである。従って、道路上から外れた位置を航跡が通過している場合は、当該航跡に対応したGPS受信機の測位結果が悪いと判断することができる。また、航跡表示部45に表示されている地図を確認して、測位結果が悪い位置の近傍に大きな建造物が存在することがわかった場合、当該建造物によるマルチパスによって測位結果が悪影響を受けている、等と判断することができる。なお、地図を表示するか否かは、表示設定部47に表示された地図表示チェックボックス50にチェックを入れるか否かによって、ユーザが切り替えることができる。なお、このように地図に測定結果を重畳表示する場合であっても、地球上の位置を示す二次元座標系に測定結果を重畳表示しているということができる。
なお、本実施形態のGPSログ解析プログラムでは、測位結果を二次元座標系にプロットする際にプロット点に表示するシンボルを、ログファイルごとに異ならせている。どのシンボルがどのログファイルに対応しているかは、前記解析結果表示部44に表示されている。例えば、図3の例では、“file1.log”から得られた測位結果は四角形のシンボル、“file2.log”から得られた測位結果は三角形のシンボル、“file3.log”から得られた測位結果は円形のシンボルで、それぞれ表示されている。このように各ログファイルのシンボルを異ならせてプロットすることにより、複数のログファイルから得られた航跡を重畳させて1つの画面内に表示させる場合であっても、どの航跡がどのログファイルに対応しているか(即ち、どの航跡がどのGPS受信機の測位結果を示しているか)を容易に判別することができる。
次に、時系列グラフ表示部46について具体的に説明する。時系列グラフ表示部46には、ログデータの時系列グラフが表示される。この時系列グラフの縦軸は、各ログデータから得られた情報の値、横軸は、当該ログデータが取得されたときの時間となっている。GPSログ解析プログラムは、前記表示ステップにおいて、各ログデータから情報を得られた情報を、時系列グラフにプロットして表示する。
なお、前述のように、各GPS受信機が出力するデータには、測位結果を示す情報、測位状態を示す情報、GPS衛星の数を示す情報、GPS衛星の情報、対地速度を示す情報、進行方向を示す情報など、多数の情報が含まれている。これら多数の情報を1つの時系列グラフに表示することはできないので、本実施形態のGPSログ解析プログラムは、時系列グラフに表示する情報の種類を、ユーザが選択できるようにしている。
具体的には、表示設定部47に表示されたグラフ表示切替ラジオボタン51の中から何れか一つの項目をユーザが選択することにより、当該選択された項目の時系列グラフを、時系列グラフ表示部46に表示することができる。本実施形態では、図3に示すように、時系列グラフ表示部46に表示させる情報として、測位状態、追尾衛星数、測位衛星数(測位に用いた衛星の数)、速さ(対地速度)、高さ、各衛星の情報、位置誤差情報、真方位(進行方向)を選択することができる。なお、位置誤差情報とは、あるGPS受信機の測位結果が他のGPS受信機の測位結果からどの程度ズレているかを示す情報である。
例えば図3の例では、時系列グラフ表示部46に表示させる情報として、速さ(対地速度)が選択されている。この場合、時系列グラフの縦軸は、速さ[km/h]となり、横軸は、当該速さが観測されたときの時刻となる。従ってこの場合は、時系列グラフ表示部46に表示された時系列グラフを見ることにより、各時刻における移動速度や、加速や減速が行われ時刻を確認することができる。
また本実施形態のGPSログ解析プログラムでは、複数のログファイルから得られた情報を、同じ時系列グラフ内で重畳させて表示している。このように、各ログファイルから得られた情報を1つの画面内に重畳させて表示しているので、各GPS受信機11,12,13の出力の違いを視覚的に把握することが可能となる。例えば図3の例では、各GPS受信機11,12,13が出力した対地速度を示す情報を重畳させて表示しているので、各GPS受信機11,12,13の出力の速度変化に対する追従性等を比較検討することができる。
なお、本実施形態のGPSログ解析プログラムでは、時系列グラフ表示部46に情報をプロットする際にプロット点に表示するシンボルを、ログファイルごとに異ならせている。時系列グラフ表示部46のシンボルとログファイルとの対応は、航跡表示部45にプロットされたシンボルと同じである。即ち、図3の例では、“file1.log”から得られた情報は四角形のシンボル、“file2.log”から得られた情報は三角形のシンボル、“file3.log”から得られた情報は円形のシンボルで、それぞれ表示されている。このように各ログファイルのシンボルを異ならせてプロットすることにより、複数のログファイルから得られた情報を重畳させて1つの時系列グラフ内に表示させる場合であっても、どの情報がどのログファイルに対応しているか(即ち、どの情報がどのGPS受信機から得られたものか)を容易に判別することができる。
更に、本実施形態では上記のように、それぞれのログファイルに対して、航跡表示部45と時系列グラフ表示部46で共通のシンボルを用いた表示をしているので、航跡と時系列グラフの内容を比較検討することが容易になる。
なお、上記時系列グラフ表示部46の各プロット点は、各ログファイルの先頭からログデータが読み込まれた順番(データ順)に対応して横軸にプロットされる。即ち、前述のように、新しいログデータはログファイルの最後尾に追加されていくので、ログファイルの先頭からログデータを読み込んだ順番で、当該ログデータから得られた情報をプロットしていくことにより、時系列に沿ったグラフ(時系列グラフ)を生成することができる。ただし、この場合、ログファイルに収録されたログデータにデータ漏れがあった場合や、各ログファイルのロギング開始時刻やログ間隔が異なっていた場合に、各ログファイルのプロット点が時間軸(横軸)方向でズレてしまうので、各GPS受信機11,12,13のログを比較することが困難となってしまう。
そこで、本実施形態のGPSログ解析プログラムでは、上記のように情報をデータ順で時系列グラフ表示部46にプロットする構成に代えて、時系列グラフの横軸に各ログデータのUTC時刻を対応させて、当該ログデータから得られた情報をプロットすることができるようになっている。これにより、同一のUTC時刻で得られた情報は、横軸を一致させて時系列グラフ表示部46に表示することができる。即ち、ログデータから得られた情報を、UTC時刻で同期させて表示させることができる。これにより、ログデータにデータ漏れがある場合や、各ログファイルのロギング開始時刻やログ間隔が異なっていた場合であっても、各GPS受信機11,12,13のログの比較を容易に行うことができる。即ち、ロギング開始時刻の違いやデータ取得漏れ等を考慮することなく、各GPS受信機11,12,13の性能比較を行うことができる。なお、各情報をデータ順で表示するかUTC時刻で同期させて表示するかは、表示設定部47に表示された表示順選択ラジオボタン52をユーザが選択することにより、設定することができる。
続いて、GPSログ解析プログラムの時間範囲設定機能について説明する。即ち、本実施形態のGPSログ解析プログラムでは、航跡表示部45及び時系列グラフ表示部46に表示される情報の時間範囲を、ユーザが設定できるようになっている。
時間範囲の設定は、表示設定部47に表示された時間範囲設定スライダ53のツマミ53aをユーザが左右にスライドさせるように操作することで行う。時間範囲設定スライダ53は、図3の左端がロギング開始時刻を、右端がロギング終了時刻を、それぞれ表している。そして、ツマミ53aを左右にスライドさせるように操作することにより、ロギング開始時刻からロギング終了時刻までの間の任意の時刻を指定することができるようになっている。
時間範囲設定スライダ53をユーザが操作すると、GPSログ解析プログラムの時間範囲設定ステップが実行される。時間範囲設定ステップでは、ツマミ53aの位置に基づいて時間範囲が設定される。具体的には、ロギング開始時刻からツマミ53aで設定された時刻までの範囲が、時間範囲として設定される。従って、ロギング開始時刻が時間範囲の開始時刻であり、時間範囲設定スライダ53は時間範囲の終了時刻を設定するものであると言える。
時間範囲が設定されると、GPSログ解析プログラムの前記表示ステップが実行される。このとき、表示ステップにおいては、前記指定された時刻範囲内のログデータから得られた情報のみを、航跡表示部45及び時系列グラフ表示部46にプロットして表示する。例えば図4に示すように、時間範囲設定スライダ53のツマミ53aの位置を、左端の位置から3分の1程度の位置に設定すると、ロギング開始時刻から3分の1の範囲内のログデータに基づいた情報のみが、航跡表示部45及び時系列グラフ表示部46に表示される。
このように、ユーザが所望の時間(時刻)でログデータの表示を途切れさせることができるので、所望の時間における測位結果と時系列グラフの関係を比較することができる。即ち、ある測位結果が得られたときの時系列グラフがどのような値をとっていたかを確認することができる。例えば、測位結果が悪かった場合に、当該悪い結果が得られた時刻に対応する位置までツマミ53aをスライドさせることにより、当該悪い結果の測位が行われた環境(航跡表示部45に表示された地図を確認することにより、その測位が行われた環境がわかる)と、そのときの時系列グラフの値(測位状態や追尾衛星数など、グラフ表示切替ラジオボタン51で指定された項目の値)と、の関係を容易に確認することができる。これにより、各GPS受信機11,12,13の性能の評価を、より適切に行うことができる。
また、本実施形態のGPSログ解析プログラムでは、上記時間範囲の終了時刻を、自動的に徐々に変化させることができるようになっている。具体的には、表示設定部47には再生ボタン54が表示されている。そして、ユーザがこの再生ボタン54を操作することにより、終了時間が徐々に遅くなるように(ツマミ53aが自動的に右側へ向かって移動するように)なっている。これにより時間範囲が徐々に広くなる結果、図5に示すように、ログデータの時系列に従ってプロット点が徐々にプロットされていく様子を、航跡表示部45及び時系列グラフ表示部46に表示することができる。これにより、航跡や時系列グラフの移り変わりを、容易に確認することができる。なお、終了時間を変化させるスピードは、表示速度設定部55で数値指定することができる。また、終了時間を自動的に変化させる上記の処理は、ユーザが停止ボタン56を操作することにより中断させることもできる。
なお、図3及び図4の例では、時間範囲設定スライダ53で設定できるのは時間範囲の終了時刻のみであるが、これに代え、あるいはこれに加えて、時間範囲の開始時刻を設定できるようにしても良い。即ち、ログデータの先頭から所望の時間分のデータを切り飛ばすことができるようにすることもできる。
時間範囲を設定するためのユーザインタフェースの変形例を図6に示す。スライダによる時間範囲の指定は、直感的ではあるものの、時間範囲を細かく設定することが難しいという問題がある。例えば上記実施形態の場合、ログデータが長期間にわたって記録されていると、ツマミ53aをわずかに動かしただけで時間範囲が大きく変更されてしまう。そこでこの変形例では、時間範囲を2段階で設定するように構成されている。具体的には、この変形例では、時間範囲設定スライダ153に加えて、時間範囲設定可能範囲設定スライダ57を表示設定部47に表示している。
時間範囲設定可能範囲設定スライダ57は、図6の左端がロギング開始時刻を、右端がロギング終了時刻を、それぞれ表している。そして、時間範囲設定可能範囲設定スライダ57は、左右にスライド可能な2つのツマミ57a,57bを備えている。第1ツマミ57aは時間範囲設定可能範囲の開始時刻を、第2ツマミ57bは時間範囲設定可能範囲の終了時刻を、それぞれ設定することができる。
一方、変形例の時間範囲設定スライダ153は、上記実施例の時間範囲設定スライダ53と同じく、左右にスライド可能なツマミ153aを備えている。ただしこの変形例の時間範囲設定スライダ153は、図6の左端が時間範囲設定可能範囲の開始時刻を、右端が時間範囲設定可能範囲の終了時刻を、それぞれ表している。即ち、変形例の時間範囲設定スライダ153は、時間範囲設定可能範囲設定スライダ57の第1ツマミ57aと第2ツマミ57bの間の範囲を拡大して示したスライダである。従って、この時間範囲設定スライダ153によって、時間範囲を細かく指定することができる。このように、時間範囲を設定できる範囲(時間範囲設定可能範囲)を指定し、当該時間範囲設定可能範囲を拡大して示したユーザインタフェースで時間範囲を設定するように構成することで、当該時間範囲を直感的に、且つより細かく設定することができる。
以上で説明したように、本実施形態のGPSログ解析プログラムは、GPS受信機の出力を記録したログデータを読み込むデータ読込ステップと、前記ログデータに基づいて取得された情報を表示する表示ステップと、を含む処理をPC30に実行させる。また、このGNSSログ解析プログラムは、データ読込ステップにおいて、複数のGNSS受信機それぞれのログデータを読み込み可能である。そして、表示ステップにおいては、複数のGNSS受信機それぞれのログデータに基づいて取得された情報を、1つの画面(ログ解析画面40)に表示している。
また本実施形態のGPSログ解析装置1は、GPS受信機の出力を記録したログデータを取り込む外部接続部31と、前記ログデータに基づいて取得された情報を表示する表示部32と、を備えている。このGPSログ解析装置1は、外部接続部31によって、複数のGPS受信機それぞれのログデータを取り込み可能である。そして、表示部32において、複数のGPS受信機それぞれのログデータに基づいて取得された情報を、1つの画面(ログ解析画面40)に表示している。
このように、複数のGPS受信機それぞれのログデータから得られた情報を1つの画面に表示することができるので、当該ログデータを相互に比較しながら検討することが容易になる。
また本実施形態のGPSログ解析プログラムは、前記表示ステップにおいて、複数のGPS受信機それぞれのログデータに基づいて取得された測位結果に関する情報を、地球上の位置を示す座標系に重畳させて表示している。
これにより、複数のGPS受信機の測位結果を、重畳させた状態で視覚化することができるので、例えば測位結果のズレを容易に確認することができる。
また本実施形態のGPSログ解析プログラムは、前記表示ステップにおいて、複数のGPS受信機それぞれのログデータに基づいて取得された情報の時系列グラフを表示している。
これにより、複数のGPS受信機の出力の経時変化を、重畳させた状態で視覚化することができるので、例えば特定の時間における各GPS受信機の出力の違いを容易に確認することができる。
また本実施形態のGPSログ解析プログラムは、時間範囲を設定する時間範囲設定ステップを含む。そして、前記表示ステップにおいて、複数のGPS受信機それぞれのログデータに基づいて取得された情報のうち、前記設定された時間範囲に含まれるログデータに基づいて取得された情報のみを表示している。
これにより、所望の時間範囲のログデータのみを表示することができるので、特定の時間におけるログデータを容易に確認することができる。
また本実施形態のGPSログ解析プログラムは、前記時間範囲を徐々に変化させることが可能である。
これにより、ログデータが時間の経過によって刻一刻と変化する様子を視覚化することができる。
なお変形例に係るGNSSログ解析プログラムは、時間範囲を設定可能な範囲を設定する時間範囲設定可能範囲設定スライダ57と、時間範囲設定可能範囲設定スライダ57で設定された範囲の中で時間範囲を設定する時間範囲設定スライダ153と、を表示している。
このように、時間範囲の設定を2段階で行うことにより、時間範囲をより細かく設定することができる。
また本実施形態のGPSログ解析プログラムは、前記表示ステップにおいて、複数のGPS受信機それぞれのログデータに基づいて取得された情報を、各ログデータのUTC時刻で同期させて表示することが可能である。
これにより、ログデータに漏れがある場合や、ログデータの記録開始時刻や記録間隔が異なる場合であっても、同時刻におけるログデータの比較を容易に行うことができる。
また本実施形態では、各GPS受信機のログデータは、GPS受信機ごとに用意されたログファイルに記録されている。本実施形態のGPSログ解析プログラムは、前記ログファイルに含まれるログデータを解析して、当該ログファイルの統計的な情報を取得するログファイル解析ステップを含む。そして、前記表示ステップにおいては、各ログファイルの前記統計的な情報を、1つの画面に並べて表示している。
以上に本発明の好適な実施の形態を説明したが、上記の構成は例えば以下のように変更することができる。
GNSSとしてはGPSを用いるものとしたが、他のGNSSを用いても良いことは勿論である。
上記実施形態では、GPSログ解析装置の機能は、ソフトウェアとハードウェアによって実現されるとして説明したが、当該GPSログ解析装置の機能の一部又は全部を、専用のハードウェアによって実現しても良い。
上記実施形態で説明したログ解析画面40の表示内容は一例であって、これに限定されない。特に、画面レイアウトやグラフィカルユーザインタフェースの構成等は適宜変更することができる。例えば、時間範囲はスライダによって設定する構成に限らず、例えば数値入力によって時間範囲を指定する構成であっても良い。
ログファイル選択部41、解析結果表示部44、航跡表示部45、時系列グラフ表示部46、表示設定部47は、全てを1つの画面内に表示する必要は無く、例えばタブ切替式の表示によって別々に表示するようにしても良い。表示設定部47は、表示する項目を変更等する必要が無ければ、省略することもできる。また、解析結果表示部44、航跡表示部45、時系列グラフ表示部46は、何れか1つのみでも良い。要は、複数のログファイルの内容を1つの画面内で相互に比較することができれば良いのであって、上記実施形態に限定されない。ただし、航跡表示部45と時系列グラフ表示部46を一つの画面内に並べて表示すれば、プロット点を相互に比較することができるので特に好適である。
また、図3等では、航跡表示部45及び時系列グラフ表示部46におけるプロット点のシンボルはログファイルごとに形状を異ならせているが、例えば各シンボルの色を異ならせるようにしても良い。
上記実施形態では、航跡表示部45において、測位結果を2次元座標系にプロットするものとして説明したが、測位結果を例えば3次元的に表示する構成であっても良い。
上記実施形態では、GPSロガーによってGPS受信機の出力をロギングした後、ログファイルをPCに取り込む構成としたが、この構成に代えて、例えば、GPS受信機をPCに直接接続し、当該PCによってロギングを行っても良い。即ち、GPSログ解析装置がロガーとしての役割を兼ねていても良い。
上記実施形態では、ログデータの記録を行うGPS受信機の数は3つとしたが、2つでも良いし、4つ以上であっても良い。同様に、GPSログ解析プログラムで一度に読み込むログファイルの数は、上記のように3つでも良いし、2つや4つ以上でも良い。即ち、本実施形態のGPSログ解析プログラムによって解析するログファイルの数は特に限定されない。本実施形態のGPSログ解析プログラムによって複数のログファイルを解析することにより、当該複数のログファイルの比較検討を行うことができる。なお、上記のようにGPS受信機の性能を比較検討する必要が無い場合は、1つのログファイルのみを本実施形態のGPSログ解析プログラムによって解析してもよい。
なお、上記実施例では、複数のGPS受信機で同時に測位を行ったログファイル同士を比較する構成としたが、例えば、別の日に測位を行ったログファイル同士を比較しても良い。この場合、UTC時刻順で時系列グラフを表示すると、各ログファイルのプロット点が重畳表示されないので、各ログファイルの情報を比較検討する際に不便である。このように、ログを取った時刻がログファイル間で異なる場合は、むしろデータ順で表示するように指定すると好適である。
また、GPS受信機は自動車等に搭載して移動させる必要は無く、固定点で測位を行っても良い。この場合であっても、妨害電波等の影響により、各GPS受信機の測位結果が微妙に変動する場合がある。従って、固定点で測位を行った各GPS受信機のログファイルを、本実施形態のGPSログ解析プログラムで解析することにより、各GPS受信機の性能を比較することができる。
1 GPSログ解析装置(GNSSログ解析装置)
11,12,13 GPS受信機(GNSS受信機)
31 外部接続部(データ取込部)
32 表示部
40 ログ解析画面
41 ログファイル選択部
44 解析結果表示部
45 航跡表示部
46 時系列グラフ表示部
47 表示設定部
53 時間範囲設定スライダ
11,12,13 GPS受信機(GNSS受信機)
31 外部接続部(データ取込部)
32 表示部
40 ログ解析画面
41 ログファイル選択部
44 解析結果表示部
45 航跡表示部
46 時系列グラフ表示部
47 表示設定部
53 時間範囲設定スライダ
Claims (9)
- GNSS受信機の出力を記録したログデータを読み込むデータ読込ステップと、
前記ログデータに基づいて取得された情報を表示する表示ステップと、
を含む処理をコンピュータに実行させるGNSSログ解析プログラムであって、
前記データ読込ステップにおいて、複数のGNSS受信機それぞれのログデータを読み込み可能であり、
前記表示ステップにおいて、前記複数のGNSS受信機それぞれのログデータに基づいて取得された情報を、1つの画面に表示することを特徴とするGNSSログ解析プログラム。 - 請求項1に記載のGNSSログ解析プログラムであって、
前記表示ステップにおいて、前記複数のGNSS受信機それぞれのログデータに基づいて取得された測位結果に関する情報を、地球上の位置を示す座標系に重畳させて表示することを特徴とするGNSSログ解析プログラム。 - 請求項1又は2に記載のGNSSログ解析プログラムであって、
前記表示ステップにおいて、前記複数のGNSS受信機それぞれのログデータに基づいて取得された情報の時系列グラフを表示することを特徴とするGNSSログ解析プログラム。 - 請求項1から3までの何れか一項に記載のGNSSログ解析プログラムであって、
時間範囲を設定する時間範囲設定ステップを含み、
前記表示ステップにおいて、前記複数のGNSS受信機それぞれのログデータに基づいて取得された情報のうち、前記設定された時間範囲に含まれるログデータに基づいて取得された情報のみを表示することを特徴とするGNSSログ解析プログラム。 - 請求項4に記載のGNSSログ解析プログラムであって、
前記時間範囲を徐々に変化させることが可能であることを特徴とするGNSSログ解析プログラム。 - 請求項4又は5に記載のGNSSログ解析プログラムであって、
前記時間範囲を設定可能な範囲を設定する時間範囲設定可能範囲設定部と、
前記時間範囲設定可能範囲設定部で設定された範囲の中で前記時間範囲を設定する時間範囲設定部と、
を表示することを特徴とするGNSSログ解析プログラム。 - 請求項1から6までの何れか一項に記載のGNSSログ解析プログラムであって、
前記表示ステップにおいて、前記複数のGNSS受信機それぞれのログデータに基づいて取得された情報を、前記ログデータのUTC時刻で同期させて表示することを特徴とするGNSSログ解析プログラム。 - 請求項1から7までの何れか一項に記載のGNSSログ解析プログラムであって、
各GNSS受信機のログデータは、GNSS受信機ごとに用意されたログファイルに記録されており、
このGNSSログ解析プログラムは、前記ログファイルに含まれるログデータを解析して、当該ログファイルの統計的な情報を取得するログファイル解析ステップを含み、
前記表示ステップにおいて、各ログファイルの前記統計的な情報を、1つの画面に並べて表示することを特徴とするGNSSログ解析プログラム。 - GNSS受信機の出力を記録したログデータを取り込むデータ取込部と、
前記ログデータに基づいて取得された情報を表示する表示部と、
を備えたGNSSログ解析装置であって、
前記データ取込部によって、複数のGNSS受信機それぞれのログデータを取り込み可能であり、
前記表示部において、前記複数のGNSS受信機それぞれのログデータに基づいて取得された情報を、1つの画面に表示することを特徴とするGNSSログ解析装置。
Applications Claiming Priority (2)
| Application Number | Priority Date | Filing Date | Title |
|---|---|---|---|
| JP2010-165110 | 2010-07-22 | ||
| JP2010165110 | 2010-07-22 |
Publications (1)
| Publication Number | Publication Date |
|---|---|
| WO2012011427A1 true WO2012011427A1 (ja) | 2012-01-26 |
Family
ID=45496852
Family Applications (1)
| Application Number | Title | Priority Date | Filing Date |
|---|---|---|---|
| PCT/JP2011/066067 Ceased WO2012011427A1 (ja) | 2010-07-22 | 2011-07-14 | Gnssログ解析プログラム、gnssログ解析装置 |
Country Status (1)
| Country | Link |
|---|---|
| WO (1) | WO2012011427A1 (ja) |
Citations (1)
| Publication number | Priority date | Publication date | Assignee | Title |
|---|---|---|---|---|
| JP2001188805A (ja) * | 1999-12-28 | 2001-07-10 | Sony Corp | 情報処理装置および情報処理方法、情報処理システム並びにプログラム格納媒体 |
-
2011
- 2011-07-14 WO PCT/JP2011/066067 patent/WO2012011427A1/ja not_active Ceased
Patent Citations (1)
| Publication number | Priority date | Publication date | Assignee | Title |
|---|---|---|---|---|
| JP2001188805A (ja) * | 1999-12-28 | 2001-07-10 | Sony Corp | 情報処理装置および情報処理方法、情報処理システム並びにプログラム格納媒体 |
Non-Patent Citations (1)
| Title |
|---|
| TOMOHIKO SUGIMOTO, KASHMIR 3D GPS OYOHEN, 10 December 2002 (2002-12-10), pages 62 - 70, 80 - 89, 130 - 138 * |
Similar Documents
| Publication | Publication Date | Title |
|---|---|---|
| US6999021B2 (en) | Method and apparatus for detecting, mapping and locating underground utilities | |
| US8423284B2 (en) | Monitoring, recording and testing of navigation systems | |
| US9615562B2 (en) | Analyzing marine trip data | |
| US10609149B2 (en) | Methods and apparatus for capturing data using a marine electronics device | |
| US20150358752A1 (en) | A system for localizing sound source and the method therefor | |
| CN103376105B (zh) | 电子地图显示装置以及关于电子地图的信息的显示方法 | |
| CN106197410A (zh) | 用于准确捕获惯性传感器数据的方法和装置 | |
| KR102102398B1 (ko) | 실시간 내비게이션 성능 평가 장치 및 방법 | |
| CN114705186B (zh) | 一种组合导航验证方法、装置、终端设备和可读介质 | |
| CN110160557A (zh) | 一种掘进机惯性导航系统二维位置精度标定方法和系统 | |
| US20140013260A1 (en) | Export User Data From Defined Region | |
| KR101423968B1 (ko) | 운전면허 도로주행 시험을 위한 데이터 처리 방법 및 이를 위한 도로주행 시험 데이터 처리 프로그램을 기록한 컴퓨터로 판독가능한 기록매체 | |
| JP6027121B2 (ja) | 測定位置指示装置、測定位置指示方法 | |
| US9594169B2 (en) | Altitude detecting unit, loading/driving apparatus, and altitude detecting method | |
| CN114114365A (zh) | 一种获取惯性测量单元的性能信息的方法 | |
| WO2012011427A1 (ja) | Gnssログ解析プログラム、gnssログ解析装置 | |
| CN107037454B (zh) | 一种导航路测自动化分析方法、移动终端及处理设备 | |
| US9360558B2 (en) | GNSS receiver design testing | |
| JP2006300602A (ja) | 測位データの取得方法、取得装置及び取得システム | |
| US12483911B2 (en) | Background event based capturing in network | |
| JP6711785B2 (ja) | 情報処理システム、情報処理装置及びプログラム | |
| CN104635246A (zh) | 卫星导航信号的动态范围检测系统及检测方法 | |
| JP2012026847A (ja) | Gnss受信モニタプログラム、gnss受信モニタ装置 | |
| Von Hünerbein et al. | Multi-Sensor vehicle testing: Recording Inertial Sensors via CAN bus in Combination with Recorded GNSS RF signals | |
| US20170109908A1 (en) | Using Chlorophyll Data for a Marine Environment |
Legal Events
| Date | Code | Title | Description |
|---|---|---|---|
| 121 | Ep: the epo has been informed by wipo that ep was designated in this application |
Ref document number: 11809598 Country of ref document: EP Kind code of ref document: A1 |
|
| NENP | Non-entry into the national phase |
Ref country code: DE |
|
| 122 | Ep: pct application non-entry in european phase |
Ref document number: 11809598 Country of ref document: EP Kind code of ref document: A1 |
|
| NENP | Non-entry into the national phase |
Ref country code: JP |