WO2011092739A1 - Management system for calculating storage capacity to be increased/decreased - Google Patents
Management system for calculating storage capacity to be increased/decreased Download PDFInfo
- Publication number
- WO2011092739A1 WO2011092739A1 PCT/JP2010/000516 JP2010000516W WO2011092739A1 WO 2011092739 A1 WO2011092739 A1 WO 2011092739A1 JP 2010000516 W JP2010000516 W JP 2010000516W WO 2011092739 A1 WO2011092739 A1 WO 2011092739A1
- Authority
- WO
- WIPO (PCT)
- Prior art keywords
- pool
- capacity
- management system
- program
- performance
- Prior art date
Links
Images


Classifications
-
- G—PHYSICS
- G06—COMPUTING; CALCULATING OR COUNTING
- G06F—ELECTRIC DIGITAL DATA PROCESSING
- G06F3/00—Input arrangements for transferring data to be processed into a form capable of being handled by the computer; Output arrangements for transferring data from processing unit to output unit, e.g. interface arrangements
- G06F3/06—Digital input from, or digital output to, record carriers, e.g. RAID, emulated record carriers or networked record carriers
- G06F3/0601—Interfaces specially adapted for storage systems
- G06F3/0628—Interfaces specially adapted for storage systems making use of a particular technique
- G06F3/0662—Virtualisation aspects
- G06F3/0665—Virtualisation aspects at area level, e.g. provisioning of virtual or logical volumes
-
- G—PHYSICS
- G06—COMPUTING; CALCULATING OR COUNTING
- G06F—ELECTRIC DIGITAL DATA PROCESSING
- G06F3/00—Input arrangements for transferring data to be processed into a form capable of being handled by the computer; Output arrangements for transferring data from processing unit to output unit, e.g. interface arrangements
- G06F3/06—Digital input from, or digital output to, record carriers, e.g. RAID, emulated record carriers or networked record carriers
- G06F3/0601—Interfaces specially adapted for storage systems
- G06F3/0602—Interfaces specially adapted for storage systems specifically adapted to achieve a particular effect
- G06F3/0604—Improving or facilitating administration, e.g. storage management
- G06F3/0607—Improving or facilitating administration, e.g. storage management by facilitating the process of upgrading existing storage systems, e.g. for improving compatibility between host and storage device
-
- G—PHYSICS
- G06—COMPUTING; CALCULATING OR COUNTING
- G06F—ELECTRIC DIGITAL DATA PROCESSING
- G06F3/00—Input arrangements for transferring data to be processed into a form capable of being handled by the computer; Output arrangements for transferring data from processing unit to output unit, e.g. interface arrangements
- G06F3/06—Digital input from, or digital output to, record carriers, e.g. RAID, emulated record carriers or networked record carriers
- G06F3/0601—Interfaces specially adapted for storage systems
- G06F3/0602—Interfaces specially adapted for storage systems specifically adapted to achieve a particular effect
- G06F3/061—Improving I/O performance
- G06F3/0611—Improving I/O performance in relation to response time
-
- G—PHYSICS
- G06—COMPUTING; CALCULATING OR COUNTING
- G06F—ELECTRIC DIGITAL DATA PROCESSING
- G06F3/00—Input arrangements for transferring data to be processed into a form capable of being handled by the computer; Output arrangements for transferring data from processing unit to output unit, e.g. interface arrangements
- G06F3/06—Digital input from, or digital output to, record carriers, e.g. RAID, emulated record carriers or networked record carriers
- G06F3/0601—Interfaces specially adapted for storage systems
- G06F3/0628—Interfaces specially adapted for storage systems making use of a particular technique
- G06F3/0629—Configuration or reconfiguration of storage systems
- G06F3/0631—Configuration or reconfiguration of storage systems by allocating resources to storage systems
-
- G—PHYSICS
- G06—COMPUTING; CALCULATING OR COUNTING
- G06F—ELECTRIC DIGITAL DATA PROCESSING
- G06F3/00—Input arrangements for transferring data to be processed into a form capable of being handled by the computer; Output arrangements for transferring data from processing unit to output unit, e.g. interface arrangements
- G06F3/06—Digital input from, or digital output to, record carriers, e.g. RAID, emulated record carriers or networked record carriers
- G06F3/0601—Interfaces specially adapted for storage systems
- G06F3/0668—Interfaces specially adapted for storage systems adopting a particular infrastructure
- G06F3/0671—In-line storage system
- G06F3/0683—Plurality of storage devices
- G06F3/0685—Hybrid storage combining heterogeneous device types, e.g. hierarchical storage, hybrid arrays
-
- G—PHYSICS
- G06—COMPUTING; CALCULATING OR COUNTING
- G06F—ELECTRIC DIGITAL DATA PROCESSING
- G06F3/00—Input arrangements for transferring data to be processed into a form capable of being handled by the computer; Output arrangements for transferring data from processing unit to output unit, e.g. interface arrangements
- G06F3/06—Digital input from, or digital output to, record carriers, e.g. RAID, emulated record carriers or networked record carriers
- G06F3/0601—Interfaces specially adapted for storage systems
- G06F3/0668—Interfaces specially adapted for storage systems adopting a particular infrastructure
- G06F3/0671—In-line storage system
- G06F3/0683—Plurality of storage devices
- G06F3/0689—Disk arrays, e.g. RAID, JBOD
Definitions
- the present invention relates to storage device management.
- a storage apparatus having a plurality of physical storage devices is known.
- Physical storage devices include hard disk drives and flash memory devices.
- the storage apparatus generally has a RAID group according to the technique of RAID (Redundant Array of Independent (or Inexpensive) Disks).
- the RAID group is composed of a plurality of physical storage devices, and data is stored in the RAID group according to a predetermined RAID level.
- One or more logical storage devices are created based on the storage space of the RAID group.
- the logical volume is provided to a host computer connected to the storage apparatus.
- the host computer transmits an access command (for example, a write command or a read command) specifying the provided logical volume to the storage apparatus. As a result, data is accessed for the logical volume.
- VVOL virtual volume
- a pool is a storage area composed of a plurality of segments.
- a segment is a real area (substantial storage area).
- a logical volume (hereinafter referred to as PVOL) constituting a pool is represented by an LBA (Logical This is a storage area obtained by dividing by block address).
- LBA is an address used for designating a position on the logical volume when the host computer reads / writes data from / to the storage apparatus.
- a pool in which a plurality of segment groups having different performances are mixed is known (Patent Document 2).
- media one segment group is referred to as “media”.
- high-performance media is composed of high-performance PVOL
- low-performance media is composed of low-performance PVOL.
- the performance of the PVOL depends on the performance of the physical storage device on which the PVOL is based (and / or the RAID level of the RAID group).
- Data migration from one segment in one medium to a segment in another medium (hereinafter referred to as segment migration) can be performed.
- Patent Document 3 A method for determining the storage capacity to be added is disclosed in Patent Document 3, for example. According to Patent Document 3, a storage capacity that will be insufficient in the future is predicted based on an increase rate of segments allocated to a virtual volume, and a storage capacity to be added is determined based on a prediction result.
- JP 2003-015915 A Japanese Patent Laid-Open No. 2007-066259 JP 2008-0975502 A
- expansion a storage capacity (for example, PVOL) is added (hereinafter referred to as “expansion”) in a pool in which a plurality of media having different performances are mixed
- expansion amount the storage capacity to be added
- the amount of expansion of the entire pool can be determined, but it is not possible to appropriately determine how much storage capacity is added to which medium. For this reason, there is a possibility that an extension that improves the performance more than necessary or an extension that greatly reduces the performance may be performed.
- an object of the present invention is to make it possible to obtain an appropriate expansion / reduction amount for each real area group for a pool composed of a plurality of real area groups having different performances.
- the storage device connected to the host device is a virtual volume that is a virtual logical volume composed of multiple virtual areas, a pool composed of multiple real area groups with different performance, and an access command from the host device And a controller that accesses the real area assigned to the virtual area specified from the access command.
- the controller manages pool status information which is information indicating which real area is allocated to which virtual area and the access load related to the virtual area.
- a storage system management system includes a storage resource and a processor connected to the storage resource.
- the storage resource stores capacity management information which is information indicating the current storage capacity of each real area group.
- the processor predicts a used capacity for each real area group at a future time point based on the pool status information at a plurality of time points in the past from the present time and one or more access load threshold values.
- the processor calculates an expansion / reduction amount that is a difference between the predicted used capacity and the current storage capacity represented by the capacity management information for each real area group, and executes processing based on the calculation result.
- the controller transfers the data in the first real area in the first real area group to the second real area in the second real area group of a type suitable for the access load of the first real area.
- the second real area can be assigned instead of the first real area to the virtual area to which the first real area has been assigned after migration.
- the host device may be a computer or a storage device different from the storage device.
- the performance of the real area group includes, for example, performance related to access.
- As the performance related to access for example, the response time, which is the length of time from when a command for accessing data is input until the response to the command is output, or the amount of data input / output per unit time There is.
- the access load is a load related to access, for example, an access frequency (the number of accesses performed per unit time) or a data transfer rate (amount of data transferred per unit time).
- the “access load related to the virtual area” may be an access load of the virtual area (access load of data in the virtual area) or an access load of the real area assigned to the virtual area. good.
- the access is, for example, read and / or write.
- the management system may be one or more computers existing outside the storage device, may be integrated with the controller, may be integrated with the host device, It may be realized by a combination of a storage device and a device existing outside the storage device.
- Example 1 shows a configuration of a storage system related to Example 1 of the present invention.
- 2 shows programs and information stored in a memory 1500 in the storage apparatus 1000 according to the first embodiment.
- An example of a physical resource table 1550 is shown.
- An example of the segment management table 1560 is shown.
- An example of a virtual volume management table 1570 is shown.
- An example of the migration policy table 1580 is shown.
- 7 shows programs and tables stored in the memory 2500 in the management computer 2000 according to the first embodiment.
- An example of a pool capacity management table 2560 is shown.
- An example of an IOPS performance evaluation table 2570 is shown.
- An example of the capacity transition history table 2580 is shown.
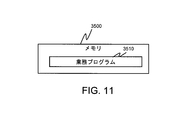
- 10 shows a program existing in the memory 3500 of the host computer 3000 related to the first embodiment.
- step 10 is a flowchart of processing of a segment IO evaluation program 2530. It is a flow chart of processing of capacity prediction (1) program 2540. It is a flowchart of the process of step 4040 of FIG. 6 is a graph showing an example of estimating the amount of expansion according to the first embodiment.
- An example of the GUI 5100 displayed in step 4010 of FIG. 13 is shown.
- the example of GUI5200 displayed by step 4047 of FIG. 14 is shown.
- 9 shows programs and information stored in a memory 2500 in the management computer 2000 according to the second embodiment.
- An example of a segment IOPS distribution history table 2640 is shown.
- An example of the additional pattern holding table 2650 is shown. The graph explaining the meaning of the parameter of Example 2 is shown.
- the flowchart of the process of the segment IOPS prediction program 2610 is shown.
- a flow chart of processing of the capacity prediction (2) program 2620 is shown.
- FIG. 24 shows a flowchart of a part of the processing of step 4340 in FIG.
- the remaining flowchart of the process of step 4340 of FIG. 23 is shown.
- the example of GUI5300 displayed by step 4310 of FIG. 23 is shown.
- An example of the GUI 5400 displayed in step 4358 of FIG. 25 is shown.
- 12 shows a flowchart of a part of the processing of a capacity prediction (2) program 2620 according to the third embodiment.
- the example of GUI5500 displayed by step 4373 of FIG. 28 is shown.
- 14 shows programs and information stored in the memory 2500 of the management computer 2000 according to the fourth embodiment.
- the flowchart of the process of the pool performance monitoring program 2700 is shown.
- An example of the GUI 5700 displayed in step 4550 of FIG. 31 is shown.
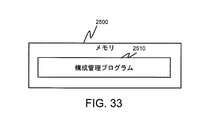
- 20 shows programs and information stored in a memory 2500 in the management computer 2000 according to the fifth embodiment.
- 10 shows programs and information stored in a memory 1500 in a storage apparatus 1000 according to Embodiment 5.
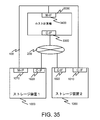
- 10 shows a storage system according to Embodiment 6 of the present invention.
- the concept of the pool management which concerns on Example 6 is shown.
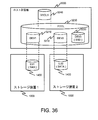
- 22 shows programs and information stored in a memory 3500 in a host computer 3000 related to Example 6.
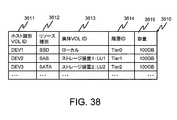
- An example of a resource management table 3610 is shown.
- the example of GUI which shows the result of the prediction which the capacity
- xxx table various types of information may be described using the expression “xxx table”, but the various types of information may be expressed using a data structure other than a table. In order to show that it does not depend on the data structure, the “xxx table” can be called “xxx information”.
- the process may be described with “program” as the subject.
- the program is executed by a processor (for example, CPU (Central Processing Unit)), so that the determined processing is appropriately performed. Since the processing is performed using a storage resource (for example, a memory) and a communication control device (for example, a communication port), the subject of processing may be a processor. Further, the processing described with the program as the subject may be processing performed by the management system. Further, part or all of the program may be realized by dedicated hardware. For this reason, the processing described with the program as the subject may be processing performed by the controller.
- the controller may include a processor and a storage resource that stores a computer program executed by the processor, or may include the dedicated hardware described above. Further, the computer program may be installed in each computer from a program source.
- the program source may be, for example, a program distribution server or a storage medium.
- the management system is one or more computers, for example, a management computer, or a combination of a management computer and a display computer. Specifically, for example, when the management computer displays display information, the management computer is a management system. In addition, in order to increase the processing speed and reliability, a function equivalent to that of the management computer may be realized by a plurality of computers. In this case, the plurality of computers (in the case where the display computer performs display, the display is displayed). A management system).
- Embodiment 1 of the present invention will be described.
- the storage apparatus measures the access frequency of each segment.
- the storage apparatus determines the migration source segment and the migration destination segment based on the access frequency of each segment and a plurality of allowable access frequency ranges corresponding to a plurality of media prepared in advance. Then, the storage apparatus performs data migration from the migration source segment to the migration destination segment. As a result, the data is arranged on a medium suitable for the access frequency of the data.
- the management computer obtains information indicating the access frequency of each segment from the storage device.
- the previous segment may be determined. Then, the management computer transmits a segment migration instruction having information indicating the determined migration source segment and information indicating the migration destination segment to the storage device, so that the migration source can transfer the migration source segment to the storage device. Data migration to other segments may be performed.
- the management computer acquires information (hereinafter referred to as pool status information) indicating the pool usage status at that time, for example, information including the following (A) to (C) from the storage device at regular intervals.
- the management computer obtains the distribution of the access frequency and the number of segments at each time point from the pool status information acquired at a plurality of time points. Based on the transition of the distribution of the access frequency and the number of segments and the plurality of allowable access frequencies corresponding to the plurality of media, the management computer counts the number of segments to be allocated to the VVOL after a predetermined period from the present for each medium. (The number of future segments) is predicted. The number of future segments for the media N future minus the number of current segments that make up the media (hereinafter the current number of segments) N current (N future -N current ) is the amount of expansion for the media is there.
- the expansion amount of the medium A is a positive value, it is highly likely that the number of segments will be insufficient after a predetermined period.
- the expansion amount for media A is zero or a negative value, there is a high possibility that the segment will not be insufficient even after a predetermined period of time.
- a certain amount of segments may be removed from Media A).
- the management computer can calculate the expansion amount for each medium based on the pool status information at each time point. For this reason, it is possible to avoid an increase in performance that is unnecessarily increased, resulting in a wasteful increase in cost, and an increase in performance that greatly decreases.
- cost in this embodiment means a load.
- the load may be a cost load or a power consumption load.
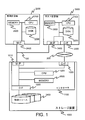
- FIG. 1 shows a configuration of a storage system according to the first embodiment of the present invention.
- the storage system includes a storage apparatus 1000, a management computer 2000 that is connected to and manages the storage apparatus 1000, and a host computer 3000 that uses a storage area provided by the storage apparatus 1000.
- a plurality of host computers 3000 may exist.
- the management IF (M-IF in the figure) 1010 of the storage apparatus 1000 and the management IF 3400 of the host computer 3000 are transferred to the management IF 2400 of the management computer 2000 with data such as SAN (Storage Area Network) or LAN (Local Area Network).
- the network 100 is connected.
- a communication IF 1020 of the storage apparatus 1000 is connected to a communication IF 3300 of the host computer through a data network 200 such as a SAN or a LAN.
- each management IF and communication IF is an HBA (Host Bus Adapter) or the like in a computer, a port or the like in a storage device, and when the data network is a LAN, the NIC (Network Interface Card) ) Etc. That is, what kind of communication interface device the management IF and communication IF are depends on the type of network to which the IF is connected and the type of apparatus having the IF.
- the data network 100 and the data network 200 may be the same network. Further, the IFs may be directly connected by a single cable, or may be connected via a switch or the like.
- the storage apparatus 1000 includes a plurality of physical resources 1400.
- the physical resource 1400 is a physical storage area. Based on the physical resource 1400, a logical volume that is a logical storage device is provided.
- the “physical storage area” may be a single physical storage device or a RAID group including a plurality of physical storage devices.
- the physical storage devices include SSD (Solid State Disk) -SAS (Serial Attached SCSI) -HDD (Hard Disk Drive), SATA (Serial Advanced Technology Attachment) -HDD, and the like.
- the storage apparatus 1000 includes a plurality of physical resources 1400 having different performances.
- the storage apparatus 1000 also includes a controller 1100 that is a control apparatus for controlling data input / output.
- the controller 1100 includes a disk IF 1300 for communicating with the physical resource 1400, a memory 1500, and a CPU 1200 connected thereto.
- the memory 1500 may include a cache memory for temporarily storing data accessed to the physical resource 1400 in response to an access command from the host computer 3000.
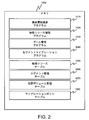
- FIG. 2 shows programs and information stored in the memory 1500.
- the programs include a configuration information communication program 1510, a physical resource management program 11520, a pool management program 1530, and a segment migration program 1540.
- the processes performed by the programs 1510, 1520, 1530, and 1540 are actually performed by the CPU 1200 that executes these programs.
- the information includes a physical resource table 1550, a segment management table 1560, a virtual volume management table 1570, and a migration policy table 1580.
- the configuration information communication program 1510 causes each program to perform processing in response to an information acquisition request via the management IF 1010 and a process to transmit a table described later to the outside and a setting processing request.
- the physical resource management program 1520 manages the configuration of the logical volume. Specifically, the program 1520 manages the physical resource table 1550.
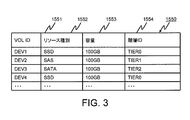
- FIG. 3 shows an example of the physical resource table 1550.
- the physical resource table 1550 has information regarding logical volumes based on physical resources. Specifically, the physical resource table 1550 includes the following information for each logical volume managed by the storage apparatus 1000: * VOL ID1551, which is an ID for identifying a logical volume * Resource type 1552 indicating the type of physical resource 1400 that is the basis of the logical volume, * Capacity 1553 representing the storage capacity of the logical volume, * Tier ID 1554 which is the ID of the tier to which the logical volume belongs Have
- a tier is a set of a plurality of logical volumes having the same performance and operation cost, and corresponds to the above-mentioned “media”.
- a hierarchy (media) as a set of logical volumes based on SSD is expected to have high performance, and therefore, an ID “TIER0” indicating a higher hierarchy is assigned. Since the tier (media) as a set of logical volumes based on the SAS-HDD is expected to have a lower performance than the tier based on the SSD, an ID “TIER1” indicating a tier lower than the tier based on the SSD is assigned. Since the tier (media) as a set of logical volumes based on the SATA-HDD is expected to have lower performance than the tier based on the SAS-HDD, an ID “TIER2” indicating a tier lower than the tier based on the SAS-HDD is allocated. .
- the tier ID 1554 may be automatically allocated by the physical resource management program 1520 when creating a logical volume, or may be manually allocated by an administrator who manages the storage apparatus 1000.
- the table 1550 may include a RAID level or the like indicating the degree of redundancy of the RAID. In this case, even if a hierarchical ID 1554 is assigned in consideration of the performance and operation cost according to the RAID level in addition to the resource type 1552. Good.
- the hierarchy may be referred to as “media”. Note that there may be three or more layers (media).
- the pool management program 1530 manages a pool and a virtual volume for realizing the thin provisioning technology. Specifically, for example, the program 1530 manages the segment management table 1560 and the virtual volume management table 1570.
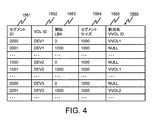
- FIG. 4 shows an example of the segment management table 1560.
- the segment management table 1560 has information regarding segments. Specifically, the segment management table 1560 includes the following information for each segment constituting the pool: * Segment ID 1561 which is an ID for uniquely identifying a segment, * VOL ID 1562 which is an ID indicating a logical volume (pool volume) in which a segment exists, * Start LBA 1563, which is an LBA indicating the start position (segment start position) in the logical volume * Segment size 1564 indicating the size of the segment, * Allocation destination VVOL ID 1565 which is the ID of the virtual volume (VVOL) to which the segment is allocated Have According to this table 1560, for example, the segment ID: 0000 occupies LBA: 0 to segment size: 1000 minutes (from LBA: 0 to LBA: 999) in the logical volume: DEV1, and the virtual volume: VVOL1 Assigned.
- the segment with the allocation destination VVOL ID: NULL indicates that the segment has not yet been allocated to the VVOL.
- the size of all segments is 100 MB (Mega Bytes).
- the size of each segment may not be 100 MB, may be a variable size instead of a fixed size, and the size of all segments may not be the same.
- the number of pools is one in this embodiment. However, a plurality of pools may exist.
- a “segment” is a real area (substantial storage area) that constitutes a pool.
- the pool has a plurality of segment groups having different performances. Each segment group is composed of a plurality of logical volumes having the same performance.
- a logical volume as a component of a pool may be referred to as a “pool volume”.
- the pool volume may be a substantial logical volume based on the physical resource 1400, or may be a logical volume based on a storage resource (logical volume or physical resource) of an external storage device (not shown). That is, the segment may be a storage area that can be allocated to the VVOL.
- a VVOL is a virtual logical volume (a volume that conforms to the thin provisioning technology) composed of a plurality of virtual areas (virtual storage areas).
- the VVOL is provided to the host computer 3000.
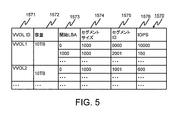
- FIG. 5 shows an example of the virtual volume management table 1570.
- the virtual volume management table 1570 has information related to the VVOL. Specifically, the virtual volume management table 1570 includes the following information for each virtual area: * VVOL ID 1571 which is the ID of the VVOL having the virtual area, * Capacity 1572 representing the storage capacity of the VVOL (the storage capacity recognized by the host computer 3000) * Start LBA 1573, which is an LBA indicating the start position in the VVOL of the virtual area, * Segment size 1574 indicating the size of the segment assigned to the virtual area * Segment ID 1575, which is the ID of the segment assigned to the virtual area * IOPS (Input Output Per Second) 1576, which is the frequency of access to the segment assigned to the virtual area Have
- VVOL: VVOL1 is recognized by the host computer 3000 as a volume of 10 TB (terabyte).
- a segment with a segment ID of 0000 is assigned to a virtual area of VVOL: VVOL1 with an LBA of 0 to 1000 minutes.
- a virtual area to which no segment is assigned can be determined by the following method (a) or (b).
- the access frequency is not limited to IOPS as long as it is the number of accesses in each fixed period.
- the IOPS may be a unit of IO (Input / Output) generated within a segment migration interval to be described later.
- the virtual volume management table 1570 holds information (for example, the last access date and time for each segment) as a reference for determining the data migration source in addition to the above information. May be.
- IOPS is the IOPS of the segment, it is updated when the segment is accessed. In other words, even if access to the virtual area occurs or it is not necessary to access the segment (for example, because there is data to be read in the cache memory, the data in the cache memory is transferred to the host computer 3000). (When the read process is completed), the IOPS of the segment assigned to the virtual area is not updated. When an access to a virtual area occurs, the IOPS 1576 corresponding to the virtual area may be updated regardless of whether the segment assigned to the virtual area is accessed. In addition, when the access to the virtual area is a specific type of access (for example, when the access is a read), the IOPS 1576 corresponding to the virtual area may not be updated.
- the pool management program 1530 uses the segment management table 1560 and the virtual volume management table 1570 to manage the correspondence between the virtual area and the segment, and when there is an access to an unallocated virtual area, Are allocated to the virtual region.
- the pool management program 1503 stores data according to the write command in the cache memory. At this point, the program 1503 may return a write completion response to the host computer 3000.
- the pool management program 1530 identifies the VVOL and the virtual area as the write destination based on the access destination information.
- the program 1530 determines whether or not a segment is allocated to the write destination virtual area based on the table 1570.
- the program 1530 identifies an empty segment (a segment not assigned to any virtual area) based on the table 1560.
- the program 1530 assigns the identified segment to the write destination virtual area. Specifically, the program 1530 registers the identified segment ID, size, and IOPS in the record corresponding to the write destination virtual area (the record in the table 1570).
- the determination in S003 is affirmative, or after S004, the program 1530 writes the data in the cache memory to the segment assigned to the write destination virtual area. At this point, the program 1503 may return a write completion response to the host computer 3000. At this time, the IOPS 1576 of the segment is updated by the segment migration program 1540.
- the pool management program 1530 identifies the VVOL and virtual area that are the read source based on the access destination information.
- the program 1530 determines whether data to be read remains in the cache memory. (S013) If the determination in S012 is affirmative, the program 1530 transmits the read target data in the cache memory to the host computer 3000. In this case, the IOPS 1576 of the segment assigned to the read source virtual area is not updated.
- the program 1530 determines the segment assigned to the read source virtual area based on the table 1570. (S015) The program 1530 reads the read target data from the identified segment and stores it in the cache memory. At this point, the segment's IOPS 1576 is updated by the segment migration program 1540. (S016) The program 1530 transmits the read target data stored in the cache memory in S015 to the host computer 3000.
- the segment migration program 1540 and the migration policy table 1580 will be described.
- the segment migration program 1540 monitors access to each segment and updates the IOPS 1576 of the virtual volume management table 1570. In addition, the segment migration program 1540 performs segment migration between media (between hierarchies) according to the table 1580 based on the migration policy table 1580 at intervals designated by the system or the administrator. Then, the program 1540 updates the relationship between the virtual area and the segment (segment management table 1560 and virtual volume management table 1570). Specifically, the program 1540 assigns a migration destination segment to the virtual area to which the migration source segment is assigned instead of the migration source segment.
- FIG. 6 shows an example of the migration policy table 1580.
- the migration policy table 1580 includes the following information for each policy: * ID 1581 for identifying the policy * Migration opportunity 1582, * Policy 1583 describing the process to be executed, Have The opportunity 1582 and the policy 1583 may be set at the time of initial storage shipment, or may be manually set later by the administrator.
- the segment migration program 1540 converts the data in the segment from the segment with the largest IOPS to the segment in the hierarchy: TIER0 (SSD media). Migrate to When there are no more empty segments in the SSD media, data is migrated to an empty segment in the next layer: TIER1 (SAS media). Thereby, the media can be used according to the segment access frequency.
- the management computer 2000 includes a memory 2500, a disk 2200 as an auxiliary storage device, and a CPU 2100 connected thereto.
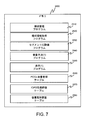
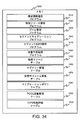
- FIG. 7 shows programs and information stored in the memory 2500.
- the configuration management program 2510 There are a configuration management program 2510, a configuration information acquisition program 2520, a segment IO evaluation program 2530, a capacity prediction (1) program 2540, and a display (1) program 2550 as programs. These programs are executed by the CPU 2100.
- the information includes a pool capacity management table 2560, an IOPS performance evaluation table 2570, and a capacity transition history table 2580.
- the configuration management program 2510 receives a setting instruction from the storage administrator and issues a setting instruction to the storage apparatus 1000.
- the administrator can set the migration policy table 1580 of the storage apparatus 1000 using the configuration management program 2510.
- One piece of information managed by the configuration management program 2510 is a pool capacity management table 2560.
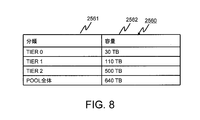
- FIG. 8 shows an example of the pool capacity management table 2560.
- the pool capacity management table 2560 has information on the pool capacity. Specifically, the table 2560 includes the following information for each medium: * Classification 2561 indicating the type of media * Capacity 2562 that represents the total storage capacity of all the segments that make up the media, Have As the classification 2561, there may be “entire pool”. In this case, the total storage capacity of all the media constituting the pool is recorded as the capacity 2562. According to the table 2560 of FIG. 8, the pool is tier: TIER0 is 30TB, tier: TIER1 is 110TB, tier: TIER2 is 500TB, and the capacity of the pool is 640TB which is the sum of them.
- the table 2560 substantially matches the state of the pool of the storage apparatus 1000 at all times. This is because the configuration management program 2510 uses the configuration information acquisition program 2520 to constantly monitor the status of the pool that the storage apparatus 1000 has.
- the configuration information acquisition program 2520 communicates with the configuration information communication program 1510 via the management IF 1010 of the stray device 1000, and acquires the information of the storage device 1000.
- the segment IO evaluation program 2530 uses the IOPS evaluation table 2570 to calculate a medium in which data in the segment is desirably arranged from the access frequency of the segment, and records the calculation result in the capacity transition history table 2580.
- Capacity prediction (1) The program 2540 uses the capacity transition history table 2580 to predict the capacity required in the future for each medium.
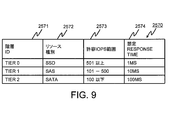
- FIG. 9 shows an example of the IOPS performance evaluation table 2570.
- the IOPS performance evaluation table 2570 has information indicating in which type of media the data in the IOPS segment belonging to which IOPS range should be placed. Specifically, the table 2570 includes the following information for each medium: * Hierarchy ID 2571 which is an ID for identifying media (hierarchy), * Resource type 2572 representing the type of media (the type of physical resource that is the basis of the logical volume that constitutes the media), * Allowable IOPS range 2573, which is the desired IOPS range of the segment with data that is desired to be placed on the media.
- Assumed response time 2574 which is a performance (response time) expected when IOPS of all used segments (segments allocated to the virtual area) in the media are within the allowable IOPS range 2573, Have
- the “response time” mentioned here is a response time in the storage apparatus 1000, specifically, a time length from when a command for accessing a segment is issued from the controller 1100 until the access to the segment is completed. is there.
- the “assumed response time” is an assumed response time (expected response time).
- This table 2570 is a table for calculating a TIER in which the data in the segment is preferably arranged based on the IOPS in the segment, unlike the migration policy table 1580 described above.
- Examples of the derivation of the allowable IOPS range 2573 and the assumed response time 2574 include the following.
- the physical resource 1400 can always expect the same response time (assumed response time) if the IOPS is equal to or less than a specific IOPS (hereinafter referred to as a boundary IOPS). (Beyond expected response). The higher the performance media, the larger the boundary IOPS. From this, the allowable IOPS range 2573 shown in FIG. 9 can be derived by combining the boundary IOPS for each medium.
- the IOPS performance evaluation table 2570 may be determined by direct input by the administrator. In the first embodiment, the assumed response time 2574 may be omitted.
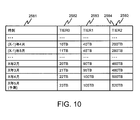
- FIG. 10 shows an example of the capacity transition history table 2580.
- the capacity transition history table 2580 has information indicating the used capacity (total storage capacity of used segments) for each medium calculated based on the information acquired from the storage apparatus 1000 at each time point. Specifically, the table 2580 includes the following information for each time point: * Time 2581 representing the current date and time, * Information 2582 representing the used capacity of TIER0 (SSD media) at that time, * Information 2583 indicating the used capacity of TIER1 (SAS media) at that time, * Information 2584 indicating the used capacity of TIER2 (SATA media) at that time, Have The used capacity of each medium at each time point is calculated by the segment IO evaluation program 2530. If there are four or more TIERs, the number of columns increases accordingly.
- TIER0 is 10TB
- TIER1 is 40TB
- TIER2 is 200TB in view of the IOPS of each segment. Details of the update of the capacity transition history table 2580 will be described together with the processing of the segment IO evaluation program 2530 described later.
- the display (1) program 2550 shown in FIG. 7 displays GUI (Graphical User Interface) etc. on an output device such as a display device, asks the administrator to input each set value, and outputs the execution result of the program To do.
- GUI Graphic User Interface
- the host computer 3000 includes a memory 3500, a disk 3200 as an auxiliary storage device, and a CPU 3100 connected thereto in addition to the communication IF 3300 and the management IF 3400 described above.
- a business program 3510 is stored in the memory 3500 as a computer program executed by the CPU 3100.
- the business program 3510 is, for example, a program for managing a database, and data stored in the database or the like is stored in the pool through the VVOL.
- the management computer 2000 and the host computer 3000 are, for example, a personal computer or a workstation.
- the memory (2500 and memory 3500) of each computer may include an OS (Operating System) and a cache memory for temporarily storing data.
- each computer may include an input device such as a keyboard and an output device such as a display device in addition to the hardware configuration described above.
- the disks (2000 and 3000) may be omitted.
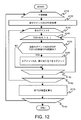
- FIG. 12 is a flowchart of the process of the segment IO evaluation program 2530.
- the process is started at a timing according to a preset schedule or at a timing designated by the administrator.
- the segment IO evaluation program 2530 repeats the processing from step 4120 to step 4170 at regular intervals.
- the “fixed interval” may be, for example, the start time interval of segment migration performed by the segment migration program 1540 of the storage apparatus 1000, or may be an arbitrary time interval designated by the administrator.
- step 4120 the program 2530 acquires the virtual volume management table 1570 from the storage apparatus 1000 via the configuration information acquisition program 2520.
- step 4130 the program 2530 performs the processing from step 4140 to step 4160 for each used segment A (segment allocated to VVOL) based on the virtual volume management table 1570 acquired in step 4120.
- steps 4140 to 4160 will be described.
- the program 2530 determines whether the IOPS of the target segment A is within the allowable IOPS range 2573 of TIER X. Is determined (step 4150).
- step 4150 If the result of the determination in step 4150 is affirmative, the program 2530 increases the segment count value of TIER X by 1 (step 4160). If the result of the determination in step 4150 is negative, the process returns to step 4140, and step 4150 is performed for TIER (X + 1).
- the segment count value means the number of used segments when it is assumed that an ideal data arrangement according to the IOPS performance evaluation table 2570 is obtained.
- the program 2530 determines whether the IOPS of the segment ID 2001 (see FIG. 5) is within the allowable IOPS range 2573 of TIER 0 (see FIG. 9). Since the allowable IOPS range of TIER0 is 501 or more, the determination result is negative. Therefore, the program 2530 determines whether the IOPS of the segment ID 2001 is within the allowable IOPS range of TIER1. Since the result of the determination is affirmative, the program 2530 increases the segment count value of TIER1 by one.
- step 4140 The processing from step 4140 to step 4160 will be performed for all used segments.
- the program 2530 converts the segment count value of each TIER (the ideal number of used segments in the TIER) into a capacity, and adds it to the current time portion of the capacity transition history table 2580. For example, assuming that the segment count value of TIER0 is 220,000 in April X, in this embodiment, since one segment is 100 MB, 22 TB is allocated to the ideal used capacity (virtual area of TIER0) The total storage capacity of the segment). Similarly, for TIER1 and TIER2, the ideal used capacity in April X is calculated, and the result is added to the record in April X in the capacity transition history table 2580.
- the processing shown in FIG. 12 may be ended by an administrator stop instruction, the segment migration program 1540 stop, or the capacity prediction (1) program 2540 stop (that is, at an arbitrary timing).
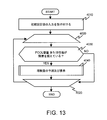
- FIG. 13 is a flowchart of the process of the capacity prediction (1) program 2540.
- this processing is started at a timing according to a preset schedule or a timing designated by the administrator.
- the capacity prediction (1) program 2540 receives input of the capacity threshold Th1, the target performance Th2, and the prediction period T from the administrator.
- the capacity threshold Th1 is a value that is compared with the used capacity of the pool (the total storage capacity of the used segments).
- the target performance Th2 is a value compared with the performance of the pool (for example, average response time).
- the prediction period T is a value that means at which point of time the amount of expansion is calculated from the present to the future. If the forecast period T is 1 month and the current time is April 2009, the amount of expansion in May 2009 is calculated.
- step 4010 may be omitted by initially setting at least one of the capacity threshold Th1, the target performance Th2, and the prediction period T at the time of shipment or the like. A GUI display example for inputting these initial values will be described later. Thereafter, as shown in step 4020, the processing of step 4030 and step 4040 is performed, for example, periodically.
- the program 2540 uses the pool usage capacity and performance (for example, the virtual volume management table 1570) acquired using the configuration information acquisition program 2520 and the IOPS performance evaluation table 2570 ( For example, an average response time) is calculated.
- the program 2540 determines whether or not the used capacity of the pool has exceeded the capacity threshold Th1, and whether or not the performance of the pool has exceeded the target performance Th2.
- step 4030 When the result of the determination in step 4030 is affirmative, specifically, when the used capacity of the pool exceeds the capacity threshold Th1 or the performance of the pool falls below the target performance Th2 (for example, the average response time is the target Step 4040 is executed if it is a long time exceeding the performance Th2. That is, the program 2540 performs an expansion amount prediction and a result display process. This process will be described later with reference to FIG.
- the processing of the capacity prediction (1) program 2540 may be terminated by an administrator's stop instruction or the segment migration program 1540 being stopped at an arbitrary timing.
- FIG. 14 is a flowchart of the process of step 4040 in FIG.
- step 4042 the program 2540 calculates the increase rate of the used capacity of each medium based on the capacity transition history table 2580.
- the program 2540 predicts the used capacity for each medium at a time point after the prediction period T from the present, based on the increase rate of the used capacity of each medium. An example of the prediction method will be described later.
- the program 2540 determines whether or not the current capacity Y of the target medium is insufficient even if the prediction period T has elapsed. Specifically, based on the pool capacity management table 2560, the program 2540 uses the target medium capacity Y (the capacity indicated by the target medium capacity 2560) as the used capacity Z (the used capacity of the target medium) predicted in step 4042. It is determined whether or not this is the case.
- step 4044 to step 4046 is performed for each medium.
- step 4047 the program 2540 causes the display (1) program 2550 to display the determined expansion amount of each medium.
- An example of the displayed GUI will be described later.
- the program 2540 instead of or in addition to displaying the determined expansion amount of each medium, the program 2540 executes an unused logical volume (or an unused logical volume among the unused logical volumes). A process of automatically adding a portion corresponding to the amount of expansion) to a medium corresponding to the type of the logical volume may be performed.
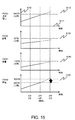
- Step 4042 to Step 4047 Specific examples from Step 4042 to Step 4047 will be described with reference to FIG.
- the horizontal axis 9111 indicates time
- the vertical axis 9112 indicates the capacity of the entire pool or each TIER.
- a graph 9110 is a total capacity of the pool
- a graph 9120 is a TIER0 capacity
- a graph 9130 is a TIER1 capacity
- a graph 9140 is a TIER2 capacity.
- the capacity prediction (1) program 2540 can predict the used capacity after one month based on the capacity transition history table 2580 (see FIG. 10). For example, when the capacity required after one month is predicted using a linear function, the used capacity of TIER0 (strictly speaking, the ideal storage capacity) increases by 1 TB every month, so that one month later It is predicted that in May of X, it will increase by 1 TB to 23 TB. For TIER1 and TIER2, the capacity used in May X can be predicted by the same method. In addition, for the estimation of the linear function used for the prediction, an increase rate with little error (increase rate of the used capacity) can be calculated by using a mathematical method such as a least square method.
- the accuracy can be improved by using a multidimensional function or the like.
- the used capacity ideal storage capacity
- the future used capacity can be predicted by an arbitrary method (that is, the prediction method is It is not limited to linear functions or multidimensional functions).
- the increase rate of the used capacity (ideal storage capacity) specified from the capacity transition history table 2580 may have periodic characteristics.
- the used capacity of TIER2 basically increases by 20 TB, but there is a case where a rapid increase is seen only from April to May (X-1). .
- the pool containing the VVOL that stores information in the general corporate employee management database has expanded rapidly from April to May, when new employees join the company during the year, and increases significantly during other periods. Not expected.
- the capacity prediction (1) program 2540 may ask the administrator to specify whether to consider periodic characteristics or to specify the period of history data used for prediction.
- the predicted usage capacity (predicted usage capacity) Z of TIER0 does not exceed the capacity Y (30 TB) of TIER0, and the predicted usage capacity Z of TIER1 is equal to that of TIER1.
- step 4047 the result that TIER 0 and TIER 1 do not need to be added and that 20 TB is required to be added to TIER 2 is displayed.
- a result indicating that (YZ) capacity reduction is possible may be displayed.
- the determination that the capacity can be reduced may be made only when the value of (Y ⁇ Z) is equal to or greater than a predetermined value (for example, the predetermined value is greater than zero).
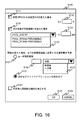
- FIG. 16 shows an example of the GUI 5100 displayed by the display (1) program 2550 in step 4010 of FIG.
- the GUI 5100 is a GUI that requests the administrator to input each setting value.
- the GUI 5100 includes a text box 5112 for inputting a capacity threshold Th1, a combo box 5122 for selecting a target performance type to be monitored as the target performance Th2, and a text box 5123 for inputting the target performance Th2. Further, check boxes 5111 and 5121 for selecting whether to monitor capacity and performance may be provided.
- options for the target performance 5122 include an average response time of the pool, a percentile value, and the like.
- the average response time is an average value of response times per IO (one access to the segment from the controller 1110).
- the 80th percentile value of response time is P, which means that 80% of the response time (response time per IO) is equal to or less than P.
- the GUI 5100 includes a text box 5132 and a combo box 5133 for selecting a unit of the period in order to input the prediction period T.
- a radio button 5131 may be provided for selecting whether the user inputs directly or uses a value of an appropriate period that the system has, for example, a segment migration interval.
- a check box 5141 for selecting whether to insert a periodic prediction into the prediction or a text box for designating a prediction period may be provided.
- a button 5151 for confirming the input, a button 5152 for canceling, etc. may be provided.
- the K percentile value is specified as Vms (milliseconds) in response time
- the sum of IOPS of all used segments of all media whose expected response time is Vms or less is the sum of IOPS of all used segments in the pool. If it is below the K percent, YES is obtained in step 4030 of FIG. That is, when the number of segments with an assumed response time of Vms or less increases (that is, the proportion of segments using high-performance media increases), the overall performance improves.
- the proportion of segments with an estimated response time of Vms or less is less than K percent (that is, when the number of segments with an estimated response time of Vms or more increases, the overall performance deteriorates.
- the actual response time that occurs until the data is actually returned from the read request is monitored. If the number of read requests with a response time of Vms or less exceeds K percent in an arbitrary fixed period, YES is returned in step 4030.
- the response time may be an actual measurement value.
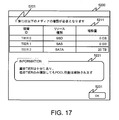
- FIG. 17 shows an example of the GUI 5200 displayed in step 4047 of FIG.
- the GUI 5200 is a GUI for notifying the administrator of the additional amount required for each TIER.
- the GUI 5200 includes a table 5211 for displaying a text 5201 indicating that the prediction is after the prediction period T and displaying each additional amount.
- Table 5211 shows the amount of expansion required for each TIER and corresponding resource type. Instead of the table 5211, a list of logical volumes that can be used in the storage apparatus and satisfy the expansion amount may be displayed. Further, a button 5231 used for the administrator to understand the above contents and close the GUI 5200 may be provided.
- the GUI 5200 may display text explaining the reason why the additional amount shown in the table 5211 is necessary in the Information area 5221.
- the text displayed in the Information area 5221 may be determined as follows based on whether or not the storage capacity (logical volume) is added to the higher TIER. First, it is determined whether or not the expansion amount of TIER0, which is the highest TIER, is 0. If the expansion amount of TIER0 is 0, there is enough high-performance TIER, and this expansion can be done only by adding a low-performance TIER. Text may be displayed indicating that the performance is sufficient.
- TIER0 if additional TIER0 is necessary, that is, if the additional amount is not 0, the text that indicates that the area accessed frequently is expanded and that a high-performance TIER is necessary to maintain performance May be displayed.
- the above-described processing may be applied after classifying TIERs from the viewpoint of whether or not they are the highest TIERs and the cost of expansion. Thereby, the text (word) displayed in the Information area 5221 can be determined.
- Example 2 of the present invention will be described. At that time, differences from the first embodiment will be mainly described, and description of common points with the first embodiment will be omitted or simplified.
- the increase rate of the used capacity is calculated for each medium using the IOPS evaluation table 2560 prepared in advance, and the expansion amount is calculated for each medium based on the increase rate of the used capacity for each medium. Is done.
- expansion cost based on the target performance and the cost for expanding the capacity of the media (hereinafter referred to as “expansion cost”), an expansion that minimizes the expansion cost within a range where performance exceeding the target performance is achieved. The amount is determined.
- the physical configuration of the storage system according to the second embodiment may be the same as the configuration shown in FIG.
- the program stored in the memory 2500 in the management computer 2000 is different from the program of the first embodiment.
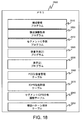
- FIG. 18 shows programs and information stored in the memory 2500 according to the second embodiment.
- Configuration management program 2510, configuration information acquisition program 2520, IOPS performance evaluation table 2570, and pool capacity management table 2560 are the same as those in the first embodiment. However, in the IOPS performance evaluation table 2570, the allowable IOPS range 2573 may not be included, but the assumed response time 2574 needs to be included.
- the memory 2500 includes a segment IOPS prediction program 2610 that predicts the transition of the number of segments for each IOPS, and a capacity prediction that predicts an additional amount for each TIER that will be required in the future ( 2)
- a program 2630, a segment IOPS distribution history table 2640, and an expansion pattern holding table 2650 are stored.
- the additional pattern holding table 2650 is a table used for convenience and may be temporarily stored.
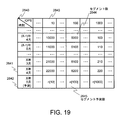
- FIG. 19 shows an example of the segment IOPS distribution history table 2640.
- the segment IOPS distribution history table 2640 represents a distribution based on the IOPS of the number of used segments. Specifically, for example, the horizontal axis of the table 2640 represents IOPS2643, the vertical axis represents time 2641, and each cell 2644 that is the intersection of a row and a column stores information indicating the number of segments. For example, the number of segments having an IOPS of 100 in April X is 6200. In addition, for the sake of convenience, the number of predicted segments (number of predicted segments) 2645 by IOPS at a future time 2642 is written as n [number of IOPS].
- the IOPS number 2643 may be a specific range unit (for example, 10 IOPS unit) in addition to one step. A method for creating and updating the segment IOPS distribution history table 2640 will be described in the process flow of the segment IOPS prediction program described later.
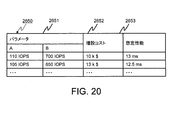
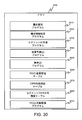
- FIG. 20 shows an example of the additional pattern holding table 2650.
- the expansion pattern holding table 2650 has information regarding capacity expansion patterns. Specifically, the table 2650 includes the following information for each additional pattern: * Parameter 2651 representing a parameter related to the proportion of each media, * An expansion cost 2652 representing an expansion cost that occurs when the capacity of the pool is expanded so as to realize the parameter 2651, * Assumed performance 2653 representing the performance expected at that time, Have The parameters, the extension cost, the specific calculation method and the usage method will be described in the process flow of the capacity prediction (2) program 2620 described later.
- the horizontal axis 9202 is IOPS
- the vertical axis 9201 is the number of segments.
- a curve 9203 indicates the number of segments for each IOPS 9202.
- a and B are parameters (A ⁇ B).
- the two parameters A and B are for defining which media in which IOPS segment should be placed on which media.
- the data in the segment whose IOPS is A or less is arranged in TIER2
- the data in the segment whose IOPS is B or more is arranged in TIER0
- the data in the IOPS segment whose IOPS is larger than A and smaller than B is Arranged at TIER1.
- the number of segments to be allocated to TIER0 is represented by the area of region 9204
- the number of segments to be allocated to TIER1 is represented by the area of region 9205
- the number of segments to be allocated to TIER2 is represented by the area of region 9206.
- the number of segments to be allocated to TIER2 is represented by the area of region 9206.
- the additional cost 2652 shown in FIG. 20 is shown as an amount necessary for capacity expansion.
- the expansion cost is not limited to the amount of money, and may be the amount of power consumption that increases due to the expansion.
- the assumed performance may be a percentile value of response time. Further, the assumed response time can be calculated by the same method as described above even when there are three or more TIERs.
- FIG. 22 shows a flowchart of the processing of the segment IOPS prediction program 2610.
- the process is started at a timing according to a preset schedule or at a timing designated by the administrator.
- the segment IOPS prediction program 2610 repeats the processing from step 4420 to step 4460 at regular intervals.
- the “fixed interval” mentioned here may be, for example, the start interval of segment migration performed by the segment migration program 1540 of the storage apparatus 1000, or an arbitrary interval specified by the administrator. .
- step 4420 the program 2610 acquires the virtual volume management table 1570 from the storage apparatus 1000 using the configuration information acquisition program 2520.
- step 4430 the program 2610 counts the number of segments for each IOPS based on the acquired IOPS 1576 of the virtual volume management table 1570.
- step 4440 the program 2610 updates the segment IOPS distribution history table 2640 using the number of segments for each IOPS counted in step 4430. As described above, the number of segments may be counted for each IOPS range.
- step 4450 the program 2610 uses the segment IOPS distribution history table 2640 updated in step 4440 to predict the number of segments for each IOPS after the prediction period T specified by the capacity prediction (2) program described later.
- step 4460 the program 2610 adds the prediction result to the segment IOPS distribution history table 2640.
- n [100] of the number of segments in May X, which is one month later is predicted to be 6300.
- various methods such as using a multi-dimensional function as well as a linear function are conceivable. In this way, n [number of IOPS] that is the predicted value 2645 of the number of segments in the future can be obtained.
- the processing shown in FIG. 22 may be ended by an administrator's stop instruction, stop of the segment migration program 1540, or stop of the segment IOPS prediction program 2610 (that is, at an arbitrary timing).
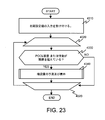
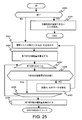
- FIG. 23 shows a flowchart of processing of the capacity prediction (2) program 2620.
- the process is started at a timing according to a preset schedule or at a timing designated by the administrator.
- the capacity prediction (2) program 2620 asks the administrator to input the capacity threshold Th1, the target performance Th2, and the expansion cost C per unit capacity generated when adding media of each TIER. .
- the program 2620 also asks for the input of the prediction period T.
- the program 2620 notifies the segment IOPS prediction program 2610 of the input prediction period T.
- the capacity threshold Th1, the target performance Th2, the extension cost C, and the prediction period T are initially set at the time of shipment or the like, so that step 4310 may be omitted.
- the extension cost C indicates a cost or power consumption generated when adding a medium per unit capacity.
- step 4320 the processing of step 4330 and step 4340 is performed periodically, for example.
- the program 2620 uses the pool usage capacity and performance (for example, the virtual volume management table 1570) acquired by using the configuration information acquisition program 2520 and the additional pattern holding table 2650 ( For example, an average response time) is calculated.
- the program 2540 determines whether or not the used capacity of the pool has exceeded the capacity threshold Th1, and whether or not the performance of the pool has exceeded the target performance Th2.
- step 4330 If the result of the determination in step 4330 is affirmative, specifically, if the used capacity of the pool exceeds the capacity threshold Th1 or the performance of the pool falls below the target performance Th2 (for example, the average response time is the target Step 4340 is executed if the time exceeds the performance Th2). That is, the program 2620 performs an expansion amount prediction and a result display process. This process will be described later with reference to FIG.
- the processing of the capacity prediction (2) program 2620 may be terminated by an administrator's stop instruction or the segment migration program 1540 being stopped at an arbitrary timing.
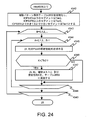
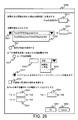
- step 4342 the capacity prediction (2) program 2620 initializes the extension pattern holding table 2650 (makes it blank). In addition, program 2620 uses parameters A and B to classify the number of segments to be assigned to each TIER.
- Step 4343 and Step 4344 show that Step 4345 to Step 4347 are executed in all (A, B) where A is smaller than B (A ⁇ B).
- step 4345 to step 4347 will be described with respect to one (A, B) as an example (referred to as “target (A, B)” in the description of FIG. 24).
- the program 2620 calculates the estimated performance K of the pool based on the target (A, B) based on the IOPOS performance evaluation table 2560 and the segment predicted number 2645 in each IOPS in the segment IOPS distribution history table 2640. ,calculate.
- the assumed performance is the average response time of the pool
- step 4346 the program 2620 determines whether or not the assumed performance K calculated in step 4345 is superior to the target performance Th2 (that is, K ⁇ Th2).
- step 4346 If the result of the determination in step 4346 is negative, the program 2620 performs step 4345 and subsequent steps for the next (A, B).
- step 4346 determines whether the target (A, B) is the target (A, B) is the target (A, B) is the target (A, B) or not. If the result of the determination in step 4346 is affirmative, the program 2620 adds the target (A, B), the assumed performance K, and the additional cost J calculated from the target (A, B) to the additional pattern holding table 2650. Append. Thereafter, Step 4345 and subsequent steps are performed for the next (A, B).
- step 4350 the program 2620 determines whether or not the additional pattern holding table 2650 is empty.
- step 4350 If the result of the determination in step 4350 is affirmative, there is no additional pattern that realizes the target performance. Therefore, as shown in step 4351, the program 2620 displays a GUI for requesting resetting of the target performance or the like using the display (2) program 2630. Alternatively, the processing may be performed again from step 4341.
- step 4353 the program 2620 obtains the smallest expansion cost (A, B) (that is, a combination of parameters) from the expansion pattern holding table 2650.
- step 4354 the program 2620 obtains the used capacity of each TIER at the time after the prediction period T from the segment prediction number 2645 using (A, B) obtained in step 4353. Then, the program 2620 calculates the additional amount of each TIER as described with reference to FIG. 21 based on the used capacity (predicted value) of each TIER and the current used capacity of each TIER.
- step 4355 and step 4356 the program 2620 determines whether or not all TIER expansion amounts are positive values.
- step 4357 the program 2620 does not adopt (A, B) and keeps the expansion pattern.
- the record having the (A, B) is removed from the table 2650, and the process returns to step 4353.
- step 4358 is performed.
- step 4358 when the expansion pattern holding table 2650 is created except when the expansion amount is negative, the processing of step 4355 and step 4346 is not necessary.
- step 4358 the program 2620 causes the display (2) program 2630 to display the GUI having the additional amount for each TIER obtained by the processing shown in FIGS.
- step 4358 instead of or in addition to displaying the expansion amount for each TIER, the program 2620 automatically converts an unused logical volume in the storage apparatus 1000 to a medium corresponding to the type of the logical volume. You may perform the process of adding.
- FIG. 26 shows an example of the GUI 5300 displayed by the display (2) program 2630 in step 4310 of FIG.
- the GUI 5300 includes a text box 5311 for inputting a capacity threshold Th1, a combo box 5322 for selecting a target performance type to be monitored as the target performance Th2, and a text box 5323 for inputting the value.
- a radio button 5321 may be provided for selecting whether the target performance is designated directly or whether the target performance is to maintain the current performance.
- options for the target performance 5122 include an average response time of the entire pool, a percentile value, and the like.
- the GUI 5300 includes a text box 5332 and a combo box 5333 for selecting a unit of the period in order to input the prediction period T.
- a radio button 5331 may be provided for selecting whether the user inputs directly or uses an appropriate period value of the system, for example, a segment migration interval.
- a check box 5341 for selecting whether to insert a periodic prediction into the prediction or a text box for designating a prediction period may be provided.
- a text box 5351 for designating the additional cost C of each TIER is provided.
- the input unit may be power consumption in addition to the cost for expansion.
- a button 5361 for confirming the input, a button 5362 for canceling, etc. may be provided.
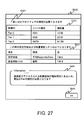
- FIG. 27 shows an example of the GUI 5400 displayed in step 4358 of FIG.
- the second embodiment it is possible to display a table 5221 that displays the estimated performance and the expansion cost generated by the expansion.
- the values displayed in the table 5221 can be displayed by referring to the additional pattern holding table 2650.
- all the expansion methods in the expansion pattern holding table 2650 include the table 5211 and the elements displayed in the table 5221, the expansion amount and the expansion cost or the assumed performance for each TIER as one table. They may be displayed in order or in assumed performance order.
- Example of variation of Example 2> ⁇ Example of variation of Example 2>.
- step 4340 of the second embodiment the expansion amount is calculated based on the target performance and the expansion cost.
- the following use cases may be supported by making it possible to perform this at an arbitrary timing desired by the administrator.
- the target performance of the pool is specified by the administrator, and the expansion amount of each medium that satisfies the target performance may be displayed together with the expansion cost.
- the administrator can obtain an expansion amount for each medium (TIER) that achieves both the target performance and the expansion cost by repeatedly specifying the target performance and displaying the calculated expansion cost.
- Step 4340 of the second embodiment it can be regarded as an optimization problem (optimization ⁇ ⁇ ⁇ problem) in which the expansion amount of each TIER that minimizes the expansion cost is determined under the constraint that satisfies the given target performance. .
- optimization ⁇ ⁇ ⁇ problem the expansion amount of each TIER that minimizes the expansion cost is determined under the constraint that satisfies the given target performance.
- the constant values C0, C1, and C2 are the expansion costs when the unit capacities of TIER0, TIER1, and TIER2, respectively, are added, and the constant values r0, r1, and r2 are the assumed response times of TIER0, TIER1, and TIER2, respectively.
- Variables J0, J1, and J2 are the capacities of TIER0, TIER1, and TIER2 before expansion, respectively, and variable r is the target performance set by the user.
- the objective function (cost) follows the following formula 1, and the constraint follows the following formulas 2 and 3.
- the above problem can be regarded as an optimization problem with parameters A and B as variables. If TIER increases, the number of parameters increases. Since the above problem is a non-linear convex programming problem, for example, the following method can be used in addition to the method described with reference to FIGS. When n [x] can be approximated to a differentiable function, it can be calculated by a penalty method or a sequential quadratic programming method. Further, even when n [x] cannot be approximated to a differentiable function, there is a possibility that it can be calculated efficiently by using various methods studied in the discrete programming problem. Note that the solution to the above problem does not limit the technical scope of the present invention.
- the “sub-pool” is a group of pool volumes in the pool. For example, when limiting a pool volume used by a specific VVOL, a VVOL is associated with a subpool, and a segment is allocated from the subpool to the specific VVOL.
- Example 3 of the present invention will be described. At that time, differences from the first embodiment and / or the second embodiment will be mainly described, and description of common points with the first and / or second embodiment will be omitted or simplified.
- the first and second embodiments an appropriate method for adding each TIER has been described in consideration of the segment access frequency (IOPS).
- IOPS segment access frequency
- the third embodiment when the assumed performance described in the second embodiment exceeds the target performance (for example, when the high-performance TIER is excessive), the capacity of the high-performance media is achieved from the pool while achieving the target performance. The capacity is removed and used for another application. As a result, the storage area can be effectively utilized as the entire storage apparatus.
- the hardware configuration of the third embodiment is the same as that of the second embodiment.
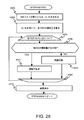
- step 4356 and subsequent steps will be described with reference to FIG.
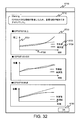
- FIG. 29 shows an example of the GUI 5500 displayed in step 4373 of FIG.
- a table 5521 that displays the reduction amount is displayed in addition to the table 5511 that displays the expansion amount.
- a table 5531 that displays the assumed performance at that time is also displayed.
- the extension cost may be written together with the assumed performance.
- the amount of expansion is calculated.
- the amount of expansion is a value based on the predicted usage capacity, so even if capacity expansion is performed according to the amount of expansion calculated in Examples 1 to 3, there is no possibility of performance degradation or capacity shortage. Absent. Therefore, in the fourth embodiment, cause analysis is performed when a performance degradation or a capacity shortage occurs after the capacity expansion is performed according to the expansion amount calculated in the first to third embodiments.
- the hardware configuration is the same as in the first or second embodiment.
- the programs included in the memory 2500 in the management computer 2000 are different. Specifically, as illustrated in FIG. 30, in the fourth embodiment, a pool performance monitoring program 2700 exists in the memory 2500. Note that the pool performance monitoring program 2700 may exist in the memory 2500 of the first or third embodiment.
- FIG. 31 shows a flowchart of processing of the pool performance monitoring program 2700.
- FIG. 31 shows an example of performance monitoring. By replacing “performance” with “capacity”, it can also be applied to capacity monitoring.
- the fourth embodiment as described above, it is assumed that the capacity has been increased by the method shown in the first to third embodiments. The processing is started at the start of the capacity prediction program described above or at a timing designated by the administrator (that is, an arbitrary timing).
- the pool performance monitoring program 2700 uses the configuration information acquisition program 2520 to acquire the actually measured performance value of the pool of the storage apparatus 1000.
- the “measured performance value” here is the same index as the target performance value described later, and the measured response time value of IO for each segment in the pool and the measured response time of IO for VVOL provided to the host computer. It can be calculated using the value.
- step 4520 the program 2700 compares the above-mentioned measured performance value acquired in step 4510 with the target performance specified in step 4310 or the like. If the measured performance value is inferior to the target performance (for example, response time) If the response time is longer than the target response time), the process proceeds to step 4530. If the measured performance value is the same as or better than the target performance, the process returns to step 4510 and monitoring is continued.
- the target performance for example, response time
- the process proceeds to step 4530. If the measured performance value is the same as or better than the target performance, the process returns to step 4510 and monitoring is continued.
- step 4530 the program 2700 uses the configuration information acquisition program 2520 to acquire the IOPS for each segment of the current pool from the virtual volume management table 1570. Then, the program 2700 compares the segment IOPS distribution history table 2640 storing the prediction result with the number of segments for each IOPS calculated from the acquired current pool. As a result of the comparison, if the number of segments for each IOPS acquired from the current pool is larger than the number of predicted segments 2645 for each IOPS in the segment IOPS distribution history table 2640, step 4550 is performed. Otherwise, it is determined that it is within the prediction range, and step 4540 is performed.
- Step 4540 the increase in the number of segments is within the prediction range, but the performance is degraded. For this reason, in step 4540, the program 2700 displays information indicating that there is a cause between the pool and the host computer 3000 (notifies the administrator of the information).
- the program 2700 may start the analysis program and cause the analysis program to continue cause analysis processing. Good.
- Step 4550 when Step 4550 is performed, there is an increase in the number of IOPS or segments exceeding the predicted value. For this reason, the program 2700 displays a GUI having the result.
- FIG. 32 shows an example of the GUI 5700 displayed in step 4550 of FIG.
- the GUI 5700 includes a text 5710 indicating the analysis result described in step 4550, and a graph 5720 indicating a difference between the predicted value line 5723 and the actually measured value line 5724.
- the horizontal axis 5722 is time
- the vertical axis 5721 is capacity. Note that the capacity of the horizontal axis 5721 may be the number of segments.
- the graph 5720 does not indicate the number of segments for each IOPS, but can indicate the IOPS portion determined to be out of the range in Step 4530 or the range of the allowable IOPS range 2573 of the IOPS performance evaluation table 2570.
- a button 5730 may be provided to be pressed when the tube or the operator confirms.
- the capacity prediction of each TIER of the pool is performed in the management computer 2000, but in the fifth embodiment of the present invention, the capacity prediction process is performed in the storage apparatus 1000.
- the hardware configuration according to the fifth embodiment is the same as the configuration illustrated in FIG.
- FIG. 33 shows programs and information stored in the memory 2500 in the management computer 2000.
- the above-described configuration management program 2510 may be provided in the memory 2500 as a program.
- the display (1) program 2550 and the display (2) program 2630 described in the first and second embodiments may be included.
- the management computer 2000 may be omitted.
- FIG. 34 shows programs and information stored in the memory 1500 in the storage apparatus 1000.
- a segment IOPS analysis program 1610, a capacity prediction program 1620, an IOPS performance evaluation table 1630, a segment IOPS history table 1640, and a pool capacity management table 1650 are stored in the memory 1500.
- the IOPS performance evaluation table 1630 is the same as the IOPS performance evaluation table 2570 described in the first embodiment or the second embodiment.
- the pool capacity management table 1650 is not an essential table because it can be calculated from the segment management table 1560.
- the segment IOPS analysis program 1610 is the same program as the segment IO evaluation program 2530, and the capacity prediction program 1620 Is the same program as the capacity prediction (1) program 2540, and the segment IOPS history table 1640 may be the same table as the capacity transition history table 2580.
- the segment IOPS analysis program 1610 is the same program as the segment IOPS prediction program 2610, and the capacity prediction program 1620 It is the same program as the capacity prediction (2) program 2620, and the segment IOPS history table 1640 may be the same table as the segment IOPS distribution history table 2640.
- the input method of the process for requesting input from the administrator is changed to the input method provided in the storage device, By holding the initial value, it may be unnecessary to input the initial value. Also, the notification of the calculated capacity expansion result may be changed to the output method provided in the storage apparatus.
- FIG. 35 shows a storage system related to Example 6 of the present invention.
- the management IF 1010 of the storage device 1 and the storage device 2 is connected to the management IF 3400 of the host computer 3000 via the data network 100. Further, the port 1020 of the storage apparatus 1 and the storage apparatus 2 is connected to the communication IF 3300 of the host computer 3000 via the data network 200.
- the storage apparatus 1 and the storage apparatus 2 connected to the host computer 3000 only provide the host computer with the storage area that each has, and the number of storage apparatuses is an arbitrary number of 0 or more. Good. If the host computer 3000 itself does not have a pool management function described later, a management computer for managing the pool and storage area may exist.
- FIG. 36 shows a concept of pool management according to the sixth embodiment.
- the host computer 3000 uses the storage area 1400 (LU1 in the figure) provided by the storage apparatus 1 and the storage area 1400 (LU2 in the figure) provided by the storage apparatus 2 as the volumes 3210 (DEV1 and DEV2 in the figure) of the host computer 3000. It has recognized. Further, the disk 3200 of the host computer 3000 may also be recognized as the volume 3220 (DEV3 in the figure).
- the host computer 3000 manages such a pool 3230 composed of the volume 3210 and the volume 3220, and provides the VVOL 3240 associated with the pool 3230 to the business program 3510 and the like. Further, the pool 3230 may include a free area of the memory 3500 in addition to the volume. The present invention can also be applied to such a pool 3230.
- FIG. 37 shows programs and information stored in the memory 3500 in the host computer 3000 according to the sixth embodiment.
- the configuration management program 3520 is the same as the configuration management program 2510 of the management computer 2000 in the first embodiment, and the configuration information acquisition program 3530 is the same as the configuration information acquisition program 2520 of the management computer 2000 in the first embodiment.
- segment migration program 3540 is the same as the segment migration program 1540 that the storage apparatus 1000 has in the first embodiment
- pool management program 3550 is the same as the pool management program that the storage apparatus 1000 has in the first embodiment.
- the segment IOPS analysis program 3560 is the same as the segment IOPS analysis program 1610 included in the storage apparatus 1000 described in the fifth embodiment, and the capacity prediction program 3570 is the same as the capacity prediction program 1620 included in the storage apparatus 1000 described in the fifth embodiment.
- the programs are the same and enable any of the prediction methods described in the first embodiment or the second embodiment.
- the resource management table 3610 is a table for managing volumes recognized by the host computer 3000.
- FIG. 38 shows an example of the resource management table 3610.
- the resource management table 3610 has information regarding volumes recognized by the host computer 3000. Specifically, the table 3610 includes the following information for each volume recognized by the host computer 3000: * VOL ID 3611 which is the ID of the volume, * Resource type 3612 indicating the type of volume, * Actual VOL ID 3613 indicating the location of the volume entity, * Hierarchy ID 3614 which is the ID of the hierarchy to which the volume belongs, * Capacity 3615 representing the storage capacity of the volume, Have The resource type 3612, the hierarchy ID 3614, and the capacity 3615 have the same meaning as in the first embodiment.
- the host recognition VOL ID: DEV1 can be determined as a volume that exists locally, that is, in the host computer 3000.
- the hierarchical ID 3612 can be expected to improve the prediction accuracy by setting the delay ID generated depending on whether or not it exists in the host computer. Specifically, for example, even if the physical storage device based on the volume is SAS, it may be divided into two or more tiers depending on whether the delay time is long or short.
- the segment management table 3620 is the same as the segment management table 1560 of the storage apparatus 1000 in the first embodiment
- the virtual volume management table 3630 is the same as the virtual volume management table 1570
- the migration policy table 3640 is the migration policy table.
- the IOPS performance evaluation table 3650 is the same as the IOPS performance evaluation table 1630.
- the segment IOPS history table 3660 is the same as the segment IOPS history table 1640 of the storage apparatus 1000 described in the fifth embodiment
- the pool capacity management table 3670 is the same as the pool capacity management table 1650.
- the processing flow of each program in the sixth embodiment is the same as the processing flow described in the fifth embodiment.
- the GUI indicating the result of the prediction performed by the capacity prediction program 3570 is different from the past.
- An example of the GUI is shown in FIG.
- the GUI 5800 has a table 5610 different from the GUI 5200 and the like so far.
- “local” may be displayed as the expansion destination 5611. This means that the host computer 3000 needs to be expanded.
- “arbitrary” may be displayed as the expansion destination 5611.
- a method of holding an assumed response time 2574 in consideration of communication delay for each expansion destination candidate in the IOPS performance evaluation table 3650, or a method of setting the hierarchical ID in consideration of communication delay Can be determined by using.
- a volume included in a storage device different from the storage device 1000 is taken into the storage device 1000, and the storage device 1000 can handle a volume of another storage device as its own volume (hereinafter referred to as an external connection function).
- the storage apparatus 1 provides an external connection function, whereby the volume of the storage apparatus 2 can be handled as the volume of the storage apparatus 1.
- the pool management technique and the capacity prediction technique method performed by the host computer according to the sixth embodiment may be applied to the storage apparatus 1 having the external connection function described above.
- the storage device 1 can provide a capacity prediction technique for the pool of the storage device 1 composed of a plurality of storage volumes.
- the volume recognized by the storage apparatus 1 may include not only another storage apparatus but also a disk 3200 held by the host computer and a cache memory area.
- the configuration of the storage apparatus 1000, the management computer 2000, and the host computer 3000 may not be the configuration shown in FIG.
- the input tool is not limited to the illustrated input tool, and other types of tools may be employed.
Abstract
Description
Block Address)等によって分割することにより得られた記憶領域である。ここで、「LBA」とは、ホスト計算機がストレージ装置との間でデータを読み書きする場合に、論理ボリューム上の位置を指定するために用いるアドレスである。 As a storage apparatus, a storage apparatus to which a thin provisioning technology is applied is known (for example, Patent Document 1). According to thin provisioning (sometimes referred to as dynamic provisioning), a virtual volume (hereinafter referred to as VVOL), which is a virtual logical volume, is provided to the host computer instead of a logical volume with a fixed storage capacity. The VVOL is a set of a plurality of virtual areas (virtual storage areas). When a write to the VVOL occurs from the host computer, a segment is allocated from the pool to the virtual area. For this reason, according to thin provisioning, the storage capacity provided to the host computer can be dynamically expanded. A pool is a storage area composed of a plurality of segments. A segment is a real area (substantial storage area). Specifically, for example, a logical volume (hereinafter referred to as PVOL) constituting a pool is represented by an LBA (Logical
This is a storage area obtained by dividing by block address). Here, “LBA” is an address used for designating a position on the logical volume when the host computer reads / writes data from / to the storage apparatus.
(A)VVOLに割り当てられているセグメントの識別情報。
(B)VVOLに割り当てられているセグメントのアクセス頻度を表す情報。
(C)VVOLに割り当てられているセグメントが属するメディアの識別情報。 The management computer acquires information (hereinafter referred to as pool status information) indicating the pool usage status at that time, for example, information including the following (A) to (C) from the storage device at regular intervals.
(A) Identification information of a segment assigned to the VVOL.
(B) Information indicating the access frequency of the segment assigned to the VVOL.
(C) Identification information of the medium to which the segment assigned to the VVOL belongs.
*論理ボリュームを識別するためのIDであるVOL ID1551、
*論理ボリュームの基になっている物理リソース1400の種別を示すリソース種別1552、
*論理ボリュームの記憶容量を表す容量1553、
*論理ボリュームが属する階層のIDである階層ID1554
を有する。ここで、階層とは、同じ性能及び運用コストの複数の論理ボリュームの集合であり、前述した「メディア」に相当する。例えば、SSDに基づく論理ボリュームの集合としての階層(メディア)は、高性能が見込まれるので、高位の階層を示すID「TIER0」が割り振られる。SAS-HDDに基づく論理ボリュームの集合としての階層(メディア)は、SSDに基づく階層より性能が低いと見込まれるので、SSDに基づく階層より低い階層を示すID「TIER1」が割り振られる。SATA-HDDに基づく論理ボリュームの集合としての階層(メディア)は、SAS-HDDに基づく階層より性能が低いと見込まれるので、SAS-HDDに基づく階層より低い階層を示すID「TIER2」が割り振られる。階層ID1554は、論理ボリューム作成時に物理リソース管理プログラム1520によって自動的に割り振られても良いし、ストレージ装置1000を管理する管理者が手動で割り振ってもよい。加えて、テーブル1550は、RAIDの冗長化の程度を示すRAIDレベル等を含んでも良く、その場合、リソース種別1552に加えてRAIDレベルに従う性能や運用コストを考慮した階層ID1554が振られていてもよい。以下、階層を「メディア」と言うことがある。なお、階層(メディア)は、3種類以上であっても良い。 The physical resource table 1550 has information regarding logical volumes based on physical resources. Specifically, the physical resource table 1550 includes the following information for each logical volume managed by the storage apparatus 1000:
* VOL ID1551, which is an ID for identifying a logical volume
*
*
*
Have Here, a tier is a set of a plurality of logical volumes having the same performance and operation cost, and corresponds to the above-mentioned “media”. For example, a hierarchy (media) as a set of logical volumes based on SSD is expected to have high performance, and therefore, an ID “TIER0” indicating a higher hierarchy is assigned. Since the tier (media) as a set of logical volumes based on the SAS-HDD is expected to have a lower performance than the tier based on the SSD, an ID “TIER1” indicating a tier lower than the tier based on the SSD is assigned. Since the tier (media) as a set of logical volumes based on the SATA-HDD is expected to have lower performance than the tier based on the SAS-HDD, an ID “TIER2” indicating a tier lower than the tier based on the SAS-HDD is allocated. . The
*セグメントを一意に識別するためのIDであるセグメントID1561、
*セグメントが存在する論理ボリューム(プールボリューム)を表すIDであるVOL ID1562、
*その論理ボリュームでの開始位置(セグメントの開始位置)を表すLBAである開始LBA1563、
*セグメントのサイズを示すセグメントサイズ1564、
*セグメントの割当先の仮想ボリューム(VVOL)のIDである割当先VVOL ID1565、
を有する。このテーブル1560によれば、例えば、セグメントID:0000は、論理ボリューム:DEV1において、LBA:0からセグメントサイズ:1000分(LBA:0からLBA:999まで)を占めており、仮想ボリューム:VVOL1に割り当てられている。また、割当先VVOL ID:NULLとなっているセグメントは、まだVVOLに割り当てられていないことを示す。以降の説明を分かり易くするため、全てのセグメントのサイズが100MB(Mega Bytes)であるとする。しかし、各セグメントのサイズは、100MBでなくても良いし、固定サイズでなく可変サイズであっても良いし、全てのセグメントのサイズが同じでなくても良い。 The segment management table 1560 has information regarding segments. Specifically, the segment management table 1560 includes the following information for each segment constituting the pool:
*
*
*
*
* Allocation
Have According to this table 1560, for example, the segment ID: 0000 occupies LBA: 0 to segment size: 1000 minutes (from LBA: 0 to LBA: 999) in the logical volume: DEV1, and the virtual volume: VVOL1 Assigned. In addition, the segment with the allocation destination VVOL ID: NULL indicates that the segment has not yet been allocated to the VVOL. In order to make the following description easy to understand, it is assumed that the size of all segments is 100 MB (Mega Bytes). However, the size of each segment may not be 100 MB, may be a variable size instead of a fixed size, and the size of all segments may not be the same.
*仮想領域を有するVVOLのIDであるVVOL ID1571、
*そのVVOLの記憶容量(ホスト計算機3000が認識する記憶容量)を表す容量1572、
*仮想領域のVVOLでの開始位置を示すLBAである開始LBA1573、
*仮想領域に割り当てられたセグメントのサイズを示すセグメントサイズ1574、
*仮想領域に割り当てられたセグメントのIDであるセグメントID1575、
*仮想領域に割り当てられているセグメントへのアクセス頻度であるIOPS(Input Output Per Second)1576、
を有する。このテーブル1570によれば、例えば、VVOL:VVOL1は、10TB(テラバイト)のボリュームとしてホスト計算機3000に認識される。VVOL:VVOL1のLBA:0から1000分の仮想領域に、セグメントID:0000のセグメントが割り当てられている。そのセグメントのアクセス頻度は、10000である。 The virtual volume management table 1570 has information related to the VVOL. Specifically, the virtual volume management table 1570 includes the following information for each virtual area:
*
*
*
*
*
* IOPS (Input Output Per Second) 1576, which is the frequency of access to the segment assigned to the virtual area
Have According to this table 1570, for example, VVOL: VVOL1 is recognized by the
(a)その仮想領域に対応したセグメントID1575が「NULL」である。
(b)テーブル1570にその仮想領域に対応したレコードが存在しない。 A virtual area to which no segment is assigned can be determined by the following method (a) or (b).
(A) The
(B) There is no record corresponding to the virtual area in the table 1570.
(S001)プール管理プログラム1503が、ライトコマンドに従うデータをキャッシュメモリに格納する。この時点で、プログラム1503は、ライトの完了応答をホスト計算機3000に返して良い。
(S002)プール管理プログラム1530が、アクセス先情報を基に、ライト先となるVVOL及び仮想領域を特定する。
(S003)プログラム1530が、ライト先仮想領域にセグメントが割り当てられているか否かを、テーブル1570を基に判断する。
(S004)S003の判断が否定的であれば、プログラム1530が、空きのセグメント(どの仮想領域にも割り当てられていないセグメント)を、テーブル1560を基に特定する。プログラム1530が、特定したセグメントをライト先仮想領域に割り当てる。具体的には、プログラム1530が、ライト先仮想領域に対応したレコード(テーブル1570におけるレコード)に、特定したセグメントのID、サイズ及びIOPSを登録する。
(S005)S003の判断が肯定的、又は、S004の後、プログラム1530が、ライト先仮想領域に割り当てられているセグメントに、キャッシュメモリ内のデータを書き込む。この時点で、プログラム1503は、ライトの完了応答をホスト計算機3000に返して良い。なお、この時点で、そのセグメントのIOPS1576が、セグメントマイグレーションプログラム1540によって更新される。 When the
(S001) The pool management program 1503 stores data according to the write command in the cache memory. At this point, the program 1503 may return a write completion response to the
(S002) The
(S003) The
(S004) If the determination in S003 is negative, the
(S005) The determination in S003 is affirmative, or after S004, the
(S011)プール管理プログラム1530が、アクセス先情報を基に、リード元となるVVOL及び仮想領域を特定する。
(S012)プログラム1530が、リード対象のデータがキャッシュメモリに残っているか否かを判断する。
(S013)S012の判断が肯定的の場合、プログラム1530は、キャッシュメモリ内のリード対象データを、ホスト計算機3000に送信する。この場合、リード元仮想領域に割り当てられているセグメントのIOPS1576は、更新されない。
(S014)S012の判断が否定的の場合、プログラム1530が、リード元仮想領域に割り当てられているセグメントを、テーブル1570を基に判断する。
(S015)プログラム1530が、特定されたセグメントからリード対象データをリードし、キャッシュメモリに格納する。この時点で、そのセグメントのIOPS1576が、セグメントマイグレーションプログラム1540によって更新される。
(S016)プログラム1530は、S015でキャッシュメモリに格納されたリード対象データを、そのリード対象データをホスト計算機3000に送信する。 When the
(S011) The
(S012) The
(S013) If the determination in S012 is affirmative, the
(S014) If the determination in S012 is negative, the
(S015) The
(S016) The
*ポリシを識別するためのID1581、
*マイグレーション実施契機1582、
*実行すべき処理を記載したポリシ1583、
を有する。契機1582およびポリシ1583は、ストレージ初期出荷時に設定されたものであってもよいし、あとで管理者によって手動で設定されたものであってもよい。例えば、図6に示したID:0とID:1のポリシに従った場合、セグメントマイグレーションプログラム1540は、IOPSが大きいセグメントから順に、セグメント内のデータを、階層:TIER0(SSDメディア)内のセグメントへマイグレーションする。SSDメディアに空きのセグメントが無くなった場合には、次の階層:TIER1(SASメディア)内の空きのセグメントにデータがマイグレーションされる。これにより、セグメントのアクセス頻度に応じたメディア利用が可能である。 The migration policy table 1580 includes the following information for each policy:
*
*
*
Have The
*メディアの種類を表す分類2561、
*メディアを構成する全てのセグメントの総記憶容量を表す容量2562、
を有する。分類2561として、“プール全体”があっても良く、その場合、容量2562として、プールを構成する全てのメディアの総記憶容量が記録される。図8のテーブル2560によれば、プールは、階層:TIER0が30TB、階層:TIER1が110TB、階層:TIER2が500TBであり、プールの容量は、それらの合計である640TBである。テーブル2560は、実質的に、ストレージ装置1000のプールの状態と常に一致している。なぜなら、構成管理プログラム2510が、構成情報取得プログラム2520を用いて、ストレージ装置1000が持つプールの状態を常に監視する等を行うからである。 The pool capacity management table 2560 has information on the pool capacity. Specifically, the table 2560 includes the following information for each medium:
*
*
Have As the
*メディア(階層)を識別するためのIDである階層ID2571、
*メディアの種別(メディアを構成する論理ボリュームの基になっている物理リソースの種別)を表すリソース種別2572、
*メディアに配置されることが望ましいデータを有するセグメントの望ましいIOPS範囲である許容IOPS範囲2573、
*メディアにおける全ての使用セグメント(仮想領域に割り当てられているセグメント)のIOPSが許容IOPS範囲2573におさまっている時に期待される性能(レスポンスタイム)である想定レスポンスタイム2574、
を有する。ここで言う「レスポンスタイム」は、ストレージ装置1000内でのレスポンスタイム、具体的には、セグメントにアクセスするためのコマンドがコントローラ1100から発行されてからそのセグメントに対するアクセスが完了するまでの時間長である。「想定レスポンスタイム」は、想定されるレスポンスタイム(期待されるレスポンスタイム)である。 The IOPS performance evaluation table 2570 has information indicating in which type of media the data in the IOPS segment belonging to which IOPS range should be placed. Specifically, the table 2570 includes the following information for each medium:
*
*
*
*
Have The “response time” mentioned here is a response time in the
*時点の日時を表す時刻2581、
*その時点でのTIER0(SSDメディア)の使用容量を表す情報2582、
*その時点でのTIER1(SASメディア)の使用容量を表す情報2583、
*その時点でのTIER2(SATAメディア)の使用容量を表す情報2584、
を有する。各時点での各メディアの使用容量は、セグメントIO評価プログラム2530により算出される。TIERが4つ以上ある場合は、その分、列の数が増える。 The capacity transition history table 2580 has information indicating the used capacity (total storage capacity of used segments) for each medium calculated based on the information acquired from the
*
*
*
*
Have The used capacity of each medium at each time point is calculated by the segment
その後、ステップ4020に示すように、ステップ4030およびステップ4040の処理が、例えば定期的に行われる。 First, in
Thereafter, as shown in
*各メディアの割合に関連したパラメータを表すパラメータ2651、
*パラメータ2651を実現するようにプールの容量を増設した場合に生じる増設コストを表す増設コスト2652、
*その時に期待される性能を表す想定性能2653、
を有する。パラメータ、増設コスト、具体的な算出方法および利用方法については、後述する容量予測(2)プログラム2620の処理の流れで説明する。 The expansion pattern holding table 2650 has information regarding capacity expansion patterns. Specifically, the table 2650 includes the following information for each additional pattern:
*
* An
*
Have The parameters, the extension cost, the specific calculation method and the usage method will be described in the process flow of the capacity prediction (2)
(想定性能2653)=
{(1ms(ミリ秒)×(図20でTIER0となったセグメントのIOPSの総和)+
10ms×(図20でTIER1となったセグメントのIOPSの総和)+
100ms×(図20でTIER2となったセグメントのIOPSの総和)}
÷(全セグメントの総IOPS)、
で算出することができる。この他、想定性能は、レスポンスタイムのパーセンタイル値であってもよい。また想定レスポンスタイムは、TIERが3種類以上の場合であっても、前述と同様の方法で算出することが出来る。 In the second embodiment, the
(Assumed performance 2653) =
{(1 ms (milliseconds) × (sum of IOPS of the segment that became
10 ms x (sum of IOPS of segments that became
100 ms × (total IOPS of the segment that became
÷ (total IOPS of all segments),
Can be calculated. In addition, the assumed performance may be a percentile value of response time. Further, the assumed response time can be calculated by the same method as described above even when there are three or more TIERs.
図22は、セグメントIOPS予測プログラム2610の処理のフローチャートを示す。 <Description of processing: Segment IOPS prediction>
FIG. 22 shows a flowchart of the processing of the segment
想定性能=
{(1ms×(図20でTIER0となったセグメントのIOPSの総和)+
10ms×(図20でTIER1となったセグメントのIOPSの総和)+
100ms×(図20でTIER2となったセグメントのIOPSの総和))}
÷(全セグメントの総IOPS)
で求めることができる。 In
Assumed performance =
{(1 ms × (sum of IOPS of the segment that became
10 ms x (sum of IOPS of segments that became
100 ms × (sum of IOPS of the segments that became
÷ (Total IOPS of all segments)
Can be obtained.
増設コストJ=
(TIER0の増設コスト)×(TIER0の増設量)+
(TIER1の増設コスト)×(TIER1の増設量)+
(TIER2の増設コスト)×(TIER2の増設量)
である。ここで、例えば、TIER0の増設量は、下記の式、
TIER0の増設量=
((図21の領域9204の面積)×100MB)-
(プール容量管理テーブル2560のTIER0の容量)
で計算することができる。TIER1及びTIER2の増設量も同様に計算することができる。なお、増設量が正の値か否かのみしか考えない場合、増設量が負の値であるTIERについては、増設コストJの計算式から除外されて良い。 Here, the expansion cost J can be calculated by using the expansion cost C of each medium set in
Expansion cost J =
(Expansion cost of TIER0) x (Expansion amount of TIER0) +
(Expansion cost of TIER1) x (Expansion amount of TIER1) +
(Expansion cost of TIER2) x (Expansion amount of TIER2)
It is. Here, for example, the expansion amount of
TIER0 expansion amount =
((Area of
(TIER0 capacity in the pool capacity management table 2560)
Can be calculated with The additional amount of TIER1 and TIER2 can be calculated similarly. When only considering whether the expansion amount is a positive value or not, TIER having a negative expansion amount may be excluded from the calculation formula of the expansion cost J.


*ボリュームのIDであるVOL ID3611、
*ボリュームの種別を表すリソース種別3612、
*ボリュームの実体が存在する場所を示す実態VOL ID3613、
*ボリュームが属する階層のIDである階層ID3614、
*ボリュームの記憶容量を表す容量3615、
を有する。リソース種別3612、階層ID3614、容量3615は、実施例1等と同じ意味である。例えば、ホストが認識するボリュームとして、ホスト認識VOL ID:DEV1は、ローカルつまりホスト計算機3000内に存在するボリュームであると判別できる。また、ホスト認識VOL ID:DEV2は、実体が、ストレージ装置1内に存在するLU1であると判別することができる。また、階層ID3612は、リソース種別3612に加え、ホスト計算機内に存在するか否かで発生する遅延時間等を含めて設定することで、より予測精度を向上させることが出来ると期待できる。具体的には、例えば、ボリュームに基づく物理記憶デバイスがSASであっても、遅延時間が長いか短いかで、2つ以上の階層に分かれても良い。 The resource management table 3610 has information regarding volumes recognized by the
*
*
*
*
*
Have The
Claims (15)
- ホスト装置に接続されたストレージ装置の管理システムであって、
前記ストレージ装置が、
複数の仮想領域で構成された仮想的な論理ボリュームである仮想ボリュームと、
性能が異なる複数の実領域群で構成されたプールと、
前記ホスト装置からのアクセスコマンドに応答して、そのアクセスコマンドから特定された仮想領域に割り当てられた実領域にアクセスするコントローラと
を有し、
前記コントローラは、どの仮想領域にどの実領域が割り当てられているかと仮想領域に関するアクセス負荷とを表す情報であるプール状況情報を管理し、
前記管理システムが、
記憶資源と、
前記記憶資源に接続されたプロセッサと
を有し、
前記記憶資源が、各実領域群の現在の記憶容量を表す情報である容量管理情報を記憶し、
前記プロセッサが、
(A)現在から過去における複数の時点での前記プール状況情報と、1以上のアクセス負荷閾値とに基づいて、将来の時点での実領域群毎の使用容量を予測し、
(B)予測された使用容量と前記容量管理情報が表す現在の記憶容量との差分である増設/減設量を実領域群毎に計算し、
(C)前記(B)の計算の結果に基づく処理を実行する、
管理システム。 A storage device management system connected to a host device,
The storage device is
A virtual volume which is a virtual logical volume composed of a plurality of virtual areas;
A pool composed of multiple real area groups with different performance,
In response to an access command from the host device, a controller that accesses a real area assigned to a virtual area identified from the access command,
The controller manages pool status information which is information indicating which real area is allocated to which virtual area and access load related to the virtual area,
The management system is
Storage resources,
A processor connected to the storage resource,
The storage resource stores capacity management information that is information indicating the current storage capacity of each real area group;
The processor is
(A) Based on the pool status information at a plurality of times from the present to the past and one or more access load thresholds, predict the used capacity for each real region group at a future time,
(B) calculating an expansion / reduction amount that is a difference between the predicted used capacity and the current storage capacity represented by the capacity management information for each real area group;
(C) The process based on the calculation result of (B) is executed.
Management system. - 請求項1記載の管理システムであって、
前記1以上のアクセス負荷閾値の各々を上限又は下限とした複数のアクセス負荷範囲に前記複数の実領域群が対応し、
前記プロセッサが、前記(A)において、
(a01)前記複数の時点での前記プール状況情報を基に、将来の時点での、アクセス負荷と実領域数との分布を予測し、
(a02)前記複数のアクセス負荷範囲を基に想定される、前記プールに関する第1種の値が、所定の条件を満足するような、1以上のアクセス負荷閾値の1以上の組合せを、特定し、
(a03)前記1以上の組合せのうち、前記プールに関する第2種の値が最も優れた値となる組合せを特定し、
(a04)前記(a03)で特定された組合せから一義的に定まる前記複数のアクセス負荷範囲と、前記(a01)で特定された分布とを基に、前記将来の時点での実領域群毎の使用容量を予測する、
管理システム。 The management system according to claim 1,
The plurality of real region groups correspond to a plurality of access load ranges with each of the one or more access load thresholds being an upper limit or a lower limit,
In the processor (A),
(A01) Predicting the distribution of the access load and the number of real areas at a future time point based on the pool status information at the plurality of time points,
(A02) Specify one or more combinations of one or more access load thresholds that are assumed based on the plurality of access load ranges and that the first type value related to the pool satisfies a predetermined condition. ,
(A03) Among the one or more combinations, specify a combination in which the second type value related to the pool is the most excellent value,
(A04) Based on the plurality of access load ranges uniquely determined from the combination specified in (a03) and the distribution specified in (a01), for each real region group at the future time point Predicting used capacity,
Management system. - 請求項2記載の管理システムであって、
前記第1種の値は、前記プールの性能と、前記プールに記憶容量を増設する際のコストである増設コストとのうちの一方であり、
前記第2種の値は、前記プールの性能と前記プールの増設コストとのうちの他方である、
管理システム。 The management system according to claim 2,
The value of the first type is one of the performance of the pool and the expansion cost that is the cost when adding storage capacity to the pool,
The second type value is the other of the performance of the pool and the cost of adding the pool.
Management system. - 請求項3記載の管理システムであって、
前記プロセッサは、前記(C)において、下記の(c01)又は(c02)を表示する、
(c01)前記(B)で算出された、実領域群毎の増設/減設量、
(c02)前記プールの性能、及び/又は、前記プールの増設コスト、
管理システム。 A management system according to claim 3, wherein
The processor displays the following (c01) or (c02) in (C),
(C01) Expansion / removal amount for each real area group calculated in (B) above,
(C02) The performance of the pool and / or the expansion cost of the pool,
Management system. - 請求項4記載の管理システムであって、
前記(C)での表示では、実領域群毎の増設/減設量の組合せが、前記プールの性能又は前記プールの増設コストの順で並んでいる、
管理システム。 The management system according to claim 4,
In the display in (C), combinations of expansion / reduction amounts for each real area group are arranged in the order of the performance of the pool or the expansion cost of the pool.
Management system. - 請求項3記載の管理システムであって、
前記プールの想定される性能は、前記複数の実領域群に対応した複数のアクセス期待時間と、前記分布とに基づいて算出され、
前記アクセス期待時間は、実領域に対するアクセスにかかると期待される時間長である、
管理システム。 A management system according to claim 3, wherein
The assumed performance of the pool is calculated based on a plurality of expected access times corresponding to the plurality of real region groups and the distribution,
The expected access time is a time length expected to take access to a real area.
Management system. - 請求項3記載の管理システムであって、
前記コストは、費用又は消費電力である、
管理システム。 A management system according to claim 3, wherein
The cost is expense or power consumption.
Management system. - 請求項1記載の管理システムであって、
前記プロセッサが、前記(A)において、
(a11)各時点で、前記プール状況情報と1以上のアクセス負荷閾値とに基づいて、仮想領域に割り当てられている実領域の総記憶容量である使用容量を各実領域群について算出し、時点を表す情報と実領域群毎の使用容量を表す情報とを前記記憶資源に書込み、それにより、前記複数の時点での実領域群毎の使用容量を表す履歴情報が前記記憶資源に蓄積され、
(a12)前記履歴情報を基に、将来の時点での実領域群毎の使用容量を予測する、
管理システム。 The management system according to claim 1,
In the processor (A),
(A11) At each time point, based on the pool status information and one or more access load threshold values, a used capacity that is a total storage capacity of the real area allocated to the virtual area is calculated for each real area group. And information indicating the used capacity for each real area group are written to the storage resource, whereby history information indicating the used capacity for each real area group at the plurality of time points is accumulated in the storage resource,
(A12) Based on the history information, a used capacity for each real region group at a future time point is predicted.
Management system. - 請求項8記載の管理システムであって、
各実領域群にアクセス負荷範囲が対応しており、
前記コントローラは、第1の実領域群における第1の実領域内のデータを、前記第1の実領域のアクセス負荷が属するアクセス負荷範囲に対応した第2の実領域群における第2の実領域にマイグレーションし、前記第1の実領域が割り当てられた仮想領域に、前記第1の実領域に代えて前記第2の実領域を割り当て、
前記1以上のアクセス負荷閾値は、前記複数の実領域群に対応した複数のアクセス負荷範囲のうちの少なくとも1つのアクセス負荷範囲の上限及び/又は下限である、
管理システム。 The management system according to claim 8, wherein
The access load range corresponds to each real area group,
The controller converts the data in the first real area in the first real area group to the second real area in the second real area group corresponding to the access load range to which the access load of the first real area belongs. And assigning the second real area instead of the first real area to the virtual area to which the first real area is assigned,
The one or more access load thresholds are an upper limit and / or a lower limit of at least one access load range among a plurality of access load ranges corresponding to the plurality of real region groups.
Management system. - 請求項1記載の管理システムであって、
前記プロセッサは、所定のイベントが発生したときにだけ、前記将来の時点での実領域群毎の使用容量の予測を行う、
管理システム。 The management system according to claim 1,
The processor predicts the used capacity for each real region group at the future time point only when a predetermined event occurs.
Management system. - 請求項10記載の管理システムであって、
前記所定のイベントは、前記プールの使用容量が所定の閾値を超えたことである、
管理システム。 The management system according to claim 10, wherein
The predetermined event is that the used capacity of the pool exceeds a predetermined threshold.
Management system. - 請求項10記載の管理システムであって、
前記所定のイベントは、前記プールの性能が目標性能を下回ったことである、
管理システム。 The management system according to claim 10, wherein
The predetermined event is that the performance of the pool has fallen below a target performance.
Management system. - 請求項1記載の管理システムであって、
前記プロセッサが、前記プールに対して記憶容量の増設及び/又は減設が実施された後、
(D)前記プール状況情報を基に算出される、前記プールの性能が、目標性能を下回ったか否かを判断し、
(E)前記(D)の判断の結果が肯定的の場合、前記プールの性能と前記目標性能との差分の大きさに基づいて、前記プールの性能が前記目標性能を下回った原因を表す情報を表示する、
管理システム。 The management system according to claim 1,
After the processor has expanded and / or reduced storage capacity for the pool,
(D) It is determined whether or not the performance of the pool calculated based on the pool status information is lower than the target performance,
(E) When the result of the determination in (D) is affirmative, information indicating the cause that the performance of the pool has fallen below the target performance based on the difference between the performance of the pool and the target performance Display,
Management system. - 請求項1記載の管理システムであって、
前記プロセッサが、前記(C)において、以下の(c11)又は(c12)を行う、
(c11)或る実領域群について増設量が算出されている場合、自動で、総記憶容量が前記増設量以上である、前記或る実領域群と同じ性能の1以上の実領域を増設する、
(c12)或る実領域群について減設量が算出されている場合、自動で、前記或る実領域群から、総記憶容量が前記減設量以下である1以上の実領域を減設する、
管理システム。 The management system according to claim 1,
The processor performs the following (c11) or (c12) in (C).
(C11) When the expansion amount is calculated for a certain real region group, one or more real regions having the same performance as the certain real region group whose total storage capacity is equal to or larger than the expansion amount are automatically added. ,
(C12) When a reduction amount is calculated for a certain real region group, one or more real regions whose total storage capacity is equal to or less than the reduction amount are automatically reduced from the certain real region group. ,
Management system. - ホスト装置に接続されたストレージ装置の管理方法であって、
前記ストレージ装置が、
複数の仮想領域で構成された仮想的な論理ボリュームである仮想ボリュームと、
性能が異なる複数の実領域群で構成されたプールと、
前記ホスト装置からのアクセスコマンドに応答して、そのアクセスコマンドから特定された仮想領域に割り当てられた実領域にアクセスするコントローラと
を有し、
前記コントローラは、どの仮想領域にどの実領域が割り当てられているかと仮想領域に関するアクセス負荷とを表す情報であるプール状況情報を管理し、
前記管理方法が、
(A)現在から過去における複数の時点での前記プール状況情報と、1以上のアクセス負荷閾値とに基づいて、将来の時点での実領域群毎の使用容量を予測し、
(B)予測された使用容量と現在の記憶容量との差分である増設/減設量を実領域群毎に計算し、
(C)前記(B)の計算の結果に基づく処理を実行する、
管理方法。 A method of managing a storage device connected to a host device,
The storage device is
A virtual volume which is a virtual logical volume composed of a plurality of virtual areas;
A pool composed of multiple real area groups with different performance,
In response to an access command from the host device, a controller that accesses a real area assigned to a virtual area identified from the access command,
The controller manages pool status information which is information indicating which real area is allocated to which virtual area and access load related to the virtual area,
The management method is
(A) Based on the pool status information at a plurality of times from the present to the past and one or more access load thresholds, predict the used capacity for each real region group at a future time,
(B) Calculate the amount of expansion / reduction that is the difference between the predicted used capacity and the current storage capacity for each real area group,
(C) The process based on the calculation result of (B) is executed.
Management method.
Priority Applications (7)
| Application Number | Priority Date | Filing Date | Title |
|---|---|---|---|
| JP2011551581A JP5236086B2 (en) | 2010-01-28 | 2010-01-28 | Management system to calculate the storage capacity to be added / removed |
| PCT/JP2010/000516 WO2011092739A1 (en) | 2010-01-28 | 2010-01-28 | Management system for calculating storage capacity to be increased/decreased |
| IN3826DEN2012 IN2012DN03826A (en) | 2010-01-28 | 2010-01-28 | |
| EP10824273.6A EP2378427B1 (en) | 2010-01-28 | 2010-01-28 | Management system for calculating storage capacity to be increased/decreased |
| CN201080054277.2A CN102640120B (en) | 2010-01-28 | 2010-01-28 | Management system for calculating storage capacity to be increased/decreased |
| US12/742,733 US8918585B2 (en) | 2010-01-28 | 2010-01-28 | Management system calculating storage capacity to be installed/removed |
| US14/539,292 US9182926B2 (en) | 2010-01-28 | 2014-11-12 | Management system calculating storage capacity to be installed/removed |
Applications Claiming Priority (1)
| Application Number | Priority Date | Filing Date | Title |
|---|---|---|---|
| PCT/JP2010/000516 WO2011092739A1 (en) | 2010-01-28 | 2010-01-28 | Management system for calculating storage capacity to be increased/decreased |
Related Child Applications (2)
| Application Number | Title | Priority Date | Filing Date |
|---|---|---|---|
| US12/742,733 A-371-Of-International US8918585B2 (en) | 2010-01-28 | 2010-01-28 | Management system calculating storage capacity to be installed/removed |
| US14/539,292 Continuation US9182926B2 (en) | 2010-01-28 | 2014-11-12 | Management system calculating storage capacity to be installed/removed |
Publications (1)
| Publication Number | Publication Date |
|---|---|
| WO2011092739A1 true WO2011092739A1 (en) | 2011-08-04 |
Family
ID=44318759
Family Applications (1)
| Application Number | Title | Priority Date | Filing Date |
|---|---|---|---|
| PCT/JP2010/000516 WO2011092739A1 (en) | 2010-01-28 | 2010-01-28 | Management system for calculating storage capacity to be increased/decreased |
Country Status (6)
| Country | Link |
|---|---|
| US (2) | US8918585B2 (en) |
| EP (1) | EP2378427B1 (en) |
| JP (1) | JP5236086B2 (en) |
| CN (1) | CN102640120B (en) |
| IN (1) | IN2012DN03826A (en) |
| WO (1) | WO2011092739A1 (en) |
Cited By (11)
| Publication number | Priority date | Publication date | Assignee | Title |
|---|---|---|---|---|
| WO2013042174A1 (en) * | 2011-09-22 | 2013-03-28 | Hitachi, Ltd. | Computer system and storage management method |
| CN103091707A (en) * | 2012-12-31 | 2013-05-08 | 中国石油集团川庆钻探工程有限公司地球物理勘探公司 | Device and method of seismic data hierarchical storage |
| WO2014073045A1 (en) * | 2012-11-07 | 2014-05-15 | 株式会社日立製作所 | Computer system, storage management computer, and storage management method |
| US9244616B2 (en) | 2011-09-13 | 2016-01-26 | Hitachi, Ltd. | Management system and management method of storage system that performs control based on required performance assigned to virtual volume |
| US20160142335A1 (en) | 2014-11-19 | 2016-05-19 | Fujitsu Limited | Storage management device, storage management method, and computer-readable recording medium |
| JP2016181197A (en) * | 2015-03-25 | 2016-10-13 | 日本電気株式会社 | Information processing device, method, and program |
| WO2017046902A1 (en) * | 2015-09-16 | 2017-03-23 | 株式会社日立製作所 | Management system, management computer, and method for managing storage apparatus |
| JP2017529575A (en) * | 2015-08-25 | 2017-10-05 | ベイジン バイドゥ ネットコム サイエンス アンド テクノロジー カンパニー リミテッド | Disk capacity prediction method, apparatus, device, and non-executable computer storage medium |
| US10037162B2 (en) | 2015-06-15 | 2018-07-31 | Fujitsu Limited | Storage management device, storage management method, and computer-readable recording medium |
| JPWO2017109931A1 (en) * | 2015-12-25 | 2018-08-16 | 株式会社日立製作所 | Computer system |
| US10324765B2 (en) | 2017-01-20 | 2019-06-18 | Microsoft Technology Licensing, Llc | Predicting capacity of shared virtual machine resources |
Families Citing this family (42)
| Publication number | Priority date | Publication date | Assignee | Title |
|---|---|---|---|---|
| JP5309259B2 (en) * | 2010-03-25 | 2013-10-09 | 株式会社日立製作所 | Storage apparatus and control method thereof |
| US8677080B2 (en) * | 2010-04-27 | 2014-03-18 | Hitachi, Ltd. | Method of controlling total capacity of virtual volumes associated with pool and storage apparatus |
| WO2012004827A1 (en) * | 2010-07-05 | 2012-01-12 | Hitachi, Ltd. | Storage subsystem and its control method |
| US20120131196A1 (en) * | 2010-11-18 | 2012-05-24 | Hitachi, Ltd. | Computer system management apparatus and management method |
| US8782340B2 (en) | 2010-12-06 | 2014-07-15 | Xiotech Corporation | Hot sheet upgrade facility |
| US9870296B1 (en) * | 2011-06-17 | 2018-01-16 | Mark A. Parenti | Evaluating system performance |
| US20120331410A1 (en) * | 2011-06-27 | 2012-12-27 | Fujitsu Technology Solutions Intellectual Property Gmbh | Methods and systems for designing it services |
| US10334021B2 (en) * | 2011-08-01 | 2019-06-25 | Telefonaktiebolaget Lm Ericsson (Publ) | Retained data handling at differentiated response times |
| US8661431B2 (en) | 2012-01-03 | 2014-02-25 | International Business Machines Corporation | Accurately estimating install time |
| WO2013103005A1 (en) * | 2012-01-05 | 2013-07-11 | 株式会社日立製作所 | Management device and management method for computer system |
| JP5849794B2 (en) * | 2012-03-16 | 2016-02-03 | 富士通株式会社 | Storage control device, storage control method, and storage control program |
| US8904144B1 (en) * | 2012-05-24 | 2014-12-02 | Netapp, Inc. | Methods and systems for determining at risk index for storage capacity |
| WO2014002162A1 (en) * | 2012-06-25 | 2014-01-03 | 富士通株式会社 | Storage control device, information processing device, storage control program, and storage control method |
| CN102841931A (en) * | 2012-08-03 | 2012-12-26 | 中兴通讯股份有限公司 | Storage method and storage device of distributive-type file system |
| CN103678139B (en) * | 2012-08-31 | 2017-09-29 | 国际商业机器公司 | The method and apparatus for carrying out thin supply |
| CN102915275A (en) * | 2012-09-13 | 2013-02-06 | 曙光信息产业(北京)有限公司 | Thin provisioning system |
| US9608933B2 (en) * | 2013-01-24 | 2017-03-28 | Hitachi, Ltd. | Method and system for managing cloud computing environment |
| DE112013006504B4 (en) | 2013-01-25 | 2022-06-15 | Hitachi, Ltd. | Storage system and data management method |
| US9626110B2 (en) * | 2013-02-22 | 2017-04-18 | Hitachi, Ltd. | Method for selecting a page for migration based on access path information and response performance information |
| JP6193373B2 (en) * | 2013-03-18 | 2017-09-06 | 株式会社日立製作所 | Hybrid storage system and storage control method |
| WO2015035343A1 (en) * | 2013-09-06 | 2015-03-12 | Lyve Minds, Inc. | Electronic device data distribution |
| CN104750538B (en) * | 2013-12-27 | 2020-03-03 | 伊姆西Ip控股有限责任公司 | Method and system for providing virtual storage pool for target application |
| US9584599B2 (en) * | 2014-01-14 | 2017-02-28 | Netapp, Inc. | Method and system for presenting storage in a cloud computing environment |
| US9740436B2 (en) * | 2014-11-14 | 2017-08-22 | International Business Machines Corporation | Elastic file system management in storage cloud environments |
| EP3021251A1 (en) * | 2014-11-14 | 2016-05-18 | Hewlett-Packard Development Company, L.P. | Dynamically adjusting a model for a security operations center |
| JP6554990B2 (en) * | 2015-08-11 | 2019-08-07 | 富士通株式会社 | Storage control device and storage control program |
| CN108701002B (en) * | 2016-02-29 | 2021-10-29 | 株式会社日立制作所 | Virtual storage system |
| US10552076B2 (en) | 2016-12-13 | 2020-02-04 | International Business Machines Corporation | Identification of volumes for thin provisioning |
| CN107122131B (en) * | 2017-04-18 | 2020-08-14 | 杭州宏杉科技股份有限公司 | Thin provisioning method and device |
| JP6684850B2 (en) * | 2018-05-16 | 2020-04-22 | 株式会社日立製作所 | Distributed ledger system, distributed ledger subsystem, and distributed ledger node |
| KR101932523B1 (en) | 2018-07-16 | 2018-12-26 | 서강대학교 산학협력단 | Method for dynamically increasing and decreasing the slots of virtual gpu memory allocated to a virtual machine and computing device implementing the same |
| US11249852B2 (en) | 2018-07-31 | 2022-02-15 | Portwonx, Inc. | Efficient transfer of copy-on-write snapshots |
| US11354060B2 (en) | 2018-09-11 | 2022-06-07 | Portworx, Inc. | Application snapshot for highly available and distributed volumes |
| JP6957431B2 (en) * | 2018-09-27 | 2021-11-02 | 株式会社日立製作所 | VM / container and volume allocation determination method and storage system in HCI environment |
| US11494128B1 (en) | 2020-01-28 | 2022-11-08 | Pure Storage, Inc. | Access control of resources in a cloud-native storage system |
| US11392304B2 (en) | 2020-05-29 | 2022-07-19 | Seagate Technology Llc | Data storage device with adaptive object storage capabilities |
| US11531467B1 (en) | 2021-01-29 | 2022-12-20 | Pure Storage, Inc. | Controlling public access of resources in a secure distributed storage system |
| US11733897B1 (en) | 2021-02-25 | 2023-08-22 | Pure Storage, Inc. | Dynamic volume storage adjustment |
| US11520516B1 (en) | 2021-02-25 | 2022-12-06 | Pure Storage, Inc. | Optimizing performance for synchronous workloads |
| US11726684B1 (en) | 2021-02-26 | 2023-08-15 | Pure Storage, Inc. | Cluster rebalance using user defined rules |
| US20230031304A1 (en) * | 2021-07-22 | 2023-02-02 | Vmware, Inc. | Optimized memory tiering |
| JP2023034491A (en) * | 2021-08-31 | 2023-03-13 | 株式会社日立製作所 | Storage system and QoS management method in storage system |
Citations (8)
| Publication number | Priority date | Publication date | Assignee | Title |
|---|---|---|---|---|
| JP2002312699A (en) * | 2001-04-16 | 2002-10-25 | Hitachi Ltd | Service method for rental storage and rental storage system |
| JP2003015915A (en) | 2001-07-05 | 2003-01-17 | Hitachi Ltd | Automatic expansion method for storage device capacity |
| JP2003050724A (en) * | 2001-08-07 | 2003-02-21 | Hitachi Ltd | Method for operating storage and storage used for the same |
| US20050015547A1 (en) | 2003-07-14 | 2005-01-20 | Fujitsu Limited | Distributed storage system and control unit for distributed storage system |
| JP2007066259A (en) | 2005-09-02 | 2007-03-15 | Hitachi Ltd | Computer system, storage system and volume capacity expansion method |
| JP2007102455A (en) * | 2005-10-04 | 2007-04-19 | Hitachi Ltd | Storage system and configuration change method |
| JP2008084253A (en) * | 2006-09-29 | 2008-04-10 | Hitachi Ltd | Volume selection method and information processing system |
| JP2008097502A (en) | 2006-10-16 | 2008-04-24 | Hitachi Ltd | Capacity monitoring method and computer system |
Family Cites Families (14)
| Publication number | Priority date | Publication date | Assignee | Title |
|---|---|---|---|---|
| JP2003303054A (en) * | 2002-04-08 | 2003-10-24 | Hitachi Ltd | Computer system, storage device and method for monitoring operation of same |
| US7159072B2 (en) * | 2005-03-24 | 2007-01-02 | Hitachi, Ltd. | Method and apparatus for monitoring the quantity of differential data in a storage system |
| WO2007073610A1 (en) * | 2005-12-24 | 2007-07-05 | Intel Corporation | Method and apparatus for efficiently arranging portable executable (pe) images |
| JP4921054B2 (en) * | 2006-07-07 | 2012-04-18 | 株式会社日立製作所 | Load balancing control system and load balancing control method |
| GB0614515D0 (en) * | 2006-07-21 | 2006-08-30 | Ibm | An apparatus for managing power-consumption |
| US9052826B2 (en) * | 2006-07-28 | 2015-06-09 | Condusiv Technologies Corporation | Selecting storage locations for storing data based on storage location attributes and data usage statistics |
| US8935302B2 (en) * | 2006-12-06 | 2015-01-13 | Intelligent Intellectual Property Holdings 2 Llc | Apparatus, system, and method for data block usage information synchronization for a non-volatile storage volume |
| US20090100214A1 (en) * | 2007-10-12 | 2009-04-16 | Bei-Chuan Chen | Management Platform For Extending Lifespan Of Memory In Storage Devices |
| US8423739B2 (en) * | 2008-02-06 | 2013-04-16 | International Business Machines Corporation | Apparatus, system, and method for relocating logical array hot spots |
| US8117235B1 (en) * | 2008-09-29 | 2012-02-14 | Emc Corporation | Techniques for binding resources for use by a consumer tier |
| JP2010122814A (en) * | 2008-11-18 | 2010-06-03 | Hitachi Ltd | Storage system and operation method thereof |
| JP5228988B2 (en) * | 2009-02-23 | 2013-07-03 | 富士通株式会社 | Allocation control program and allocation control device |
| US8429151B2 (en) * | 2010-11-22 | 2013-04-23 | Ianywhere Solutions, Inc. | Highly adaptable query optimizer search space generation process |
| WO2012164718A1 (en) * | 2011-06-02 | 2012-12-06 | 株式会社日立製作所 | Storage management system, computer system, and storage management method |
-
2010
- 2010-01-28 EP EP10824273.6A patent/EP2378427B1/en active Active
- 2010-01-28 WO PCT/JP2010/000516 patent/WO2011092739A1/en active Application Filing
- 2010-01-28 IN IN3826DEN2012 patent/IN2012DN03826A/en unknown
- 2010-01-28 CN CN201080054277.2A patent/CN102640120B/en active Active
- 2010-01-28 US US12/742,733 patent/US8918585B2/en active Active
- 2010-01-28 JP JP2011551581A patent/JP5236086B2/en active Active
-
2014
- 2014-11-12 US US14/539,292 patent/US9182926B2/en active Active
Patent Citations (8)
| Publication number | Priority date | Publication date | Assignee | Title |
|---|---|---|---|---|
| JP2002312699A (en) * | 2001-04-16 | 2002-10-25 | Hitachi Ltd | Service method for rental storage and rental storage system |
| JP2003015915A (en) | 2001-07-05 | 2003-01-17 | Hitachi Ltd | Automatic expansion method for storage device capacity |
| JP2003050724A (en) * | 2001-08-07 | 2003-02-21 | Hitachi Ltd | Method for operating storage and storage used for the same |
| US20050015547A1 (en) | 2003-07-14 | 2005-01-20 | Fujitsu Limited | Distributed storage system and control unit for distributed storage system |
| JP2007066259A (en) | 2005-09-02 | 2007-03-15 | Hitachi Ltd | Computer system, storage system and volume capacity expansion method |
| JP2007102455A (en) * | 2005-10-04 | 2007-04-19 | Hitachi Ltd | Storage system and configuration change method |
| JP2008084253A (en) * | 2006-09-29 | 2008-04-10 | Hitachi Ltd | Volume selection method and information processing system |
| JP2008097502A (en) | 2006-10-16 | 2008-04-24 | Hitachi Ltd | Capacity monitoring method and computer system |
Cited By (16)
| Publication number | Priority date | Publication date | Assignee | Title |
|---|---|---|---|---|
| US9244616B2 (en) | 2011-09-13 | 2016-01-26 | Hitachi, Ltd. | Management system and management method of storage system that performs control based on required performance assigned to virtual volume |
| US8904121B2 (en) | 2011-09-22 | 2014-12-02 | Hitachi, Ltd. | Computer system and storage management method |
| WO2013042174A1 (en) * | 2011-09-22 | 2013-03-28 | Hitachi, Ltd. | Computer system and storage management method |
| US9760294B2 (en) | 2012-11-07 | 2017-09-12 | Hitachi, Ltd. | Computer system, storage management computer, and storage management method |
| WO2014073045A1 (en) * | 2012-11-07 | 2014-05-15 | 株式会社日立製作所 | Computer system, storage management computer, and storage management method |
| JPWO2014073045A1 (en) * | 2012-11-07 | 2016-09-08 | 株式会社日立製作所 | Computer system, storage management computer, and storage management method |
| CN103091707A (en) * | 2012-12-31 | 2013-05-08 | 中国石油集团川庆钻探工程有限公司地球物理勘探公司 | Device and method of seismic data hierarchical storage |
| CN103091707B (en) * | 2012-12-31 | 2016-06-22 | 中国石油集团川庆钻探工程有限公司地球物理勘探公司 | Geological data hierachical storing device and method |
| US20160142335A1 (en) | 2014-11-19 | 2016-05-19 | Fujitsu Limited | Storage management device, storage management method, and computer-readable recording medium |
| US10277676B2 (en) | 2014-11-19 | 2019-04-30 | Fujitsu Limited | Storage management device, storage management method, and computer-readable recording medium |
| JP2016181197A (en) * | 2015-03-25 | 2016-10-13 | 日本電気株式会社 | Information processing device, method, and program |
| US10037162B2 (en) | 2015-06-15 | 2018-07-31 | Fujitsu Limited | Storage management device, storage management method, and computer-readable recording medium |
| JP2017529575A (en) * | 2015-08-25 | 2017-10-05 | ベイジン バイドゥ ネットコム サイエンス アンド テクノロジー カンパニー リミテッド | Disk capacity prediction method, apparatus, device, and non-executable computer storage medium |
| WO2017046902A1 (en) * | 2015-09-16 | 2017-03-23 | 株式会社日立製作所 | Management system, management computer, and method for managing storage apparatus |
| JPWO2017109931A1 (en) * | 2015-12-25 | 2018-08-16 | 株式会社日立製作所 | Computer system |
| US10324765B2 (en) | 2017-01-20 | 2019-06-18 | Microsoft Technology Licensing, Llc | Predicting capacity of shared virtual machine resources |
Also Published As
| Publication number | Publication date |
|---|---|
| US20150074349A1 (en) | 2015-03-12 |
| US9182926B2 (en) | 2015-11-10 |
| EP2378427B1 (en) | 2018-04-11 |
| US8918585B2 (en) | 2014-12-23 |
| US20110252214A1 (en) | 2011-10-13 |
| CN102640120A (en) | 2012-08-15 |
| JPWO2011092739A1 (en) | 2013-05-23 |
| IN2012DN03826A (en) | 2015-08-28 |
| EP2378427A4 (en) | 2013-07-10 |
| EP2378427A1 (en) | 2011-10-19 |
| CN102640120B (en) | 2014-12-10 |
| JP5236086B2 (en) | 2013-07-17 |
Similar Documents
| Publication | Publication Date | Title |
|---|---|---|
| JP5236086B2 (en) | Management system to calculate the storage capacity to be added / removed | |
| US10078569B1 (en) | Self adaptive workload classification and forecasting in multi-tiered storage system using arima time series modeling | |
| US9477407B1 (en) | Intelligent migration of a virtual storage unit to another data storage system | |
| US10254970B1 (en) | System, method and computer readable medium for obtaining consistent read performance for a plurality of flash drives or raid groups using workload and capacity limits | |
| US8407417B2 (en) | Storage system providing virtual volumes | |
| US9898224B1 (en) | Automatic adjustment of capacity usage by data storage optimizer for data migration | |
| US7814351B2 (en) | Power management in a storage array | |
| US9507887B1 (en) | Adaptive techniques for workload distribution across multiple storage tiers | |
| US9785353B1 (en) | Techniques for automated evaluation and movement of data between storage tiers for thin devices | |
| US9753987B1 (en) | Identifying groups of similar data portions | |
| US10671431B1 (en) | Extent group workload forecasts | |
| US8380947B2 (en) | Storage application performance matching | |
| US8832371B2 (en) | Storage system with multiple flash memory packages and data control method therefor | |
| JP5451875B2 (en) | Computer system and storage control method thereof | |
| US8566546B1 (en) | Techniques for enforcing capacity restrictions of an allocation policy | |
| US10338825B2 (en) | Managing SSD wear rate in hybrid storage arrays | |
| US9311013B2 (en) | Storage system and storage area allocation method having an automatic tier location function | |
| US9323459B1 (en) | Techniques for dynamic data storage configuration in accordance with an allocation policy | |
| US20120011329A1 (en) | Storage apparatus and storage management method | |
| US10809931B1 (en) | Techniques for use with physical media types having varying allowable write quotas | |
| GB2496807B (en) | Computer system, management method of the computer system, and program | |
| WO2011101909A1 (en) | Virtual volume control method and storage device | |
| US8862837B1 (en) | Techniques for automated data compression and decompression | |
| US9760292B2 (en) | Storage system and storage control method | |
| US10521124B1 (en) | Application-specific workload-based I/O performance management |
Legal Events
| Date | Code | Title | Description |
|---|---|---|---|
| WWE | Wipo information: entry into national phase |
Ref document number: 201080054277.2 Country of ref document: CN |
|
| WWE | Wipo information: entry into national phase |
Ref document number: 2010824273 Country of ref document: EP |
|
| WWE | Wipo information: entry into national phase |
Ref document number: 12742733 Country of ref document: US |
|
| 121 | Ep: the epo has been informed by wipo that ep was designated in this application |
Ref document number: 10824273 Country of ref document: EP Kind code of ref document: A1 |
|
| WWE | Wipo information: entry into national phase |
Ref document number: 2011551581 Country of ref document: JP |
|
| WWE | Wipo information: entry into national phase |
Ref document number: 3826/DELNP/2012 Country of ref document: IN |
|
| NENP | Non-entry into the national phase |
Ref country code: DE |