WO2011092592A2 - Methods and compositions for noninvasive prenatal diagnosis of fetal aneuploidies - Google Patents
Methods and compositions for noninvasive prenatal diagnosis of fetal aneuploidies Download PDFInfo
- Publication number
- WO2011092592A2 WO2011092592A2 PCT/IB2011/000217 IB2011000217W WO2011092592A2 WO 2011092592 A2 WO2011092592 A2 WO 2011092592A2 IB 2011000217 W IB2011000217 W IB 2011000217W WO 2011092592 A2 WO2011092592 A2 WO 2011092592A2
- Authority
- WO
- WIPO (PCT)
- Prior art keywords
- seq
- base pairs
- dna
- chromosome
- ucsc
- Prior art date
Links
Classifications
-
- C—CHEMISTRY; METALLURGY
- C12—BIOCHEMISTRY; BEER; SPIRITS; WINE; VINEGAR; MICROBIOLOGY; ENZYMOLOGY; MUTATION OR GENETIC ENGINEERING
- C12Q—MEASURING OR TESTING PROCESSES INVOLVING ENZYMES, NUCLEIC ACIDS OR MICROORGANISMS; COMPOSITIONS OR TEST PAPERS THEREFOR; PROCESSES OF PREPARING SUCH COMPOSITIONS; CONDITION-RESPONSIVE CONTROL IN MICROBIOLOGICAL OR ENZYMOLOGICAL PROCESSES
- C12Q1/00—Measuring or testing processes involving enzymes, nucleic acids or microorganisms; Compositions therefor; Processes of preparing such compositions
- C12Q1/68—Measuring or testing processes involving enzymes, nucleic acids or microorganisms; Compositions therefor; Processes of preparing such compositions involving nucleic acids
- C12Q1/6876—Nucleic acid products used in the analysis of nucleic acids, e.g. primers or probes
- C12Q1/6883—Nucleic acid products used in the analysis of nucleic acids, e.g. primers or probes for diseases caused by alterations of genetic material
-
- C—CHEMISTRY; METALLURGY
- C12—BIOCHEMISTRY; BEER; SPIRITS; WINE; VINEGAR; MICROBIOLOGY; ENZYMOLOGY; MUTATION OR GENETIC ENGINEERING
- C12Q—MEASURING OR TESTING PROCESSES INVOLVING ENZYMES, NUCLEIC ACIDS OR MICROORGANISMS; COMPOSITIONS OR TEST PAPERS THEREFOR; PROCESSES OF PREPARING SUCH COMPOSITIONS; CONDITION-RESPONSIVE CONTROL IN MICROBIOLOGICAL OR ENZYMOLOGICAL PROCESSES
- C12Q1/00—Measuring or testing processes involving enzymes, nucleic acids or microorganisms; Compositions therefor; Processes of preparing such compositions
- C12Q1/68—Measuring or testing processes involving enzymes, nucleic acids or microorganisms; Compositions therefor; Processes of preparing such compositions involving nucleic acids
- C12Q1/6804—Nucleic acid analysis using immunogens
-
- C—CHEMISTRY; METALLURGY
- C12—BIOCHEMISTRY; BEER; SPIRITS; WINE; VINEGAR; MICROBIOLOGY; ENZYMOLOGY; MUTATION OR GENETIC ENGINEERING
- C12Q—MEASURING OR TESTING PROCESSES INVOLVING ENZYMES, NUCLEIC ACIDS OR MICROORGANISMS; COMPOSITIONS OR TEST PAPERS THEREFOR; PROCESSES OF PREPARING SUCH COMPOSITIONS; CONDITION-RESPONSIVE CONTROL IN MICROBIOLOGICAL OR ENZYMOLOGICAL PROCESSES
- C12Q1/00—Measuring or testing processes involving enzymes, nucleic acids or microorganisms; Compositions therefor; Processes of preparing such compositions
- C12Q1/68—Measuring or testing processes involving enzymes, nucleic acids or microorganisms; Compositions therefor; Processes of preparing such compositions involving nucleic acids
- C12Q1/6806—Preparing nucleic acids for analysis, e.g. for polymerase chain reaction [PCR] assay
-
- C—CHEMISTRY; METALLURGY
- C12—BIOCHEMISTRY; BEER; SPIRITS; WINE; VINEGAR; MICROBIOLOGY; ENZYMOLOGY; MUTATION OR GENETIC ENGINEERING
- C12Q—MEASURING OR TESTING PROCESSES INVOLVING ENZYMES, NUCLEIC ACIDS OR MICROORGANISMS; COMPOSITIONS OR TEST PAPERS THEREFOR; PROCESSES OF PREPARING SUCH COMPOSITIONS; CONDITION-RESPONSIVE CONTROL IN MICROBIOLOGICAL OR ENZYMOLOGICAL PROCESSES
- C12Q1/00—Measuring or testing processes involving enzymes, nucleic acids or microorganisms; Compositions therefor; Processes of preparing such compositions
- C12Q1/68—Measuring or testing processes involving enzymes, nucleic acids or microorganisms; Compositions therefor; Processes of preparing such compositions involving nucleic acids
- C12Q1/6809—Methods for determination or identification of nucleic acids involving differential detection
-
- C—CHEMISTRY; METALLURGY
- C12—BIOCHEMISTRY; BEER; SPIRITS; WINE; VINEGAR; MICROBIOLOGY; ENZYMOLOGY; MUTATION OR GENETIC ENGINEERING
- C12Q—MEASURING OR TESTING PROCESSES INVOLVING ENZYMES, NUCLEIC ACIDS OR MICROORGANISMS; COMPOSITIONS OR TEST PAPERS THEREFOR; PROCESSES OF PREPARING SUCH COMPOSITIONS; CONDITION-RESPONSIVE CONTROL IN MICROBIOLOGICAL OR ENZYMOLOGICAL PROCESSES
- C12Q1/00—Measuring or testing processes involving enzymes, nucleic acids or microorganisms; Compositions therefor; Processes of preparing such compositions
- C12Q1/68—Measuring or testing processes involving enzymes, nucleic acids or microorganisms; Compositions therefor; Processes of preparing such compositions involving nucleic acids
- C12Q1/6844—Nucleic acid amplification reactions
-
- C—CHEMISTRY; METALLURGY
- C12—BIOCHEMISTRY; BEER; SPIRITS; WINE; VINEGAR; MICROBIOLOGY; ENZYMOLOGY; MUTATION OR GENETIC ENGINEERING
- C12Q—MEASURING OR TESTING PROCESSES INVOLVING ENZYMES, NUCLEIC ACIDS OR MICROORGANISMS; COMPOSITIONS OR TEST PAPERS THEREFOR; PROCESSES OF PREPARING SUCH COMPOSITIONS; CONDITION-RESPONSIVE CONTROL IN MICROBIOLOGICAL OR ENZYMOLOGICAL PROCESSES
- C12Q2600/00—Oligonucleotides characterized by their use
- C12Q2600/154—Methylation markers
Definitions
- Prenatal diagnosis is currently performed using conventional cytogenetic analysis (such as karyotyping) or DNA analysis (such as QF-PCR), which require fetal genetic material to be obtained by amniocentesis, chorionic villus sampling or chordocentesis.
- cytogenetic analysis such as karyotyping
- DNA analysis such as QF-PCR
- fetal genetic material to be obtained by amniocentesis, chorionic villus sampling or chordocentesis.
- these are invasive procedures and are associated with a significant risk of fetal loss (0.5 to 1% for chorionic villus sampling and amniocentesis) (Hulten, M.A. et al. (2003) Reproduction 126:279-297).
- ffDNA Free fetal DNA
- characteristics of the ffDNA can be used for its discrimination from circulating maternal DNA or as a means of fetal DNA enrichment (Chan, K.C. et al. (2004) Clin. Chem. 50:88-92; Poon, L.L. et al. (2002) Clin. Chem. 48:35-41). For example, size, ffDNA can be used for its discrimination from circulating maternal DNA or as a means of fetal DNA enrichment (Chan, K.C. et al. (2004) Clin. Chem. 50:88-92; Poon, L.L. et al. (2002) Clin. Chem. 48:35-41). For example, size
- fractionation has been used on plasma DNA to enrich for fetal DNA because fetal DNA is generally shorter in length than maternal DNA in the circulation (Chan, K.C. et al. (2004), supra). Furthermore, based on evidence that ffDNA in maternal plasma is of placental origin, epigenetic differences between maternal peripheral (whole) blood and placental DNA have been used to detect a hypomethylated gene sequence
- ffDNA Current methods developed using ffDNA for noninvasive prenatal diagnosis are subject to a number of limitations.
- One method being investigated involves the use of methylation- sensitive restriction enzymes to remove hypomethylated maternal DNA thus allowing direct polymerase chain reaction (PCR) analysis of ffDNA (Old, R.W. et al. (2007), supra).
- PCR polymerase chain reaction
- regions of differentially methylated DNA limits the number of regions suitable for testing.
- Another method being investigated involves the use of sodium bisulfite conversion to allow the discrimination of differential methylation between maternal and fetal DNA.
- This invention provides a new approach for noninvasive prenatal diagnosis based on the detection of ffDNA.
- DMRs differentially methylated regions
- chromosomes 13, 18, 21, X and Y differentially methylated regions
- oligonucleotide array analysis to enable chromosome-wide identification of DNA methylation patterns in a high-throughput approach. Furthermore, representative examples of a subset of these DMRs which are hypermethylated in fetal DNA and hypomethylated in female peripheral blood, have been used to accurately predict trisomy 21, in a method based on physically separating hypermethylated DNA from
- the invention pertains to a method for prenatal diagnosis of a fetal aneuploidy using a sample of maternal blood, the method
- DMRs differentially methylated regions
- a standardized reference hypermethylation value for said plurality of DMRs e.g., a normal maternal reference hypermethylation value of matched gestational age
- the maternal blood sample is a maternal peripheral blood sample.
- the hypermethylated DNA is physically separated from hypomethylated DNA by Methylation DNA Immunoprecipitation (MeDiP).
- Methylation DNA Immunoprecipitation MeDiP
- the hypermethylated DNA is amplified, such as by ligation mediated polymerase chain reaction (LM-PCR).
- the plurality of DMRs preferably are chosen from the lists shown in Appendices A-E.
- the levels of the plurality of DMRs are determined for at least three, at least five, at least eight, at least 10 or at least 12 DMRs, for example chosen from the lists shown in Appendices A-E.
- control regions e.g., two control regions
- the levels of the plurality of DMRs in the hypermethylated DNA sample are determined by real time quantitative polymerase chain reaction (Real Time QPCR).
- the levels of the plurality of DMRs are also determined in a total untreated maternal blood DNA sample as a control of the LM-PCR efficiency.
- the hypermethylation value for the hypermethylated DNA sample is compared to a standardized reference hypermethylation value, for example determined from maternal DNA obtained from women bearing a normal fetus, and diagnosis of fetal aneuploidy is made when the hypermethylation value for the hypermethylated DNA sample is higher than the standardized normal reference hypermethylation value.
- a standardized reference hypermethylation value for example determined from maternal DNA obtained from women bearing a normal fetus
- the plurality of DMRs are on chromosome 21 for diagnosis of trisomy 21.
- the plurality of DMRs on chromosome 21 comprise three or more, five or more, or eight or more, regions selected from the group consisting of base pairs 39279856-39280004 (SEQ ID NO: 33), base pairs 44161178-44161323 (SEQ ID NO: 34), base pairs 44161239-44161371 (SEQ ID NO: 35), base pairs 33320735-33320829 (SEQ ID NO: 36), base pairs 42189557-42189683 (SEQ ID NO: 37), base pairs 42355712-42355815 (SEQ ID NO: 38), base pairs 42357215-42357341 (SEQ ID NO: 39), base pairs 22403649-22403792 (SEQ ID NO: 40), base pairs
- Preferred DMRs on chromosome 21 for use in the diagnosis of trisomy 21 are SEQ ID NOs: 36, 37, 38, 39, 40, 42, 43 and 44.
- the plurality of DMRs are on a chromosome selected from the group consisting of chromosome 13, chromosome 18, X chromosome and Y chromosome.
- the invention pertains to a method for prenatal diagnosis of trisomy 21 using a sample of maternal peripheral blood, the method comprising:
- hypermethylated DNA from hypomethylated DNA, without chemically altering or enzymatically digesting the hypermethylated DNA or hypomethylated DNA, to obtain a hypermethylated DNA sample;
- the plurality of DMRs on chromosome 21 comprise eight or more regions selected from the group consisting of base pairs 39279856-39280004 (SEQ ID NO: 33), base pairs 44161178-44161323 (SEQ ID NO: 34), base pairs 44161239- 44161371 (SEQ ID NO: 35), base pairs 33320735-33320829 (SEQ ID NO: 36), base pairs 42189557-42189683 (SEQ ID NO: 37), base pairs 42355712-42355815 (SEQ ID NO: 38), base pairs 42357215-42357341 (SEQ ID NO: 39), base pairs 22403649- 22403792 (SEQ ID NO: 40), base pairs 29136735-29136844 (SEQ ID NO: 41), base pairs 32268843-32268943 (SEQ ID NO: 42), base pairs 44079235-44079322 (SEQ ID NO: 43), base pairs 37841284-37841411 (SEQ ID NO: 44), and combinations thereof, and
- the levels of the plurality of DMRs are determined by real time quantitative polymerase chain reaction (Real Time QPCR);
- Preferred DMRs on chromosome 21 for use in the diagnosis of trisomy 21 are SEQ ID NOs: 36, 37, 38, 39, 40, 42, 43 and 44.
- the hypermethylated DNA is physically separated from hypomethylated DNA by Methylation DNA
- the hypermethylated DNA is amplified, such as by ligation-mediated polymerase chain reaction (LM-PCR).
- LM-PCR ligation-mediated polymerase chain reaction
- the levels of the plurality of DMRs are also determined in a total untreated maternal blood DNA sample as a control of the LM-PCR efficiency.
- the hypermethylation value for the hypermethylated DNA sample is compared to a standardized normal reference hypermethylation value of a normal maternal blood sample, and diagnosis of trisomy 21 is made when the hypermethylation value for the hypermethylated DNA sample is higher than the standardized normal reference hypermethylation value.
- the invention pertains to a method for identifying a differentially methylated region (DMR) on a chromosome of interest suitable for use in diagnosing a fetal aneuploidy, the method comprising:
- PB sample normal adult female peripheral blood DNA sample
- the PL sample comprises two different samples, a first trimester PL sample and a third trimester PL sample
- step d) further comprises selecting a region having an equivalent degree of methylation in the first trimester separated PL sample and the third trimester separated PL sample.
- the chromosome of interest is chromosome 21.
- the chromosome of interest is selected from the group consisting of chromosome 13, chromosome 18, X chromosome and Y chromosome.
- the aneuploidy is a trisomy. In another embodiment, the aneuploidy is a monosomy.
- the invention pertains to a kit for prenatal diagnosis of trisomy 21, the kit comprising:
- nucleic acid compositions for determining levels of a plurality of differentially methylated regions (DMRs) on chromosome 21;
- the plurality of DMRs on chromosome 21 are chosen from the list shown in Appendix A. More preferably, the plurality of DMRs on chromosome 21 comprise three or more, five or more, or eight or more, regions selected from the group consisting of base pairs 39279856-39280004 (SEQ ID NO: 33), base pairs 44161178- 44161323 (SEQ ID NO: 34), base pairs 44161239-44161371 (SEQ ID NO: 35), base pairs 33320735-33320829 (SEQ ID NO: 36), base pairs 42189557-42189683 (SEQ ID NO: 37), base pairs 42355712-42355815(SEQ ID NO: 38), base pairs 42357215- 42357341 (SEQ ID NO: 39), base pairs 22403649-22403792 (SEQ ID NO: 40), base pairs 29136735-29136844 (SEQ ID NO: 41), base pairs 32268843-32268943 (SEQ ID NO: 42), base pairs
- kits for use in the diagnosis of trisomy 21 are SEQ ID NOs: 36, 37, 38, 39, 40, 42, 43 and 44.
- the nucleic acid compositions comprise one or more oligonucleotide primers selected from the group consisting of SEQ ID NOs: 1- 24, and combinations thereof.
- the kit further comprises oligonucleotide primers (e.g., two or more) for detection of control regions.
- the kit further comprises means for physically separating hypermethylated DNA from hypomethylated DNA, without chemically altering or enzymatically digesting the hypermethylated DNA or hypomethylated DNA, in a blood sample.
- hypomethylated DNA comprises an antibody that immunoprecipitates methylated DNA.
- the kit can further comprise means for amplifying
- the means for amplifying hypermethylated DNA comprises oligonucleotide linkers and/or oligonucleotide primers for performing ligation mediated polymerase chain reaction (LM-PCR).
- LM-PCR ligation mediated polymerase chain reaction
- the invention pertains to a nucleic acid composition
- a nucleic acid composition comprising one or more isolated oligonucleotide primers selected from the group consisting of SEQ ID NOs: 1-24, and combinations thereof.
- Figure 1 is a diagram showing the DNA methylation enrichment of CHR21 (A) region assayed by oligonucleotide array. The diagram shows methylation differences
- trimester placenta between 3 trimester placenta and peripheral (whole) blood and individual methylation status of peripheral (whole) blood, 1 st trimester and 3 rd trimester placental DNA samples.
- Figure 2 is a diagram showing the comparison of the DNA methylation enrichment of CHR21(A) from oligonucleotide arrays and real time quantitative PCR using peripheral blood, 1 st trimester and 3 rd trimester placental DNA samples.
- the Y axis indicates the relative fold enrichment of placenta when compared to peripheral blood DNA sample and the X axis indicates the chromosomal position in bp.
- the grey lines represent the oligonucleotides covering the specific region on chromosome 21 whereas the black lines represent the PCR products (CHR21 (Al) & CHR21 (A2)) when real time quantitative PCR was applied.
- FIG. 3 is a bar graph showing DNA methylation enrichment of CHR21(B4) by real time quantitative PCR on MeDiP and input replicated DNA samples. Open bars are peripheral (whole) blood samples; grey bars are 1 st trimester placental DNA samples; solid black bars are 3 rd trimester placental DNA samples. The error bars indicate the standard deviation between technical replicates. WB: whole (peripheral) blood, PL: placenta.
- Figure 4 is a bar graph showing DNA methylation enrichment of CHR13(HYP1) using real time quantitative PCR. Open bars are input DNA compared to peripheral (whole) blood; solid black bars are immunoprecipitated DNA compared to peripheral (whole) blood, IPL & 2PL are 3 rd trimester placentas, 3PL is 1 st trimester placenta. WB is whole (peripheral) blood, P is placenta.
- FIG. 5 is a flowchart diagram of the methodology for identification of
- DMRs Differentially Methylated Regions
- Figure 6 is a flowchart diagram of the methodology for development and validation of a noninvasive diagnostic test for trisomy 21 (NID21).
- Figure 7 is a schematic illustration of the DNA methylation ratio strategy for non-invasive detection of trisomy 21 through maternal peripheral blood analysis, by the relative quantification of fetal specific DNA methylated regions located on chromosome 21.
- Figure 8 is a schematic illustration of the analytical approach for DNA methylation ratio determination.
- Figure 9 is a BoxPlot representation of the results obtained from four DMRs, EP1, EP4, EP7 and EP10 in normal and trisomy 21 cases. Detailed Description
- the present invention is based, at least in part, on the inventors' identification of a large panel of differentially methylated regions (DMRs) that exhibit hypermethylation in fetal DNA and hypomethylation in maternal DNA. Still further, the invention is based, at least in part, on the inventors' demonstration that hypermethylated fetal DNA can be purified away from hypomethylated maternal DNA by physically separating the two DNA populations without chemically altering or enzymatically digesting the two DNA samples, thereby resulting in a sample enriched for hypermethylated fetal DNA. Still further, the inventors have accurately diagnosed trisomy 21 in a panel of maternal peripheral blood samples using representative examples of the DMRs disclosed herein, thereby demonstrating the effectiveness of the identified DMRs and disclosed methodologies in diagnosing fetal aneuploidies.
- DMRs differentially methylated regions
- the invention provides a method for prenatal diagnosis of a fetal aneuploidy using a sample of maternal blood, the method comprising:
- DMRs differentially methylated regions
- the sample of maternal blood can be obtained by standard techniques, such as using a needle and syringe.
- the maternal blood sample is a maternal peripheral blood sample.
- the maternal blood sample can be a fractionated portion of peripheral blood, such as a maternal plasma sample.
- total DNA can be extracted from the sample using standard techniques, a non-limiting example of which is the QIAmp DNA Blood Midi Kit (Qiagen).
- Qiagen the QIAmp DNA Blood Midi Kit
- the total DNA is then fragmented, preferably to sizes of approximately 300bp-800bp.
- the total DNA can be fragmented by sonication.
- hypermethylated DNA is physically separated from
- hypomethylated DNA without chemically altering or enzymatically digesting the hypomethylated DNA or hypermethylated DNA, to obtain a hypermethylated DNA sample.
- this physical separation is accomplished by Methylated DNA Immunoprecipitation (MeDiP), a technique that has been described in the art (see e.g., Weber, M. et al. (2005) Nat. Genet. 37:853-862; and Rakyan, et al. (2008) Genome Res. 18: 1518-1529; which are both expressly incorporated herein by reference).
- Methylated DNA Immunoprecipitation Methylated DNA Immunoprecipitation
- the input DNA is denatured, incubated with an antibody directed against 5-methylcytosine and then the methylated DNA is isolated by immunoprecipitation.
- an antibody directed against 5-methylcytosine directed against 5-methylcytosine and then the methylated DNA is isolated by immunoprecipitation.
- the anti-5- methylcytosine antibody can be coupled to a solid support (e.g., magnetic dynabeads, microscopic agarose beads or paramagnetic beads) to allow for precipitation of the methylated DNA from solution (direct immunoprecipitation).
- a secondary antibody or reagent can be used that recognizes the anti-5-methylcytosine antibody (e.g., the constant region of the antibody) and that is coupled to a solid support, to thereby allow for precipitation of the methylated DNA from solution (indirect immunoprecipitation).
- the anti-5-methylcytosine antibody e.g., the constant region of the antibody
- the anti-5-methylcytosine antibody can be coupled to biotin and then avidin or streptavidin coupled to a solid support can be used to allow for precipitation of the methylated DNA from solution.
- Methods for causing immunoprecipitation are also suitable for use in the invention.
- Methods for causing immunoprecipitation are also suitable for use in the invention.
- the term "Methylated DNA Immunoprecipitation" or "MeDiP” is intended to encompass any and all approaches in which an antibody that discriminates between hypermethylated DNA and hypomethylated DNA is contacted with DNA from the maternal blood sample, followed by precipitation of the hypermethylated DNA (i.e., the DNA that specifically binds to the antibody) out of solution.
- the DNA in the sample is not chemically altered or enzymatically digested.
- the term "chemically altering" is intended to mean reacting the DNA with a non-antibody chemical substance that discriminates between hypermethylated DNA and hypomethylated DNA, such as sodium bisulfite conversion.
- the DNA of the maternal blood sample is not subjected to sodium bisulfite conversion or any other similar (non- antibody) chemical reaction that discriminates between hypermethylated DNA and hypomethylated DNA.
- the term "enzymatically digesting” is intended to mean reacting the DNA with one or more methylation-sensitive restriction enzymes to thereby remove hypomethylated DNA.
- the DNA of the maternal blood sample is not treated with a methylation-sensitive restriction enzyme(s) to discriminate between hypermethylated DNA and hypomethylated DNA.
- fragmentation of the DNA from the maternal peripheral blood sample that typically is performed prior to separation of the hypermethylated DNA from the hypomethylated DNA
- shearing by sonication could also be accomplished by digestion of the DNA with restriction enzymes.
- restriction enzymes such general digestion of the DNA to accomplish fragmentation is not performed with a methylation-sensitive restriction enzyme(s).
- the requirement that the DNA of the maternal blood sample not be "enzymatically digested" is not intended to preclude the use of non-methylation-sensitive restriction enzymes to achieve overall fragmentation (i.e., size reduction) of the maternal blood sample DNA.
- LM-PCR ligation mediated polymerase chain reaction
- oligonucleotide primers that recognize the nucleotide sequences of the linker ends are used in PCR to thereby amplify the DNA fragments to which the linkers have been ligated.
- linker arms are ligated onto the fragmented DNA by blunt-end ligation.
- the recovered hypermethylated DNA is subjected to PCR using oligonucleotide primers that recognized the linker ends that have been ligated onto the DNA. This results in amplification of the
- DMRs Differentially Methylated Regions
- the diagnostic method of the invention employs a plurality of differentially methylated regions (DMRs).
- DMR differentially methylated region
- the term "differentially methylated region" or “DMR” is intended to refer to a region in chromosomic DNA that is differentially methylated between fetal and maternal DNA, and for the purposes of the invention the preferred, selected DMRs are those that are hypermethylated in fetal DNA and hypomethylated in maternal. That is, these regions (selected DMRs) exhibit a greater degree (i.e., more) methylation in fetal DNA as compared to maternal DNA.
- any DMR with the above characteristics in a chromosome of interest can be used in the instant diagnostic method.
- methods for identifying such DMRs are described in detail below and in the Examples (see Examples 1 and 2).
- the term "a plurality of DMRs" is intended to mean two or more DMRs.
- the plurality of DMRs are chosen from the lists shown in Appendices A-E, for chromosomes 21, 13, 18, X or Y, respectively.
- the levels of the plurality of DMRs are determined for at least two, at least three, at least four, at least five, at least six, at least seven, at least eight, at least nine, at least ten, at least eleven or at least twelve DMRs.
- the plurality of DMRs are chosen from the lists shown in Appendices A-E.
- the plurality of DMRs are on chromosome 21 for diagnosis of trisomy 21.
- the plurality of DMRs on chromosome 21 comprise two or more, three or more, four or more, five or more, six or more, seven or more, eight or more, nine or more, ten or more, eleven or more, or twelve regions selected from the group consisting of base pairs 39279856-39280004 (SEQ ID NO: 33), base pairs 44161178-44161323 (SEQ ID NO: 34), base pairs
- base pairs 39279856- 39280004" refers to the first and last base pair position on chromosome 21 for the differentially methylated region.
- the DMR comprises a region on chromosome 21 that starts at base pair 39279856 and ends at base pair 39280004 (thus, this region comprises a 148 base pair region).
- Oligonucleotide primers for amplifying the above- listed DMRs are described further in Example 3 and in Table 7 and are shown in SEQ ID NOs: 1-24.
- the nucleotide sequences of the above-listed DMRs are shown in Table 8 and in SEQ ID NOs: 33-44.
- Example 3 a subset of eight of the twelve DMRs shown in SEQ ID NOs: 33-44 have been selected and identified as being sufficient to accurately diagnose trisomy 21 in a maternal blood sample during pregnancy of a woman bearing a trisomy 21 fetus.
- DMRs on chromosome 21 for use in the trisomy 21 diagnosis methods of the invention consist of base pairs 33320735- 33320829 (SEQ ID NO: 36), base pairs 42189557-42189683 (SEQ ID NO: 37), base pairs 42355712-42355815 (SEQ ID NO: 38), base pairs 42357215-42357341 (SEQ ID NO: 39), base pairs 22403649-22403792 (SEQ ID NO: 40), base pairs 32268843- 32268943 (SEQ ID NO: 42), base pairs 44079235-44079322 (SEQ ID NO: 43) and base pairs 37841284-37841411 (SEQ ID NO: 44).
- the plurality of DMRs are on a chromosome selected from the group consisting of chromosome 13, chromosome 18, X chromosome and Y chromosome, to allow for diagnosis of aneuploidies of any of these
- Control DMRs also can be used in the diagnostic methods of the invention.
- one more DMRs that are known to be hypermethylated can be included in the diagnostic method as a control for hypermethylation.
- Preferred control hypermethylated regions include CHR13(HYP1), primers for which are shown in SEQ ID NOs: 25 and 26, and CHR13(HYP2), primers for which are shown in SEQ ID NOs: 27 and 28.
- nucleotide sequence of the amplified PCR product for CHR13(HYP1) is shown in Table 8 and in SEQ ID NO: 45.
- one more DMRs that are known to be hypomethylated can be included in the diagnostic method as a control for hypomethylation.
- Preferred control hypomethylated regions include CHR22(U1), primers for which are shown in SEQ ID NOs: 29 and 30, and CHR22(U2), primers for which are shown in SEQ ID NOs: 31 and 32.
- nucleotide sequence of the amplified PCR product for CHR22(U1) is shown in Table 8 and in SEQ ID NO: 46. Control DMRs, and primers therefore, are discussed further in Example 1 and described further in Tables 6, 7 and 8.
- each of the DMRs shown in Appendices A-E is defined by a beginning and ending base pair position on a particular chromosome, such as "base pair 39279856-39280004" of chromosome 21, as described above.
- the complete nucleotide sequences of each of human chromosomes 21, 13, 18, X and Y have been determined and are publically available in the art. For example, the complete nucleotide sequences for each of these five chromosomes is obtainable from the UCSC Genome Browser, Build 36 (htt ://genome .
- oligonucleotide primers for detecting and/or amplifying a DMR can then be designed, using standard molecular biology methods, based on the nucleotide sequence of the DMR.
- hypermethylated DNA from the hypomethylated DNA, and preferably amplification of the recovered hypermethylated DNA, levels of a plurality of differentially methylated regions (DMRs) are determined in the hypermethylated DNA sample, to thereby obtain a hypermethylation value for the hypermethylated DNA sample.
- DMRs differentially methylated regions
- the term "the levels of the plurality of DMRs are determined” is intended to mean that the amount, or prevalence, or copy number, of the DMRs is determined. The basis for this is that in a fetus with a fetal aneuploidy, as compared to a normal fetus, there will be a larger amount (i.e., higher copy number) of the DMRs as a result of the aneuploidy.
- the levels of the plurality of DMRs in the hypermethylated DNA sample are determined by real time quantitative polymerase chain reaction (Real Time QPCR), a technique well-established in the art. Representative, non-limiting conditions for Real Time QPCR are given in the Examples.
- the levels of the plurality of DMRs are also determined
- total untreated maternal blood DNA sample is intended to refer to a sample of DNA obtained from maternal blood that has not been subjected to treatment to physically separate the hypermethylated DNA from the hypomethylated DNA.
- the levels of the plurality of differentially methylated regions (DMRs) are determined in the hypermethylated DNA sample to thereby obtain a "hypermethylation value" for the hypermethylated DNA sample.
- DMRs differentially methylated regions
- hypomethylation value is intended to encompass any quantitative representation of the level of DMRs in the sample.
- the raw data obtained from Real Time QPCR can be normalized based on various controls and statistical analyses to obtain one or more numerical values that represent the level of each of the plurality of DMRs in the hypermethylated DNA sample.
- controls and statistical analyses that can be applied to the samples are described in detail in Example 3.
- the specific statistical tests used to evaluate the data in the Examples are representative statistical approaches, and that alternative statistical approaches can also be applied to the instant invention, based on the guidance provided in the Examples and figures.
- the hypermethylation value is determined for the hypermethylated fetal DNA present in the maternal peripheral blood (also referred to herein as the "test DNA")
- this value is compared to a standardized reference hypermethylation value for the same plurality of DMRs examined in the test DNA, and the diagnosis of fetal aneuploidy (or lack of such fetal aneuploidy) is made based on this comparison.
- the hypermethylation value for the hypermethylated DNA sample is compared to a standardized normal reference hypermethylation value for a normal fetus, and diagnosis of fetal aneuploidy is made when the hypermethylation value for the hypermethylated DNA sample is higher than the standardized normal reference hypermethylation value for a normal fetus. That is, a "normal" hypermethylation value is set, based on data obtained from normal fetal DNA present in the maternal peripheral blood (i.e., DNA from fetus's without a fetal aneuploidy), and a diagnosis of fetal aneuploidy can be made for the test sample when the hypermethylation value for the test DNA is higher than the "normal" value.
- a standardized normal reference hypermethylation value is determined using maternal peripheral blood samples from women bearing a normal fetus (i.e., a fetus without fetal aneuploidies) of matched gestational age as compared to the "test DNA" (e.g., if the test DNA is from a fetus at 3 months gestational age, then the standardized normal reference hypermethylation value is determined using maternal peripheral blood samples from women bearing a normal fetus of 3 months gestational age).
- a normal fetus i.e., a fetus without fetal aneuploidies
- a standardized normal reference hypermethylation value can be set as "1" and then a hypermethylation value for the test DNA that is above "1" indicates an abnormal fetus, whereas a hypermethylation value of "1" or lower indicates a normal fetus.
- hypermethylated DNA sample can be compared to a standardized reference
- hypermethylation value for a fetal aneuploidy fetus can be made when the hypermethylation value for the test DNA sample is comparable to the standardized reference hypermethylation value for a fetal aneuploidy fetus.
- a standardized reference "abnormal” or "fetal aneuploidy” hypermethylation value can be set, based on data obtained from fetal aneuploidy fetal DNA present in maternal peripheral blood (i.e., DNA from fetus's that have a fetal aneuploidy), and a diagnosis of fetal aneuploidy can be made for the test sample when the hypermethylation value for the test DNA is comparable to (similar to, in the same range as) the "abnormal” or "fetal aneuploidy” value.
- a group of healthy pregnant women carrying healthy fetuses are selected. These women are of similar gestational age, which is within the appropriate time period of pregnancy for screening of conditions such as preeclampsia, fetal chromosomal aneuploidy, and preterm labor using the methods of the present invention.
- a standard reference value can be established using samples from a group of healthy non-pregnant women.
- the healthy status of the selected pregnant women and the fetuses they are carrying are confirmed by well established, routinely employed methods including but not limited to monitoring blood pressure of the women, recording the onset of labor, and conducting fetal genetic analysis using CVS and amniocentesis. Furthermore, the selected group of healthy pregnant women carrying healthy fetuses must be of a reasonable size to ensure that the standardized normal reference
- hypermethylation value for a normal fetus is statistically accurate.
- the selected group comprises at least 10 women.
- standardized reference hypermethylation values for an "abnormal" fetus can be established using the same approach as described above for establishing the standardized reference hypermethylation values for a "normal” fetus, except that the maternal blood samples used to establish the "abnormal" reference values are from pregnant women who have been determined to be carrying a fetus with a fetal aneuploidy, using conventional invasive diagnostic methods.
- Example 3 described in detail appropriate statistical analysis approaches that can be used to analyze the data obtained from DNA samples.
- statistical analysis using Mann- Whitney U test, Fisher test and stepwise model analysis can be employed as described in detail in the Examples.
- specific statistical tests used to evaluate the data in the Examples are representative statistical approaches, and that alternative statistical approaches can also be applied to the instant invention, based on the guidance provided in the Examples and figures.
- the invention provides a noninvasive prenatal diagnostic test for trisomy 21 (also referred to herein as an "NID21 test").
- NID21 test As discussed in detail in Example 3, an NID21 test has been developed and validated using DMRs identified as described in Examples 1 and 2. In the development of the test, twelve DMRs on chromosome 21 (as disclosed herein) were examined using maternal blood samples from 40 cases, 20 normal and 20 abnormal (i.e., from women known to be carrying a fetus with trisomy 21).
- the invention provides a method for prenatal diagnosis of trisomy 21 using a sample of maternal peripheral blood, the method comprising:
- hypermethylated DNA from hypomethylated DNA, without chemically altering or enzymatically digesting the hypermethylated DNA or hypomethylated DNA, to obtain a hypermethylated DNA sample; b) in the hypermethylated DNA sample, determining levels of a plurality of differentially methylated regions (DMRs) on chromosome 21 to obtain a
- the plurality of DMRs on chromosome 21 comprise eight or more regions selected from the group consisting of base pairs 39279856-39280004 (SEQ ID NO: 33), base pairs 44161178-44161323 (SEQ ID NO: 34), base pairs 44161239- 44161371 (SEQ ID NO: 35), base pairs 33320735-33320829 (SEQ ID NO: 36), base pairs 42189557-42189683 (SEQ ID NO: 37), base pairs 42355712-42355815 (SEQ ID NO: 38), base pairs 42357215-42357341 (SEQ ID NO: 39), base pairs 22403649- 22403792 (SEQ ID NO: 40), base pairs 29136735-29136844 (SEQ ID NO: 41), base pairs 32268843-32268943 (SEQ ID NO: 42), base pairs 44079235-44079322 (SEQ ID NO: 43), base pairs 37841284-37841411 (SEQ ID NO: 44), and combinations thereof, and
- the levels of the plurality of DMRs are determined by real time quantitative polymerase chain reaction (Real Time QPCR);
- the plurality of DMRs on chromosome 21 consist of eight regions having nucleotide sequences of base pairs 33320735-33320829 (SEQ ID NO: 36), base pairs 42189557-42189683 (SEQ ID NO: 37), base pairs 42355712- 42355815 (SEQ ID NO: 38), base pairs 42357215-42357341 (SEQ ID NO: 39), base pairs 22403649-22403792 (SEQ ID NO: 40), base pairs 32268843-32268943 (SEQ ID NO: 42), base pairs 44079235-44079322 (SEQ ID NO: 43) and base pairs 37841284- 37841411 (SEQ ID NO: 44).
- the hypermethylated DNA is physically separated from
- hypomethylated DNA by Methylation DNA Immunoprecipitation (MeDiP) (described further in Section I above).
- Methylation DNA Immunoprecipitation (MeDiP) (described further in Section I above).
- the hypermethylated DNA is amplified, for example by ligation-mediated polymerase chain reaction (LM-PCR) (as described in detail in Section I above).
- Oligonucleotide primers for amplifying the above-listed DMRs for chromosome 21 are described in further detail in Example 3 and Table 7 and are shown in SEQ ID NOs: 1-24.
- control DMRs also can be used in the diagnostic method.
- one more DMRs that are known to be hypermethylated can be included in the diagnostic method as a control for hypermethylation.
- Preferred control hypermethylated regions include CHR13(HYP1), primers for which are shown in SEQ ID NOs: 25 and 26 (and the nucleotide sequence of which is shown in SEQ ID NO: 45), and
- control hypomethylated regions include CHR22(U1), primers for which are shown in SEQ ID NOs: 29 and 30 (and the nucleotide sequence of which is shown in SEQ ID NO: 46), and CHR22(U2), primers for which are shown in SEQ ID NOs: 31 and 32. Control DMRs, and primers therefore, are discussed further in Example 1 and described further in Table 6.
- the levels of the plurality of DMRs are also determined in a total untreated maternal blood DNA sample as a control of the LM-PCR efficiency (as described in Section I above).
- the hypermethylation value for the hypermethylated DNA sample is compared to a standardized normal reference hypermethylation value for a normal fetus, and diagnosis of trisomy 21 is made when the hypermethylation value for the hypermethylated DNA sample is higher than the standardized normal reference hypermethylation value for a normal fetus.
- a "normal" hypermethylation value can be set for a plurality of DMRs on chromosome 21, based on data obtained from normal fetal DNA present in maternal peripheral blood (i.e., DNA from fetus's without a fetal aneuploidy) (as described in detail above), and a diagnosis of trisomy 21 can be made for the test sample when the hypermethylation value for the test DNA is higher than the "normal” value.
- a "normal" hypermethylation value has been calculated for the twelve DMRs described in Example 3 and, based on this, eight preferred DMRs were selected as being sufficient to allow for an accurate diagnosis of trisomy 21 in a test sample.
- hypermethylated DNA sample can be compared to a standardized reference hypermethylation value for a trisomy 21 fetus, and diagnosis of trisomy 21 can be made when the hypermethylation value for the test DNA sample is comparable to the standardized reference hypermethylation value for a trisomy 21 fetus. That is, an "abnormal" hypermethylation value can be set for a plurality of DMRs on chromosome 21, based on data obtained from trisomy 21 fetal DNA (i.e., DNA from fetus's with trisomy 21), and a diagnosis of trisomy 21 can be made for the test sample when the hypermethylation value for the test DNA is comparable to (similar to, in the same range as) the "abnormal" value.
- the invention provides methods for identifying differentially methylated regions (DMRs) that are hypermethylated in fetal DNA and hypomethylated in maternal DNA, based on physically separating hypermethylated DNA from hypomethylated DNA.
- DMRs differentially methylated regions
- the approaches described herein have been applied chromosome- wide to identify a large panel of differentially methylated regions on chromosomes 21, 13, 18, X and Y, which exhibit a higher level of methylation (hypermethylation) in fetal DNA as compared to adult female peripheral blood DNA.
- these same approaches can be applied to identify additional DMRs on these same chromosomes and to identify new DMRs on other chromosomes.
- the invention provides a method for identifying a differentially methylated region (DMR) on a chromosome of interest suitable for use in diagnosing a fetal aneuploidy, the method comprising:
- PB sample normal adult female peripheral blood DNA sample
- each separated sample of b) determining levels of a plurality of regions on a chromosome of interest; and d) selecting a region that is hypomethylated in the separated PB sample and is hyperaiethylated in the separated PL sample to thereby identify a differentially methylated region (DMR) on the chromosome of interest that is suitable for use in the diagnostic methods described herein.
- DMR differentially methylated region
- the PL sample comprises two different samples, a first trimester PL sample and a third trimester PL sample, wherein step d) further comprises selecting a region having an equivalent degree of methylation in the first trimester separated PL sample and the third trimester separated PL sample.
- the chromosome of interest is chromosome 21.
- the chromosome of interest is selected from the group consisting of chromosome 13, chromosome 18, X chromosome and Y chromosome.
- the aneuploidy is a trisomy.
- a "normal adult female” is a female that does not have a chromosomal aneuploidy.
- normal placental DNA is DNA from the placenta of a fetus that does not have a chromosomal aneuploidy.
- the hypermethylated DNA is physically separated from hypomethylated DNA, without chemically altering or enzymatically digesting the hypermethylated DNA or hypomethylated DNA, as described in detail above in Section I.
- this separation is accomplished using Methylation DNA
- the terms “separated PB sample” and “separated PL sample” refer to the portion of the original peripheral blood sample or original placental DNA sample that putatively contains hypermethylated DNA that has been separated away from hypomethylated DNA.
- the "separated” sample is the fraction of the peripheral blood or placental DNA sample that has been immunoprecipitated.
- the DNA of the separated PB sample and the separated PL sample is amplified, preferably by LM-PCR.
- linker ends are blunt ligated to the DNA prior to separation, and then after separation, PCR is carried out on the separated DNA samples using oligonucleotide primers that recognize the linker ends, as described in detail above in Section I.
- the levels of the plurality of regions on a chromosome of interest are determined in the separated samples as described above in Section I, preferably by Real Time QPCR. Also as described above, controls and statistical analyses can be applied to the raw data to determine a hypermethylation value for the plurality of regions. Finally, to identify a specific differentially methylated region (DMR) on the chromosome of interest, a region is selected that is hypomethylated in the separated peripheral blood (PB) sample from the normal adult female and is hypermethylated in the separated placental (PL) sample from the normal fetus.
- PB peripheral blood
- PL separated placental
- kits of the invention provides kits that can be used in the diagnostic methods of the invention. Such kits typically include at least one reagent and instructions for use of the kit. In a preferred embodiment, the invention provides a kit for prenatal diagnosis of trisomy 21, the kit comprising:
- nucleic acid compositions for determining levels of a plurality of differentially methylated regions (DMRs) on chromosome 21;
- the plurality of DMRs on chromosome 21 can be chosen, for example, from the chromosome 21 DMRs shown in the list of Appendix A.
- the plurality of DMRs on chromosome 21 comprise at least one region selected from the group consisting of base pairs 39279856-39280004 (SEQ ID NO: 33), base pairs 44161178- 44161323 (SEQ ID NO: 34), base pairs 44161239-44161371 (SEQ ID NO: 35), base pairs 33320735-33320829 (SEQ ID NO: 36), base pairs 42189557-42189683 (SEQ ID NO: 37), base pairs 42355712-42355815 (SEQ ID NO: 38), base pairs 42357215- 42357341 (SEQ ID NO: 39), base pairs 22403649-22403792 (SEQ ID NO: 40), base pairs 29136735-29136844 (SEQ ID NO: 41), base pairs 32268843-32268943 (SEQ ID NO: 42), base
- the plurality of DMRs on chromosome 21 comprise two or more, three or more, four or more, five or more, six or more, seven or more, eight or more, nine or more, or ten or more of the above-listed regions.
- the plurality of DMRs on chromosome 21 consist of eight regions having SEQ ID NOs: 36, 37, 38, 39, 40, 42, 43 and 44, respectively. Oligonucleotide primers for amplifying the above-listed twelve DMRs are described in further detail in Example 3 and Table 7 and are shown in SEQ ID NOs: 1-24.
- the nucleic acid compositions comprise one or more oligonucleotide primers selected from the group consisting of SEQ ID NOs: 1-24, and combinations thereof. Additionally, one or more
- oligonucleotide primers for amplifying control hypermethylated or hypomethylated regions can be include in the kit.
- preferred control hypermethylated regions include CHR13(HYP1), primers for which are shown in SEQ ID NOs: 25 and 26 (and having the nucleotide sequence shown in SEQ ID NO: 45), and CHR13(HYP2), primers for which are shown in SEQ ID NOs: 27 and 28.
- hypomethylated regions include CHR22(U1), primers for which are shown in SEQ ID NOs: 29 and 30 (and having the nucleotide sequence shown in SEQ ID NO: 46), and CHR22(U2), primers for which are shown in SEQ ID NOs: 31 and 32.
- Control DMRs, and primers therefore, are discussed further in Example 1 and described further in Table 6.
- the kit further comprises means for physically separating hypermethylated DNA from hypomethylated DNA, without chemically altering or enzymatically digesting the hypermethylated DNA or hypomethylated DNA, in a blood sample.
- a preferred means for physically separating hypermethylated DNA from hypomethylated DNA comprises an antibody that immunoprecipitates methylated DNA, such as an antibody that specifically binds 5-methylcytosine.
- the kit further comprises means for amplifying hypermethylated DNA.
- a preferred means for amplifying hypermethylated DNA comprises oligonucleotide linkers and/or oligonucleotide primers for performing ligation mediated polymerase chain reaction (LM-PCR).
- the invention provides nucleic acid compositions that can be used in the methods and kits of the invention. These nucleic acid compositions are effective for detecting DMRs.
- the nucleic acid composition comprises one or more oligonucleotide primers that are effective for amplifying one or more DMRs of the invention, such as one or more DMRs chosen from the list shown as Appendix A.
- the oligonucleotide primers are "isolated", meaning that they are purified away from, or separated away from, other primers having different (undesired) specificities.
- the "isolated" oligonucleotide primers are purified away from, or separated away from, other nucleic acid that may flank the primer sequence in a natural or native location, such as in chromosomal DNA or other natural or native form of nucleic acid.
- the invention provides a nucleic acid composition comprising one or more isolated oligonucleotide primers, for amplifying DMRs EP1- EP12 (as described in Table 7), selected from the group consisting of
- CCACCGTCACTGTTCCTAGA SEQ ID NO: 4
- CCTCGTGCTCGTGTCTGTAT SEQ ID NO: 5
- GAGGAAACAGCTTGGCTCTG SEQ ID NO: 6
- CTGTTGCATGAGAGCAGAGG SEQ ID NO: 7
- CGTCCCCCTCGCTACTATCT SEQ ID NO: 8
- TGCAGGATATTTGGCAAGGT SEQ ID NO: 9
- CTGTGCCGGTAGAAATGGTT SEQ ID NO: 10
- TGAATCAGTTCACCGACAGC SEQ ID NO: 11
- GAAACAACCTGGCCATTCTC SEQ ID NO: 12
- ACCATGCTCAGCCAATTTTT SEQ ID NO: 16
- GACCCAGACGATACCTGGAA SEQ ID NO: 17
- GCTGAACAAAACTCGGCTTC SEQ ID NO: 18
- CCCCACAGGGTTCTGGTAAT SEQ ID NO: 22
- ATTCTCCACAGGGCAATGAG SEQ ID NO: 23
- TTATGTGGCCTTTCCTCCTG SEQ ID NO: 24
- the invention provides a nucleic acid composition comprising one or more isolated oligonucleotide primers, for amplifying a control hypermethylated or hypomethylated region(s), selected from the group consisting of: CAGGAAAGTGAAGGGAGCTG (SEQ ID NO: 25),
- GGTCCCTCCCTTTTCTGTCT (SEQ ID NO: 32), and combinations thereof.
- DMRs differentially methylated regions
- the fragmented DNA was blunt-ended after combination with IX NEB buffer 2 (New England BioLabs; Ipswich, UK), 10X BSA (New England BioLabs; Ipswich, UK), lOOmM dNTP mix, T4 DNA polymerase (3 U/ ⁇ ) (New England BioLabs; Ipswich, UK) and distilled water up to a final volume of 120 ⁇ 1. After 20 minutes incubation at 12°C, the reaction was cleaned up using the DNA Clean and Concentrator-5TM (Zymo Research Corp; Glasgow, Scotland) according to the manufacturer's protocol. However, the final elution step was performed in 30 ⁇ 1 of EB buffer provided by the QiAquick PCR purification kit (Qiagen; West Wales, UK).
- the cleaned sample was then mixed with 40 ⁇ 1 of annealed linkers (50 ⁇ ) (SIGMA Genosys; Gillingham, UK) prepared as previously described in Ren, B. et al. (2000) supra, Oberley, M.J. et al. (2004) supra, T4 DNA ligase 10X buffer (Roche; Mannheim, Germany), 6 ⁇ 1 of T4 DNA ligase (5 ⁇ / ⁇ 1) (Roche; Mannheim, Germany) and distilled water up to a final volume of ⁇ . The sample was then incubated overnight at 16 °C to allow ligation of the adaptors. Purification of the sample was performed using the DNA Clean and Concentrator-5TM as described above.
- the eluted sample was then combined with lOOmM dNTP mix, lx PCR Gold Buffer (Roche; Mannheim, Germany), 1.5mM MgCl 2 (Roche; Mannheim, Germany), and 5U AmpliTaq Polymerase.
- the sample was then incubated at 70 °C for 10 minutes to fill in DNA overhangs and purified using the DNA Clean and Concentrator-5TM as described above. 50ng of DNA was removed and retained for use as input genomic control DNA.
- the remaining ligated DNA sample (700ng-l ⁇ g) was subjected to MeDiP as described previously (Weber, M. et al. (2005) supra), after scaling down the reaction accordingly.
- the immunoprecipitated DNA sample was then cleaned up using the DNA Clean and Concentrator-5TM (using 700 ⁇ 1 binding buffer) according to the manufacturer's instructions.
- Ligation-mediated PCR (LM-PCR) was performed using lOng of each input and immunoprecipitated DNA fraction using the Advantage-GC Genomic PCR kit
- the input and the immunoprecipitated DNA fractions from a female peripheral blood DNA sample, a 3 rd trimester placental DNA sample and a 1 st trimester placental DNA sample were sent to Roche NimbleGen Inc (Reykjsvik, Iceland) for hybridization.
- the array platforms used were high resolution tiling oligonucleotide arrays specific for
- chromosomes 13, 18, 21, X and Y with a median probe spacing of 225 bp for chromosome 13, 170 bp for chromosome 18, 70 bp for chromosome 21, 340 bp for chromosome X and 20 bp for chromosome Y.
- the input genomic control DNA and the immunoprecipitated DNA of each sample were differentially labeled with fluorescent dyes (Cy3, Cy5) and were then co-hybridized on the oligonucleotide arrays.
- the raw data can be accessed in ArrayExpress (http://www.ebi.ac.uk/microarray- as/ae/) with accession number E-TABM-507.
- the oligonucleotide array normalized log 2 ratio values obtained from peripheral blood DNA were subtracted from the log 2 ratio values (immunoprecipitated versus input fraction) obtained from placental DNA using the R statistical computing environment (h tt : / /www .r-pr o j ec t . or g ) .
- Positive differences represent relative hypermethylation in placental DNA, negative differences relative hypomethylation.
- GFF General Feature Format
- Threshold values (to) for SW- ARRAY of between 0.2 and 1 were tested to identify the optimal value for calling relative high-score segments or "islands" based on the identification of at least two consecutive oligonucleotides having the same methylation status and showing the highest score among the scores obtained with different threshold values (to).
- a direct comparison between the differentially methylated regions identified by SW- ARRAY and the position of genes, promoter regions (which were defined as the region up to 2kb upstream of the 5' end of each gene) and CpG islands was performed.
- MeDiP would be used to deplete maternal hypomethylated DNA allowing assay of fetal hypermethylated DNA. Therefore, we identified all regions where the immunoprecipitated versus input ratios were positive in the placenta and negative in the peripheral blood samples (hypermethylation in the placenta).
- a small number of the most differentially hypermethylated regions in the placenta (8 regions on chromosome 21 and one region on chromosome 18 plus the SERPINB5 promoter region) were selected from this data set for further validation and assay development by using an arbitrary differential ratio cut off of greater than 1.0 (at least one of the consecutive probes showing a log 2 ratio value > 1).
- the methylation enrichment of the selected regions on chromosome 21 and chromosome 18 were confirmed by real-time quantitative PCR.
- Primers specific for the regions of interest were designed using the primer3 web site (http ://f rodo , wi .mi t.edu/. ) .
- the primer design was optimized to give a product of 80-150bp in length as recommended for optimal SYBR Green fluorescence melting curve analysis. Additionally, the Tm of all the primers was chosen to be close to 60°C.
- the uniqueness of both primer sequences and PCR product sequences was confirmed by mapping these onto the human reference sequence using Blat. Primers were purchased from Sigma Genosys (Gillingham, UK).
- chromosomes 13, 18, 21, X and Y in both placenta and peripheral blood DNA samples were initially used to calculate the ratio difference (relative methylation) between placental and peripheral blood DNA.
- SW- ARRAY was used to identify differentially methylated regions between peripheral blood and placenta.
- the optimal SW- ARRAY threshold for the identification of regions was found to be 0.9 for all chromosomes.
- the differentially methylated regions identified by SW- ARRAY analysis in 1 st and 3 rd trimester compared to peripheral blood DNA are shown in Appendices A-E, for chromosomes 21, 13, 18, X and Y, respectively.
- Table 1 Differentially methylated regions in placental compared to peripheral blood DNA samples across chromosomes 13, 18, 21, X and Y.
- Chromosome Chromosome; ⁇ Number of hypermethylated regions within genes; % Number of hypomethylated regions within genes; ⁇ Percentage of differentially methylated regions within genes;
- Table 3A Number of methylated regions overlapping with CpG islands in
- Table 3B Methylation status of genic, no-genic and promoter CpG islands located within the differentially methylated regions in chromosomes 13, 18, 21, X and Y.
- SERPINB5 promoter region was hypomethylated in placenta and hypermethylated peripheral blood which is in agreement with the study of Chim, S.S. et.al (2005) Proc. Natl. Acad. Sci. USA 14753-14758.
- an additional 9 selected regions, including the SERPINB5 promoter region were analyzed by real time quantitative PCR.
- Various primers were designed to cover each region. Each primer was tested prior to use and the optimal concentration for each one was determined.
- the oligonucleotide array results for a region located on chromosome 21 can be compared to the real-time quantitative PCR results as shown in Figure 2.
- the same peripheral blood and placental DNA samples were used for PCR validation as had been used for oligonucleotide array hybridizations. Both methods reported enrichment for methylation in placenta compared to peripheral blood. Additionally, both oligonucleotide array and real time quantitative PCR demonstrated a lower degree of methylation enrichment in 1 st trimester placental DNA sample compared to 3 rd trimester placental DNA sample. Nevertheless, the methylation enrichment observed in the 1 st trimester placenta was higher compared to the
- the experimental reproducibility of the MeDiP procedure was assessed by performing technical replicates of a single placental DNA sample with the methylation status of two regions on chromosome 21 being assessed by real time quantitative PCR.
- the median reproducibility was found to be 98.62% and 95.84% for the regions.
- Table 4 Percentage variability of methylation between different samples of the same tissue origin (peripheral blood (PB) or placenta (PL)) and gestational age (placenta)
- Table 5 Example of regions found to have opposite methylation status between I s and 3 rd trimester placental DNA or being differentially methylated at a specific gestational age compared to peripheral blood DNA.
- CHR13(HYP2) primers detect hypermethylated control regions and the CHR22(U1) and CHR22 (U2) primers detect hypomethylated control regions.
- DMRs Methylated Regions
- FIG. 5 A flowchart diagram of the methodology is shown in Figure 5. The diagram shows the application of the MeDiP LM-PCR methodology and the oligo-array hybridization procedure towards the identification of DMRs across chromosomes 13, 18, 21, X and Y. Samples
- PB peripheral blood
- PLO normal first trimester placenta
- PL 3 normal third trimester placenta
- Methylation DNA Immunoprecipitation (MeDiP) and Ligation
- LM-PCR Mediated PCR
- PB peripheral blood
- PLO normal first trimester placenta
- PL 3 normal third trimester placenta
- MeDiP assay was followed by LM-PCR (described further in Ren, B. et al. (2000) Science 22:2306-2309; Oberley, M.J. et al. (2004) Methods Enzymol. 376:315-334).
- the methodology was as described previously (Rakyan, K.V. et al. (2008) Genome Research 1_8: 1518-1529) with minor modifications.
- Figure 5 provides a flow chart of the procedure.
- NEB buffer 2 New England BioLabs; Ipswich, UK
- 10X BSA New England BioLabs; Ipswich, UK
- lOOmM dNTP mix T4 DNA polymerase (3 U/ ⁇ )
- PCR Purification kit (Qiagen; West Wales, UK) according to the manufacturer's protocol. However, the final elution step was performed in 30 ⁇ 1 of EB buffer. The cleaned samples were then mixed with 40 ⁇ 1 of annealed linkers (50 ⁇ ) (SIGMA Genosys; Gillingham, UK), prepared as previously described (Ren, B. et al. (2002), supra; Oberley, M.J. et al. (2004), supra), T4 DNA ligase 10X buffer (Roche;
- Genomic LA Polymerase Mix (Clontech; Saint-Germain-en-Laye, France) ( Figure 5).
- the thermal cycling conditions applied were 94 °C for 1 minute, 20 cycles at (94 °C for
- Examples 1 and 2 were used in the development and validation of a noninvasive diagnostic test for trisomy 21 (referred to herein as NID21).
- NID21 trisomy 21
- a flowchart diagram of the methodology is shown in Figure 6. The diagram shows the experimental procedure followed using 20 normal and 20 trisomy 21 cases towards the development and validation of the NID21 test.
- NID21 test two additional regions located on chromosomes 13 and 22 were used as hypermethylated and hypomethylated controls respectively.
- the selection criteria of the 12 regions were based firstly on the methylation status of the regions in peripheral blood and placental DNA samples. More specifically, the selected regions should demonstrate a hypermethylated status in placenta and hypomethylated status in peripheral blood. Secondly, the regions selected should have common methylation status between first and third trimester placentas in order to ensure the tissue specificity of the methylation status.
- the level of differential methylation observed for these regions must be above the value of "1" in a logarithmic scale in order to ensure efficient discrimination of the methylation status when testing minute amounts of hypermethylated DNA samples presented in a high background of hypomethylated DNA.
- the selected DMRs can be used as DMRs for the NID21 test.
- similar evaluation to that described herein can identify other DMRs from the lists shown in Appendices A-E that can be used for NID21 test.
- evaluation and selection of DMRs can be used in a similar or different methodology for NIPD of aneuploidies of chromosomes 13, 18, X and Y.
- NID21 test For the purpose of the development of NID21 test, we have used 20 maternal peripheral blood samples from women baring a normal fetus and 20 maternal peripheral blood samples from women baring a Down Syndrome (trisomy 21) fetus (T21 fetus). All the maternal peripheral blood DNA samples were obtained from first trimester pregnancies at the "Cyprus Institute of Neurology and Genetics" through collaboration with Centers in Cyprus and in Greece. Consent forms approved by the Cyprus National Bioethics Committee were collected for each of the samples participated.
- DNA was extracted from all samples using the QIAamp DNA blood Midi Kit (Qiagen; West Wales, UK).
- the isolated DNA from the 20 maternal peripheral blood samples from women baring a normal fetus and 20 maternal peripheral blood samples from women baring a T21 fetus was processed for DNA fragmentation, linker annealing, MeDiP and LM-PCR resulting the Input and IP DNA fragments as shown in Figure 6.
- the above methodologies are described in Examples 1 and 2.
- Real Time qPCR and Data Evaluation Real Time qPCR was applied in all 40 maternal peripheral blood samples in all Input and IP fragments for the 12 pre-selected DMRs on chromosome 21 and two control regions on chromosomes 13 and 22 ( Figure 6). Initially, primers specific for the regions of interest were designed using the primer3 web site ( tt : Hi rodo .wi.mit.edu/.) Primers used real time qPCR are shown below in Table 7.
- Table 7 The primers designed for the regions tested on chromosome 21 and control regions on chromosomes 13 and 22.
- the primer design was optimized to give a product of 80-150bp in length as recommended for optimal SYBR Green fluorescence melting curve analysis.
- the Tm of all the primers was chosen to be close to 60°C.
- the nucleotide sequences of the twelve DMRs (EP1-EP12) amplified by the primers set forth in Table 7 are shown below in Table 8, along with the nucleotide sequences of the two control regions (HYP1 13 and Ul 22 ).
- Table 8 The nucleotide sequences of the regions tested on chromosome 21 and control regions on chromosomes 13 and 22.
- the above normalization is carried out for every sample and every one of the selected DMRs and controls separately.
- Norm Normalized The normalized values obtained from the control primers correspond to the methylation enrichment of every control region in each of the "test samples".
- the Median Ratio Values obtained from the DMRs were ranked in a descending order, showing the degree of separation between Normal and Trisomy 21 cases.
- DA Discriminant Analysis
- DA generates functions from a sample of cases for which group membership is known; the functions can then be applied to new cases with measurements for the predictor variables but unknown group membership.
- a "linear discriminant equation”, is constructed such that the two groups differ as much as possible on D.
- the “linear discriminant equation” is the following:
- the "a” and “b” are values that have been calculated using the set of known samples and are used to construct the equation.
- Each "b” value is specific for one DMR and therefore in every new case classification the "X" Value of a specific DMR is multiplied by the "b” value of the same DMR previously calculated. Due to equal representation of normal and trisomy 21 cases in our study (20 normal and 20 trisomy 21 cases), the equation was constructed so that when the D gives a positive value (D >0), then the new case is considered as abnormal (trisomy 21 case) whereas when a negative value (D ⁇ 0) is given then the new case is considered as normal.
- stepwise discriminating analysis in which statistical criteria determine the order of entry.
- stepwise DA employing the most economical selection technique, namely the Wilks lambda criterion.
- F criteria or p criteria criteria for entry and removal
- Example 3 the noninvasive diagnostic test for trisomy 21 set forth in Example 3 is described in further detail. Moreover, the application of this fetal specific methylation ratio approach is shown to provide with 100% accuracy the correct diagnosis of 46 normal and 34 trisomy 21 pregnancies, thereby validating this diagnostic test.
- the 80 samples used were obtained from first trimester pregnancies at the "Cyprus Institute of Neurology and Genetics” through collaboration with gynecology centers in Cyprus and “Mitera” Hospital in Athens, Greece.
- the samples were collected in EDTA tubes and were stored within 6 hours of collection in -80°C until further use. Consent forms approved by the Cyprus National Bioethics Committee were collected from all the participants.
- the 40 samples were tested in groups of six (three normal and three trisomy 21 cases). The median value of three normal samples participated in one experiment were compared only with the trisomy 21 samples of the specific experiment.
- the 12 DMRs were selected based on three criteria. Firstly, they should demonstrate a hypermethylated status in placenta and hypomethylated status in peripheral blood in order to achieve fetal specific DNA methylation enrichment and therefore increase the amount of ffDNA in maternal circulation. Secondly, they should have common methylation status between first and third trimester placentas in order to ensure the tissue specificity of the methylation status.
- the level of differential methylation observed for these DMRs must be above the value of "1" in a logarithmic scale in at least one of the oligonucleotide probes included in the region.
- two additional regions located on chromosomes 13 (HYP1 13 ) and 22 (Ul 22 ) were used as hypermethylated and hypomethylated controls respectively, as described in Example 3.
- DNA was extracted from 1 ml of each sample using the QIAamp DNA blood Midi Kit (Qiagen; West Wales, UK). The isolated DNAs from 80 samples were processed for immunoprecipitation of methylated sites as described in Examples 1-3. Briefly, 2 ⁇ g of DNA were sheared by sonication into fragments of approximately 300bp-1000bp in size. The fragmented DNA was blunt-ended and annealed linkers were added to both ends generated. A total of 50 ng of ligated DNA from each sample was removed and retained for use as Input genomic control DNA. The remaining ligated DNA samples (800ng-l ⁇ g) were subjected to MeDiP as described in Examples 1-3. Finally, Ligation-Mediated PCR (LM-PCR) reactions were performed using 10 ng of each Input and IP DNA fraction to increase the amount of DNA.
- LM-PCR Ligation-Mediated PCR
- the 40 samples with known karyotype were used to evaluate the degree of discrimination of the 12 selected DMRs.
- the fetal specific methylation ratio values of the 20 normal cases were compared to the ratio values of the 20 trisomy 21 cases for each of the 12 DMRs.
- the Real Time qPCR as described above provided the C T values for all Input and IP fragments.
- the C T values obtained underwent a series of normalization steps. Initially, the average C T value of the triplicate Real Time qPCR reactions was calculated for each Input and IP sample. Then, the efficiency of the PCR reactions performed during the MeDiP and LM-PCR applications was normalized using the formula: AC Normal _ Q fB Normal Input
- the normalized values obtained from the control primers correspond to the methylation enrichment of every control region in each of the tested samples.
- Ratio Value Samp,e; DMR Norm AC T PB Samp,e (Normal or T21) / Median (Norm AC T PB Normal )
- the ratio value of normal cases should be 1 and 1.5 for trisomy 21 cases.
- the observed ratios are usually of a smaller value for normal cases and of a higher value for trisomy 21 cases as a result of inter- individual variability of the methylation levels (as described in Example 1) as well as due to the presence of maternal DNA background.
- DA Discriminant Analysis
- stepwise DA employing the most economical selection technique, namely the Wilks lambda criterion.
- F criteria a number of criteria need to be fulfilled.
- the criteria are set by calculating the maximum significance of F for a DMR in order to enable the inclusion of the DMR to the final model and the minimum significance of F for a DMR to be removed from the final model.
- Samples P1-P40 are the samples with known karyotype used to create the Prediction Equation, whereas samples P41-P80 are the samples participated in the blind study.
- Samples PI -20 and P41-P66 are samples obtained from women bearing a normal fetus whereas samples P21-P40 and P67-P80 are samples obtained from women baring a fetus with trisomy 21.
- high methylation enrichment was observed when testing the HYP1 13 control region indicating a hypermethylated status with values of 3.15 fold change or above in both normal and trisomy 21 cases.
- testing the UI 22 control region a hypomethylated status was shown as expected in both normal and trisomy 21 cases with values of 0.51 fold change or below. Efficiency of the fetal specific DNA methylation ratio approach
- the fetal specific methylation ratio approach used herein is illustrated schematically in Figure 7, wherein the ability to discriminate normal from trisomy 21 cases is achieved by comparing the ratio values obtained from normal and trisomy 21 cases using fetal specific methylated regions located on chromosome 21.
- the fetus with trisomy 21 has an extra copy of the fetal specific methylated region compared to the normal fetus.
- the amount of fetal DNA increases in maternal circulation.
- the amount of fetal specific methylated regions will increase more in fetuses with trisomy 21 compared to normal cases due to the extra copy of the region.
- the maternal peripheral blood ratio of normal control cases with a normal testing sample will deviate from the ratio value of normal control cases in comparison to trisomy 21 cases.
- Table 9 Summary of fetal specific methylation ratio values obtained for each of the 12 selected DMRs from each of the 40 samples with known karyotype
- the normal cases have median ratio values at or below the value of 1.00, whereas the trisomy 21 cases have median ratio values above the value of 1.00 with the exception of EP8 (which exhibited a wide range of methylation ratio values) and EP11.
- Figure 9 shows a BoxPlot representation of the results obtained from four DMRs, EPl, EP4, EP7 and EP10 in normal and trisomy 21 cases.
- the boxplots depict the 5-number summaries, namely the minimum and maximum values, the upper (Q3) and lower (Q quartiles, and the median.
- the median is identified by a line inside the box.
- Statistical analysis depict the 5-number summaries, namely the minimum and maximum values, the upper (Q3) and lower (Q quartiles, and the median.
- the median is identified by a line inside the box.
- the length of the box represents the inter
- DMRs that can discriminate efficiently normal cases from trisomy 21 cases such as EP1, EP4, EP7 and EP10 (p ⁇ 0.001) show a clear separation of the range of values obtained from normal cases compared to the ones obtained from trisomy 21 cases.
- DMRs which are not statistically significant such as EP8 and EP11
- the median values obtained from both normal and trisomy 21 cases are close to the value of 1.00.
- the median value is 1.00 in normal cases and 0.94 in trisomy 21 cases.
- Table 12 Prediction values obtained from 40 samples with known karyotype when using the prediction equation.
- Multivariate normality of the predictors is assumed but it has easily been tested for all predictors involved.
- the appropriate confidence intervals for skewness and kyrtosis cover at least partly the range (-1, 1) which is the range for a normally distributed variable.
- the outliers the usual Mahalanobis distance between each case and the centroid of the group which the case belongs to has been evaluated. No significant deviations have been reported and no indication of any influential observations was found.
- the assumption of homogeneous covariance matrices for groups defined by the dependent variable only affects the classification phase of the discriminant analysis and is evaluated via the Box's M test.
- Multicollinearity occurs when one predictor is so strongly correlated with one or more other predictors so that its relationship to the dependent variable is likely to be misinterpreted. As a result, its potential unique contribution to explaining the dependent variable is minimized by its strong relationship to other predictors. Multicollinearity is indicated when the tolerance value for an independent variable is less than 0.10. The tolerance values for all independent variables in the resulting DA function are larger than 0.10. Multicollinearity is not a problem in this discriminant analysis.
- the specificity and sensitivity of the methodology was re-evaluated by performing a blind study consisting of 40 samples.
- the blind study was performed by evaluating the methylation status of the 8 DMRs which constituted the prediction equation.
- the ratio values obtained from the 8 DMRs for the 40 samples in the blind study were applied to the prediction equation for each sample separately in order to reveal the D value which determines the status of the sample (normal or trisomy 21).
- a total of 26 cases have given a negative D value and 14 cases a positive D value. Therefore, according to the prediction equation 26 of these cases are normal and 14 are trisomy 21, as summarized below in Table 13:
- Table 13 Prediction values obtained from the 40 samples participated in the blind study when using the prediction equation.
- RNA-SNP study included only 10 trisomy 21 cases in the range of 12-20 weeks with one of the trisomy 21 cases being incorrectly classified. In our study a total number of 40 samples with known karyotype (20 normal and 20 with trisomy 21) as well as 40 blind samples (26 normal and 14 with trisomy 21), were correctly classified providing 100%
- SEQ ID NO: 4 CCACCGTCACTGTTCCTAGA
- SEQ ID NO: 6 GAGGAAACAGCTTGGCTCTG
- SEQ ID NO: 7 CTGTTGCATGAGAGCAGAGG
- SEQ ID NO: 8 CGTCCCCCTCGCTACTATCT
- SEQ ID NO: 10 CTGTGCCGGTAGAAATGGTT
- SEQ ID NO: 11 TGAATCAGTTCACCGACAGC
- SEQ ID NO: 12 GAAACAACCTGGCCATTCTC
- SEQ ID NO: 13 CCGTTATATGGATGCCTTGG
- SEQ ID NO: 14 AAACTGTTGGGCTGAACTGC
- SEQ ID NO: 15 CCAGGCAAGATGGCTTATGT
- SEQ ID NO: 16 ACCATGCTCAGCCAATTTTT
- SEQ ID NO: 17 GACCCAGACGATACCTGGAA
- SEQ ID NO: 18 GCTGAACAAAACTCGGCTTC
- SEQ ID NO: 20 TTCCACAGACAGCAGAGACG
- SEQ ID NO: 21 TGAGCTCACAGGTCTGGAAA
- SEQ ID NO: 22 CCCCACAGGGTTCTGGTAAT
- SEQ ID NO: 23 ATTCTCCACAGGGCAATGAG
- SEQ ID NO: 24 TTATGTGGCCTTTCCTCCTG
- SEQ ID NO: 25 CAGGAAAGTGAAGGGAGCTG
- SEQ ID NO: 26 CAAAACCCAATGGTCAATCC
- SEQ ID NO: 27 AATGATTGTGCAGGTGGTGA
- SEQ ID NO: 28 GAGCGCCTTGAGTAGAGGAA
- SEQ ID NO: 29 AAGGTGCCCAATTCAAGGTA
- SEQ ID NO: 30 CTTCCCCACCAGTCTTGAAA
- SEQ ID NO: 31 TGAGAGCGGATGACAGATTG
- SEQ ID NO: 32 GGTCCCTCCCTTTTCTGTCT
- SEQ ID NO: 33 GCTGGACCAGAAAGTGTTGAGTACCTGCTCATGCGTGCAAGAG
- SEQ ID NO: 34 GGTCGAGTTTTTGGTGGTGTTGAGCGGATAGCCGGGGAAGTTG
- SEQ ID NO: 35 CCTCGTGCTCGTGTCTGTATCTAAGATCCTCAGGCTGCTCCTTT
- SEQ ID NO: 36 CTGTTGCATGAGAGCAGAGGGGAGATAGAGAGCTTAATTATA
- SEQ ID NO: 37 TGCAGGATATTTGGCAAGGTTTCTTACTGTTCCAAGTTTTTTTTCC
- SEQ ID NO: 39 CCGTTATATGGATGCCTTGGGGCTTGGGGGGTTTCTGGCAGTC
- SEQ ID NO: 40 CC AG G C A AG ATG G CTT ATGTCTTT AATCTC AG CTGTTTG G G AAG
- SEQ ID NO: 41 GACCCAGACGATACCTGGAAATTATTTGCTCATGTGGCAGTCAC TGTTGATTGCCTACCCAAAGCCATTACTCCTTCTCCCCACCTAA CAGAAGCCGAGTTTTGTTCAGC
- SEQ ID NO: 42 CCACATCCTGGCCATCTACTTCCTCTTAAACAAGAAACTGGAGC
- SEQ ID NO: 43 TGAGCTCACAGGTCTGGAAATGGTCTGAATAGAAAGGATTGGTC
- SEQ ID NO: 44 ATTCTCC AC AG G G C A ATG AG G C A AG A A ATTT AC AG CTT AG CCTG A
- SEQ ID NO: 45 CAGGAAAGTGAAGGGAGCTGCCATCTGCATCAAACGCTGCTGAT
- SEQ ID NO: 46 AAGGTGCCCAATTCAAGGTATATAACCTTTAAGCAGCTTTAACAC
- the chromosomal position was obtained from UCSC genome browser (http://genome.ucsc.edu/) build 36. Appendix A; Chromosome 21
- the chromosomal position was obtained from UCSC genome browser (http://genome.ucsc.edu/) build 36. Appendix A; Chromosome 21
- the chromosomal position was obtained from UCSC genome browser (http://genome.ucsc.edu/) build 36. Appendix A; Chromosome 21
- chromosomal positon was obtained from UCSC genome browser (http://genome.ucsc.edu/) build 36.
- APPENDIX B Chromosome 13
- the chromosomal positon was obtained from UCSC genome browser (http://genome.ucsc.edu/) build 36.
- chromosomal positon was obtained from UCSC genome browser (http://genome.ucsc.edu/) build 36.
- APPENDIX B Chromosome 13
- chromosomal positon was obtained from UCSC genome browser (http://genome.ucsc.edu/) build 36.
- APPENDIX B Chromosome 13
- chromosomal positon was obtained from UCSC genome browser (http://genome.ucsc.edu/) build 36.
- APPENDIX B Chromosome 13
- chromosomal positon was obtained from UCSC genome browser (http://genome.ucsc.edu/) build 36.
- APPENDIX B Chromosome 13
- chromosomal positon was obtained from UCSC genome browser (http://genome.ucsc.edu/) build 36.
- APPENDIX B Chromosome 13
- chromosomal positon was obtained from UCSC genome browser (http://genome.ucsc.edu/) build 36.
- APPENDIX B Chromosome 13
- chromosomal positon was obtained from UCSC genome browser (http://genome.ucsc.edu/) build 36.
- APPENDIX B Chromosome 13
- chromosomal positon was obtained from UCSC genome browser (http://genome.ucsc.edu/) build 36.
- APPENDIX B Chromosome 13
- chromosomal positon was obtained from UCSC genome browser (http://genome.ucsc.edu/) build 36.
- APPENDIX B Chromosome 13
- chromosomal positon was obtained from UCSC genome browser (http://genome.ucsc.edu/) build 36.
- APPENDIX B Chromosome 13
- chromosomal positon was obtained from UCSC genome browser (http://genome.ucsc.edu/) build 36.
- APPENDIX B Chromosome 13
- chromosomal positon was obtained from UCSC genome browser (http://genome.ucsc.edu/) build 36.
- APPENDIX B Chromosome 13
- chromosomal positon was obtained from UCSC genome browser (http://genome.ucsc.edu/) build 36.
- APPENDIX B Chromosome 13
- chromosomal positon was obtained from UCSC genome browser (http://genome.ucsc.edu/) build 36.
- APPENDIX B Chromosome 13
- chromosomal positon was obtained from UCSC genome browser (http://genome.ucsc.edu/) build 36.
- APPENDIX B Chromosome 13
- chromosomal positon was obtained from UCSC genome browser (http://genome.ucsc.edu/) build 36.
- APPENDIX B Chromosome 13
- chromosomal positon was obtained from UCSC genome browser (http://genome.ucsc.edu/) build 36.
- APPENDIX B Chromosoine 13
- chromosomal positon was obtained from UCSC genome browser (http://genome.ucsc.edu/) build 36.
- APPENDIX B Chromosome 13
- the chromosomal positon was obtained from UCSC genome browser (http://genome.ucsc.edu/) build 36.
- chromosomal positon was obtained from UCSC genome browser (http://genome.ucsc.edu/) build 36.
- APPENDIX B Chromosome 13
- chromosomal positon was obtained from UCSC genome browser (http://genome.ucsc.edu/) build 36.
- APPENDIX B Chromosome 13
- chromosomal positon was obtained from UCSC genome browser (http://genome.ucsc.edu/) build 36.
- APPENDIX B Chromosome 13
- chromosomal positon was obtained from UCSC genome browser (http://genome.ucsc.edu/) build 36.
- APPENDIX B Chromosome 13
- chromosomal positon was obtained from UCSC genome browser (http://genome.ucsc.edu/) build 36.
- APPENDIX B Chromosome 13
- chromosomal positon was obtained from UCSC genome browser (http://genome.ucsc.edu/) build 36.
- APPENDIX B Chromosome 13
- chromosomal positon was obtained from UCSC genome browser (http://genome.ucsc.edu/) build 36.
- APPENDIX B Chromosome 13
- chromosomal positon was obtained from UCSC genome browser (http://genome.ucsc.edu/) build 36.
- APPENDIX B Chromosome 13
- chromosomal positon was obtained from UCSC genome browser (http://genome.ucsc.edu/) build 36.
- APPENDIX B Chromosome 13
- chromosomal positon was obtained from UCSC genome browser (http://genome.ucsc.edu/) build 36.
- APPENDIX B Chromosome 13
- chromosomal positon was obtained from UCSC genome browser (http://genome.ucsc.edu/) build 36.
- APPENDIX B Chromosome 13
- chromosomal positon was obtained from UCSC genome browser (http://genome.ucsc.edu/) build 36.
- APPENDIX B Chromosome
- chromosomal positon was obtained from UCSC genome browser (http://genome.ucsc.edu/) build 36.
- APPENDIX B Chromosome 13
- chromosomal positon was obtained from UCSC genome browser (http://genome.ucsc.edu/) build 36.
- APPENDIX B Chromosome 13
- chromosomal positon was obtained from UCSC genome browser (http://genome.ucsc.edu/) build 36.
- APPENDIX B Chromosome 13
- chromosomal positon was obtained from UCSC genome browser (http://genome.ucsc.edu/) build 36.
- APPENDIX B Chromosome 13
- chromosomal positon was obtained from UCSC genome browser (http://genome.ucsc.edu/) build 36.
- APPENDIX B Chromosome 13
- chromosomal positon was obtained from UCSC genome browser (http://genome.ucsc.edu/) build 36.
- APPENDIX B Chromosome 13
- chromosomal positon was obtained from UCSC genome browser (http://genome.ucsc.edu/) build 36.
- APPENDIX B Chromosome 13
- chromosomal positon was obtained from UCSC genome browser (http://genome.ucsc.edu/) build 36.
- APPENDIX B Chromosome 13
- chromosomal positon was obtained from UCSC genome browser (http://genome.ucsc.edu/) build 36.
- APPENDIX B Chromosome 13
- chromosomal positon was obtained from UCSC genome browser (http://genome.ucsc.edu/) build 36.
- APPENDIX C Chromosome 18
- chromosomal positon was obtained from UCSC genome browser (http://genome.ucsc.edu/) build 36.
- APPENDIX C Chromosome 18
- chromosomal positon was obtained from UCSC genome browser (http://genome.ucsc.edu/) build 36.
- APPENDIX C Chromosome 18
- chromosomal positon was obtained from UCSC genome browser (http://genome.ucsc.edu/) build 36.
- APPENDIX C Chromosome 18
- chromosomal positon was obtained from UCSC genome browser (http://genome.ucsc.edu/) build 36.
- APPENDIX C Chromosome 18
- chromosomal positon was obtained from UCSC genome browser (http://genome.ucsc.edu/) build 36.
- APPENDIX C Chromosome 18
- chromosomal positon was obtained from UCSC genome browser (http://genome.ucsc.edu/) build 36.
- APPENDIX C Chromosome 18
- chromosomal positon was obtained from UCSC genome browser (http://genome.ucsc.edu/) build 36.
- APPENDIX C Chromosome 18
- chromosomal positon was obtained from UCSC genome browser (http://genome.ucsc.edu/) build 36.
- APPENDIX C Chromosome 18
- chromosomal positon was obtained from UCSC genome browser (http://genome.ucsc.edu/) build 36.
- APPENDIX C Chromosome 18
- chromosomal positon was obtained from UCSC genome browser (http://genome.ucsc.edu/) build 36.
- APPENDIX C Chromosome 18
- chromosomal positon was obtained from UCSC genome browser (http://genome.ucsc.edu/) build 36.
- APPENDIX C Chromosome 18
- chromosomal positon was obtained from UCSC genome browser (http://genome.ucsc.edu/) build 36.
- APPENDIX C Chromosome 18
- chromosomal positon was obtained from UCSC genome browser (http://genome.ucsc.edu/) build 36.
- APPENDIX C Chromosome 18
- chromosomal positon was obtained from UCSC genome browser (http://genome.ucsc.edu/) build 36.
- APPENDIX C Chromosome 18
- chromosomal positon was obtained from UCSC genome browser (http://genome.ucsc.edu/) build 36.
- APPENDIX C Chromosome 18
- chromosomal positon was obtained from UCSC genome browser (http://genome.ucsc.edu/) build 36.
- APPENDIX C Chromosome 18
- chromosomal positon was obtained from UCSC genome browser (http://genome.ucsc.edu/) build 36.
- APPENDIX C Chromosome 18
- chromosomal positon was obtained from UCSC genome browser (http://genome.ucsc.edu/) build 36.
- APPENDIX C Chromosome 18
- chromosomal positon was obtained from UCSC genome browser (http://genome.ucsc.edu/) build 36.
- APPENDIX C Chromosome 18
- chromosomal positon was obtained from UCSC genome browser (http://genome.ucsc.edu/) build 36.
- APPENDIX C Chromosome 18
- chromosomal positon was obtained from UCSC genome browser (http://genome.ucsc.edu/) build 36.
- APPENDIX C Chromosome 18
- chromosomal positon was obtained from UCSC genome browser (http://genome.ucsc.edu/) build 36.
- APPENDIX C Chromosome 18
- the chromosomal positon was obtained from UCSC genome browser (http://genome.ucsc.edu/) build 36.
- chromosomal positon was obtained from UCSC genome browser (http://genome.ucsc.edu/) build 36.
- APPENDIX C Chromosome 18
- chromosomal positon was obtained from UCSC genome browser (http://genome.ucsc.edu/) build 36.
- APPENDIX C Chromosome 18
- chromosomal positon was obtained from UCSC genome browser (http://genome.ucsc.edu/) build 36.
- APPENDIX C Chromosome 18
- chromosomal positon was obtained from UCSC genome browser (http://genome.ucsc.edu/) build 36.
- APPENDIX C Chromosome 18
- chromosomal positon was obtained from UCSC genome browser (http://genome.ucsc.edu/) build 36.
- APPENDIX C Chromosome 18
- chromosomal positon was obtained from UCSC genome browser (http://genome.ucsc.edu/) build 36.
- APPENDIX C Chromosome 18
- chromosomal positon was obtained from UCSC genome browser (http://genome.ucsc.edu/) build 36.
- APPENDIX C Chromosome 18
- chromosomal positon was obtained from UCSC genome browser (http://genome.ucsc.edu/) build 36.
- APPENDIX C Chromosome 18
- chromosomal positon was obtained from UCSC genome browser (http://genome.ucsc.edu/) build 36.
- APPENDIX C Chromosome 18
- chromosomal positon was obtained from UCSC genome browser (http://genome.ucsc.edu/) build 36.
- APPENDIX C Chromosome 18
- chromosomal positon was obtained from UCSC genome browser (http://genome.ucsc.edu/) build 36.
- APPENDIX C Chromosome 18
- chromosomal positon was obtained from UCSC genome browser (http://genome.ucsc.edu/) build 36.
- APPENDIX C Chromosome 18
- chromosomal positon was obtained from UCSC genome browser (http://genome.ucsc.edu/) build 36.
- APPENDIX C Chromosome 18
- chromosomal positon was obtained from UCSC genome browser (http://genome.ucsc.edu/) build 36.
- APPENDIX C Chromosome 18
- chromosomal positon was obtained from UCSC genome browser (http://genome.ucsc.edu/) build 36.
- APPENDIX C Chromosome 18
- chromosomal positon was obtained from UCSC genome browser (http://genome.ucsc.edu/) build 36.
- APPENDIX C Chromosome 18
- chromosomal positon was obtained from UCSC genome browser (http://genome.ucsc.edu/) build 36.
- APPENDIX C Chromosome 18
- chromosomal positon was obtained from UCSC genome browser (http://genome.ucsc.edu/) build 36.
- APPENDIX C Chromosome 18
- chromosomal positon was obtained from UCSC genome browser (http://genome.ucsc.edu/) build 36.
- APPENDIX C Chromosome 18
- chromosomal positon was obtained from UCSC genome browser (http://genome.ucsc.edu/) build 36.
- APPENDIX C Chromosome 18
- chromosomal positon was obtained from UCSC genome browser (http://genome.ucsc.edu/) build 36.
- APPENDIX C Chromosome 18
- chromosomal positon was obtained from UCSC genome browser (http://genome.ucsc.edu/) build 36.
- APPENDIX C Chromosome 18
- chromosomal positon was obtained from UCSC genome browser (http://genome.ucsc.edu/) build 36.
- APPENDIX C Chromosome 18
- chromosomal positon was obtained from UCSC genome browser (http://genome.ucsc.edu/) build 36.
- APPENDIX C Chromosome 18
- chromosomal positon was obtained from UCSC genome browser (http://genome.ucsc.edu/) build 36.
- APPENDIX C Chromosome 18
- chromosomal positon was obtained from UCSC genome browser (http://genome.ucsc.edu/) build 36.
- APPENDIX C Chromosome 18
- chromosomal positon was obtained from UCSC genome browser (http://genome.ucsc.edu/) build 36.
- APPENDIX C Chromosome 18
- chromosomal positon was obtained from UCSC genome browser (http://genome.ucsc.edu/) build 36.
- APPENDIX C Chromosome 18
- chromosomal positon was obtained from UCSC genome browser (http://genome.ucsc.edu/) build 36.
- APPENDIX C Chromosome 18
- chromosomal positon was obtained from UCSC genome browser (http://genome.ucsc.edu/) build 36.
- APPENDIX C Chromosome 18
- chromosomal positon was obtained from UCSC genome browser (http://genome.ucsc.edu/) build 36.
- APPENDIX C Chromosome 18
- chromosomal positon was obtained from UCSC genome browser (http://genome.ucsc.edu/) build 36.
- APPENDIX C Chromosome 18
- chromosomal positon was obtained from UCSC genome browser (http://genome.ucsc.edu/) build 36.
- APPENDIX C Chromosome 18
- chromosomal positon was obtained from UCSC genome browser (http://genome.ucsc.edu/) build 36.
- APPENDIX C Chromosome 18
Abstract
Description


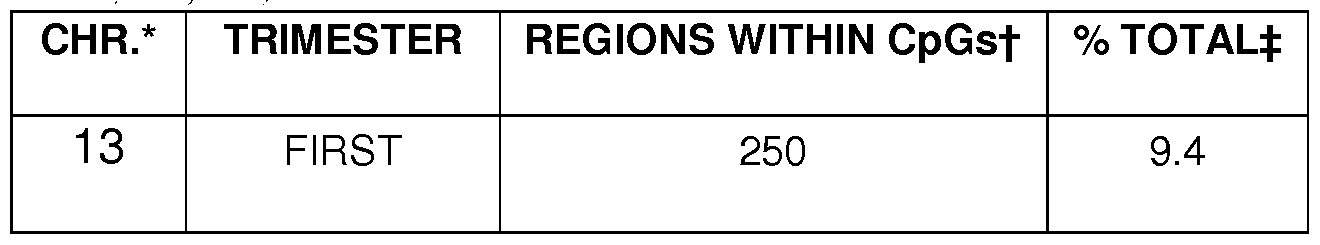


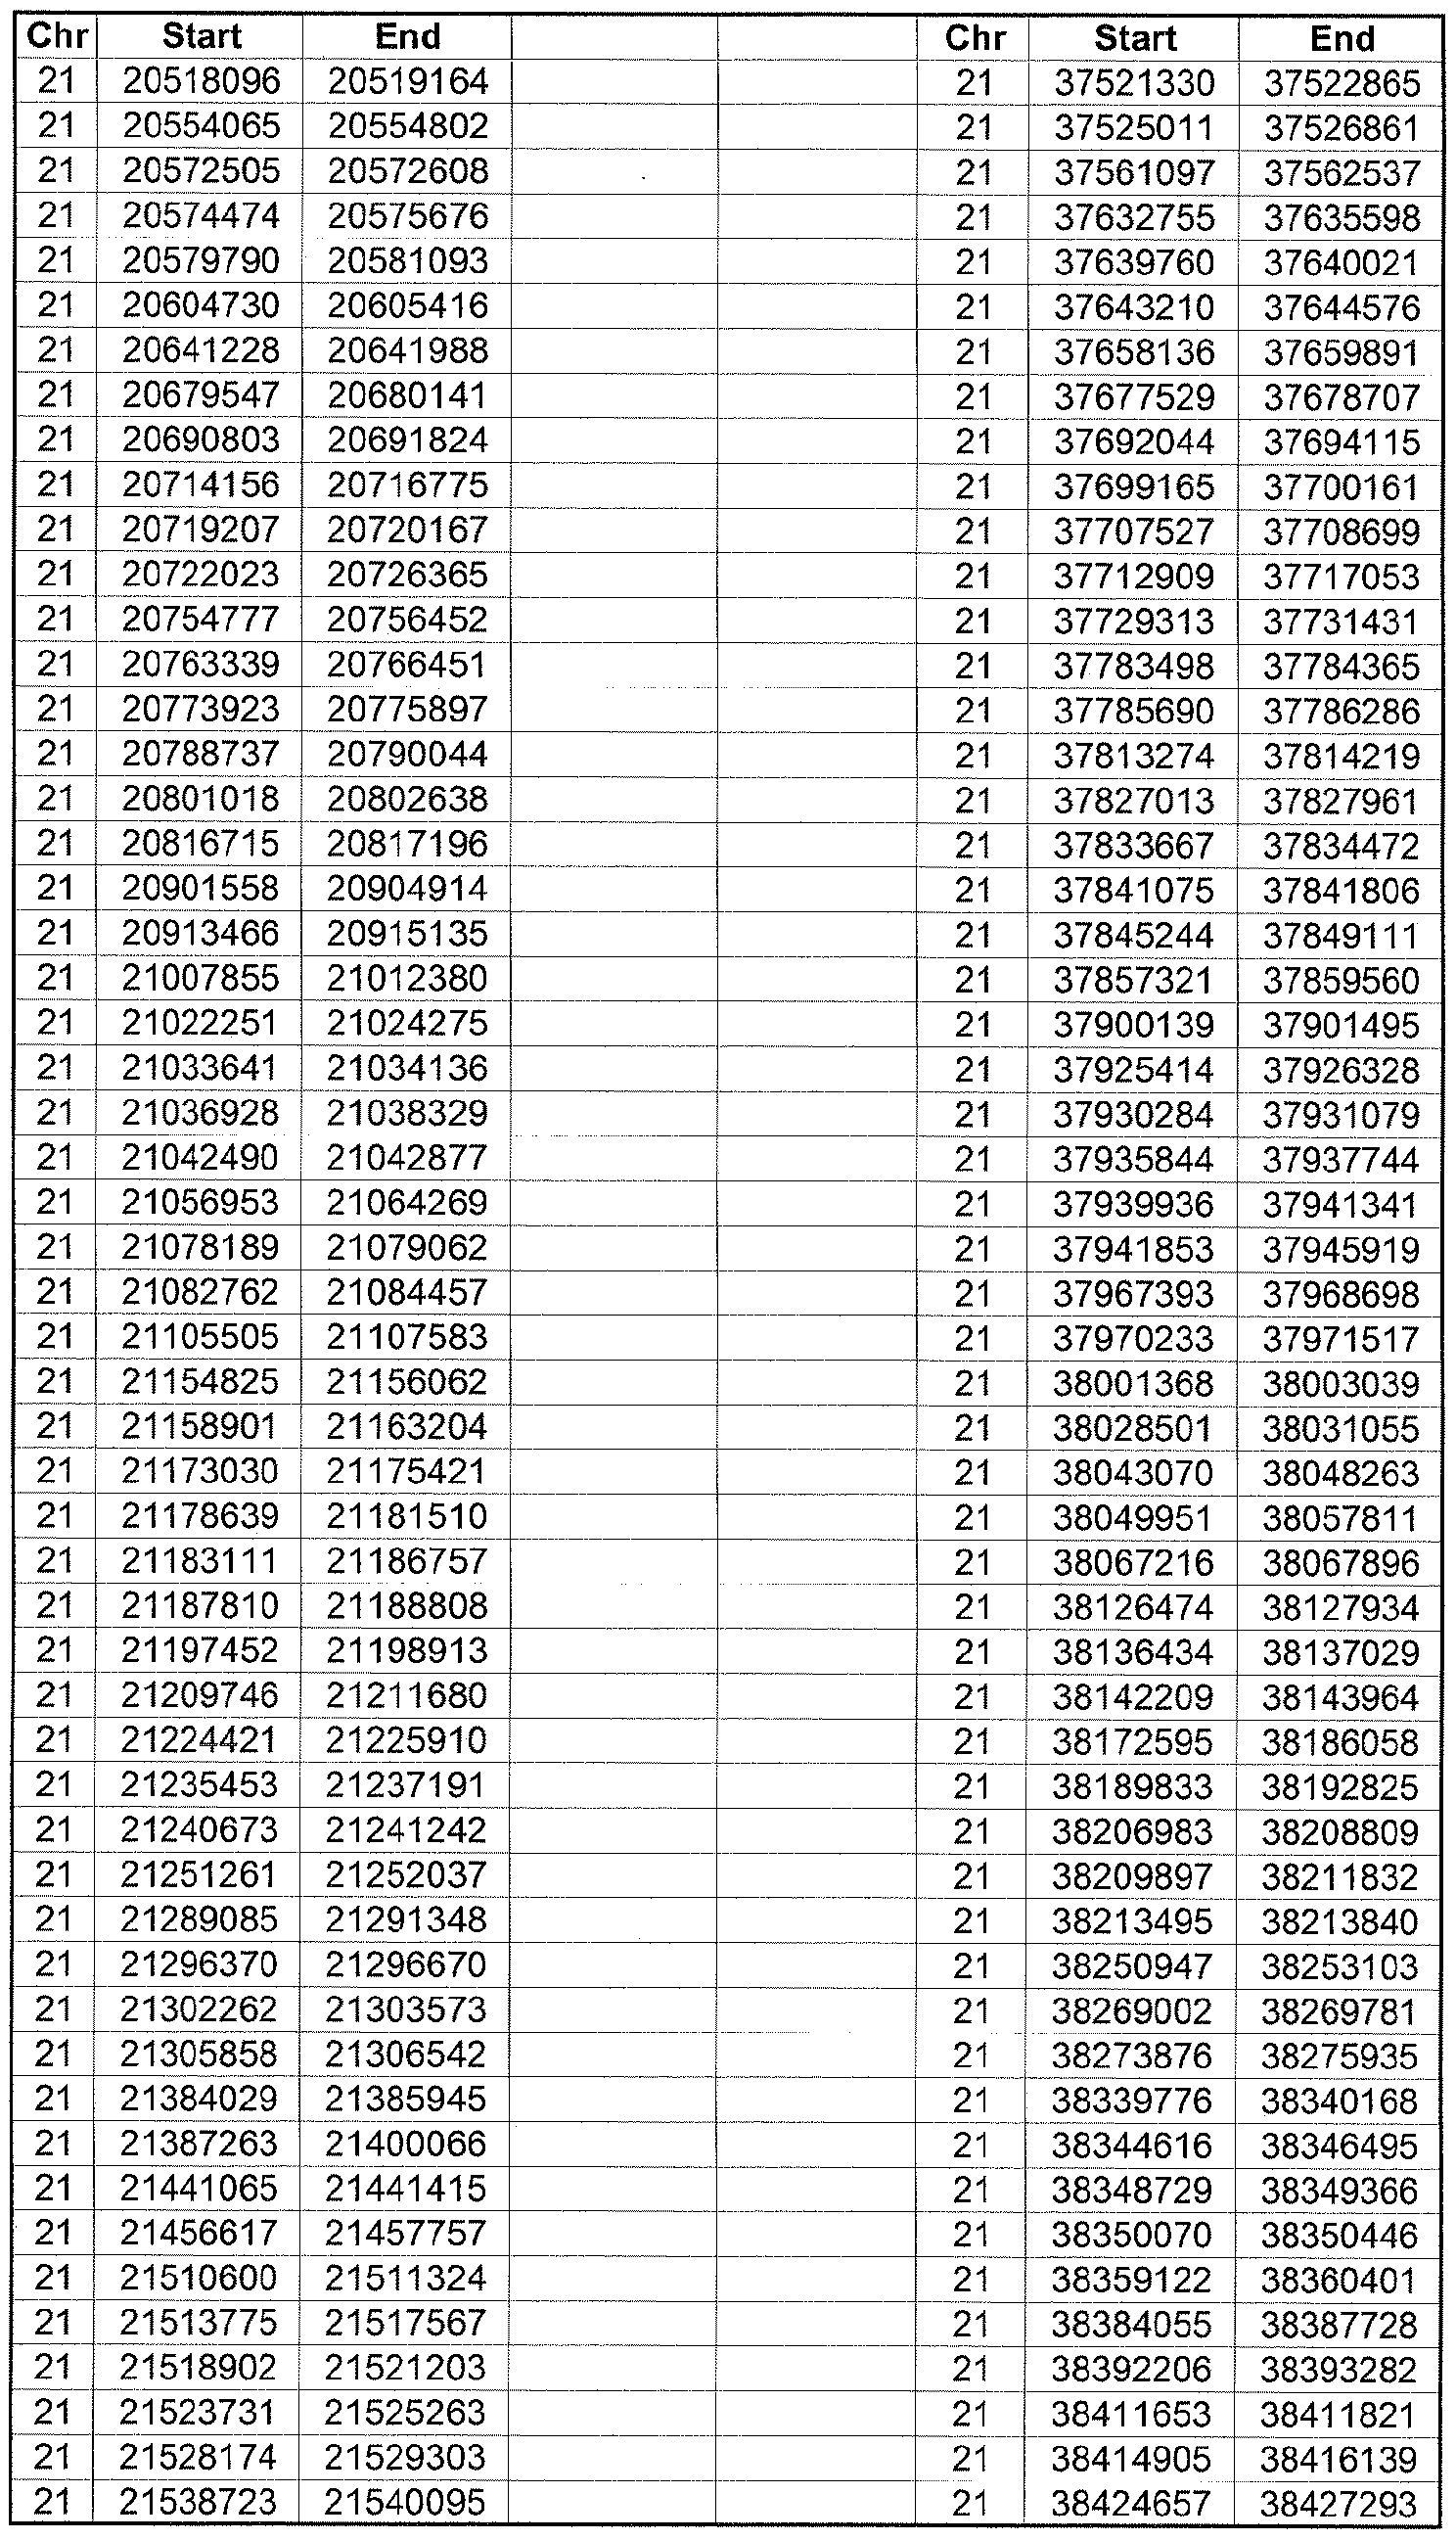


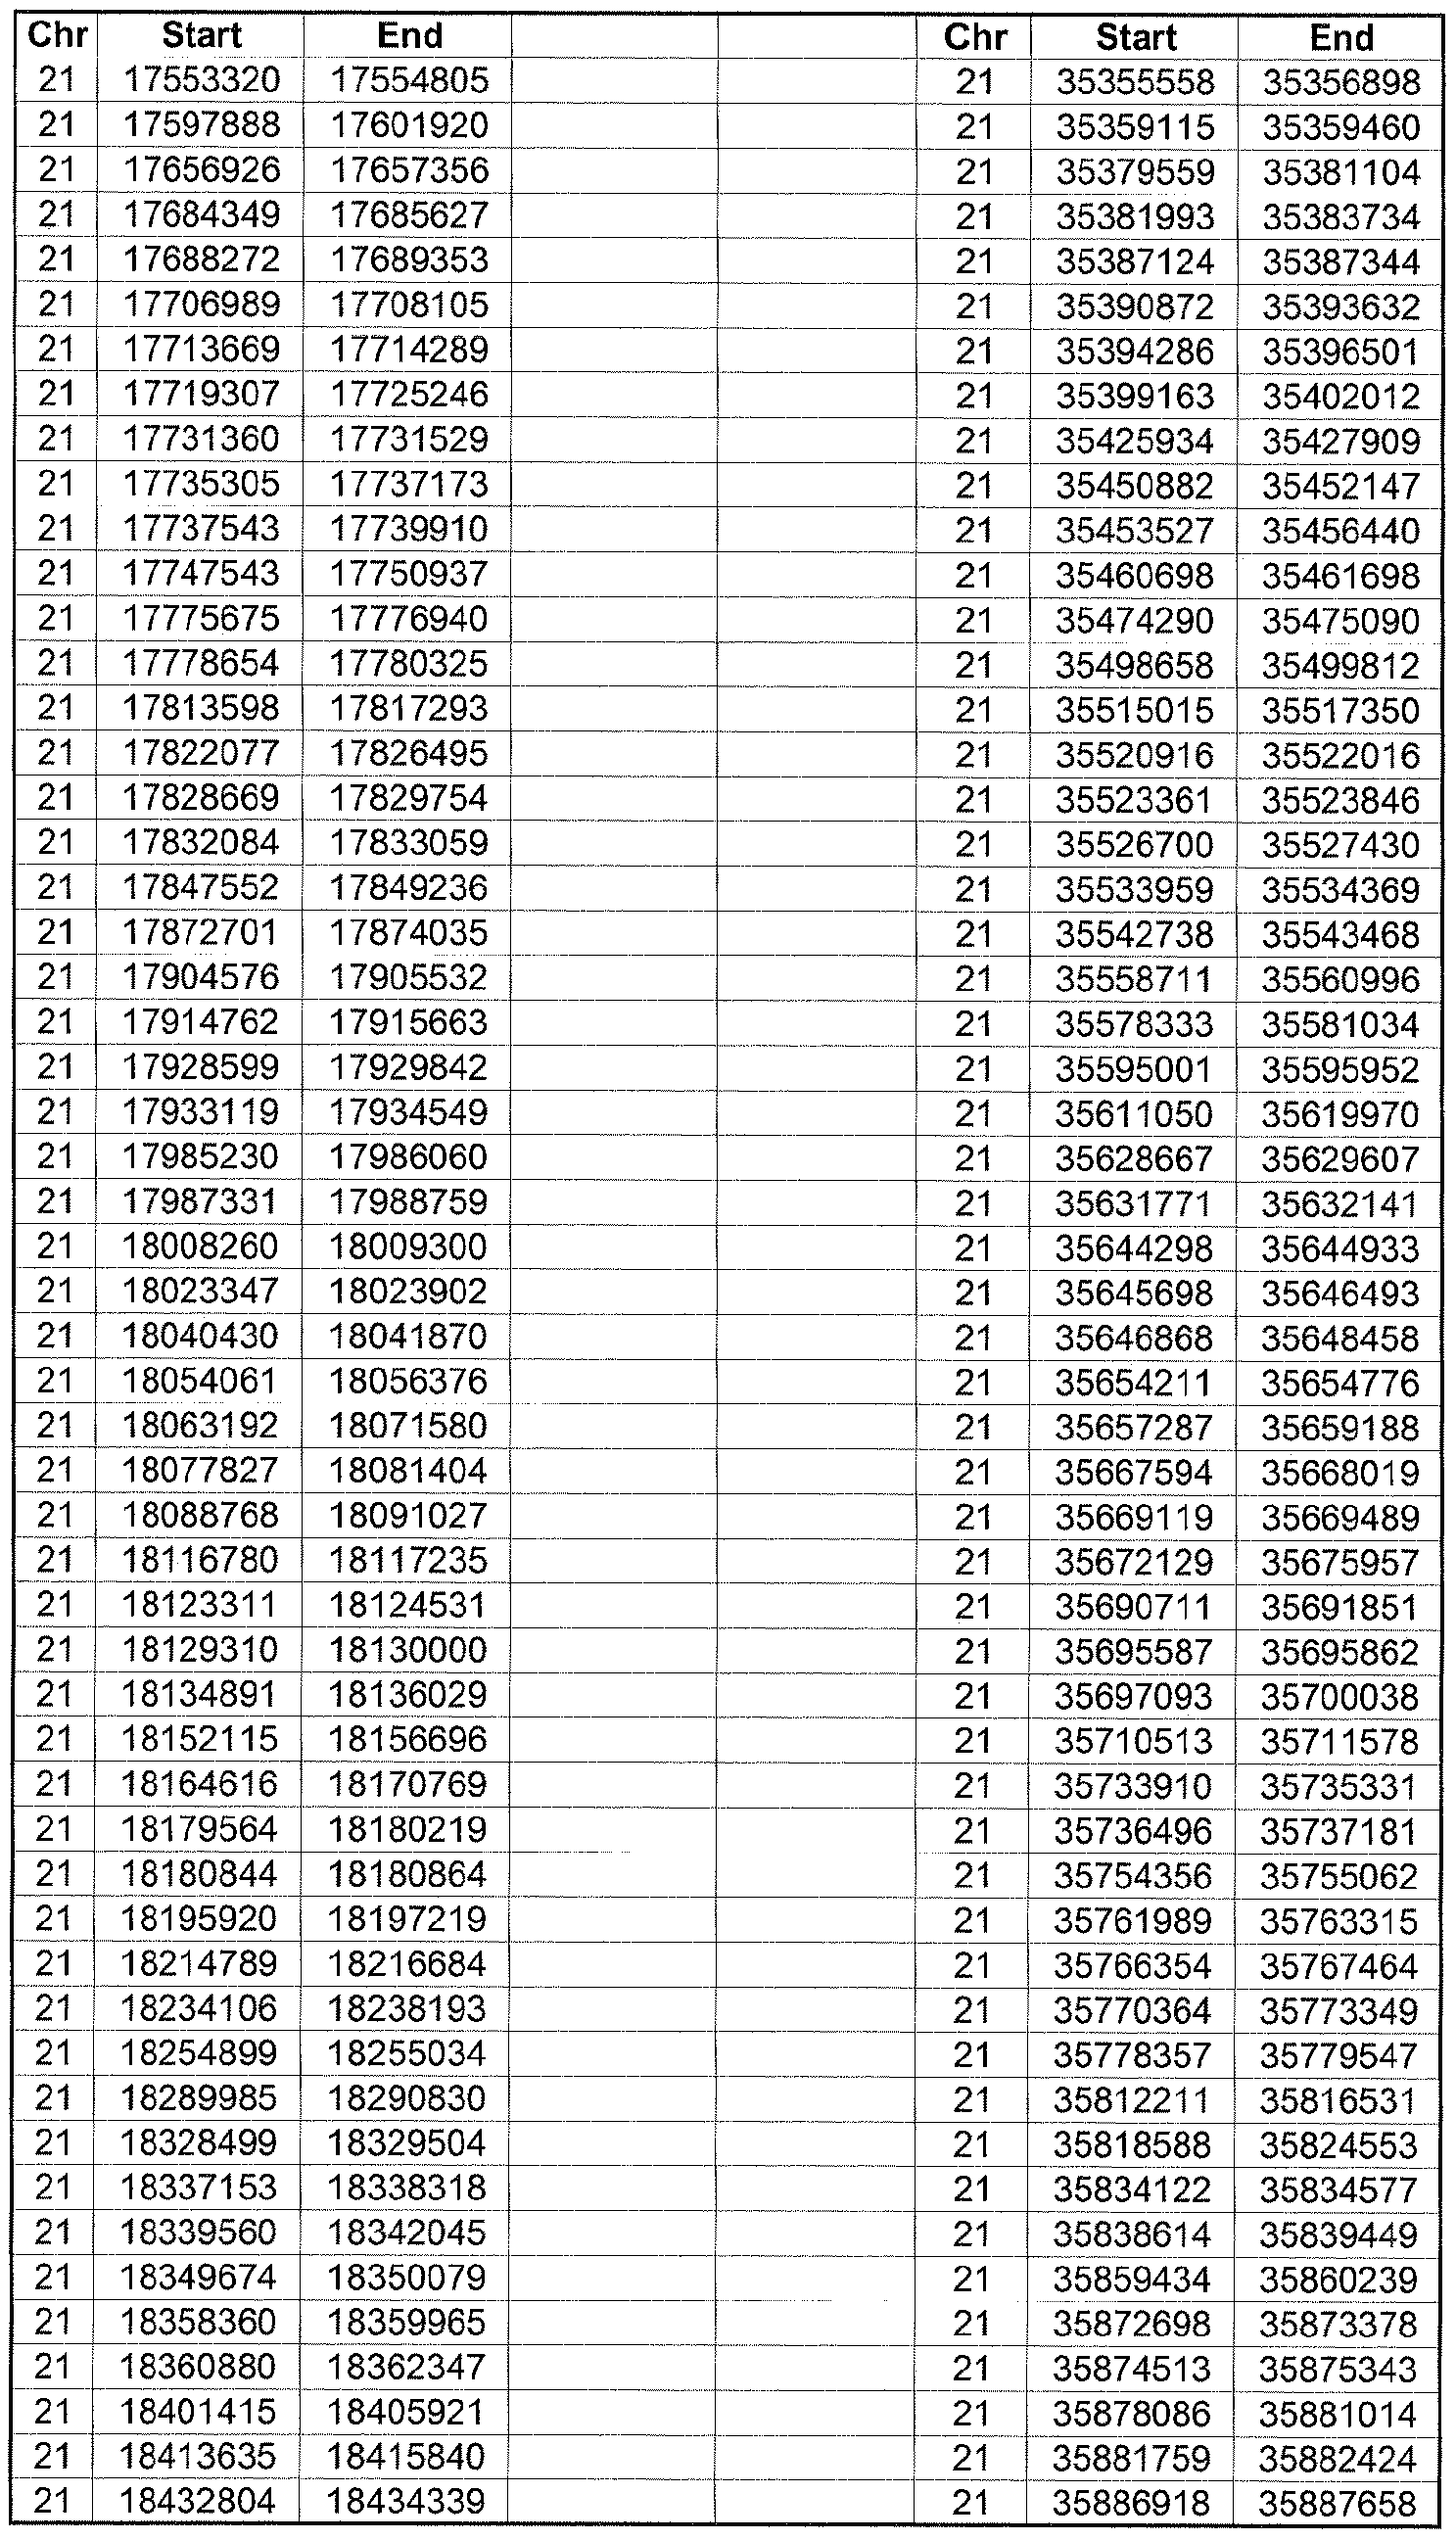


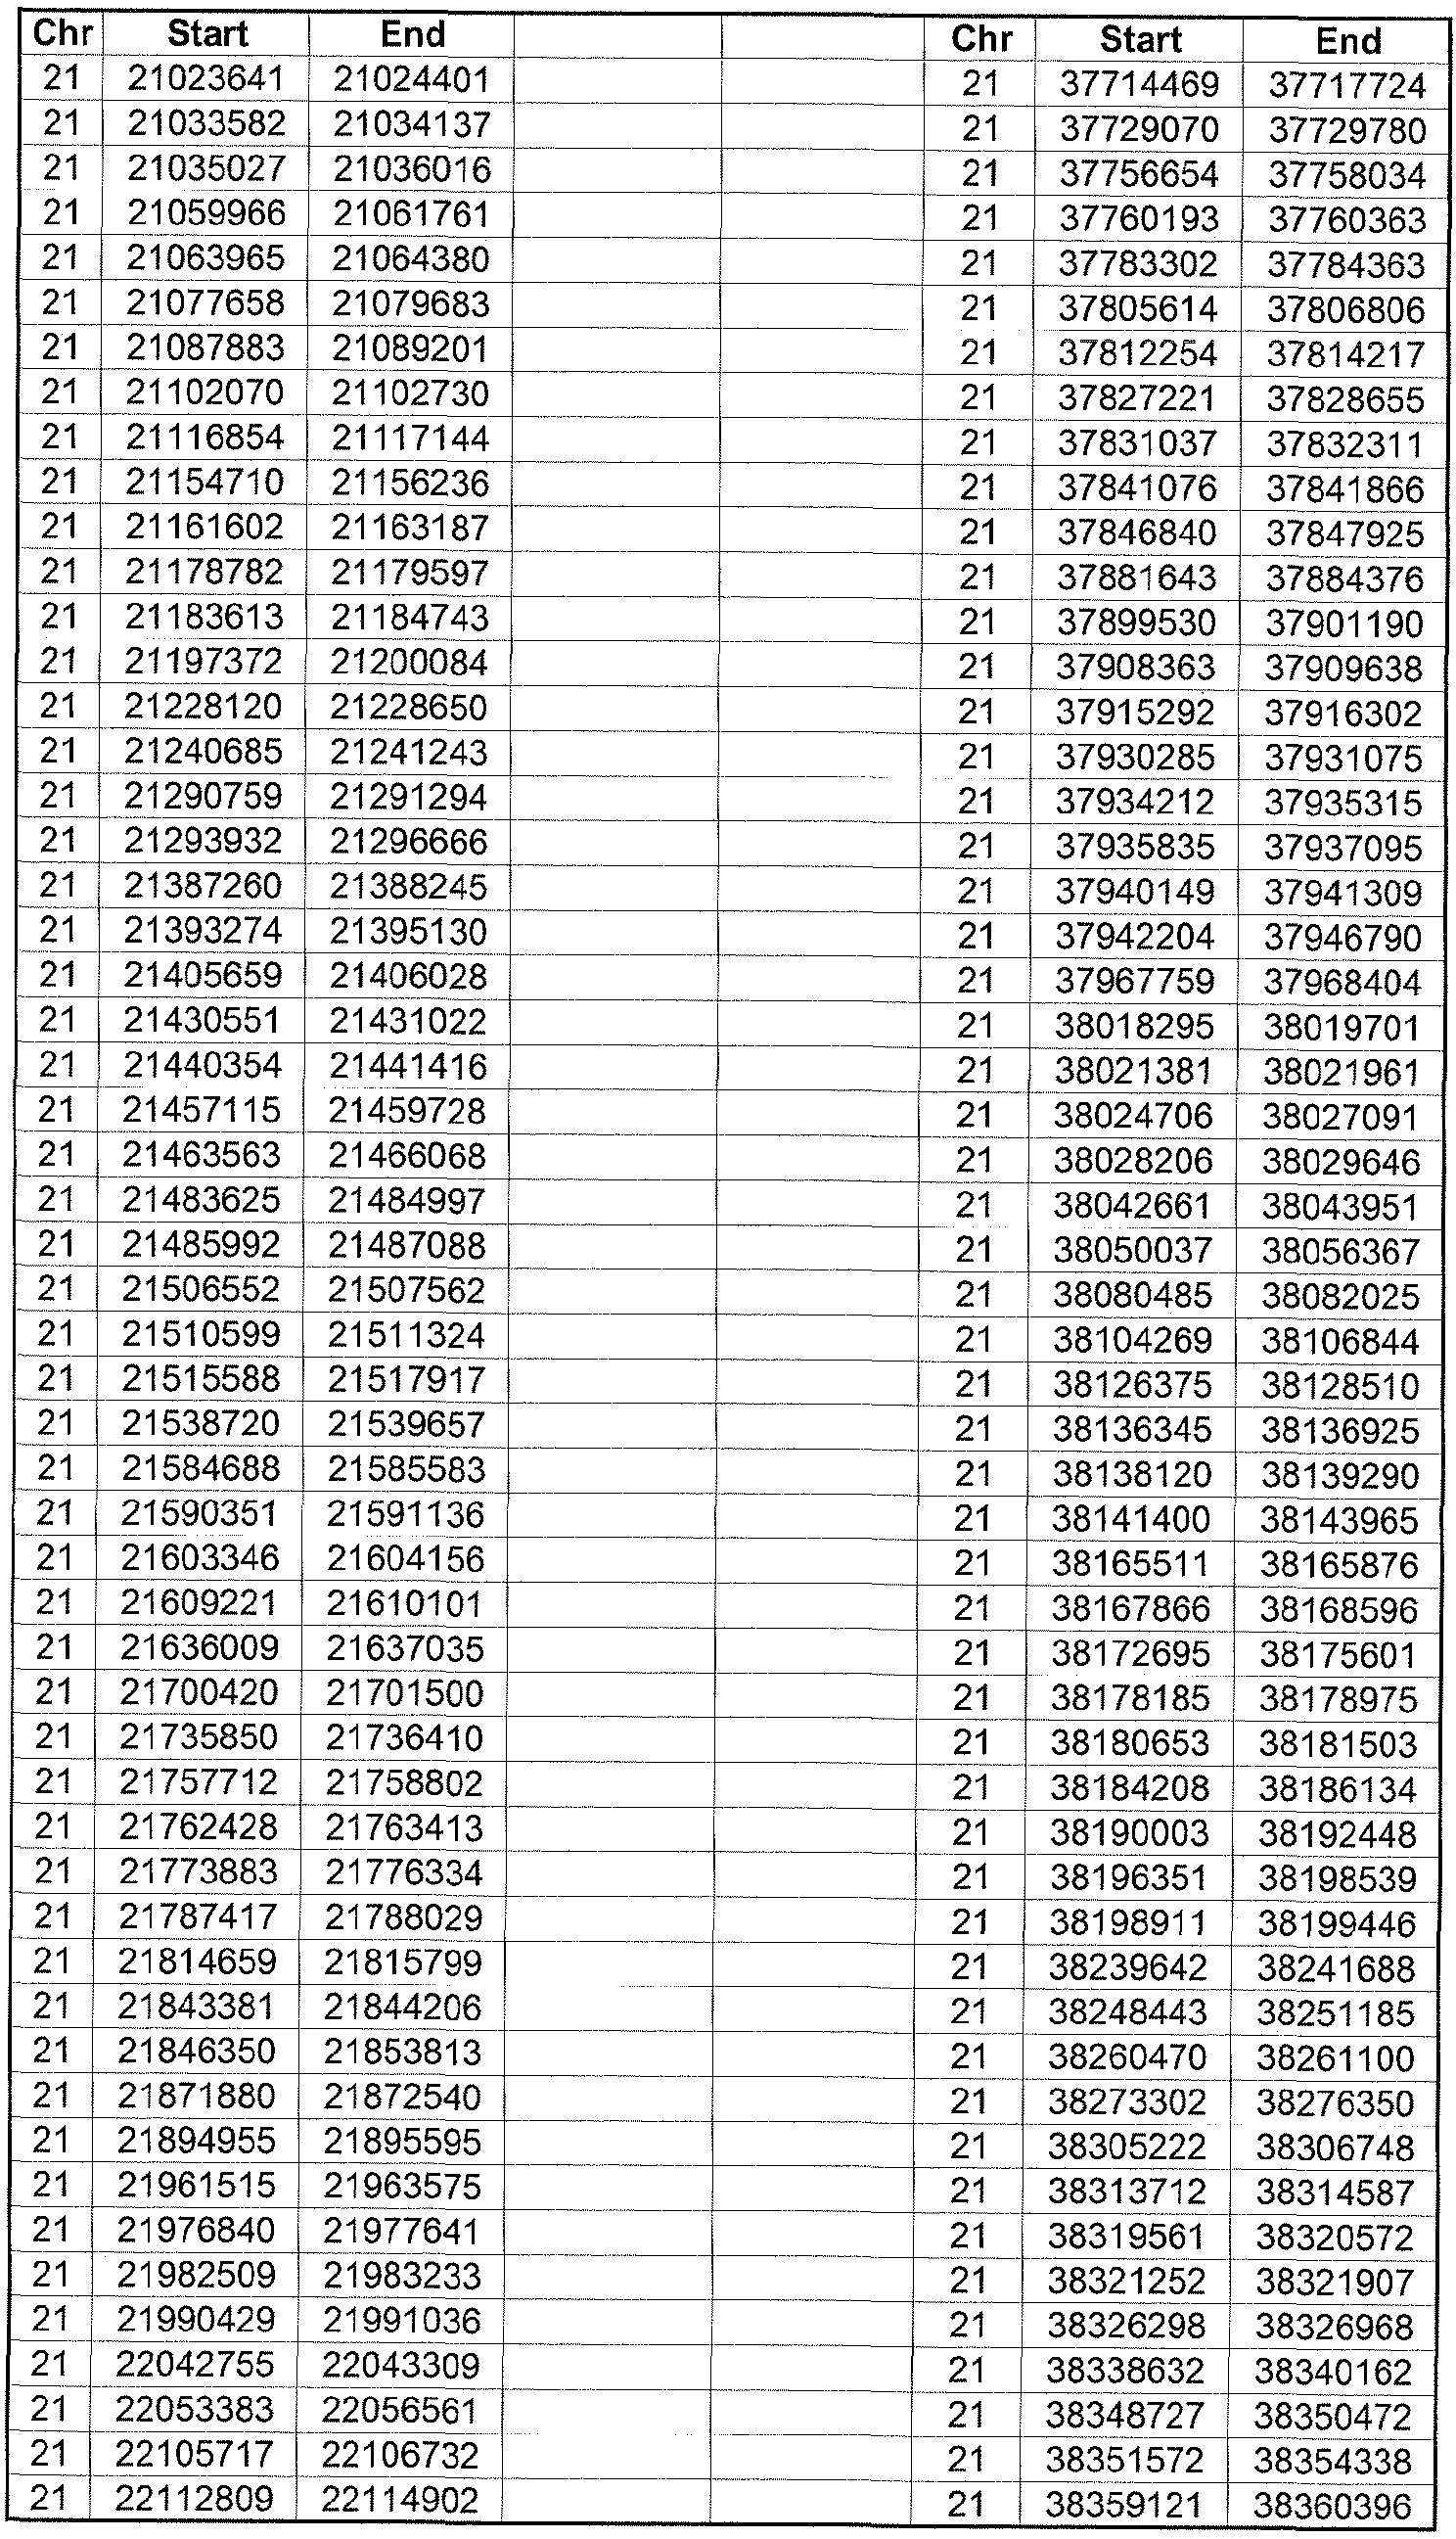


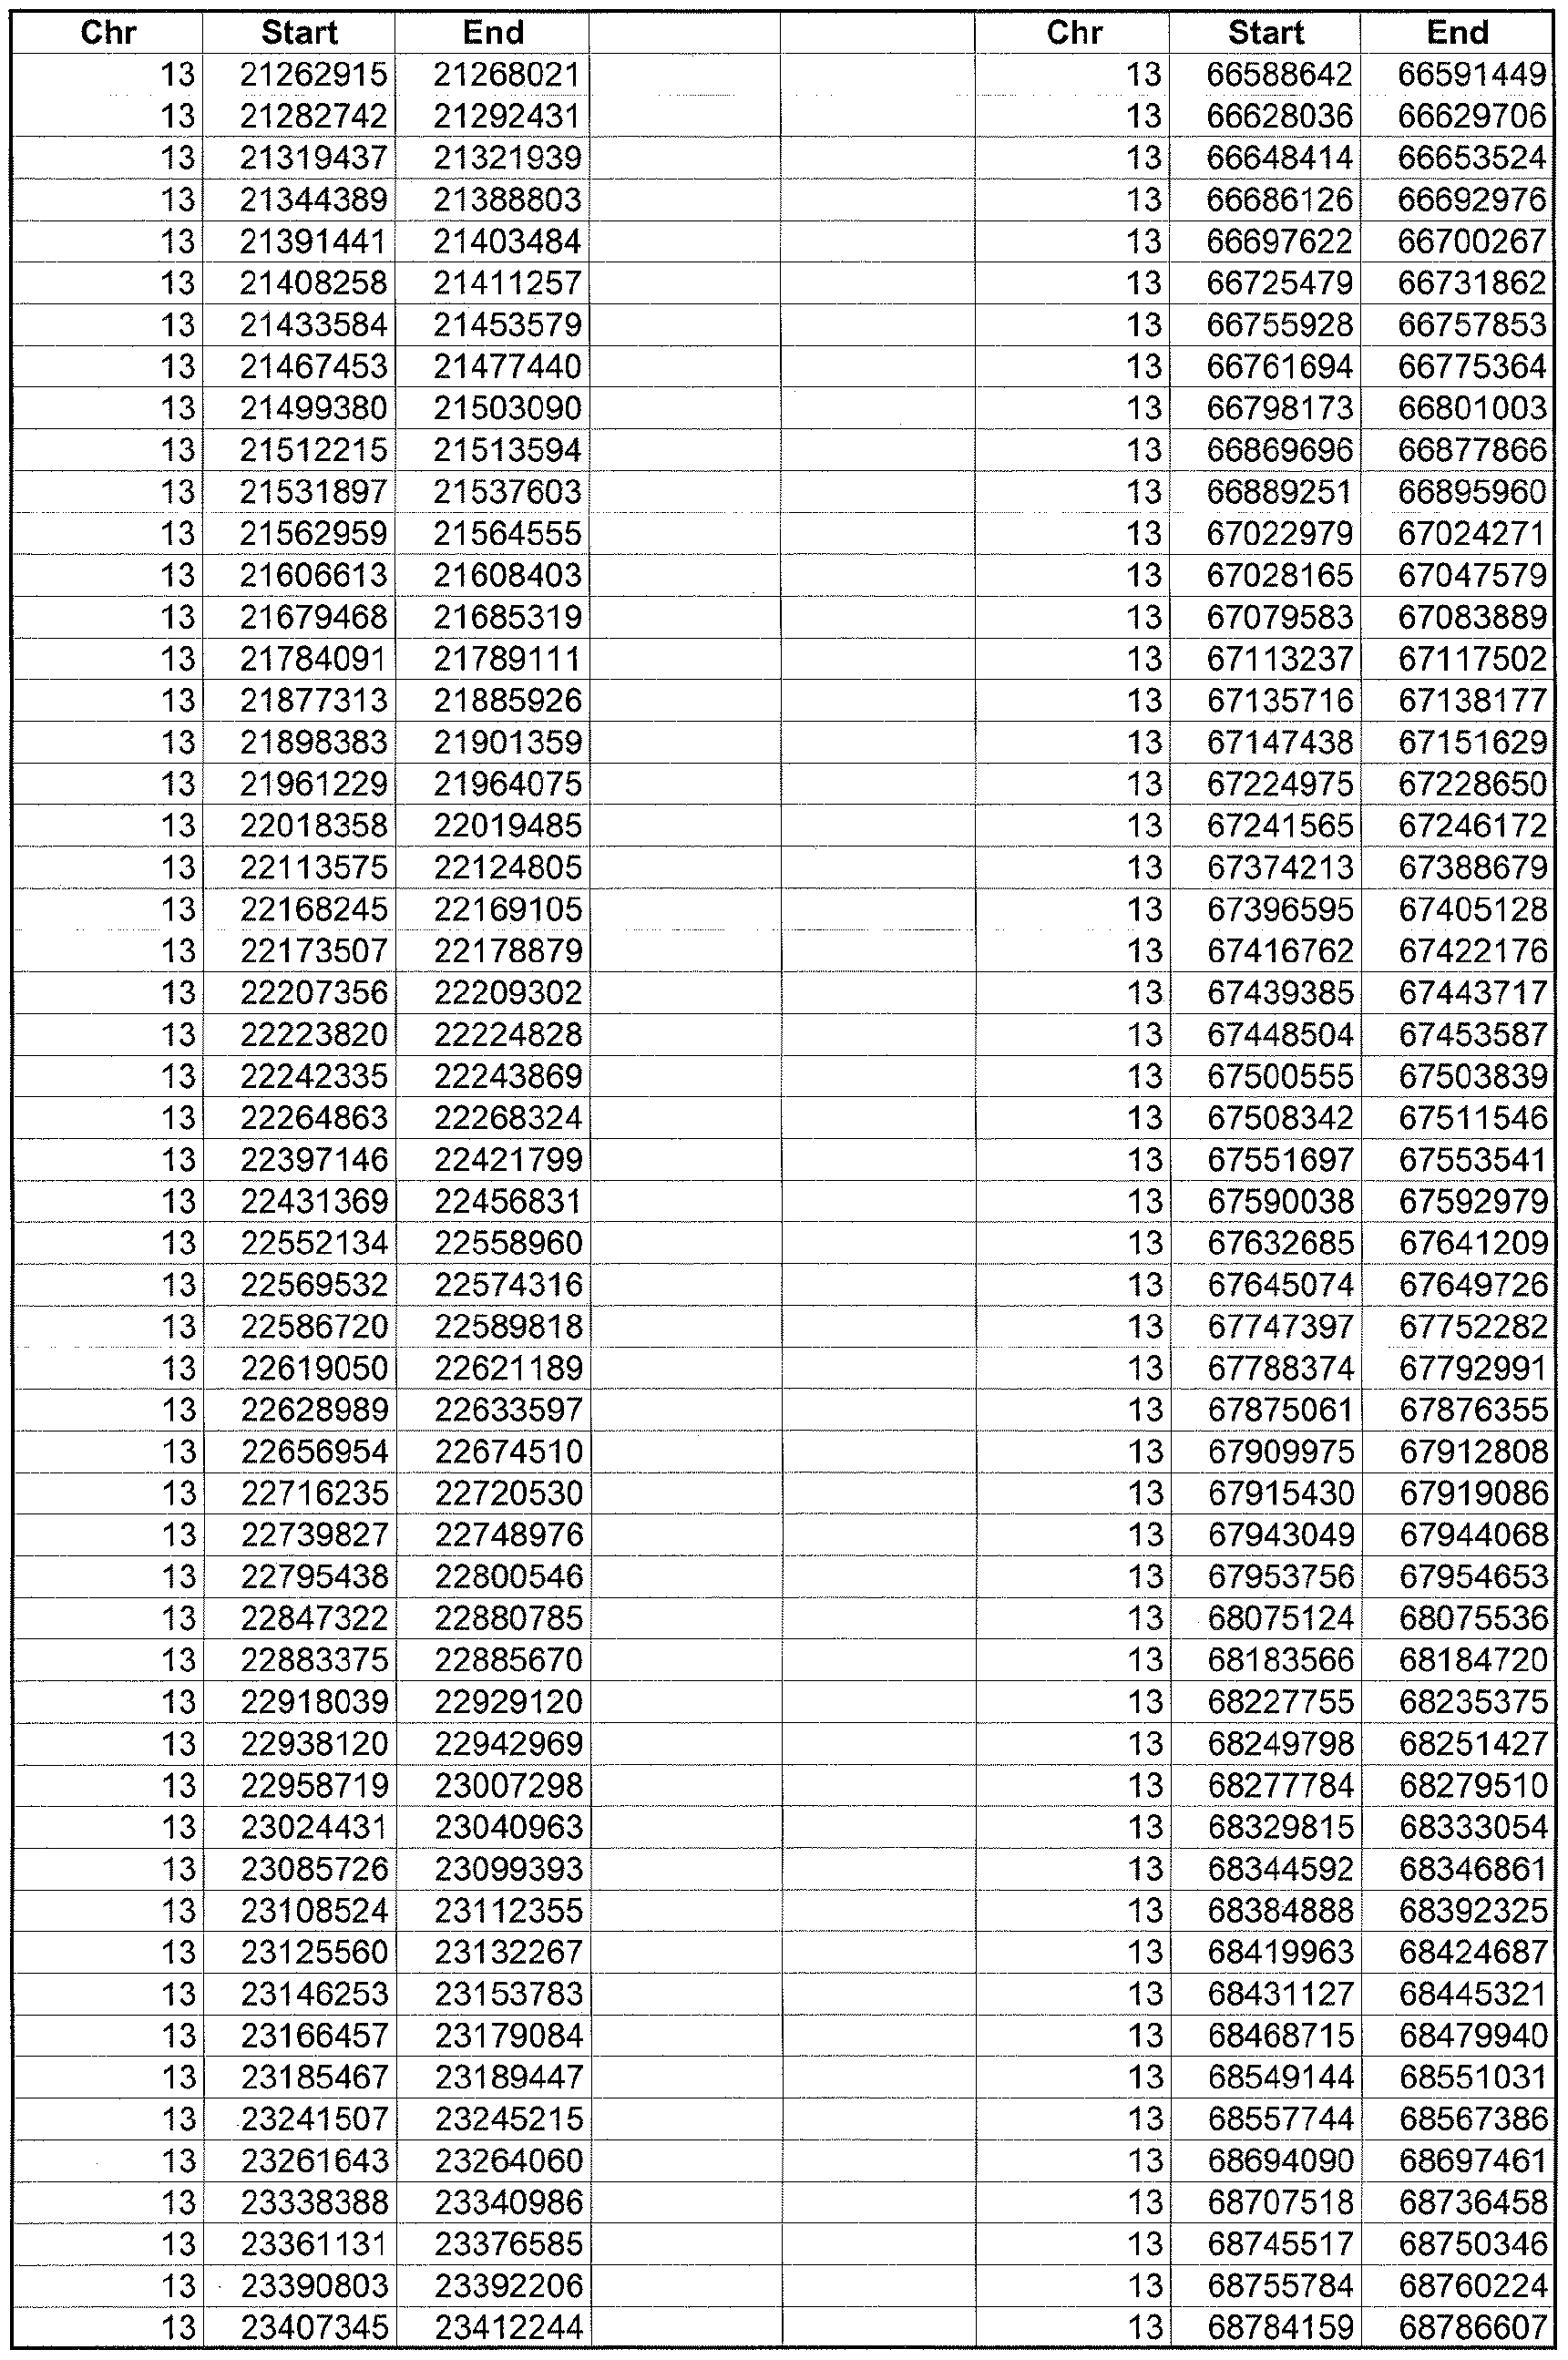


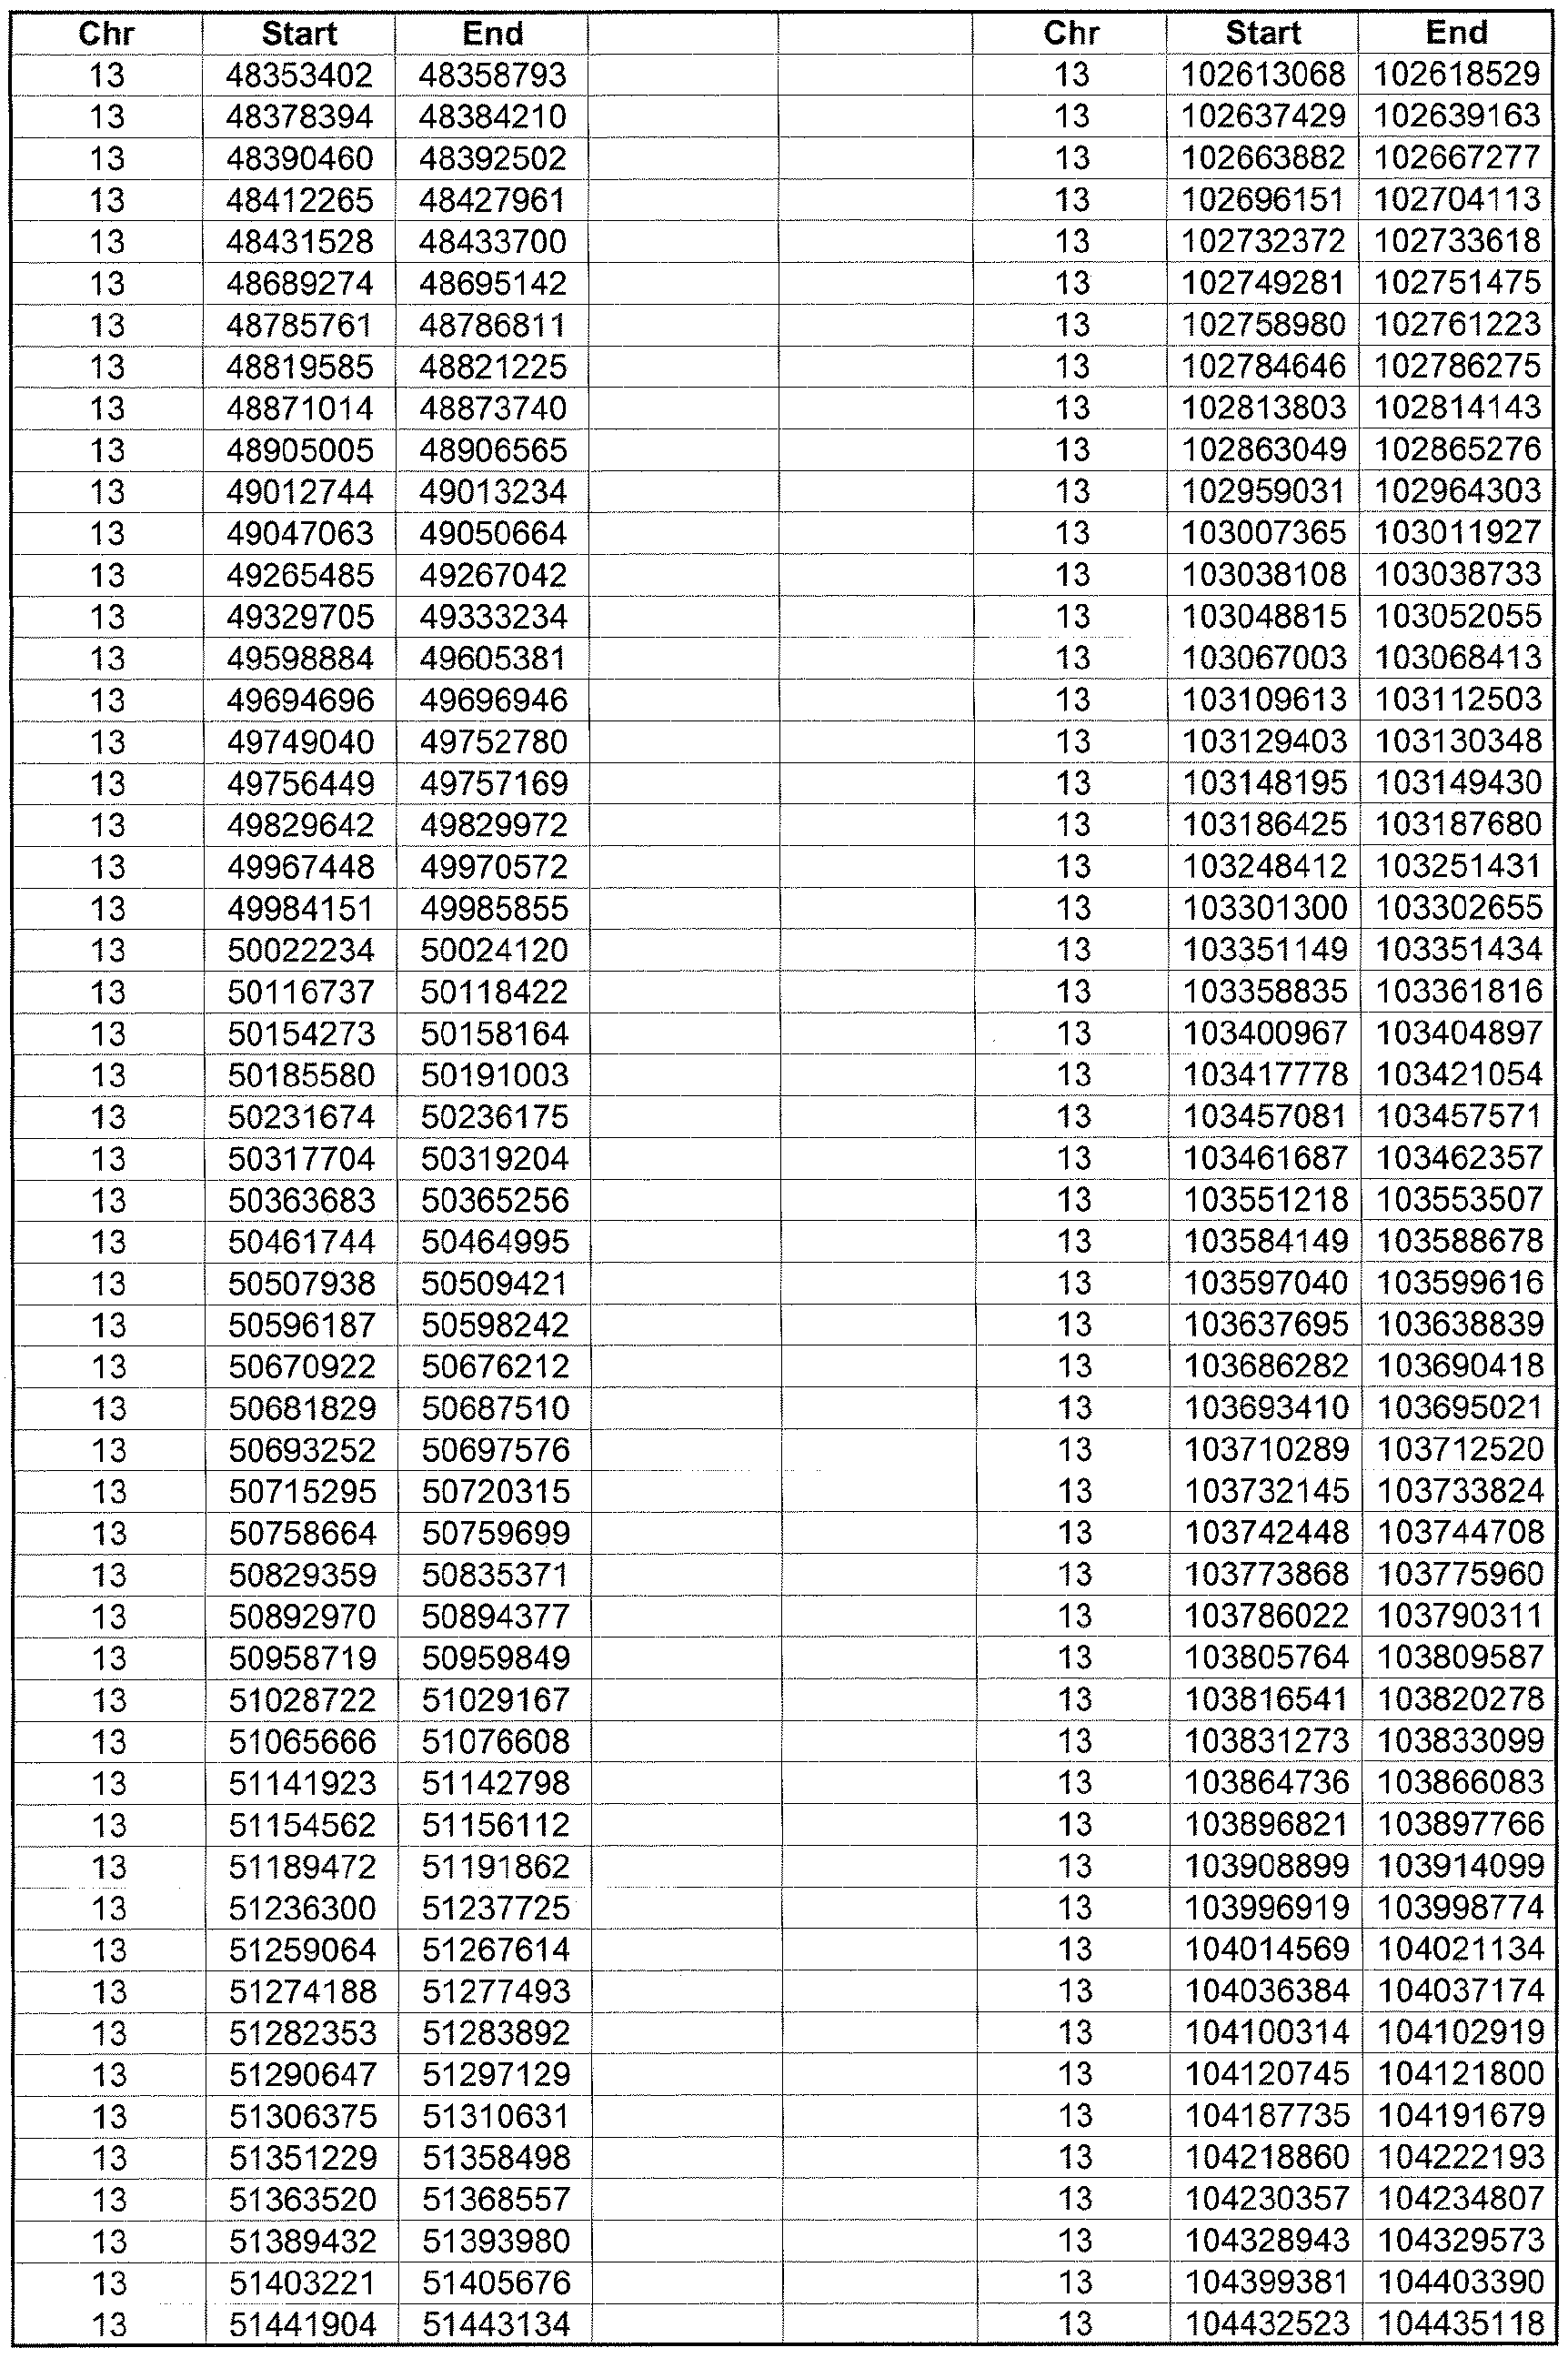


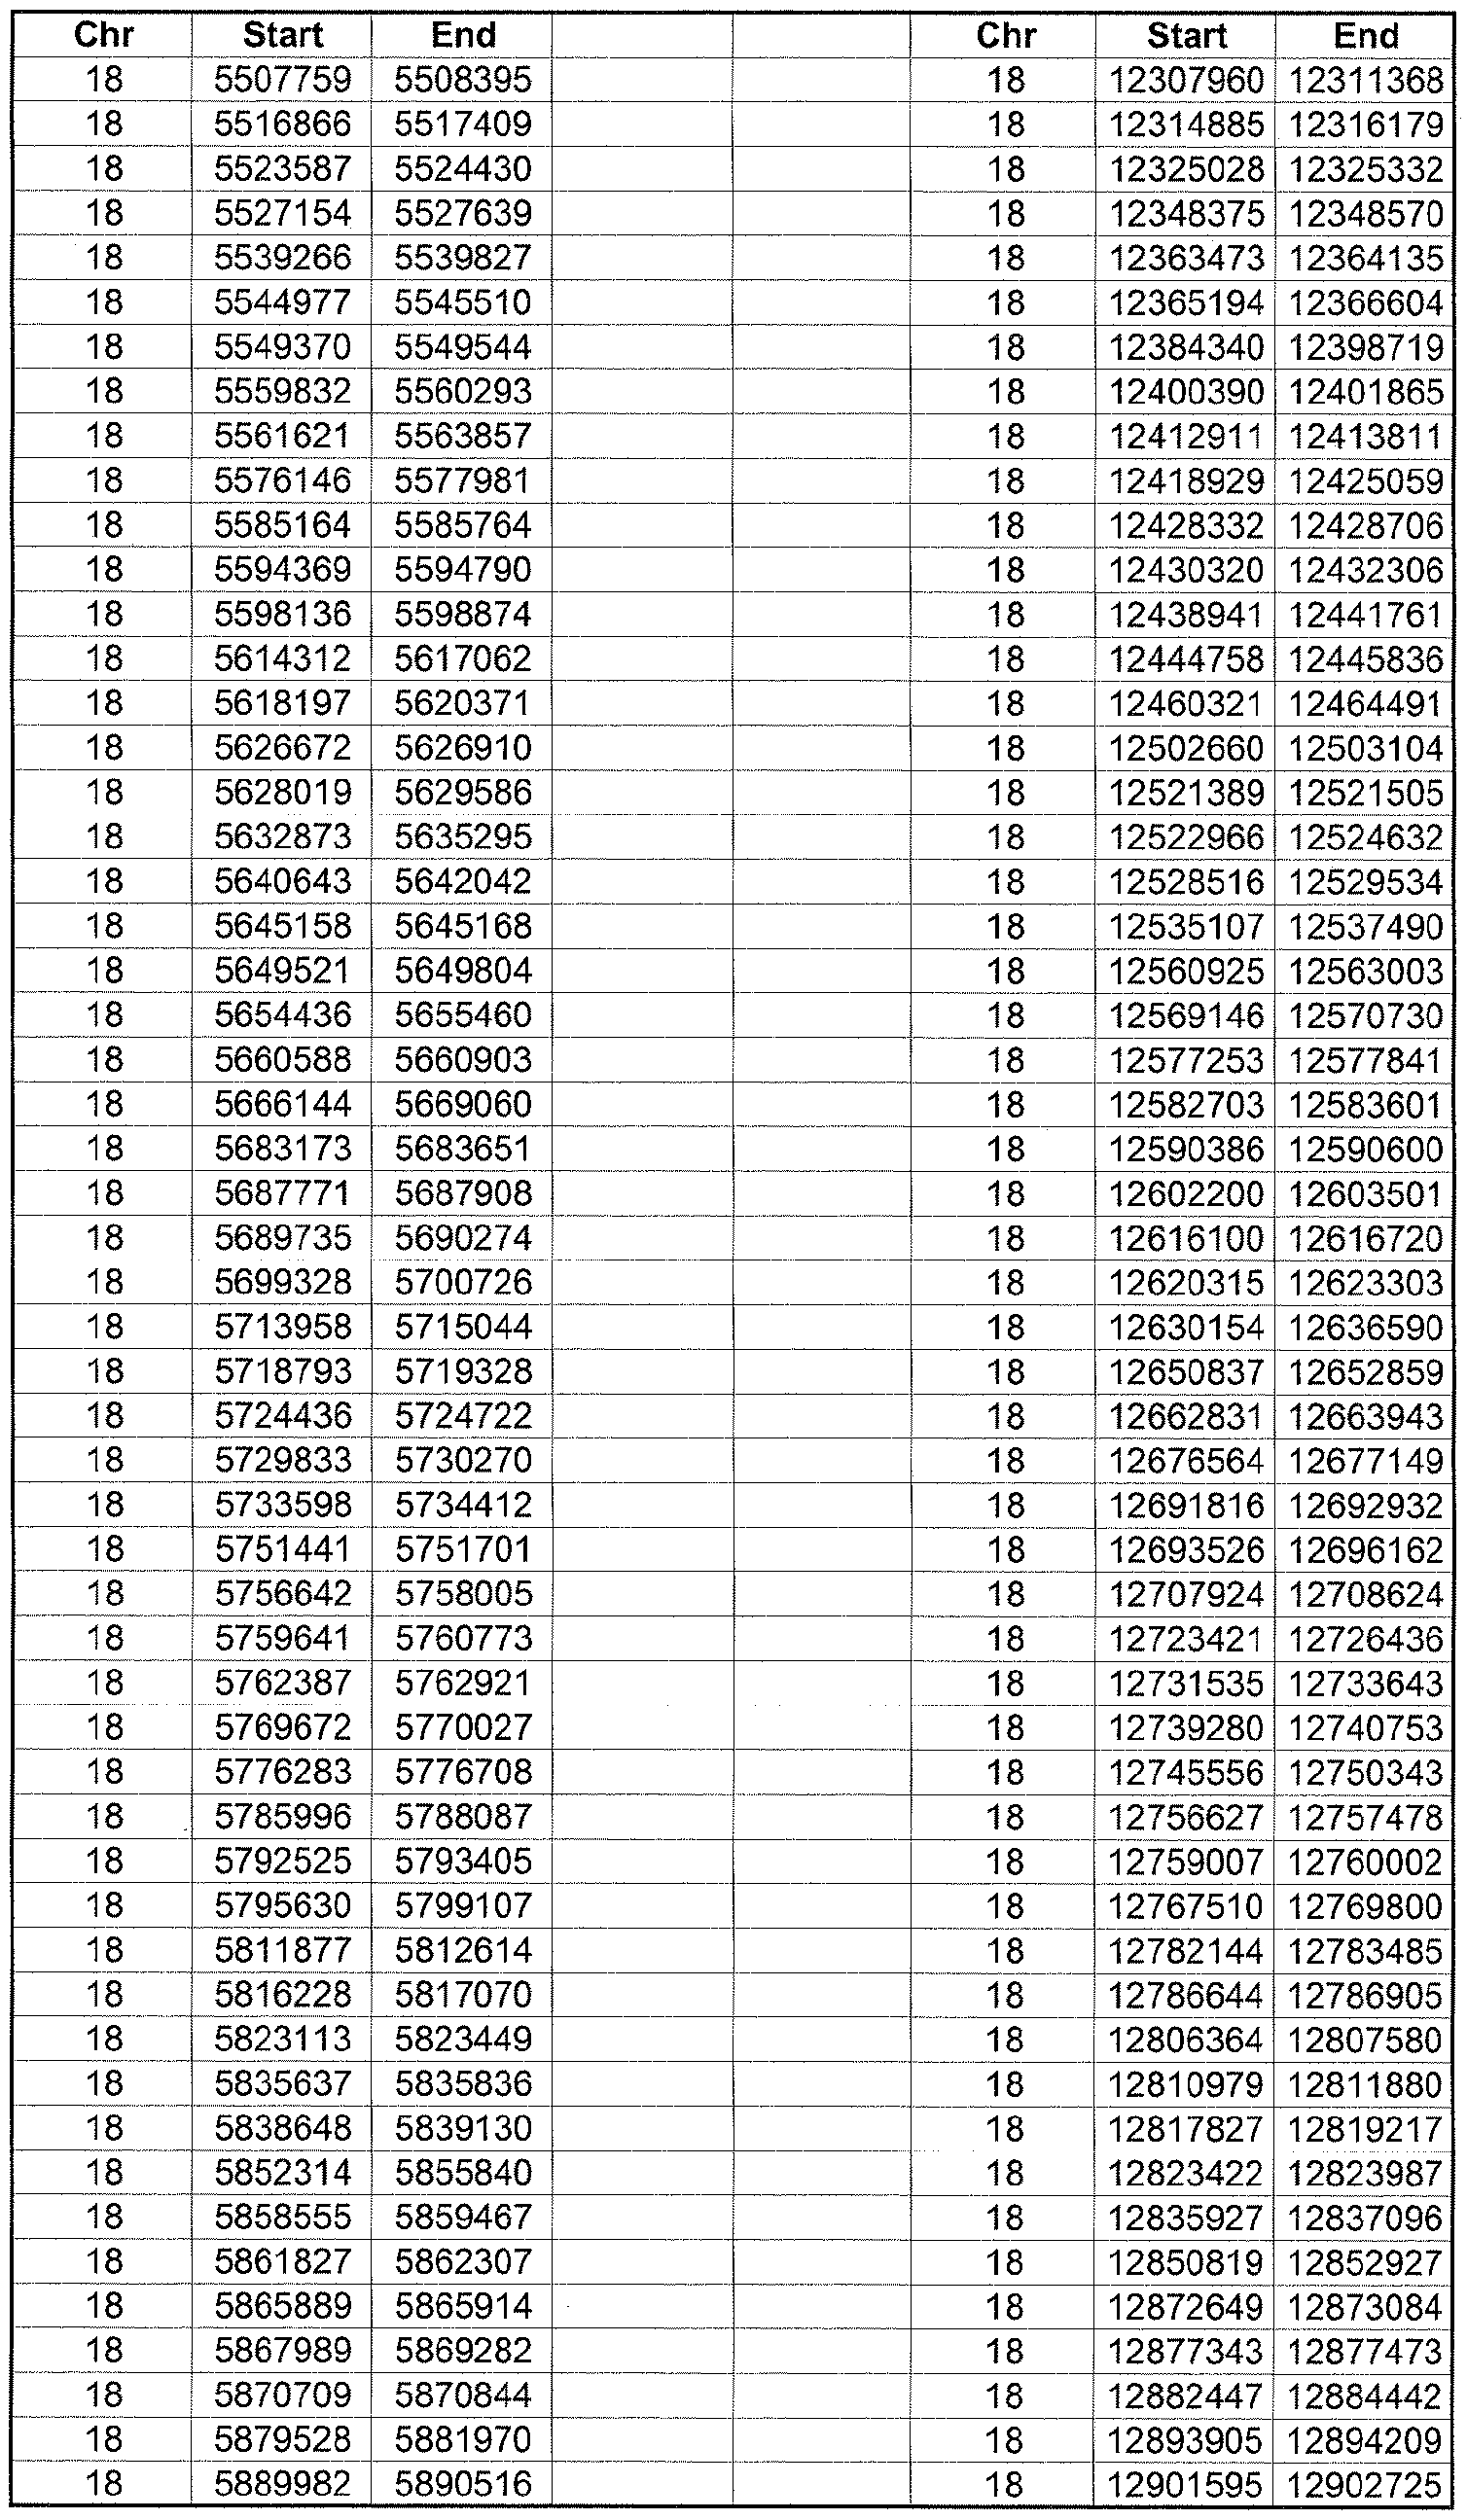


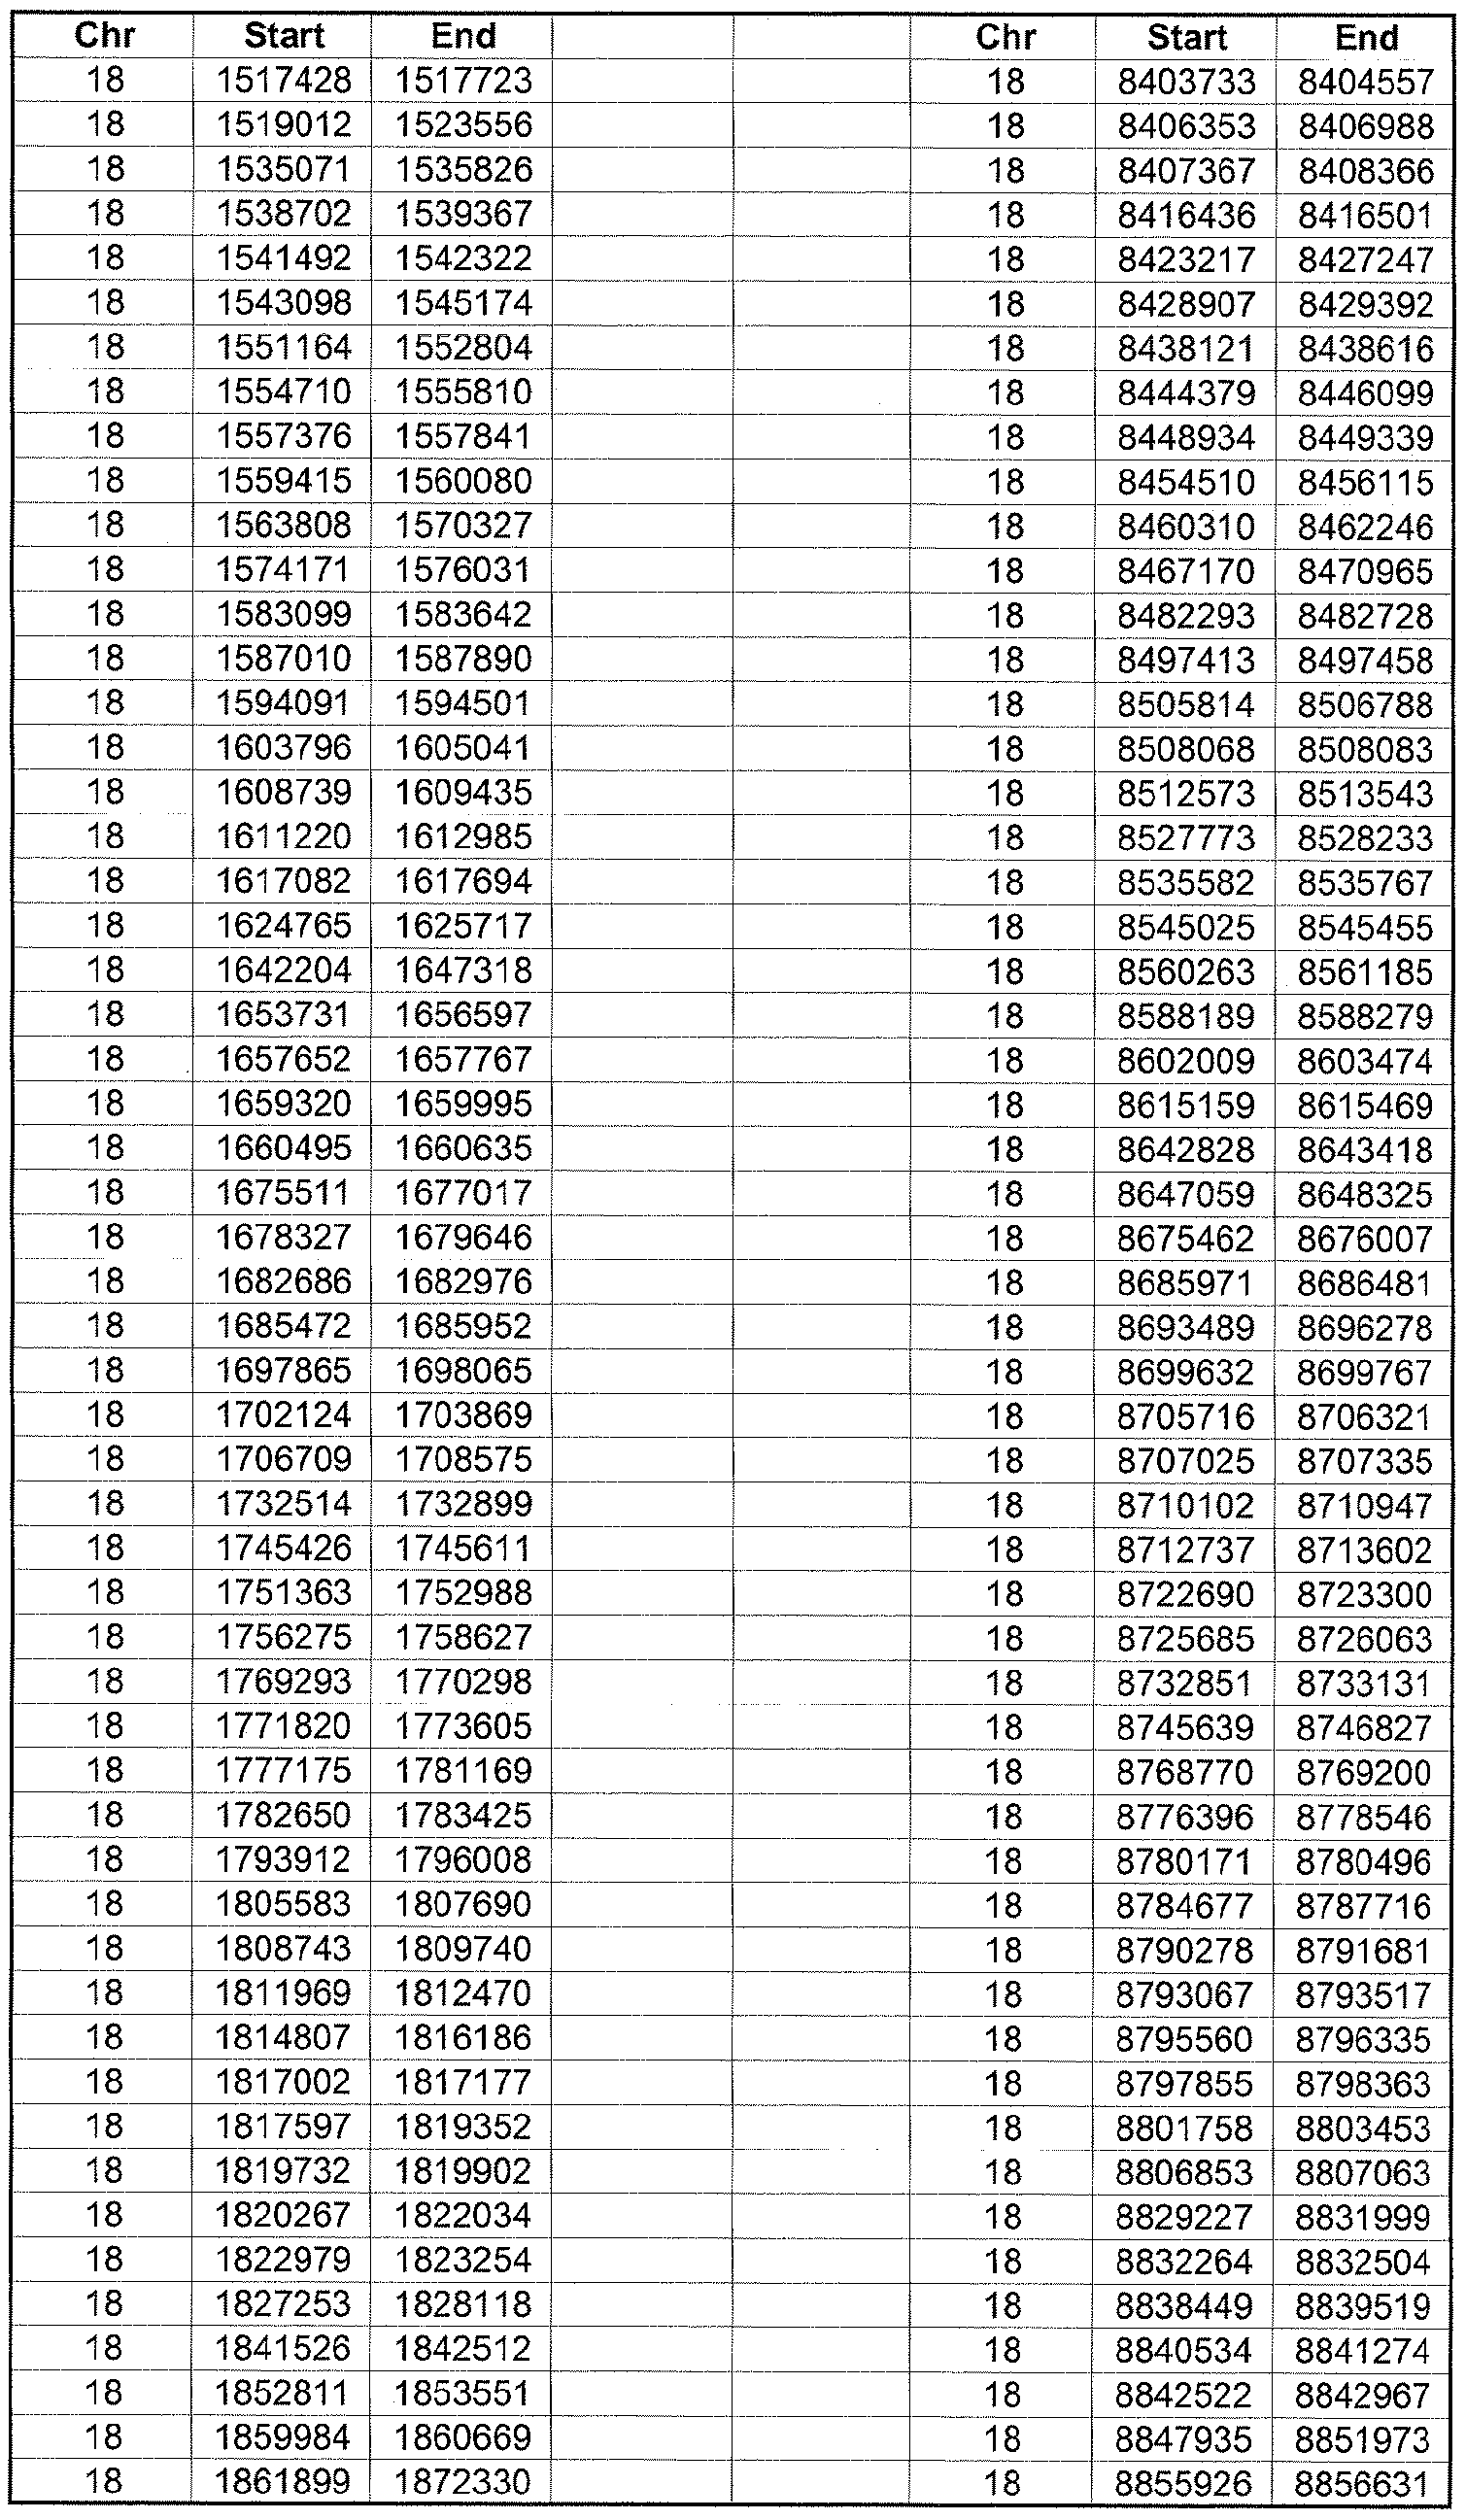


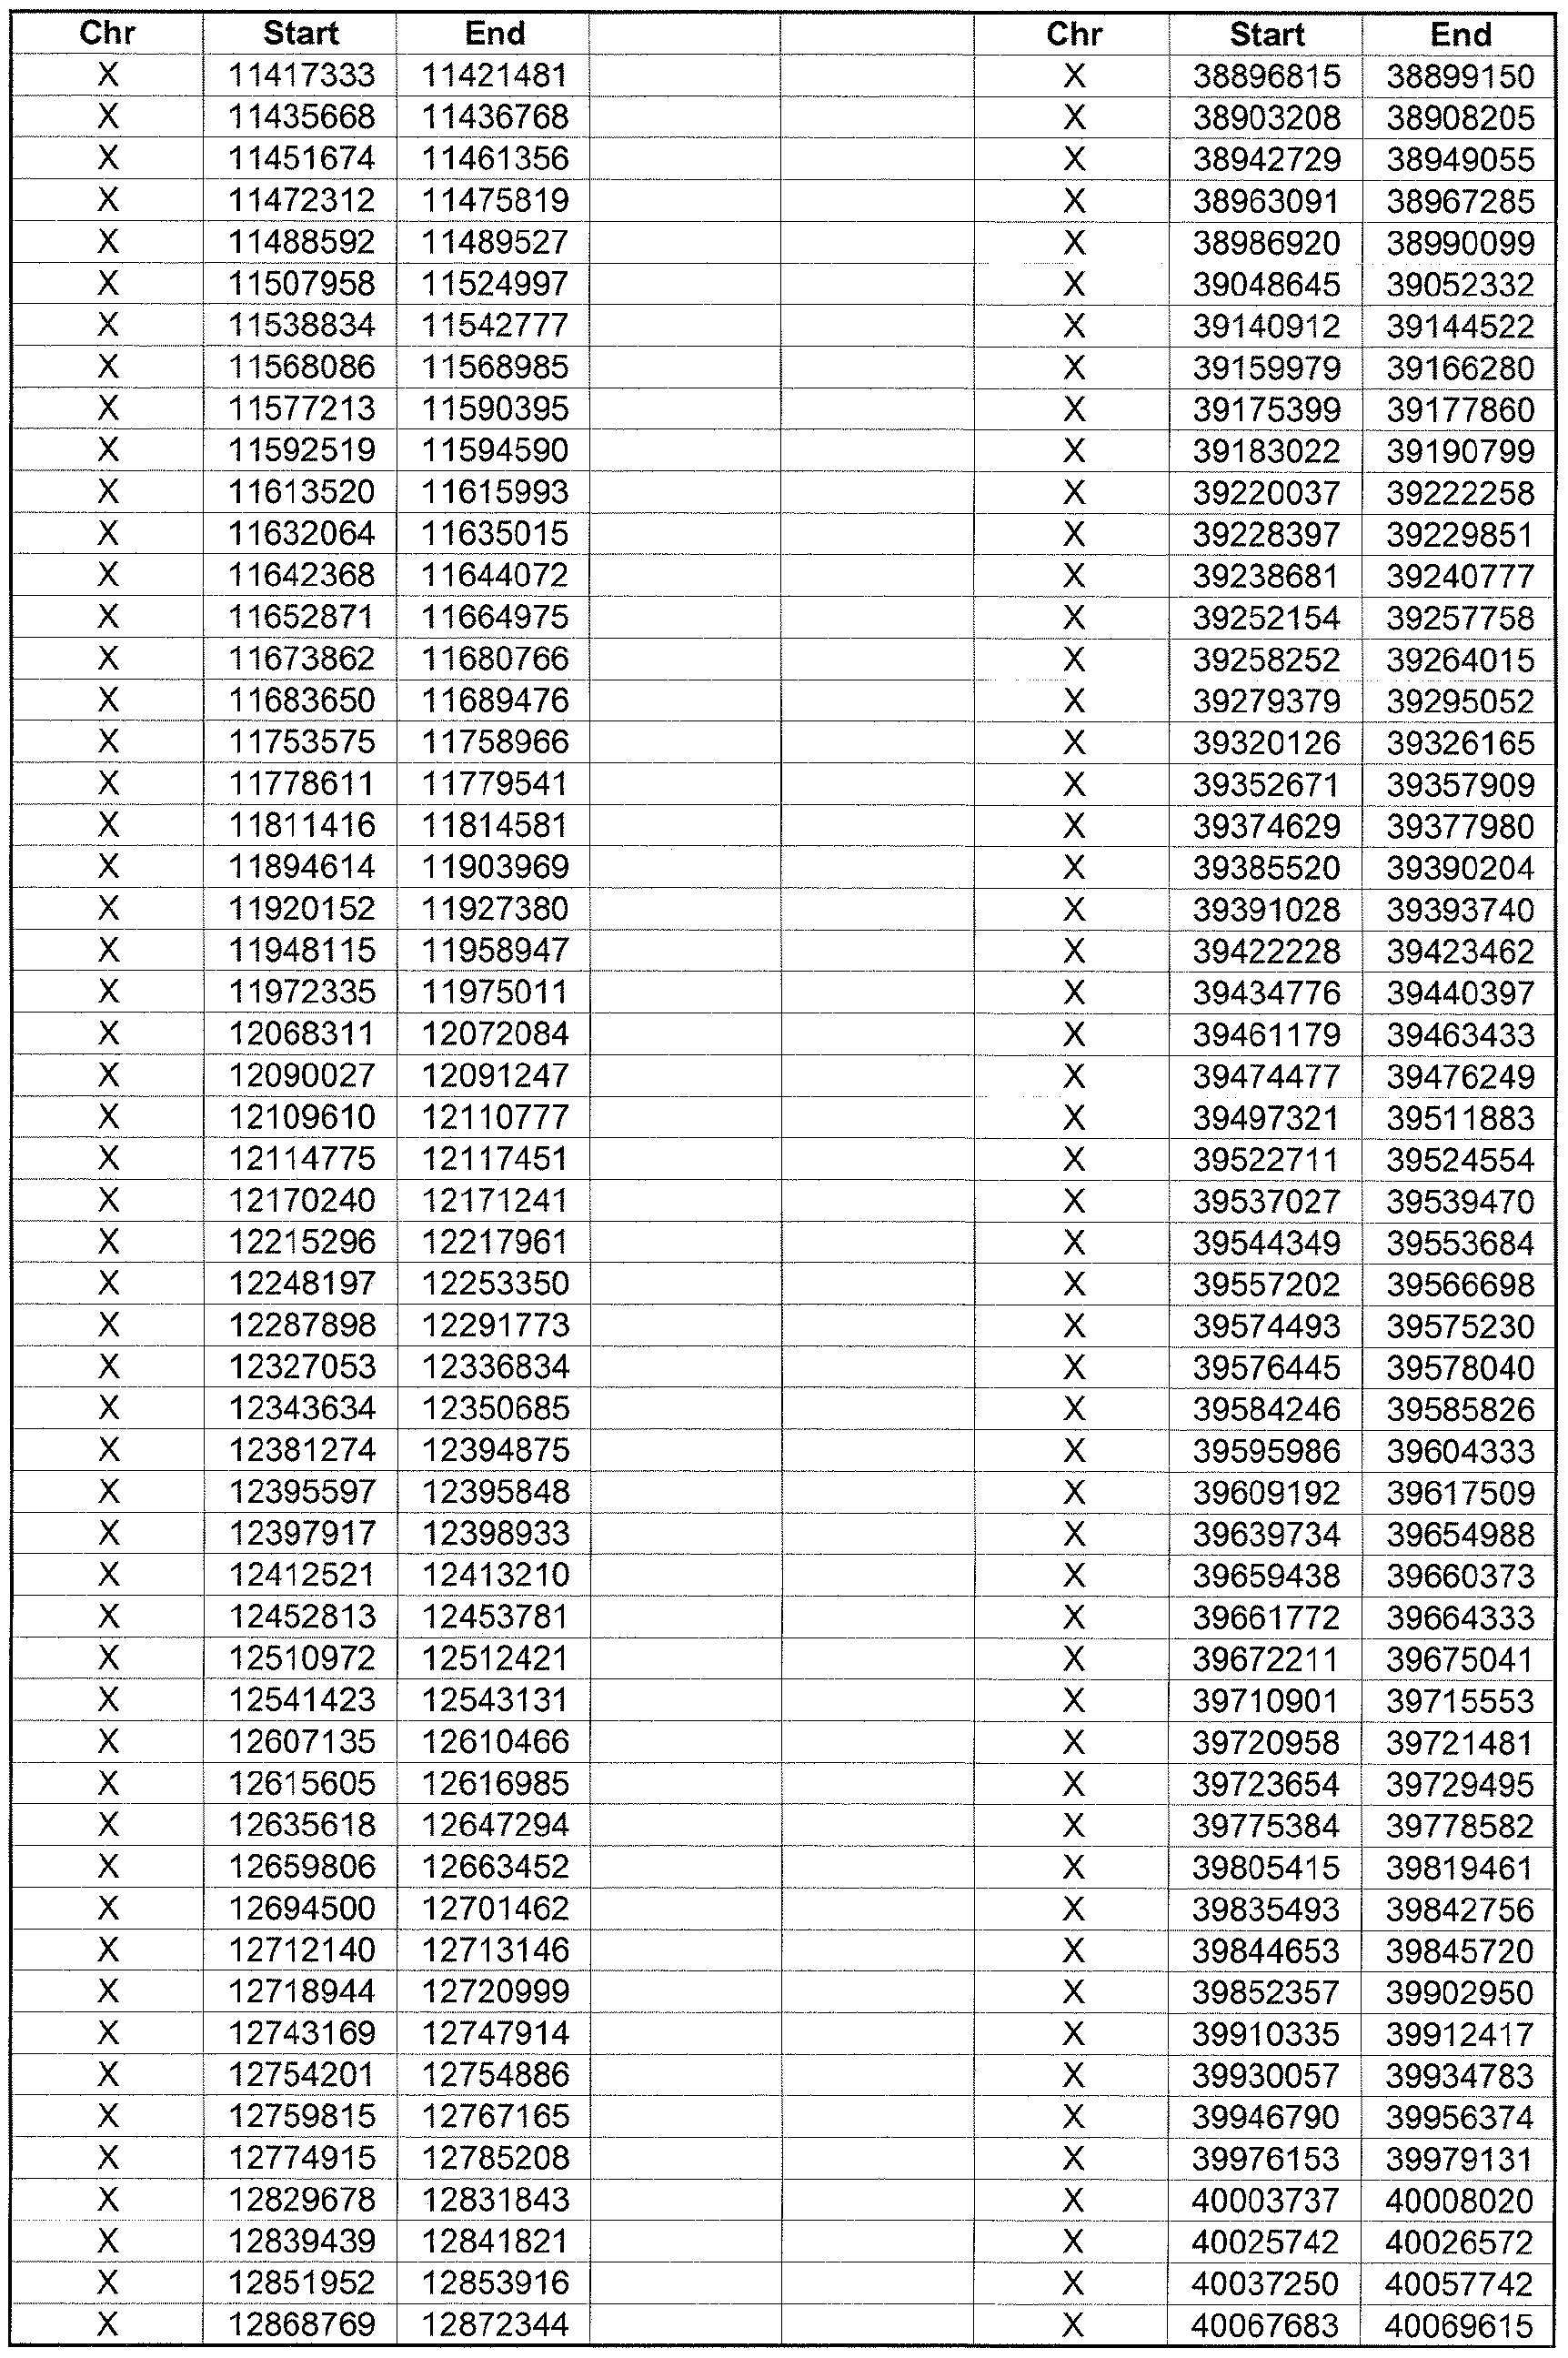


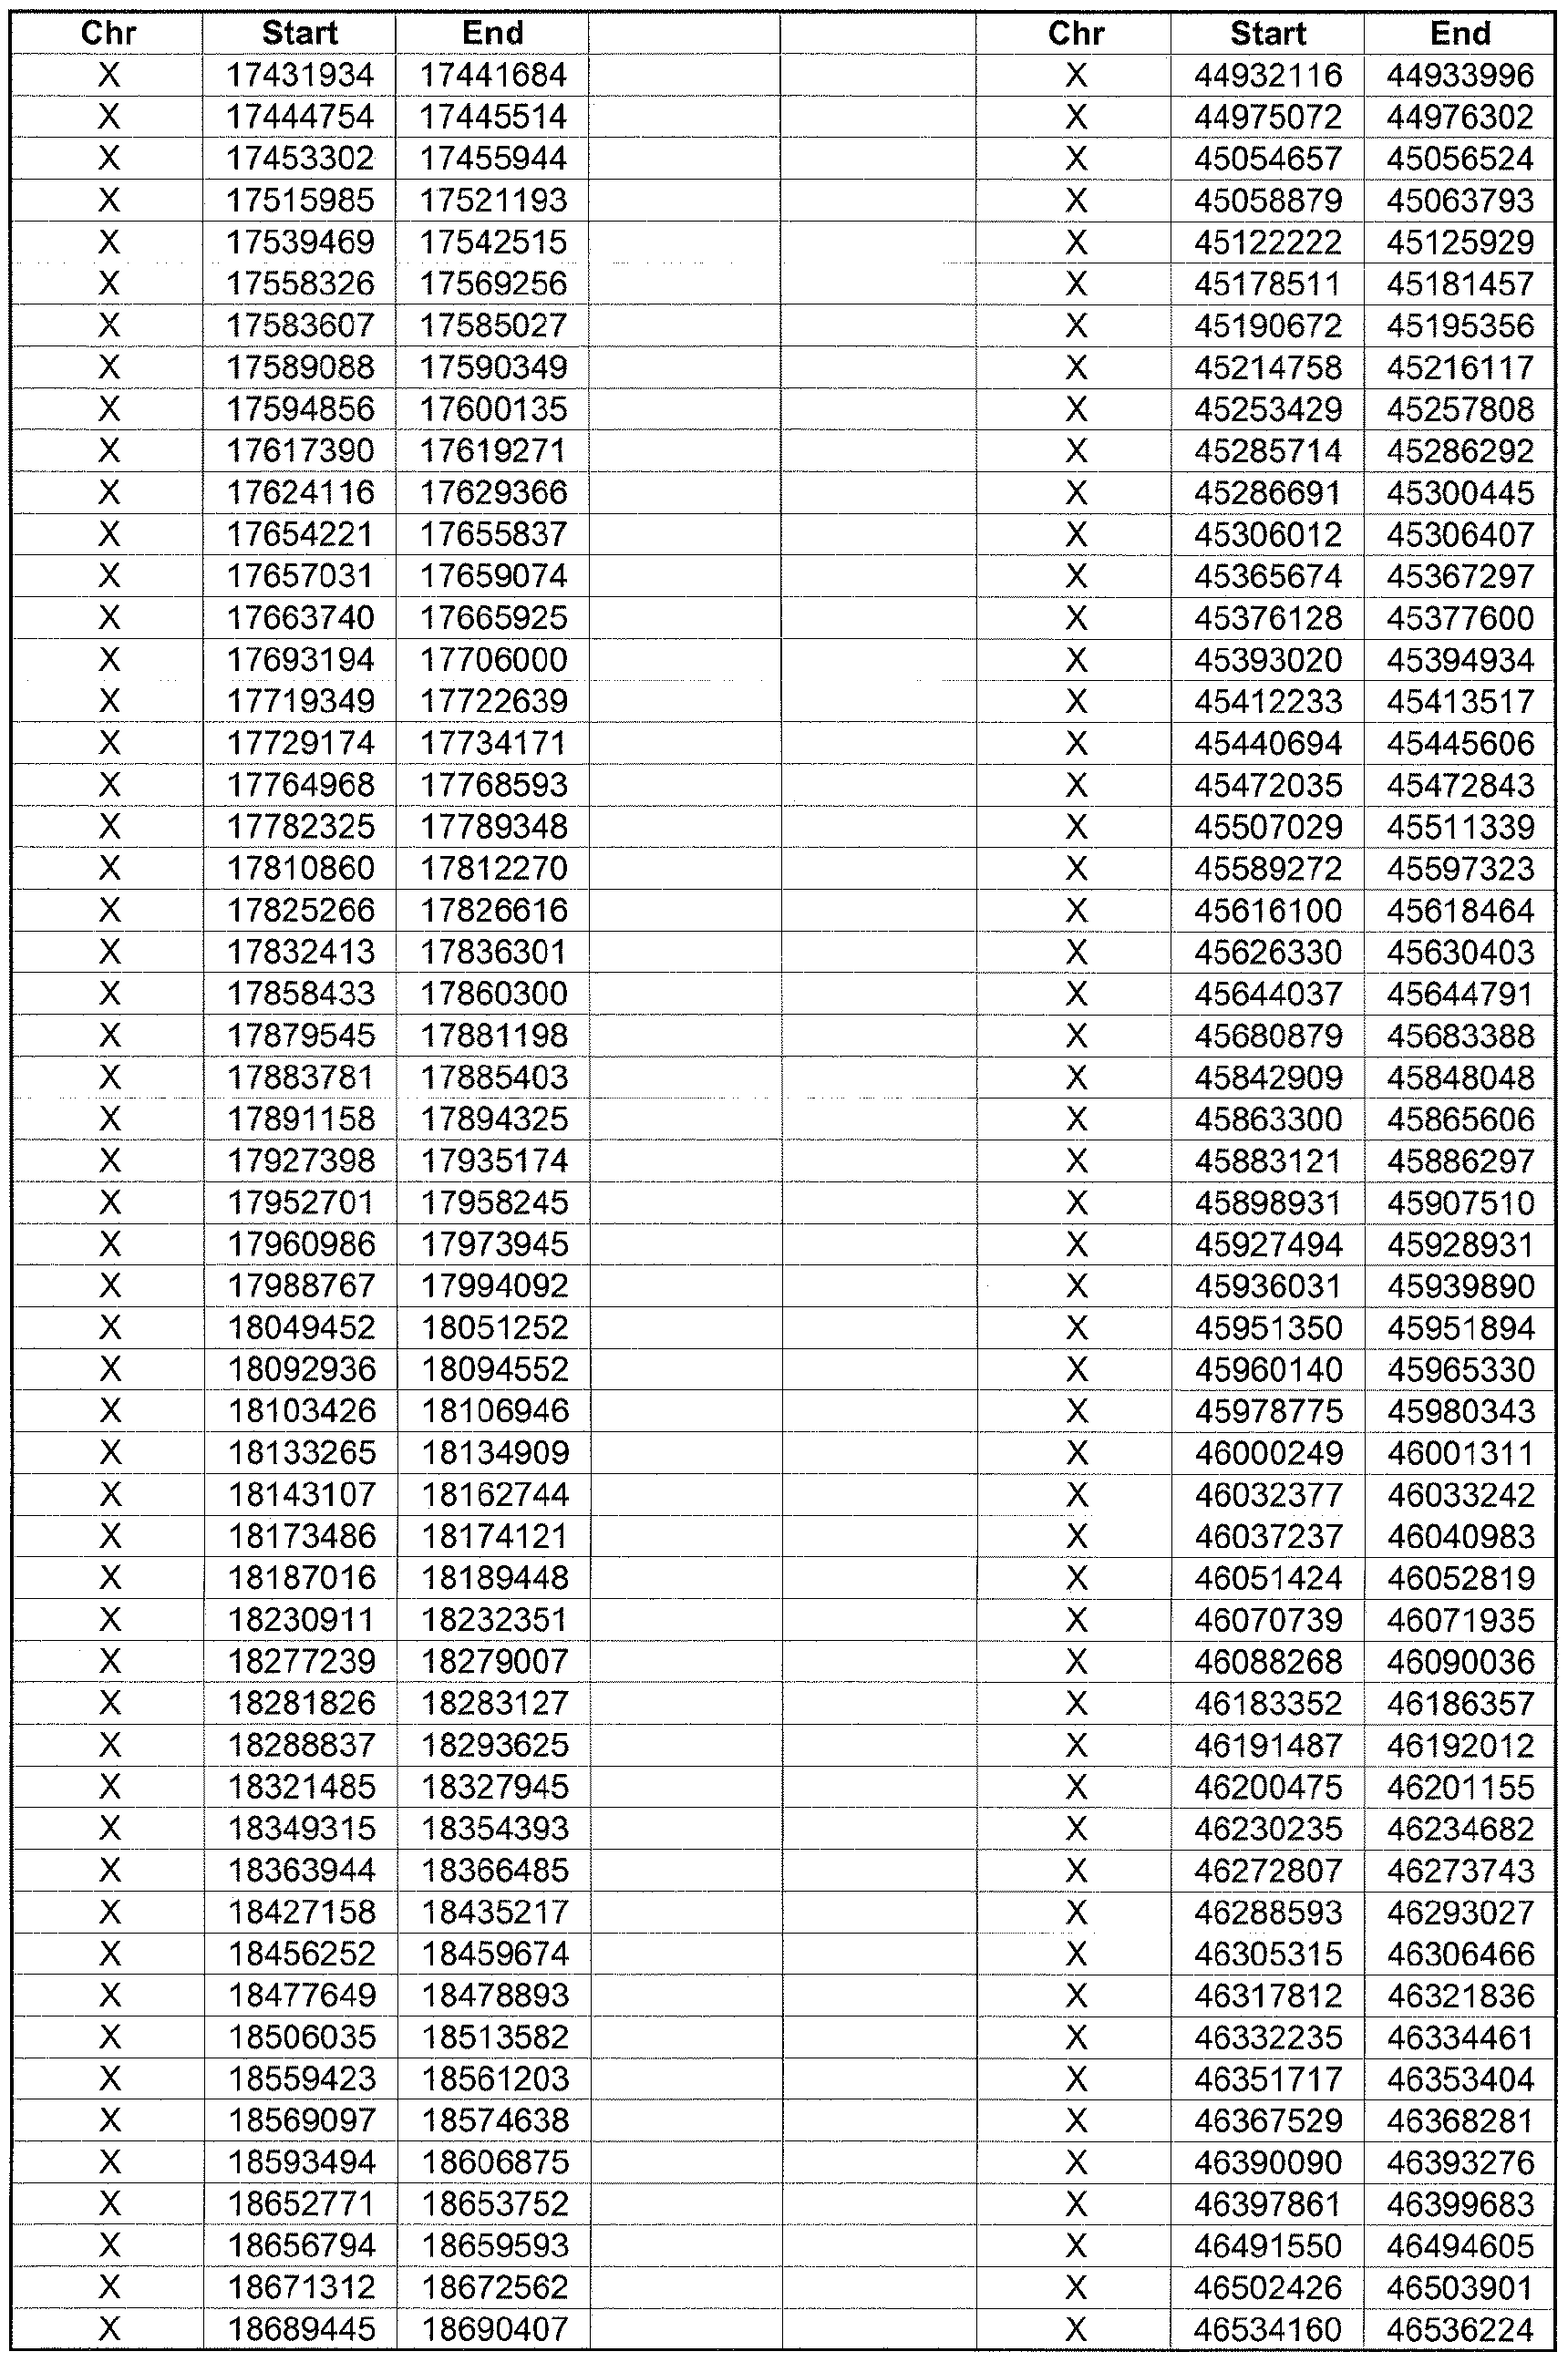


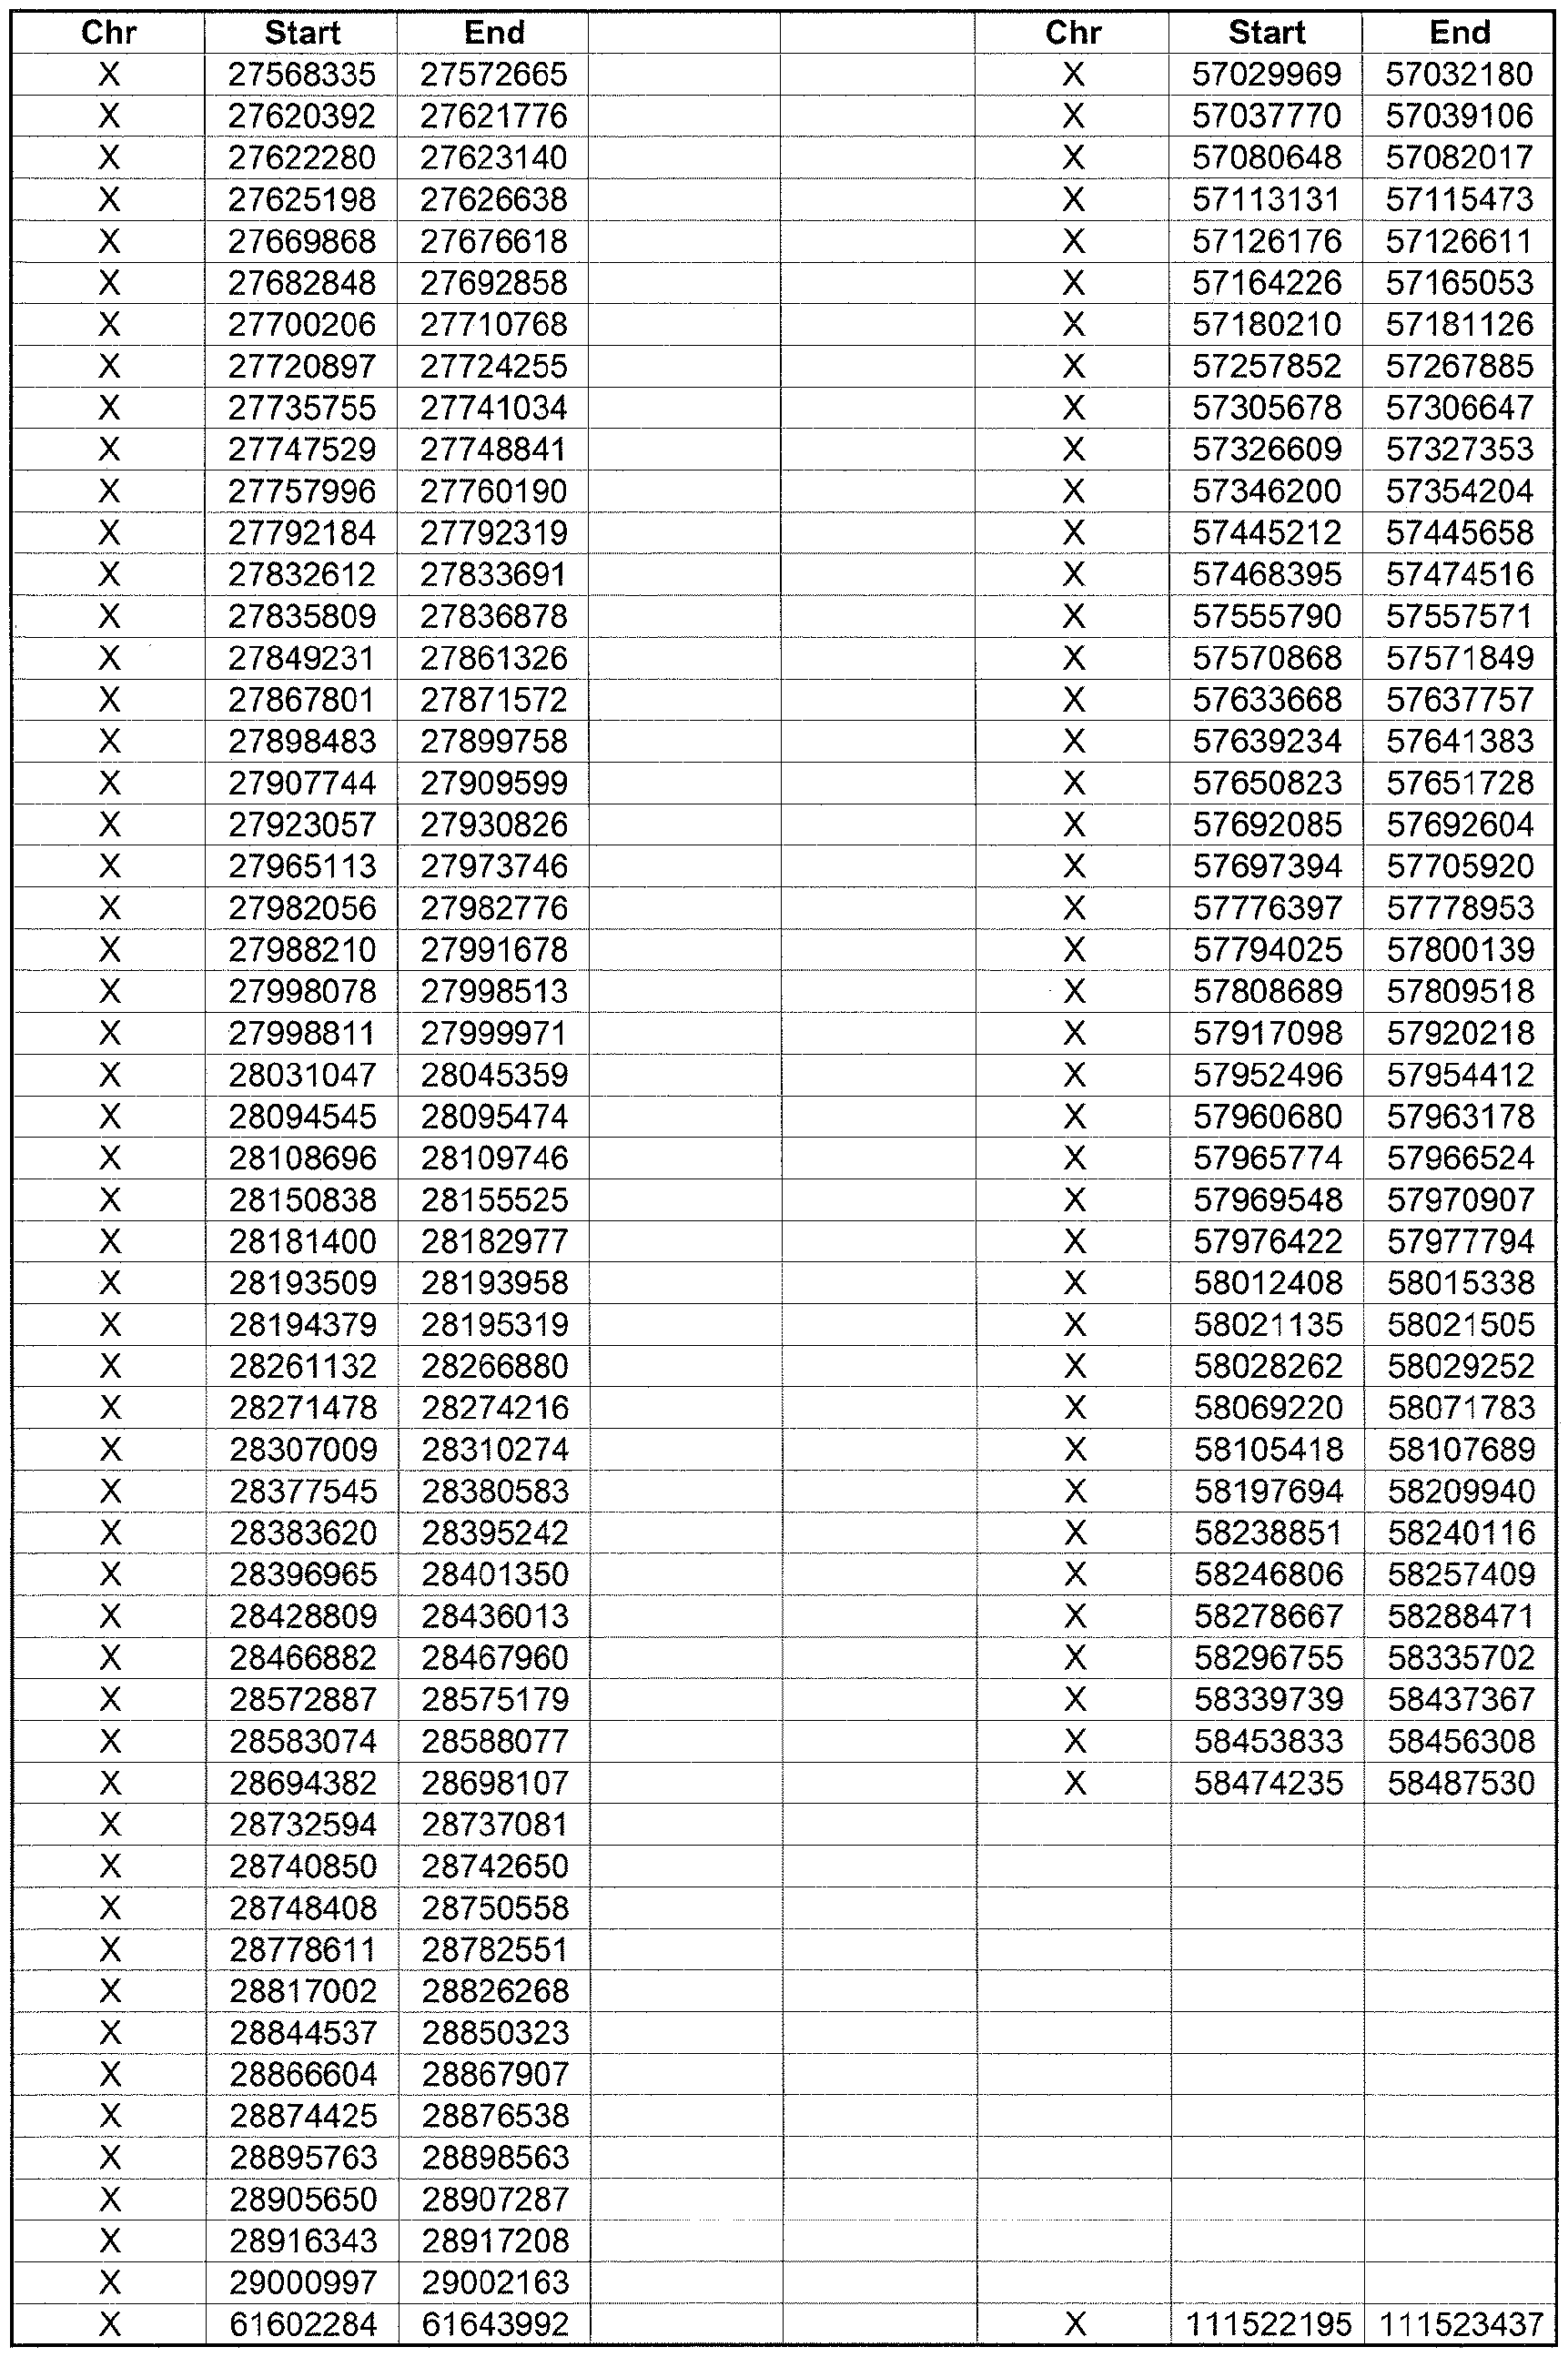

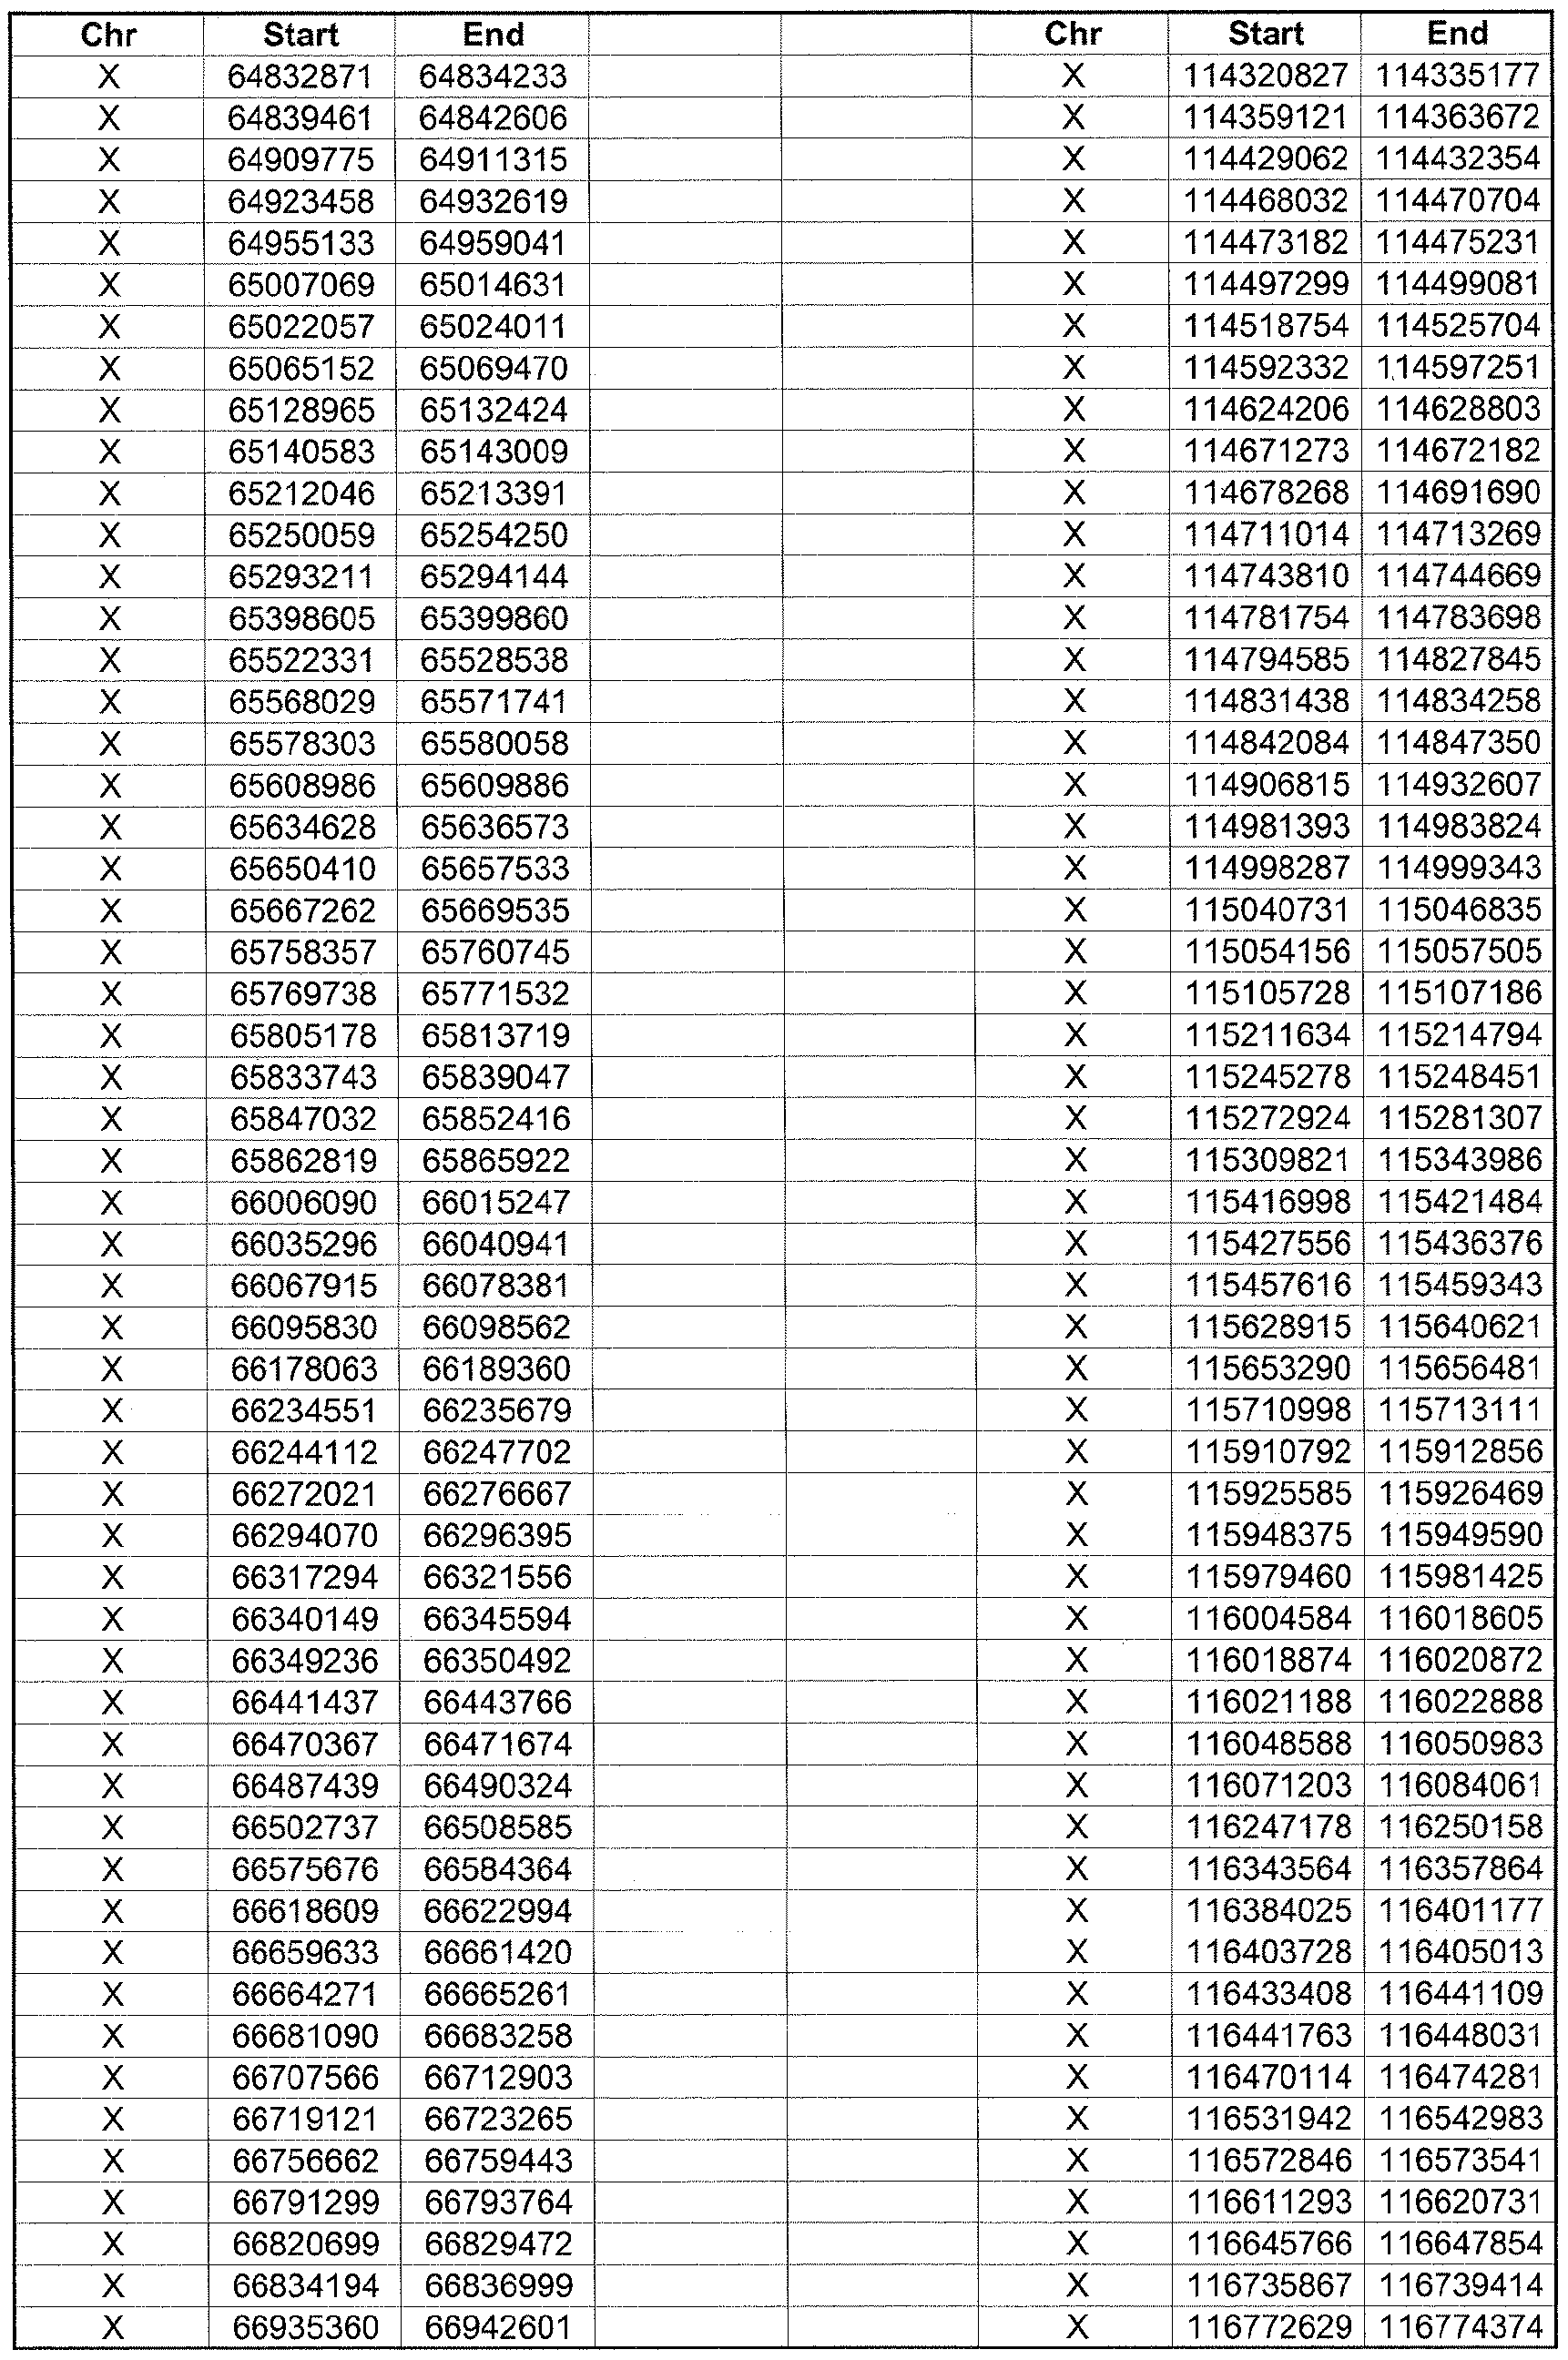


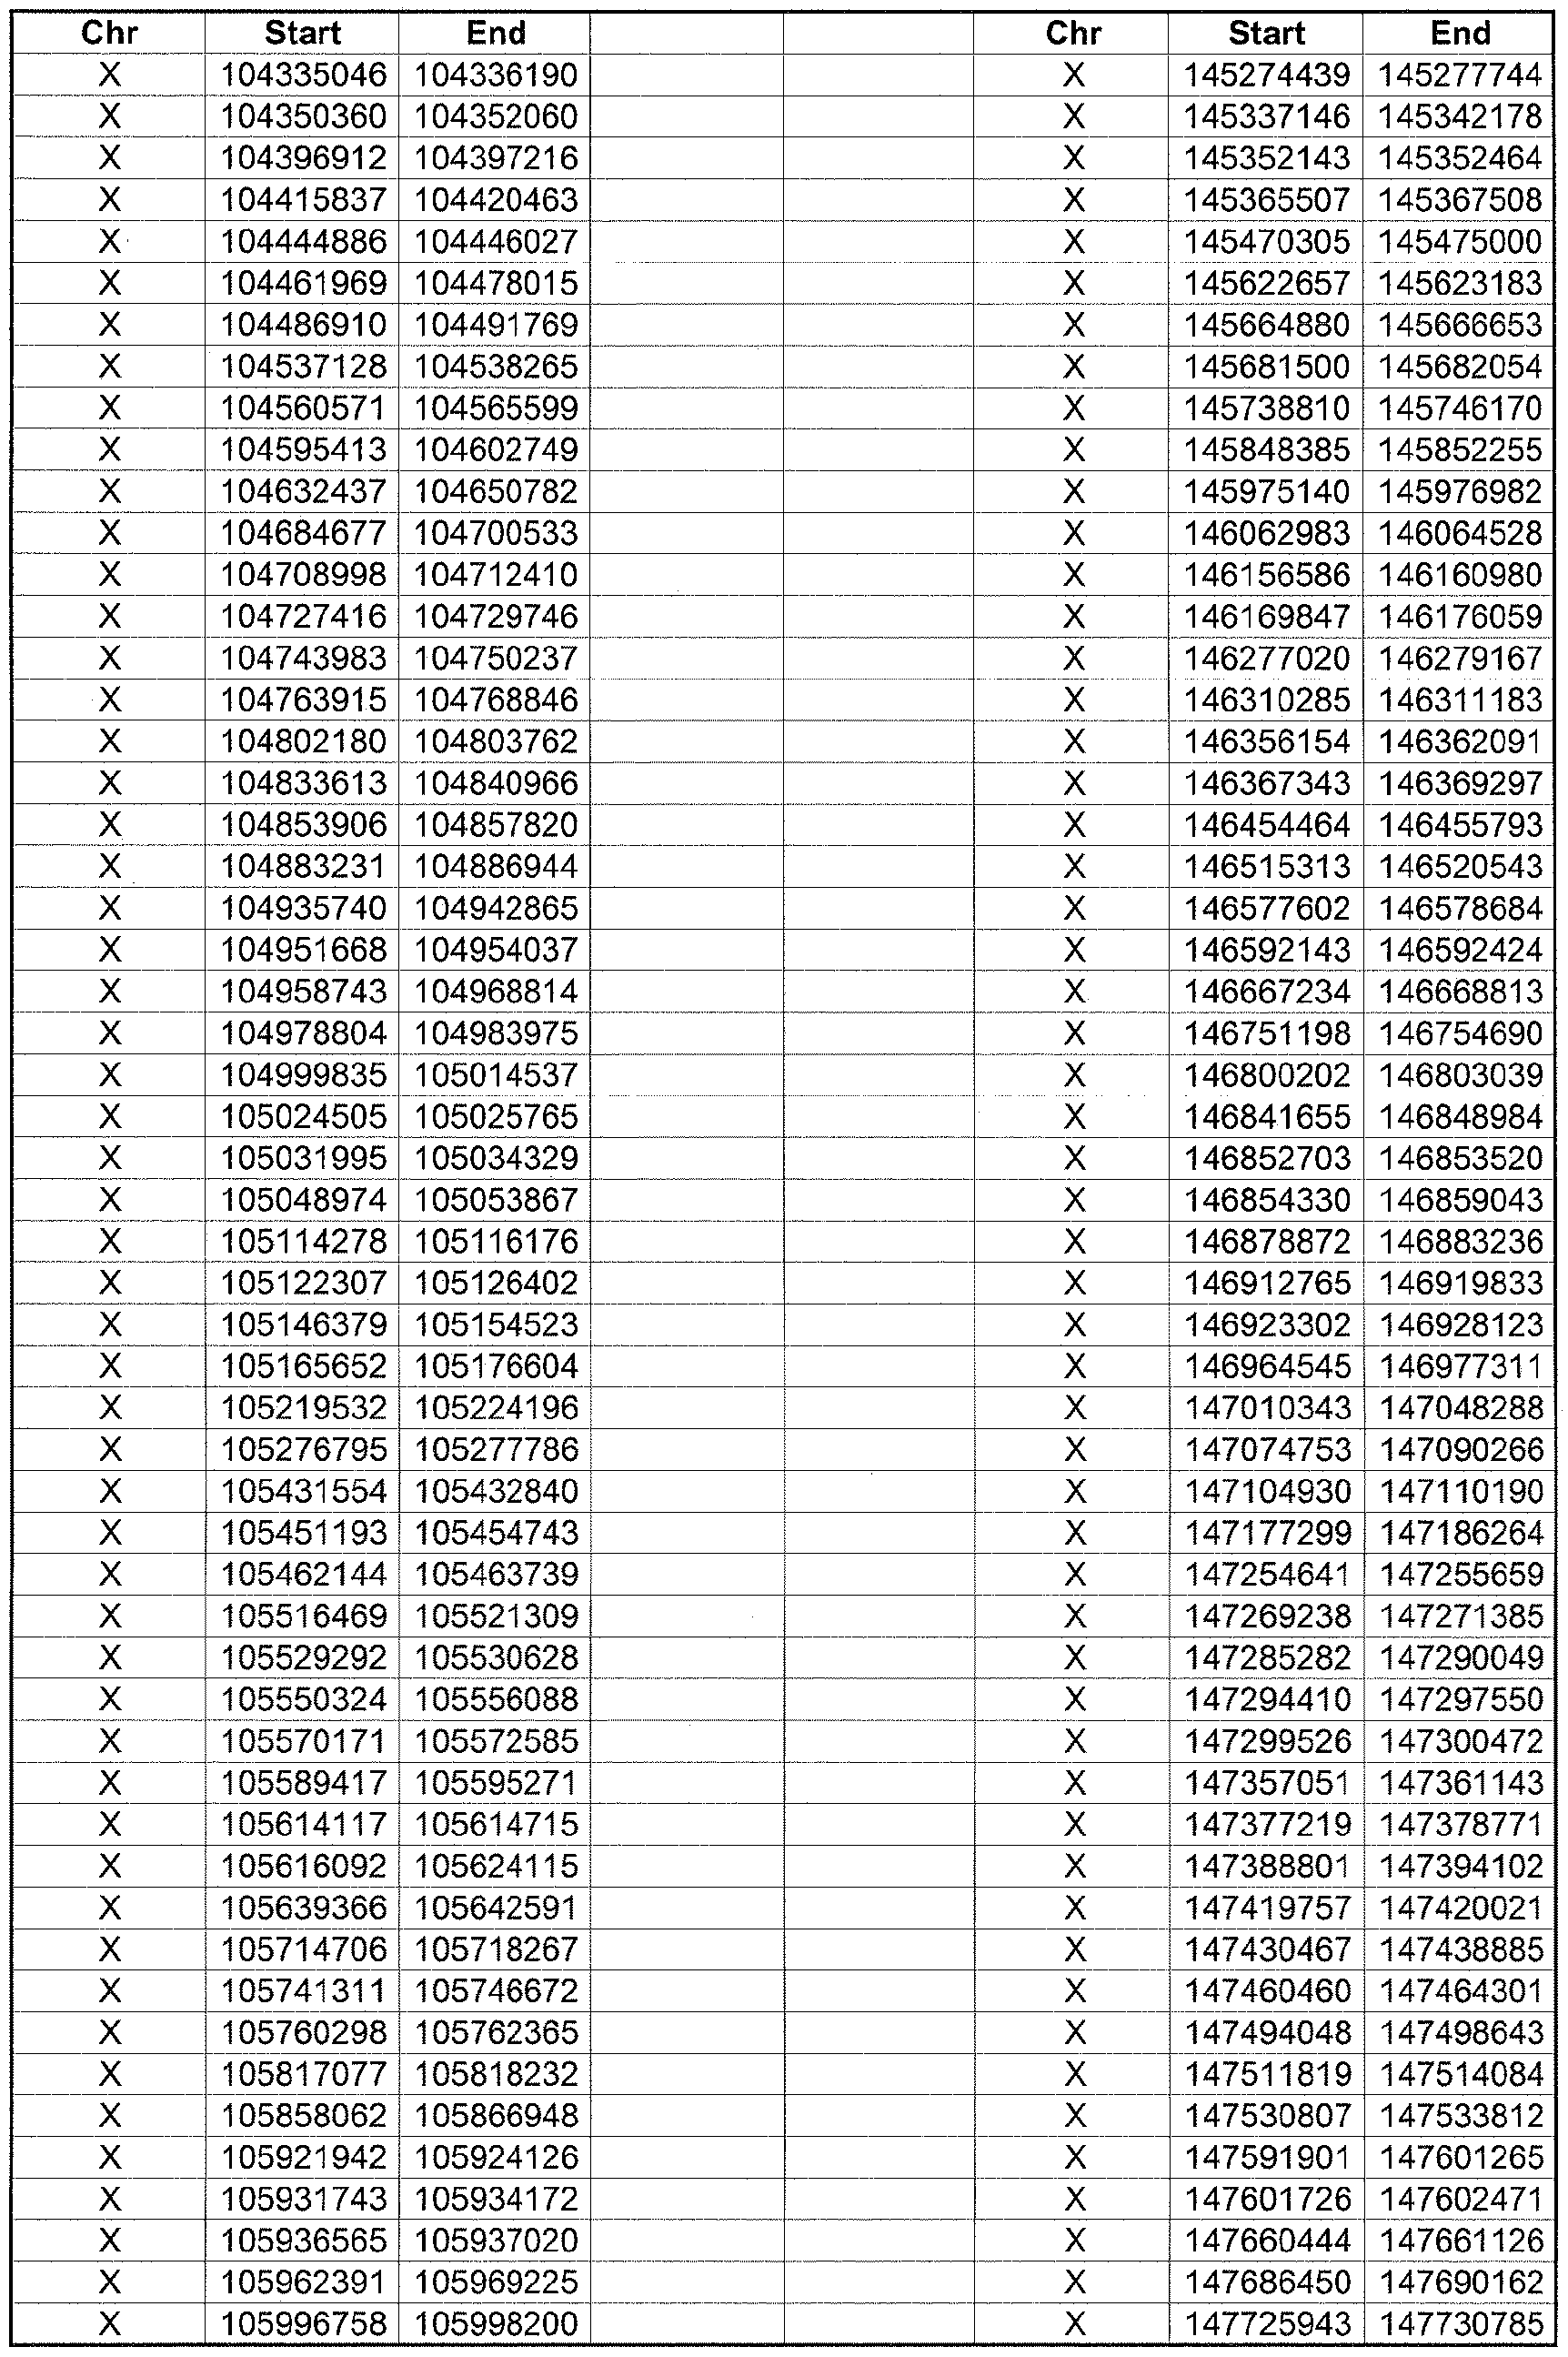


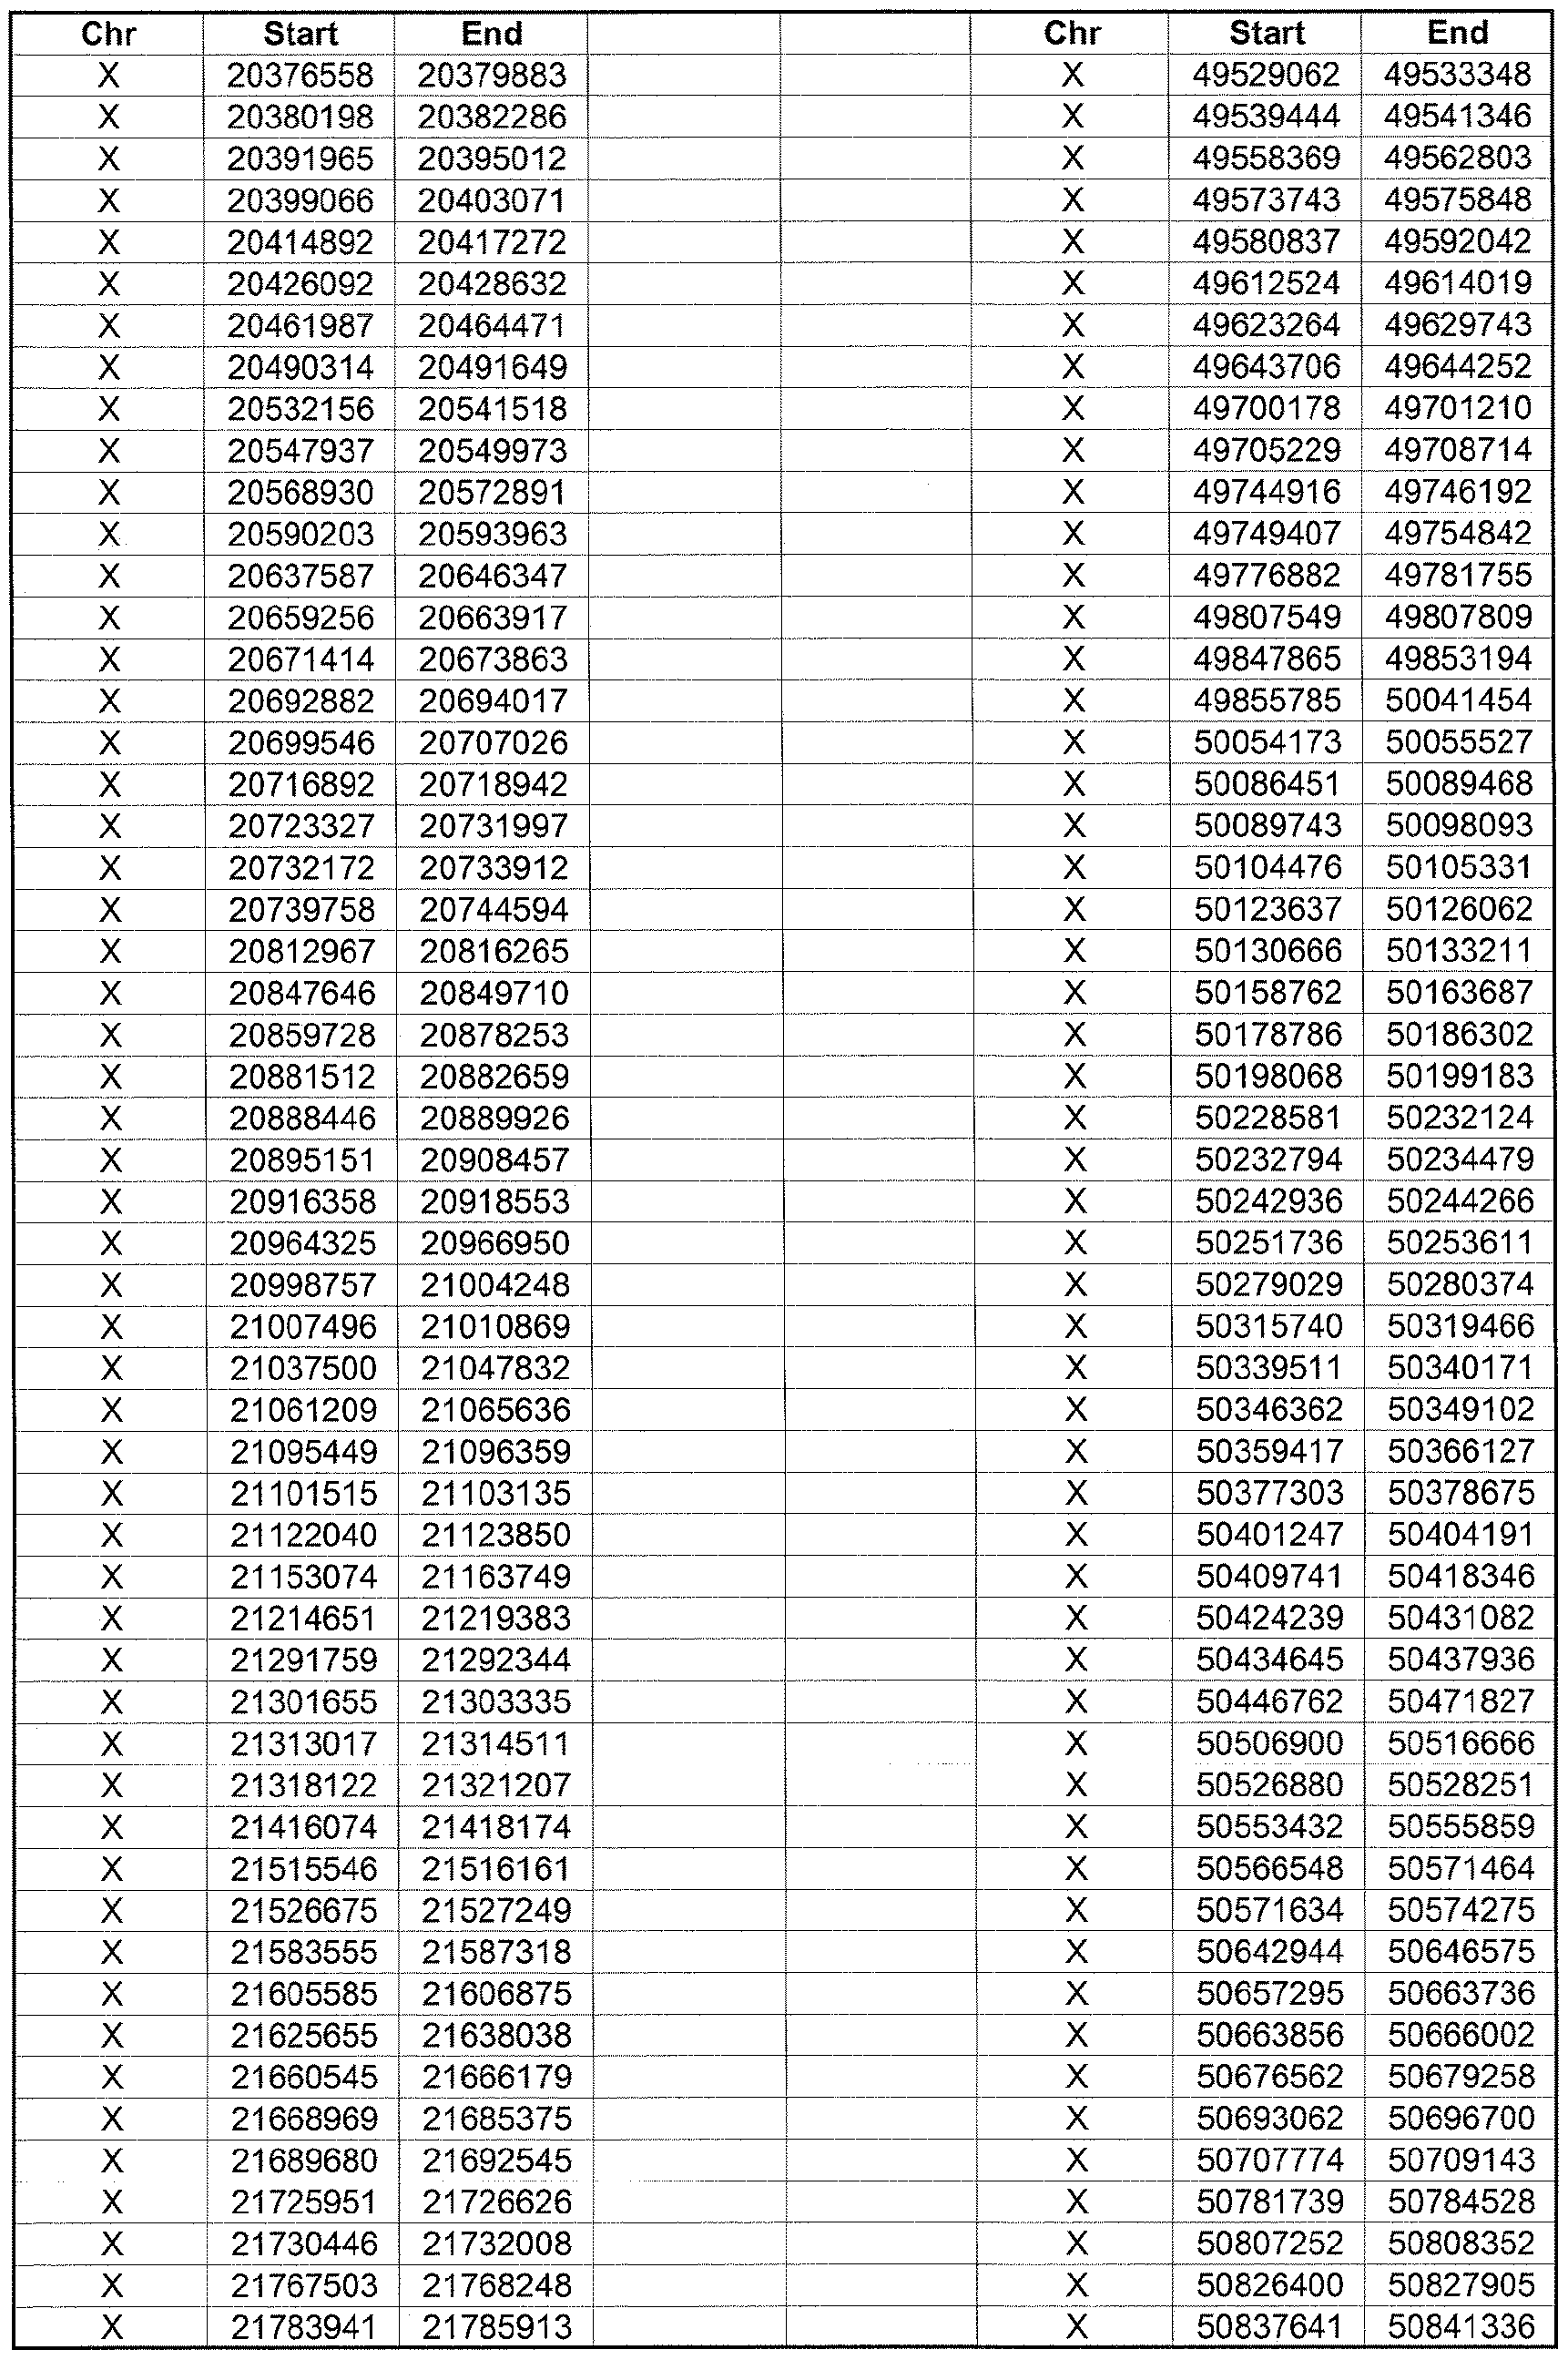
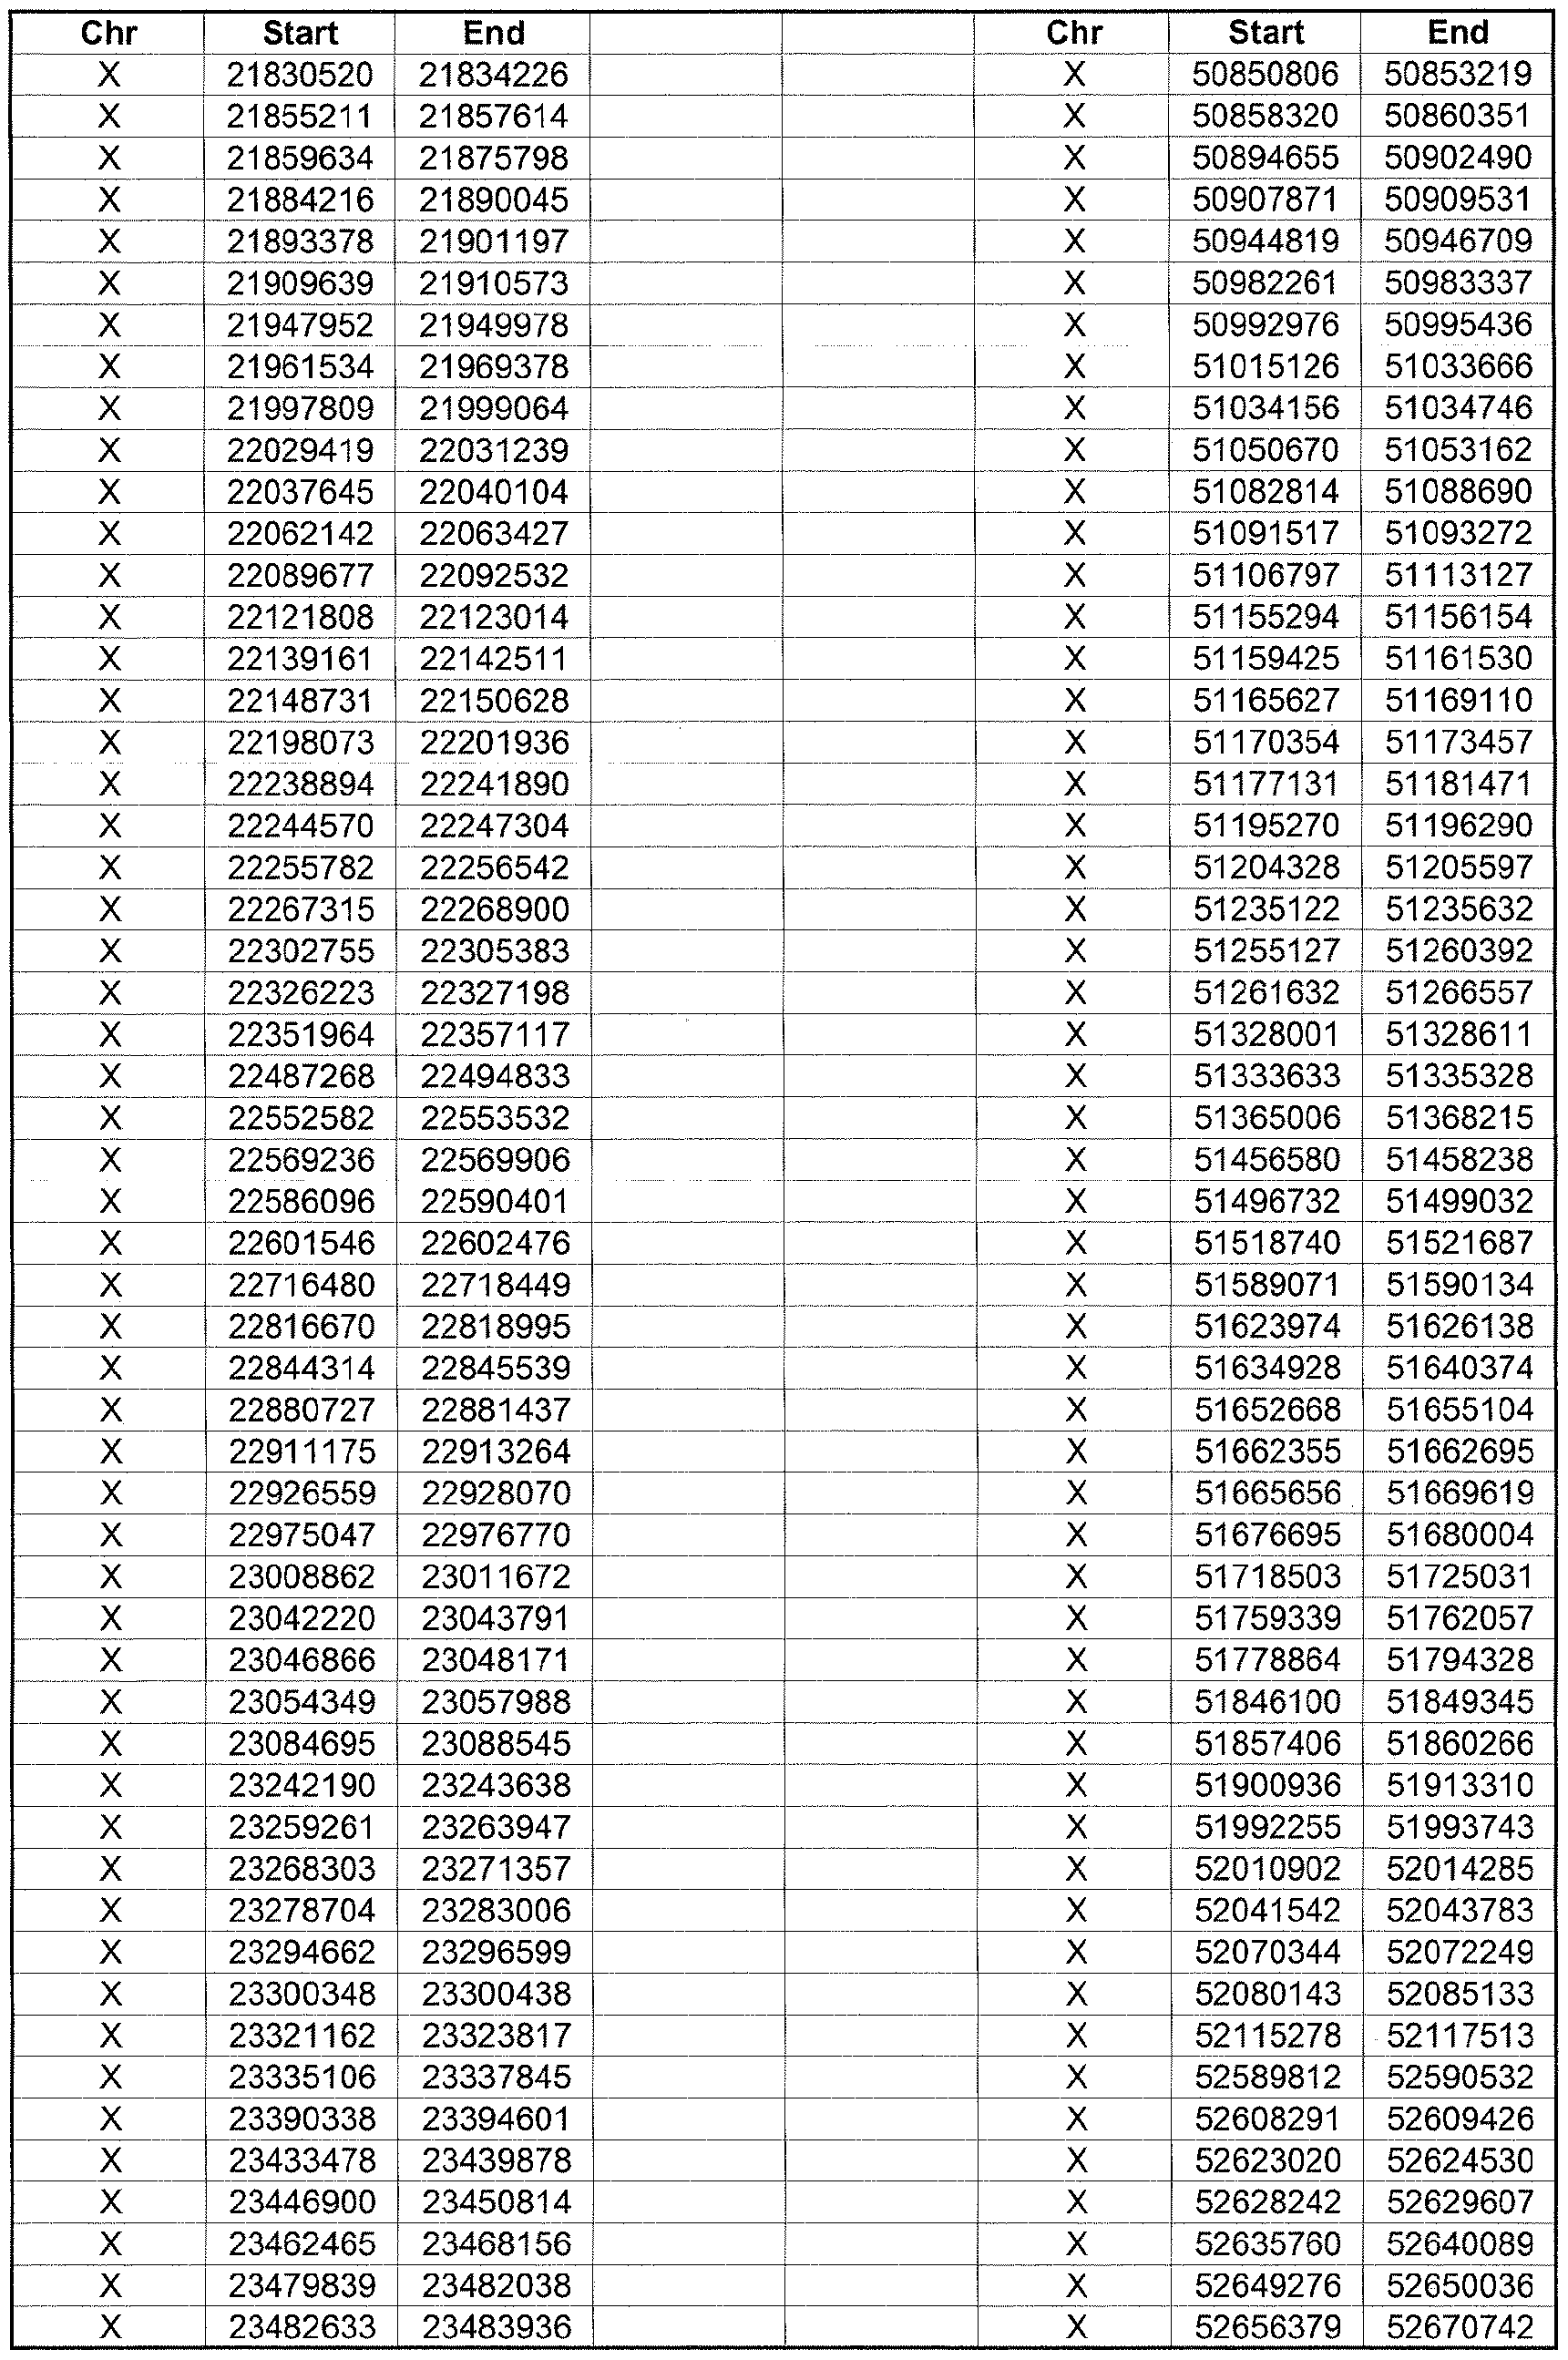


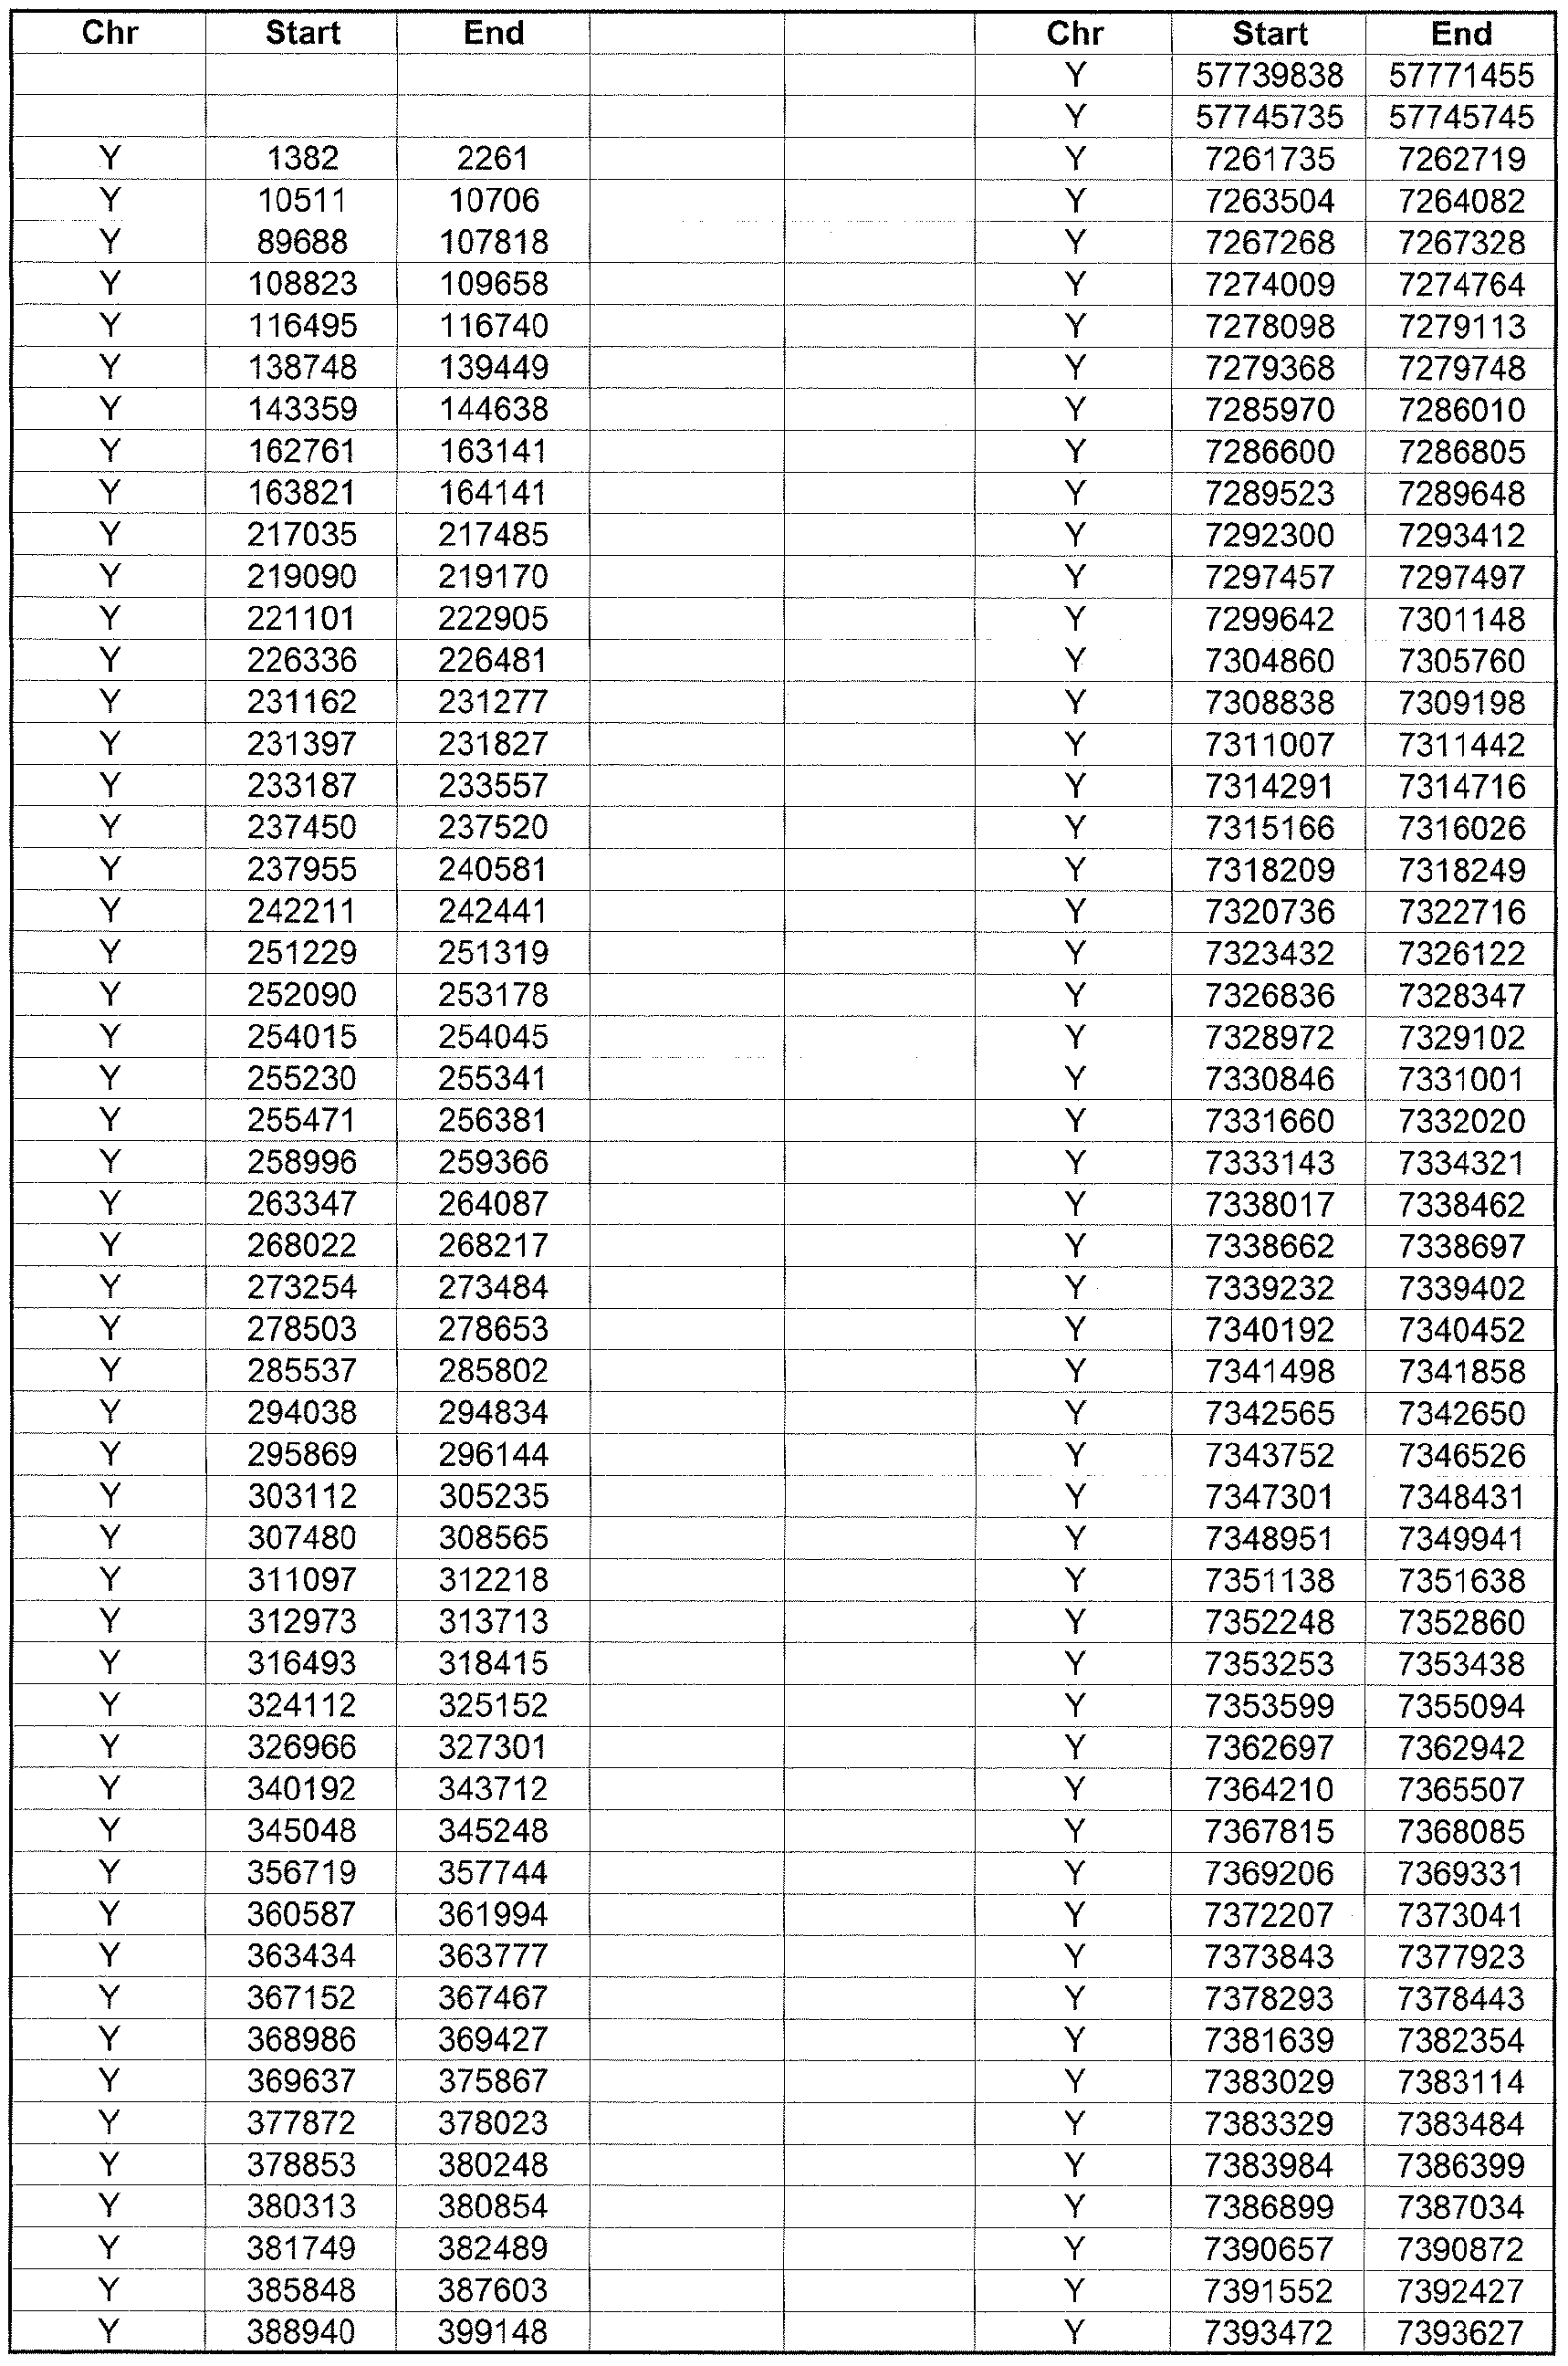


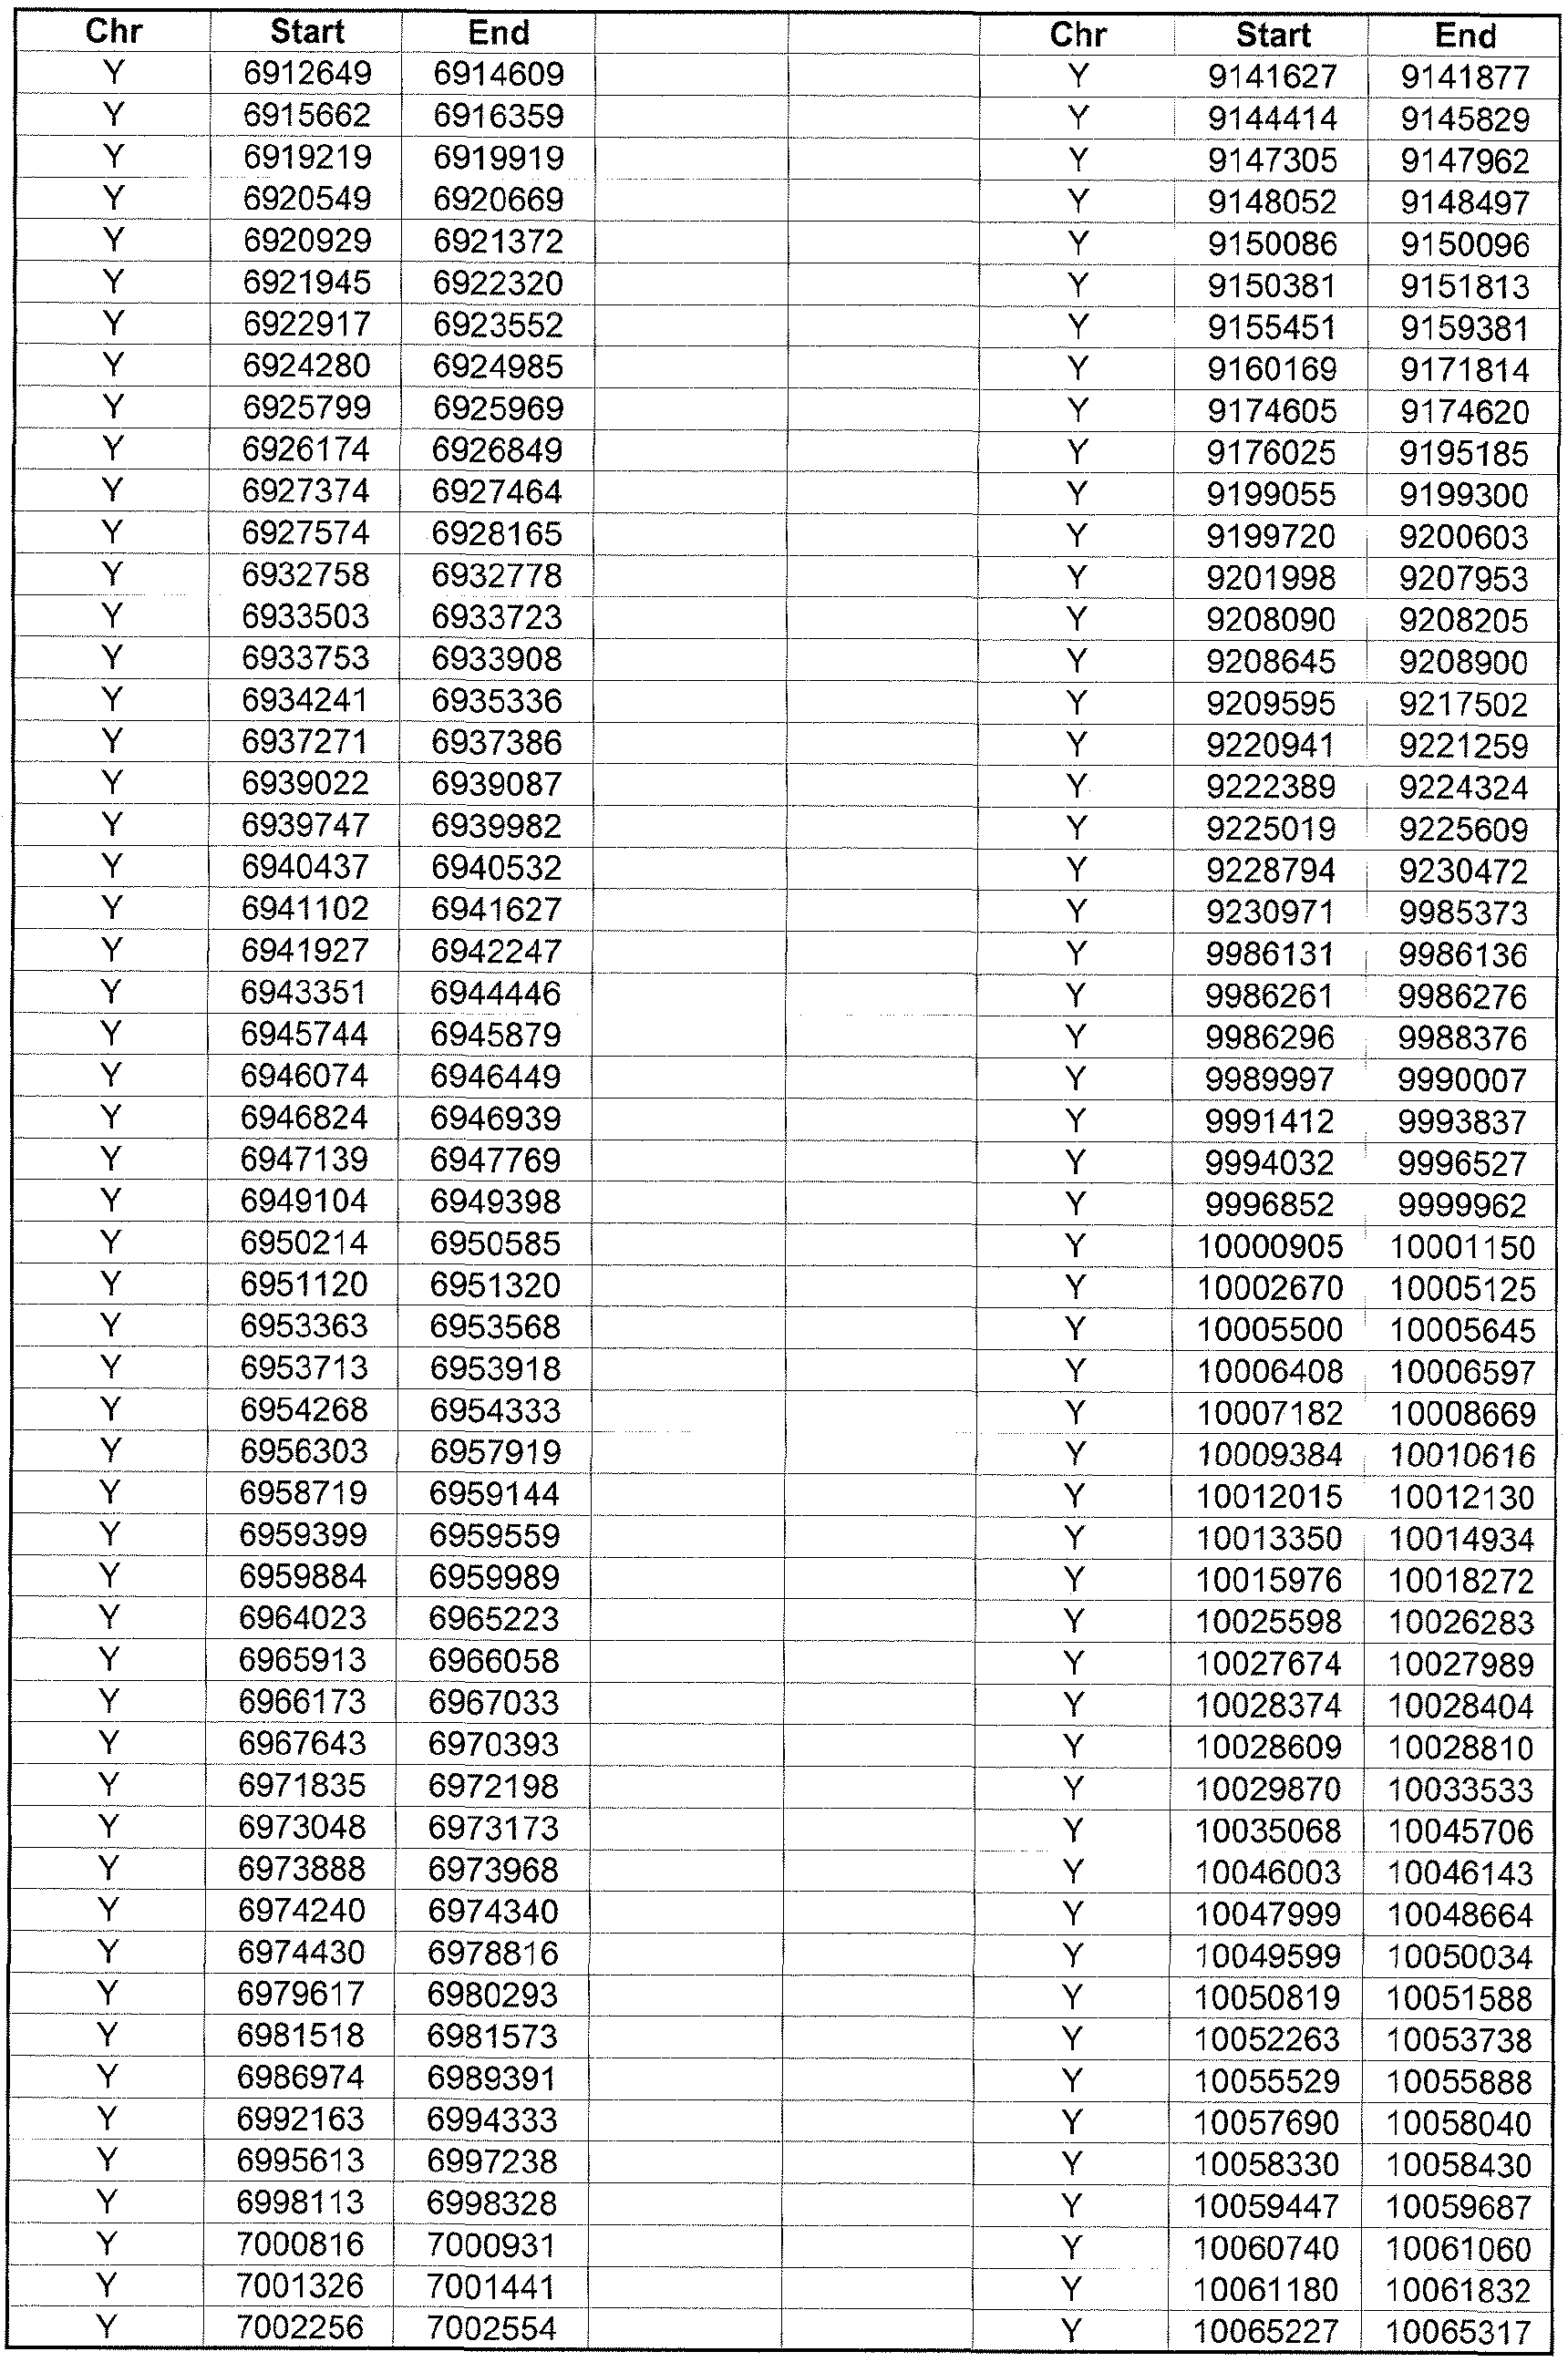


Claims
Priority Applications (13)
| Application Number | Priority Date | Filing Date | Title |
|---|---|---|---|
| SG2012049003A SG182322A1 (en) | 2010-01-26 | 2011-01-26 | Methods and compositions for noninvasive prenatal diagnosis of fetal aneuploidies |
| ES11709465.6T ES2623156T3 (en) | 2010-01-26 | 2011-01-26 | Methods and compositions for the non-invasive prenatal diagnosis of fetal aneuploidies |
| BR112012018458A BR112012018458A2 (en) | 2010-01-26 | 2011-01-26 | Methods and Compositions for Noninvasive Prenatal Diagnosis of Fetal Aneuploidies |
| EA201290716A EA023565B1 (en) | 2010-01-26 | 2011-01-26 | Methods and compositions for noninvasive prenatal diagnosis of fetal aneuploidies |
| DK11709465.6T DK2529032T3 (en) | 2010-01-26 | 2011-01-26 | METHODS AND COMPOSITIONS FOR NON-INVASIVE PRE-NATIONAL DIAGNOSTICATION OF Fetal ANEUPLOIDITIES |
| JP2012550529A JP2013517789A (en) | 2010-01-26 | 2011-01-26 | Methods and compositions for non-invasive prenatal diagnosis of fetal aneuploidy |
| NZ601079A NZ601079A (en) | 2010-01-26 | 2011-01-26 | Methods and compositions for noninvasive prenatal diagnosis of fetal aneuploidies |
| AU2011210255A AU2011210255B2 (en) | 2010-01-26 | 2011-01-26 | Methods and compositions for noninvasive prenatal diagnosis of fetal aneuploidies |
| EP11709465.6A EP2529032B1 (en) | 2010-01-26 | 2011-01-26 | Methods and compositions for noninvasive prenatal diagnosis of fetal aneuploidies |
| US13/520,708 US9249462B2 (en) | 2010-01-26 | 2011-01-26 | Methods and compositions for noninvasive prenatal diagnosis of fetal aneuploidies |
| CA2786174A CA2786174A1 (en) | 2010-01-26 | 2011-01-26 | Methods and compositions for noninvasive prenatal diagnosis of fetal aneuploidies |
| CN2011800097571A CN102892899A (en) | 2010-01-26 | 2011-01-26 | Methods and compositions for noninvasive prenatal diagnosis of fetal aneuploidies |
| CY20171100452T CY1118864T1 (en) | 2010-01-26 | 2017-04-21 | METHODS AND COMPOSITIONS FOR NON-INTERVENTIVE PREGNANCY DIAGNOSIS OF EMBRYOUS DISEASES |
Applications Claiming Priority (4)
| Application Number | Priority Date | Filing Date | Title |
|---|---|---|---|
| US29833910P | 2010-01-26 | 2010-01-26 | |
| US61/298,339 | 2010-01-26 | ||
| US40542110P | 2010-10-21 | 2010-10-21 | |
| US61/405,421 | 2010-10-21 |
Publications (2)
| Publication Number | Publication Date |
|---|---|
| WO2011092592A2 true WO2011092592A2 (en) | 2011-08-04 |
| WO2011092592A3 WO2011092592A3 (en) | 2011-11-03 |
Family
ID=44278821
Family Applications (1)
| Application Number | Title | Priority Date | Filing Date |
|---|---|---|---|
| PCT/IB2011/000217 WO2011092592A2 (en) | 2010-01-26 | 2011-01-26 | Methods and compositions for noninvasive prenatal diagnosis of fetal aneuploidies |
Country Status (17)
| Country | Link |
|---|---|
| US (1) | US9249462B2 (en) |
| EP (1) | EP2529032B1 (en) |
| JP (1) | JP2013517789A (en) |
| KR (1) | KR20120107512A (en) |
| CN (1) | CN102892899A (en) |
| AU (1) | AU2011210255B2 (en) |
| BR (1) | BR112012018458A2 (en) |
| CA (1) | CA2786174A1 (en) |
| CY (1) | CY1118864T1 (en) |
| DK (1) | DK2529032T3 (en) |
| EA (1) | EA023565B1 (en) |
| ES (1) | ES2623156T3 (en) |
| NZ (1) | NZ601079A (en) |
| PL (1) | PL2529032T3 (en) |
| PT (1) | PT2529032T (en) |
| SG (1) | SG182322A1 (en) |
| WO (1) | WO2011092592A2 (en) |
Cited By (21)
| Publication number | Priority date | Publication date | Assignee | Title |
|---|---|---|---|---|
| WO2014043763A1 (en) * | 2012-09-20 | 2014-03-27 | The Chinese University Of Hong Kong | Non-invasive determination of methylome of fetus or tumor from plasma |
| WO2014051522A1 (en) * | 2012-09-26 | 2014-04-03 | Agency For Science, Technology And Research | Biomarkers for down syndrome prenatal diagnosis |
| US8962247B2 (en) | 2008-09-16 | 2015-02-24 | Sequenom, Inc. | Processes and compositions for methylation-based enrichment of fetal nucleic acid from a maternal sample useful for non invasive prenatal diagnoses |
| WO2015138774A1 (en) * | 2014-03-13 | 2015-09-17 | Sequenom, Inc. | Methods and processes for non-invasive assessment of genetic variations |
| EP2942400A1 (en) | 2014-05-09 | 2015-11-11 | Lifecodexx AG | Multiplex detection of DNA that originates from a specific cell-type |
| EP2942401A1 (en) | 2014-05-09 | 2015-11-11 | Lifecodexx AG | Detection of DNA that originates from a specific cell-type |
| WO2015169947A1 (en) * | 2014-05-09 | 2015-11-12 | Lifecodexx Ag | Detection of dna that originates from a specific cell-type and related methods |
| RU2583830C2 (en) * | 2014-04-21 | 2016-05-10 | Закрытое акционерное общество "Геноаналитика" | Non-invasive prenatal diagnosis of foetal aneuploidy |
| WO2016189388A1 (en) | 2015-05-22 | 2016-12-01 | Nipd Genetics Ltd | Multiplexed parallel analysis of targeted genomic regions for non-invasive prenatal testing |
| US9605313B2 (en) | 2012-03-02 | 2017-03-28 | Sequenom, Inc. | Methods and processes for non-invasive assessment of genetic variations |
| EP3168309A1 (en) | 2015-11-10 | 2017-05-17 | Lifecodexx AG | Detection of foetal chromosomal aneuploidies using dna regions that are differentially methylated between the foetus and the pregnant female |
| US9732390B2 (en) | 2012-09-20 | 2017-08-15 | The Chinese University Of Hong Kong | Non-invasive determination of methylome of fetus or tumor from plasma |
| US9920361B2 (en) | 2012-05-21 | 2018-03-20 | Sequenom, Inc. | Methods and compositions for analyzing nucleic acid |
| US9926593B2 (en) | 2009-12-22 | 2018-03-27 | Sequenom, Inc. | Processes and kits for identifying aneuploidy |
| CN109112209A (en) * | 2017-06-25 | 2019-01-01 | 国家卫生计生委科学技术研究所 | Reference material for noninvasive antenatal detection fetal aneuploidy chromosome |
| US10435754B2 (en) | 2006-09-27 | 2019-10-08 | The Chinese University Of Hong Kong | Diagnostic method |
| US10706957B2 (en) | 2012-09-20 | 2020-07-07 | The Chinese University Of Hong Kong | Non-invasive determination of methylome of tumor from plasma |
| US10738358B2 (en) | 2008-09-16 | 2020-08-11 | Sequenom, Inc. | Processes and compositions for methylation-based enrichment of fetal nucleic acid from a maternal sample useful for non-invasive prenatal diagnoses |
| US10781490B2 (en) | 2016-05-30 | 2020-09-22 | The Chinese University Of Hong Kong | Detecting hematological disorders using cell-free DNA in blood |
| US11060145B2 (en) | 2013-03-13 | 2021-07-13 | Sequenom, Inc. | Methods and compositions for identifying presence or absence of hypermethylation or hypomethylation locus |
| US11332791B2 (en) | 2012-07-13 | 2022-05-17 | Sequenom, Inc. | Processes and compositions for methylation-based enrichment of fetal nucleic acid from a maternal sample useful for non-invasive prenatal diagnoses |
Families Citing this family (10)
| Publication number | Priority date | Publication date | Assignee | Title |
|---|---|---|---|---|
| KR20140118682A (en) | 2013-03-29 | 2014-10-08 | (주)셀트리온 | Composition comprising two or more influenza A viruses neutralizing binding molecules |
| US20180187267A1 (en) * | 2017-01-05 | 2018-07-05 | Michael J. Powell | Method for conducting early detection of colon cancer and/or of colon cancer precursor cells and for monitoring colon cancer recurrence |
| US10174383B2 (en) * | 2014-08-13 | 2019-01-08 | Vanadis Diagnostics | Method of estimating the amount of a methylated locus in a sample |
| WO2016176846A1 (en) * | 2015-05-06 | 2016-11-10 | 安诺优达基因科技(北京)有限公司 | Reagent kit, apparatus, and method for detecting chromosome aneuploidy |
| CN108475301A (en) * | 2015-12-04 | 2018-08-31 | 绿十字基因组公司 | The method of copy number variation in sample for determining the mixture comprising nucleic acid |
| KR101817180B1 (en) * | 2016-01-20 | 2018-01-10 | 이원다이애그노믹스(주) | Method of detecting chromosomal abnormalities |
| KR20200060969A (en) | 2018-11-23 | 2020-06-02 | (주)셀트리온 | Dosage Regimen For Treating Influenza Virus-Related Disease |
| US20230151409A1 (en) * | 2020-03-30 | 2023-05-18 | Vilnius University | Methods and compositions for noninvasive prenatal diagnosis through targeted covalent labeling of genomic sites |
| KR102332540B1 (en) * | 2020-07-02 | 2021-11-29 | 의료법인 성광의료재단 | Down syndrome diagnosis method using epigenetic marker specific for Down syndrome |
| WO2023133572A2 (en) * | 2022-01-10 | 2023-07-13 | Washington State University | Dna methylation biomarkers for preterm birth |
Family Cites Families (10)
| Publication number | Priority date | Publication date | Assignee | Title |
|---|---|---|---|---|
| US6582908B2 (en) * | 1990-12-06 | 2003-06-24 | Affymetrix, Inc. | Oligonucleotides |
| US20050282213A1 (en) | 2003-09-22 | 2005-12-22 | Trisogen Biotechnology Limited Partnership | Methods and kits useful for detecting an alteration in a locus copy number |
| DE602004018009D1 (en) | 2003-09-22 | 2009-01-08 | Trisogen Biotechnology Ltd Par | PROVIDING PROCEDURES FOR DETERMINING A CHANGE IN A LOCUS COPIAL AMOUNT |
| GB0413688D0 (en) | 2004-06-18 | 2004-07-21 | Novartis Forschungsstiftung | Analysis of methylated nucleic acid |
| US9074013B2 (en) | 2004-11-29 | 2015-07-07 | Sequenom, Inc. | Means and methods for detecting methylated DNA |
| US20090042195A1 (en) | 2005-10-07 | 2009-02-12 | Bradford Coffee | Methods and systems for screening for and diagnosing dna methylation associated abnormalities and sex chromosome aneuploidies |
| US7901884B2 (en) | 2006-05-03 | 2011-03-08 | The Chinese University Of Hong Kong | Markers for prenatal diagnosis and monitoring |
| EP2527471B1 (en) | 2007-07-23 | 2020-03-04 | The Chinese University of Hong Kong | Diagnosing cancer using genomic sequencing |
| JP5322471B2 (en) | 2008-03-27 | 2013-10-23 | シスメックス株式会社 | Method for analyzing methylated DNA and primer set |
| US8476013B2 (en) | 2008-09-16 | 2013-07-02 | Sequenom, Inc. | Processes and compositions for methylation-based acid enrichment of fetal nucleic acid from a maternal sample useful for non-invasive prenatal diagnoses |
-
2011
- 2011-01-26 DK DK11709465.6T patent/DK2529032T3/en active
- 2011-01-26 EP EP11709465.6A patent/EP2529032B1/en active Active
- 2011-01-26 JP JP2012550529A patent/JP2013517789A/en active Pending
- 2011-01-26 AU AU2011210255A patent/AU2011210255B2/en active Active
- 2011-01-26 PT PT117094656T patent/PT2529032T/en unknown
- 2011-01-26 BR BR112012018458A patent/BR112012018458A2/en not_active IP Right Cessation
- 2011-01-26 KR KR1020127020832A patent/KR20120107512A/en not_active Application Discontinuation
- 2011-01-26 CA CA2786174A patent/CA2786174A1/en not_active Abandoned
- 2011-01-26 US US13/520,708 patent/US9249462B2/en active Active
- 2011-01-26 EA EA201290716A patent/EA023565B1/en not_active IP Right Cessation
- 2011-01-26 ES ES11709465.6T patent/ES2623156T3/en active Active
- 2011-01-26 NZ NZ601079A patent/NZ601079A/en unknown
- 2011-01-26 PL PL11709465T patent/PL2529032T3/en unknown
- 2011-01-26 SG SG2012049003A patent/SG182322A1/en unknown
- 2011-01-26 CN CN2011800097571A patent/CN102892899A/en active Pending
- 2011-01-26 WO PCT/IB2011/000217 patent/WO2011092592A2/en active Application Filing
-
2017
- 2017-04-21 CY CY20171100452T patent/CY1118864T1/en unknown
Non-Patent Citations (35)
| Title |
|---|
| BIANCHI, D.W. ET AL., OBSTET. GYNECOL., vol. 106, 2005, pages 841 - 844 |
| CHAN, K.C. ET AL., CLIN. CHEM., vol. 50, 2004, pages 88 - 92 |
| CHIM, S.S. ET AL., CLIN. CHEM., vol. 54, 2008, pages 500 - 511 |
| CHIM, S.S. ET AL., PROC. NATL. ACAD. SCI. USA, vol. 102, 2005, pages 14753 - 14758 |
| CHIM, S.S., PROC. NATL. ACAD. SCI. USA, vol. 11, 2005, pages 14753 - 14758 |
| CHIU, R.W. ET AL., PROC. NATL. ACAD. SCI USA., vol. 105, 2008, pages 20458 - 63 |
| CHIU, R.W., AM. J. PATHOL., vol. 170, 2007, pages 941 - 950 |
| FAN, H.C., PROC. NATL. ACAD. SCI. USA, vol. 105, 2008, pages 16266 - 71 |
| FAZZARI, M.J. ET AL., NAT. REV. GENET., vol. 5, 2004, pages 446 - 455 |
| FIORI, E. ET AL., HUM. REPROD., vol. 19, 2004, pages 723 - 724 |
| GRUNAU, C. E, NUCL. ACIDS RES., vol. 29, 2001, pages E65 - E65 |
| GRUNAU, C. ET AL., NUCL. ACIDS RES., vol. 29, 2001, pages E65 - 5 |
| HULTÉN, M.A. ET AL., REPRODUCTION, vol. 126, 2003, pages 279 - 297 |
| LO, Y.M. ET AL., LANCET, vol. 350, 1997, pages 485 - 487 |
| LO, Y.M. ET AL., N. ENGL. J. MED., vol. 339, 1998, pages 1734 - 1738 |
| LO, Y.M. ET AL., NAT. MED., vol. 13, 2007, pages 218 - 223 |
| LO, Y.M., NAT. MED., vol. 13, 2007, pages 218 - 223 |
| MASUZAKI, H. ET AL., J. MED. GENET., vol. 41, 2004, pages 289 - 292 |
| OBERLEY, M.J. ET AL., METHODS ENZYMOL., vol. 376, 2004, pages 315 - 334 |
| OBERLEY, M.J. ET AL., METHODS ENZYMOL., vol. 376, 2005, pages 315 - 334 |
| OLD, R.W. ET AL., REPROD. BIOMED. ONLINE, vol. 15, 2007, pages 227 - 235 |
| PAPAGEORGIOU, E.A. ET AL., AM. J. PATHOL., vol. 174, 2009, pages 1609 - 1618 |
| POON, L.L. ET AL., CLIN. CHEM., vol. 48, 2002, pages 35 - 41 |
| PRICE, T.S. ET AL., NUCLEIC ACIDS RES., vol. 16, 2005, pages 3455 - 3464 |
| RAKYAN ET AL., GENOME RES., vol. 18, 2008, pages 1518 - 1529 |
| RAKYAN, K.V. ET AL., GENOME RESEARCH, vol. 18, 2008, pages 1518 - 1529 |
| REN, B. ET AL., SCIENCE, vol. 22, 2000, pages 2306 - 2309 |
| REN, B., SCIENCE, vol. 22, 2000, pages 2306 - 2309 |
| TONG, Y.K., CLIN. CHEM., vol. 56, 2009, pages 90 - 98 |
| TSUI, N.B. ET AL., CLIN. CHEM., vol. 51, 2005, pages 2358 - 2362 |
| TSUI, N.B. ET AL., PRENAT. DIAGN., vol. 29, 2009, pages 1031 - 1037 |
| TSUI, N.B.; LO, Y.M., METHODS MOL. BIOL., vol. 444, 2008, pages 275 - 289 |
| WALD, N.J., NEW ENG. J. MED., vol. 341, 1999, pages 461 - 467 |
| WEBER, M. ET AL., NAT. GENET., vol. 37, 2005, pages 853 - 862 |
| WEISZ, B.; RODECK, C.H., HUM. REPROD. UPDATE, vol. 12, 2006, pages 513 - 518 |
Cited By (49)
| Publication number | Priority date | Publication date | Assignee | Title |
|---|---|---|---|---|
| US11898208B2 (en) | 2006-09-27 | 2024-02-13 | The Chinese University Of Hong Kong | Diagnostic method |
| US10435754B2 (en) | 2006-09-27 | 2019-10-08 | The Chinese University Of Hong Kong | Diagnostic method |
| US8962247B2 (en) | 2008-09-16 | 2015-02-24 | Sequenom, Inc. | Processes and compositions for methylation-based enrichment of fetal nucleic acid from a maternal sample useful for non invasive prenatal diagnoses |
| US10738358B2 (en) | 2008-09-16 | 2020-08-11 | Sequenom, Inc. | Processes and compositions for methylation-based enrichment of fetal nucleic acid from a maternal sample useful for non-invasive prenatal diagnoses |
| US10612086B2 (en) | 2008-09-16 | 2020-04-07 | Sequenom, Inc. | Processes and compositions for methylation-based enrichment of fetal nucleic acid from a maternal sample useful for non-invasive prenatal diagnoses |
| US11180799B2 (en) | 2009-12-22 | 2021-11-23 | Sequenom, Inc. | Processes and kits for identifying aneuploidy |
| US9926593B2 (en) | 2009-12-22 | 2018-03-27 | Sequenom, Inc. | Processes and kits for identifying aneuploidy |
| US9605313B2 (en) | 2012-03-02 | 2017-03-28 | Sequenom, Inc. | Methods and processes for non-invasive assessment of genetic variations |
| US11312997B2 (en) | 2012-03-02 | 2022-04-26 | Sequenom, Inc. | Methods and processes for non-invasive assessment of genetic variations |
| US10738359B2 (en) | 2012-03-02 | 2020-08-11 | Sequenom, Inc. | Methods and processes for non-invasive assessment of genetic variations |
| US11306354B2 (en) | 2012-05-21 | 2022-04-19 | Sequenom, Inc. | Methods and compositions for analyzing nucleic acid |
| US9920361B2 (en) | 2012-05-21 | 2018-03-20 | Sequenom, Inc. | Methods and compositions for analyzing nucleic acid |
| US11332791B2 (en) | 2012-07-13 | 2022-05-17 | Sequenom, Inc. | Processes and compositions for methylation-based enrichment of fetal nucleic acid from a maternal sample useful for non-invasive prenatal diagnoses |
| US10706957B2 (en) | 2012-09-20 | 2020-07-07 | The Chinese University Of Hong Kong | Non-invasive determination of methylome of tumor from plasma |
| US10392666B2 (en) | 2012-09-20 | 2019-08-27 | The Chinese University Of Hong Kong | Non-invasive determination of methylome of tumor from plasma |
| US9732390B2 (en) | 2012-09-20 | 2017-08-15 | The Chinese University Of Hong Kong | Non-invasive determination of methylome of fetus or tumor from plasma |
| EP2898100B1 (en) | 2012-09-20 | 2017-11-22 | The Chinese University Of Hong Kong | Non-invasive determination of methylome of fetus or tumor from plasma |
| AU2013317708C1 (en) * | 2012-09-20 | 2017-11-23 | The Chinese University Of Hong Kong | Non-invasive determination of methylome of fetus or tumor from plasma |
| EP2898100B2 (en) † | 2012-09-20 | 2023-05-10 | The Chinese University Of Hong Kong | Non-invasive determination of methylome of fetus or tumor from plasma |
| CN104781422B (en) * | 2012-09-20 | 2023-12-26 | 香港中文大学 | Noninvasive measurement of fetal or tumor methylation patterns from plasma |
| US11274347B2 (en) | 2012-09-20 | 2022-03-15 | The Chinese University Of Hong Kong | Non-invasive determination of type of cancer |
| WO2014043763A1 (en) * | 2012-09-20 | 2014-03-27 | The Chinese University Of Hong Kong | Non-invasive determination of methylome of fetus or tumor from plasma |
| AU2013317708B2 (en) * | 2012-09-20 | 2017-08-03 | The Chinese University Of Hong Kong | Non-invasive determination of methylome of fetus or tumor from plasma |
| TWI806621B (en) * | 2012-09-20 | 2023-06-21 | 香港中文大學 | Non-invasive determination of methylome of fetus or tumor from plasma |
| CN104781422A (en) * | 2012-09-20 | 2015-07-15 | 香港中文大学 | Non-invasive determination of methylome of fetus or tumor from plasma |
| WO2014051522A1 (en) * | 2012-09-26 | 2014-04-03 | Agency For Science, Technology And Research | Biomarkers for down syndrome prenatal diagnosis |
| CN104838013A (en) * | 2012-09-26 | 2015-08-12 | 新加坡科技研究局 | Biomarkers for down syndrome prenatal diagnosis |
| US11060145B2 (en) | 2013-03-13 | 2021-07-13 | Sequenom, Inc. | Methods and compositions for identifying presence or absence of hypermethylation or hypomethylation locus |
| US11365447B2 (en) | 2014-03-13 | 2022-06-21 | Sequenom, Inc. | Methods and processes for non-invasive assessment of genetic variations |
| EP3736344A1 (en) * | 2014-03-13 | 2020-11-11 | Sequenom, Inc. | Methods and processes for non-invasive assessment of genetic variations |
| WO2015138774A1 (en) * | 2014-03-13 | 2015-09-17 | Sequenom, Inc. | Methods and processes for non-invasive assessment of genetic variations |
| RU2583830C2 (en) * | 2014-04-21 | 2016-05-10 | Закрытое акционерное общество "Геноаналитика" | Non-invasive prenatal diagnosis of foetal aneuploidy |
| WO2015169947A1 (en) * | 2014-05-09 | 2015-11-12 | Lifecodexx Ag | Detection of dna that originates from a specific cell-type and related methods |
| EP2942400A1 (en) | 2014-05-09 | 2015-11-11 | Lifecodexx AG | Multiplex detection of DNA that originates from a specific cell-type |
| EP2942401A1 (en) | 2014-05-09 | 2015-11-11 | Lifecodexx AG | Detection of DNA that originates from a specific cell-type |
| US10801067B2 (en) | 2014-05-09 | 2020-10-13 | Eurofins Lifecodexx Gmbh | Detection of DNA that originates from a specific cell-type and related methods |
| EP3521454A1 (en) | 2014-05-09 | 2019-08-07 | LifeCodexx AG | Detection of dna that originates from a specific cell-type and related methods |
| US11965207B2 (en) | 2014-05-09 | 2024-04-23 | Eurofins Lifecodexx Gmbh | Detection of DNA that originates from a specific cell-type and related methods |
| US11773443B2 (en) | 2014-05-09 | 2023-10-03 | Eurofins Lifecodexx Gmbh | Multiplex detection of DNA that originates from a specific cell-type |
| US11111538B2 (en) | 2015-05-22 | 2021-09-07 | Nipd Genetics Public Company Ltd | Multiplexed parallel analysis of targeted genomic regions for non-invasive prenatal testing |
| WO2016189388A1 (en) | 2015-05-22 | 2016-12-01 | Nipd Genetics Ltd | Multiplexed parallel analysis of targeted genomic regions for non-invasive prenatal testing |
| EP3666902A1 (en) | 2015-05-22 | 2020-06-17 | Nipd Genetics Public Company Limited | Multiplexed parallel analysis of targeted genomic regions for non-invasive prenatal testing |
| WO2017081047A1 (en) | 2015-11-10 | 2017-05-18 | Lifecodexx Ag | Detection of foetal chromosomal aneuploidies using dna regions that are differentially methylated between the foetus and the pregnant female |
| EP3168309A1 (en) | 2015-11-10 | 2017-05-17 | Lifecodexx AG | Detection of foetal chromosomal aneuploidies using dna regions that are differentially methylated between the foetus and the pregnant female |
| US11753684B2 (en) | 2015-11-10 | 2023-09-12 | Eurofins Lifecodexx Gmbh | Detection of fetal chromosomal aneuploidies using DNA regions that are differentially methylated between the fetus and the pregnant female |
| US10781490B2 (en) | 2016-05-30 | 2020-09-22 | The Chinese University Of Hong Kong | Detecting hematological disorders using cell-free DNA in blood |
| US11873527B2 (en) | 2016-05-30 | 2024-01-16 | The Chinese University Of Hong Kong | Methods and computer products for measuring the amount of cells of a particular cell lineage |
| CN109112209B (en) * | 2017-06-25 | 2022-06-24 | 国家卫生计生委科学技术研究所 | Reference product for noninvasive prenatal detection of fetal aneuploid chromosomes |
| CN109112209A (en) * | 2017-06-25 | 2019-01-01 | 国家卫生计生委科学技术研究所 | Reference material for noninvasive antenatal detection fetal aneuploidy chromosome |
Also Published As
| Publication number | Publication date |
|---|---|
| CN102892899A (en) | 2013-01-23 |
| KR20120107512A (en) | 2012-10-02 |
| JP2013517789A (en) | 2013-05-20 |
| CY1118864T1 (en) | 2018-01-10 |
| EA023565B1 (en) | 2016-06-30 |
| BR112012018458A2 (en) | 2018-07-10 |
| CA2786174A1 (en) | 2011-08-04 |
| EP2529032B1 (en) | 2017-01-25 |
| NZ601079A (en) | 2014-08-29 |
| SG182322A1 (en) | 2012-08-30 |
| WO2011092592A3 (en) | 2011-11-03 |
| ES2623156T3 (en) | 2017-07-10 |
| AU2011210255A1 (en) | 2012-07-26 |
| AU2011210255B2 (en) | 2014-11-20 |
| PL2529032T3 (en) | 2017-07-31 |
| DK2529032T3 (en) | 2017-05-01 |
| EA201290716A1 (en) | 2013-06-28 |
| US20120282613A1 (en) | 2012-11-08 |
| PT2529032T (en) | 2017-05-04 |
| US9249462B2 (en) | 2016-02-02 |
| EP2529032A2 (en) | 2012-12-05 |
Similar Documents
| Publication | Publication Date | Title |
|---|---|---|
| AU2011210255B2 (en) | Methods and compositions for noninvasive prenatal diagnosis of fetal aneuploidies | |
| US10767228B2 (en) | Fetal chromosomal aneuploidy diagnosis | |
| Pös et al. | Recent trends in prenatal genetic screening and testing | |
| Papageorgiou et al. | Sites of differential DNA methylation between placenta and peripheral blood: molecular markers for noninvasive prenatal diagnosis of aneuploidies | |
| US11753684B2 (en) | Detection of fetal chromosomal aneuploidies using DNA regions that are differentially methylated between the fetus and the pregnant female | |
| JP2023033606A (en) | Processes and compositions for methylation-based enrichment of fetal nucleic acid from maternal sample useful for non invasive prenatal diagnoses | |
| Nygren et al. | Quantification of fetal DNA by use of methylation-based DNA discrimination | |
| EP2010676B1 (en) | Method and kit for molecular chromosomal quantification | |
| Tong et al. | Epigenetic-genetic chromosome dosage approach for fetal trisomy 21 detection using an autosomal genetic reference marker | |
| EP2872648A1 (en) | Processes and compositions for methylation-based enrichment of fetal nucleic acid from a maternal sample useful for non-invasive prenatal diagnoses | |
| AU2017251674A1 (en) | Processes and compositions for methylation-based enrichment of fetal nucleic acid from a maternal sample useful for non invasive prenatal diagnoses | |
| Chen et al. | Hypermethylated ERG as a cell-free fetal DNA biomarker for non-invasive prenatal testing of Down syndrome | |
| van den Oever | Noninvasive prenatal detection of genetic defects. | |
| Yurdakul et al. | Performance of MLPA as a screening method for aneuploidy in uncultured amniocytes | |
| Rakyan et al. | An integrated resource for genome-wide identification and analysis |
Legal Events
| Date | Code | Title | Description |
|---|---|---|---|
| WWE | Wipo information: entry into national phase |
Ref document number: 201180009757.1 Country of ref document: CN |
|
| 121 | Ep: the epo has been informed by wipo that ep was designated in this application |
Ref document number: 11709465 Country of ref document: EP Kind code of ref document: A1 |
|
| ENP | Entry into the national phase |
Ref document number: 2786174 Country of ref document: CA |
|
| WWE | Wipo information: entry into national phase |
Ref document number: 2011210255 Country of ref document: AU |
|
| WWE | Wipo information: entry into national phase |
Ref document number: 13520708 Country of ref document: US Ref document number: 220805 Country of ref document: IL |
|
| REEP | Request for entry into the european phase |
Ref document number: 2011709465 Country of ref document: EP |
|
| WWE | Wipo information: entry into national phase |
Ref document number: 2011709465 Country of ref document: EP |
|
| WWE | Wipo information: entry into national phase |
Ref document number: 2012550529 Country of ref document: JP |
|
| ENP | Entry into the national phase |
Ref document number: 2011210255 Country of ref document: AU Date of ref document: 20110126 Kind code of ref document: A |
|
| NENP | Non-entry into the national phase |
Ref country code: DE |
|
| WWE | Wipo information: entry into national phase |
Ref document number: 6846/DELNP/2012 Country of ref document: IN |
|
| ENP | Entry into the national phase |
Ref document number: 20127020832 Country of ref document: KR Kind code of ref document: A |
|
| WWE | Wipo information: entry into national phase |
Ref document number: 201290716 Country of ref document: EA |
|
| REG | Reference to national code |
Ref country code: BR Ref legal event code: B01A Ref document number: 112012018458 Country of ref document: BR |
|
| ENP | Entry into the national phase |
Ref document number: 112012018458 Country of ref document: BR Kind code of ref document: A2 Effective date: 20120724 |