WO2011040014A1 - Diagnosis assisting system, diagnosis assisting program, and diagnosis assisting method - Google Patents
Diagnosis assisting system, diagnosis assisting program, and diagnosis assisting method Download PDFInfo
- Publication number
- WO2011040014A1 WO2011040014A1 PCT/JP2010/005864 JP2010005864W WO2011040014A1 WO 2011040014 A1 WO2011040014 A1 WO 2011040014A1 JP 2010005864 W JP2010005864 W JP 2010005864W WO 2011040014 A1 WO2011040014 A1 WO 2011040014A1
- Authority
- WO
- WIPO (PCT)
- Prior art keywords
- blood vessel
- color
- state
- cross
- cpr image
- Prior art date
Links
Images


Classifications
-
- G—PHYSICS
- G06—COMPUTING; CALCULATING OR COUNTING
- G06T—IMAGE DATA PROCESSING OR GENERATION, IN GENERAL
- G06T7/00—Image analysis
- G06T7/0002—Inspection of images, e.g. flaw detection
- G06T7/0012—Biomedical image inspection
-
- G—PHYSICS
- G06—COMPUTING; CALCULATING OR COUNTING
- G06T—IMAGE DATA PROCESSING OR GENERATION, IN GENERAL
- G06T11/00—2D [Two Dimensional] image generation
- G06T11/20—Drawing from basic elements, e.g. lines or circles
- G06T11/206—Drawing of charts or graphs
-
- G—PHYSICS
- G06—COMPUTING; CALCULATING OR COUNTING
- G06T—IMAGE DATA PROCESSING OR GENERATION, IN GENERAL
- G06T15/00—3D [Three Dimensional] image rendering
- G06T15/08—Volume rendering
-
- G—PHYSICS
- G06—COMPUTING; CALCULATING OR COUNTING
- G06T—IMAGE DATA PROCESSING OR GENERATION, IN GENERAL
- G06T19/00—Manipulating 3D models or images for computer graphics
- G06T19/20—Editing of 3D images, e.g. changing shapes or colours, aligning objects or positioning parts
-
- G—PHYSICS
- G06—COMPUTING; CALCULATING OR COUNTING
- G06T—IMAGE DATA PROCESSING OR GENERATION, IN GENERAL
- G06T2200/00—Indexing scheme for image data processing or generation, in general
- G06T2200/24—Indexing scheme for image data processing or generation, in general involving graphical user interfaces [GUIs]
-
- G—PHYSICS
- G06—COMPUTING; CALCULATING OR COUNTING
- G06T—IMAGE DATA PROCESSING OR GENERATION, IN GENERAL
- G06T2207/00—Indexing scheme for image analysis or image enhancement
- G06T2207/10—Image acquisition modality
- G06T2207/10072—Tomographic images
-
- G—PHYSICS
- G06—COMPUTING; CALCULATING OR COUNTING
- G06T—IMAGE DATA PROCESSING OR GENERATION, IN GENERAL
- G06T2207/00—Indexing scheme for image analysis or image enhancement
- G06T2207/30—Subject of image; Context of image processing
- G06T2207/30004—Biomedical image processing
- G06T2207/30048—Heart; Cardiac
-
- G—PHYSICS
- G06—COMPUTING; CALCULATING OR COUNTING
- G06T—IMAGE DATA PROCESSING OR GENERATION, IN GENERAL
- G06T2207/00—Indexing scheme for image analysis or image enhancement
- G06T2207/30—Subject of image; Context of image processing
- G06T2207/30004—Biomedical image processing
- G06T2207/30101—Blood vessel; Artery; Vein; Vascular
-
- G—PHYSICS
- G06—COMPUTING; CALCULATING OR COUNTING
- G06T—IMAGE DATA PROCESSING OR GENERATION, IN GENERAL
- G06T2207/00—Indexing scheme for image analysis or image enhancement
- G06T2207/30—Subject of image; Context of image processing
- G06T2207/30172—Centreline of tubular or elongated structure
-
- G—PHYSICS
- G06—COMPUTING; CALCULATING OR COUNTING
- G06T—IMAGE DATA PROCESSING OR GENERATION, IN GENERAL
- G06T2215/00—Indexing scheme for image rendering
- G06T2215/06—Curved planar reformation of 3D line structures
-
- G—PHYSICS
- G06—COMPUTING; CALCULATING OR COUNTING
- G06T—IMAGE DATA PROCESSING OR GENERATION, IN GENERAL
- G06T2219/00—Indexing scheme for manipulating 3D models or images for computer graphics
- G06T2219/20—Indexing scheme for editing of 3D models
- G06T2219/2012—Colour editing, changing, or manipulating; Use of colour codes
Definitions
- the present invention relates to a diagnosis support system, a computer program, and a method for supporting blood vessel diagnosis by analyzing and visualizing three-dimensional image data.
- Patent Document 1 discloses a blood vessel stenosis rate analysis system that detects a stenosis site of a blood vessel by analyzing volume data acquired by CT imaging or MRI imaging, and calculates a diameter stenosis rate or an area stenosis rate of the blood vessel. It is shown. This system colors and displays a three-dimensional image of a blood vessel generated by surface rendering or volume rendering based on the calculated stenosis rate (in particular, see paragraphs 0065 to 0072).
- Patent Document 1 it has been considered that it is an important issue in blood vessel analysis to accurately identify a stenosis site and accurately obtain the stenosis rate of the site.
- recent studies have shown that there are dangerous situations even when the stenosis rate is low, as explained below.
- Hard plaques and soft plaques are known as plaques formed on the blood vessel wall.
- Hard plaque is a calcified fat deposited on the vascular intima and is also called a calcified plaque or a stable plaque. Stenosis due to hard plaque progresses on the order of weeks to months.
- Soft plaque on the other hand, is a plaque rich in lipid components and is also called vulnerable plaque or unstable plaque because the film is thin and easily broken. When the soft plaque breaks down, bleeding occurs, and a thrombus is formed in a short time to stop the bleeding. As a result, the rate of stenosis of blood vessels increases at once, and serious diseases such as acute myocardial infarction may occur.
- the present invention proposes a screen layout capable of sufficiently observing the state of the inner wall of the blood vessel over a wide range while considering the stenosis rate and the like as the layout of the diagnostic screen.
- the diagnosis support apparatus of the present invention is an apparatus provided with blood vessel extraction means, CPR image generation means, state estimation means, color determination means, and display control means described below.
- the diagnosis support program stored in the computer-readable storage medium of the present invention includes one or a plurality of computers, blood vessel extraction means, CPR image generation means, state estimation means, color determination means, and color determination means described below. It is a program for functioning as display control means.
- the diagnosis support program is usually composed of a plurality of program modules, and the function of each means is realized by one or a plurality of program modules. These program module groups are recorded on a recording medium such as a CD-ROM or DVD, or recorded in a downloadable state in a storage attached to a server computer or a network storage, and provided to the user.
- the diagnosis support method of the present invention is a method for supporting diagnosis of blood vessels by performing blood vessel extraction processing, CPR image generation processing, state estimation processing, color determination processing, and display control processing described below.
- the blood vessel extraction means extracts a blood vessel region representing a blood vessel from volume data acquired by imaging, and sets a blood vessel core line and a plurality of cross sections perpendicular to the core line.
- Various methods have been proposed for extracting a blood vessel region and setting a core line and a cross section, but any known method may be employed in the present invention.
- the CPR image generation means generates a CPR image representing at least a partial range of the blood vessel based on the blood vessel region, the core line, and information on each cross section.
- the CPR image is preferably a straight CPR (Straightened CPR) image, but may be a stretch CPR (Projected CPR) image or a Project CPR image.
- the CPR image generation means may generate a CPR image for the entire blood vessel regardless of the necessity of display, or may generate a CPR image only for the range designated as the observation range.
- the observation range may be determined automatically or based on a designated input from the user. For example, an image of the entire blood vessel region extracted by the blood vessel extracting means is displayed on the screen as a volume rendering image, and the range of the blood vessel is designated on the image by the user.
- the state estimating means analyzes the information included in the blood vessel region for each cross section, and estimates the stenosis state of the blood vessel in each cross section.
- the stenosis state means any state that leads to stenosis among the vascular states. For example, the presence or absence of stenosis and the stenosis rate may be estimated, as well as the type of plaque that is deposited. Further, a plurality of stenosis states (for example, stenosis rate and plaque) may be estimated.
- the color determination means determines at least one color representing the estimated stenosis state for each cross section.
- the color may be determined for one of them, or the color may be determined for each state.
- the color is determined by converting a value indicating the constriction state into an RGB value indicating the color based on a predetermined conversion table or a conversion formula.
- the color determining means may be a means for obtaining a value indicating a stenosis state (for example, a stenosis rate) by performing a calculation based on a mathematical formula stored in advance, or a conversion table that associates a stenosis state with a color is stored in advance.
- the color may be determined by referring to the conversion table.
- the display control means arranges the CPR image in a predetermined area in the display screen, and further arranges at least one band-like state presentation area outside the predetermined area so as to be parallel to the blood vessel represented by the CPR image, and presents the state presentation.
- the area is displayed in different colors based on the determination by the color determining means. In other words, instead of coloring the blood vessel image itself, another region that is arranged in parallel with the blood vessel image is colored according to the stenosis state, so that the stenosis state in various parts of the blood vessel is not disturbed. Can be grasped intuitively.
- the display control means may arrange a plurality of state presentation areas on the display screen. For example, when there are two states for which color-coded display is desired, two state presentation areas may be arranged so as to sandwich the CPR image. Thereby, even when there are a plurality of states to be grasped, all states can be intuitively grasped by color. Further, if the layout is such that the CPR image is sandwiched between the two state presentation regions, confusion at the time of diagnosis, for example, a situation in which it is not possible to know which region indicates which state can be avoided.
- the state estimation means estimates the stenosis rate and plaque type of the blood vessel as a stenosis state, and the color determination means sets the color and plaque type corresponding to the stenosis rate for each cross section. A corresponding color may be determined, and the display control unit may color-code the first state presentation area based on the stenosis rate and color-code the second state display area based on the type of plaque.
- a doctor can estimate by analyzing the same volume data while observing the inner wall of a blood vessel in a predetermined range by observing a CPR image generated from the volume data.
- the constricted state can be intuitively grasped by color.
- the figure which illustrates the extracted blood vessel region The figure which shows the outline
- the figure which shows the example of calculation of the index value which shows a stenosis state The figure which shows an example of a conversion table A figure showing an example of a diagnosis screen Figure showing another example of the diagnostic screen The figure which shows the other example of a conversion table A figure showing still another example of the diagnosis screen
- FIG. 1 shows a schematic configuration of a diagnosis support apparatus realized by installing a diagnosis support program on a workstation used by a doctor.
- the diagnosis support apparatus 1 includes a processor and a memory (both not shown) as a standard workstation configuration, and further includes a storage 2 such as an HDD (Hard Disk Drive) or an SSD (Solid State Drive). Yes.
- the diagnosis support apparatus 1 is connected to a display 3 and an input device 4 such as a mouse and a keyboard.
- the diagnosis support program and data referred to by the diagnosis support program are stored in the storage 2 at the time of installation and loaded into the memory at the time of activation.
- the diagnosis support program defines blood vessel extraction processing, CPR image generation processing, state estimation processing, color determination processing, and display control processing as processing to be executed by the CPU. Then, when the CPU executes each of the above processes in accordance with the program specifications, the general-purpose workstation can perform blood vessel extraction means 101, CPR image generation means 102, state estimation means 103, color determination means 104, and display control means 105. Function as.
- the storage 2 stores volume data transferred from the inspection department in charge of imaging or volume data acquired by database search.
- the volume data may be volume data directly output from a multi-scan CT apparatus or the like, or volume data generated by reconstructing a two-dimensional slice data group output from a conventional CT apparatus or the like.
- diagnosis support apparatus 1 When the diagnosis support apparatus 1 detects that a predetermined diagnosis support function is selected in the selection menu, the diagnosis support apparatus 1 prompts the user to select or input information necessary for specifying the volume data. When the volume data is specified by the user's operation, the corresponding volume data is loaded from the storage 2 to the memory.
- volume data including heart and coronary artery information is acquired.
- the user selects the coronary artery diagnosis support function and inputs the patient identifier and examination date, the corresponding volume data is loaded into the memory, and the processing described below is executed.
- the blood vessel extraction unit 101 extracts a coronary artery region having an outline of the outer wall of the coronary artery from the volume data. That is, the coronary artery region 5 is composed of a blood vessel wall, plaques deposited inside or on the inner wall surface of the blood vessel, and voxel data representing the lumen of the blood vessel.
- the blood vessel extraction unit 101 sets a coronary artery core line and a plurality of cross sections perpendicular to the core line.
- the blood vessel extraction means 101 extracts a coronary artery region by the method proposed in Japanese Patent Application Nos. 2009-48679 and 2009-69895.
- this method first, the positions and principal axis directions of a plurality of candidate points constituting the core line of the coronary artery are calculated based on the values of the voxel data constituting the volume data.
- the Hessian matrix is calculated for the volume data, and the eigenvalues of the calculated Hessian matrix are analyzed, thereby calculating the positional information and the principal axis direction of a plurality of candidate points constituting the core line of the coronary artery.
- a feature amount representing the coronary artery characteristic is calculated for the voxel data around the candidate point, and it is determined whether or not the voxel data represents the coronary artery region based on the calculated feature amount.
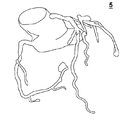
- the discrimination based on the feature amount is performed based on an evaluation function acquired in advance by machine learning. As a result, the coronary artery region 5 illustrated in FIG. 2 is extracted from the volume data.
- the core line of the coronary artery is set in the process of extracting the coronary artery region 5. Further, the position and the principal axis direction are calculated for each of the candidate points constituting the core line. Therefore, at each candidate point, a cross section (orthogonal cross section) perpendicular to the principal axis direction can be set based on the calculated information.
- the setting of the cross section may be performed after extracting the coronary artery region 5 or may be performed immediately after calculating the main axis direction for each cross section.
- a cross section may be set for all candidate points, or a cross section may be set for some sampled candidate points.
- the blood vessel extracting means 101 When the coronary artery region 5 is extracted, the blood vessel extracting means 101 generates a volume rendering image of the coronary artery region 5. Then, a sign indicating the core line set by the above processing is combined with the volume rendering image and output to the display 3. Subsequently, the blood vessel extraction unit 101 receives an operation input for setting an observation range from the input device 4. For example, the user designates one blood vessel branch from a plurality of blood vessel branches constituting the coronary artery on the volume rendering image, and designates the start point and the end point of the observation range on the route of the blood vessel branch. Is performed to set the observation range.
- the blood vessel extraction unit 101 resets the core line and the cross section according to the operation content.
- Information on the coronary artery region, core line, and cross section, and information on the observation range designated by the user are supplied from the blood vessel extraction means 101 to the CPR image generation means 102 and the state estimation means 103.
- a in the figure is a diagram showing an example of a CPR image generated by the CPR image generation means 102.
- B in the figure is a diagram schematically showing a part of the coronary artery region 5 extracted by the blood vessel extracting means 101.
- C in the figure is an example of an orthogonal cross-sectional image of the coronary artery region 5.
- the candidate points and cross sections set by the blood vessel extracting means 101 are distinguished by identification numbers starting from 1, the n th candidate point is represented as N n , and the cross section including the n th candidate point is represented as P n .
- B and C in the figure illustrate the i-th, (i + a) -th, and (i + b) -th candidate points and the cross-section among the set cross-sections (where a ⁇ b).
- the CPR image generation means 102 generates an image illustrated in A of the figure based on the information shown in B of FIG. That is, a straight CPR image is generated by a known procedure using information acquired by the blood vessel extraction means 101 (coronary artery region 5, position and principal axis direction of each candidate point, core path, cross section P position and orientation, etc.) To do.
- the CPR image generation unit 102 selects a blood vessel branch in which the start point and end point of the observation range are set, and generates a straight CPR image representing the entire range of the blood vessel branch.
- the display control means described later can switch the observation range at high speed using the generated CPR image.
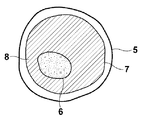
- the state estimation means 103 analyzes the information included in the coronary artery region 5 for each cross section based on the information shown in FIG. 3B, as illustrated in FIG. That is, a group of voxel data constituting individual cross sections is extracted from the volume data, and based on those voxel data values, a coronary artery region 5 (a region having an outer wall of the coronary artery as a contour) and a lumen region 6 (an inner wall of the coronary artery). Is identified as an outline). Further, the average diameter and area of the lumen region 6 are obtained based on the identified region. Alternatively, the minimum diameter may be obtained instead of the average diameter.
- the diameters d1, d2, and d3 of the lumen region 6 are calculated. And let the average value (d1 + d2 + d3) / 3 of the calculated value be an average diameter in the cross section. The area is calculated based on the number of voxel data constituting the lumen region 6.
- the diameters d1, d2, and d3 are calculated by the same procedure as that for determining the average diameter, and the minimum value among the calculated values (d1 in the example in the figure). May be the minimum diameter in the cross section.
- the state estimating means 103 estimates the normal average diameter and area.
- the average diameter and area at normal time are automatically estimated by, for example, regression analysis.
- FIG. 5 is a diagram exemplifying how to obtain a normal average diameter by regression analysis.
- regression analysis is performed by plotting the average diameter calculated in each cross section on a plane with the horizontal axis as the cross section and the vertical axis as the average diameter, a regression line R as shown in the figure is calculated, for example.
- the regression line R also depends on the algorithm of the regression analysis, the regression line R shown in the figure is only an example.
- any known algorithm can be employed.
- a regression curve may be set instead of the regression line.
- the state estimating means 103 may reset the regression line or the like based on the user's operation input after setting the regression line or the like. For example, the plot plane illustrated in FIG. 5 is displayed on the display screen, and an operation input for changing the position and inclination of the straight line R is accepted. Then, the straight line R set by the user's operation is defined as a line indicating the average diameter in the normal state, and subsequent processing is performed. The normal area can also be estimated automatically or semi-automatically by the same processing.
- the state estimation means 103 can also estimate the average diameter and area of normal based on the user's operation input.
- the state estimation unit 103 displays a plot plane as illustrated in FIG. 5 on the display screen, and accepts an operation for designating one or a plurality of ranges in the horizontal axis direction. Or you may receive operation which designates a range on the CPR image which the display control means mentioned later displayed on the screen.
- the state estimation unit 103 sets a straight line (or curve) that connects only plots included in the designated range. Then, the set straight line or the like is defined as a line indicating the average diameter in the normal state, and subsequent processing is performed.
- the normal area can also be estimated by a similar process.
- the state estimation unit 103 performs a predetermined calculation to calculate the stenosis rate of the coronary artery. Is calculated.
- the stenosis rate is defined as the ratio of the average diameter obtained based on the volume data and the average diameter of normal obtained by regression analysis or the like. For example, in the example of FIG.
- the definition of the stenosis rate is not limited to the average diameter ratio, and may be, for example, the minimum diameter ratio or the area ratio.
- the state estimating means 103 performs a process of determining the type of plaque deposited on the inside of the blood vessel wall or on the inner wall surface following the calculation process of the stenosis rate (or in parallel with the calculation process of the stenosis rate). Execute.
- the state estimation means 103 estimates the contour of the lumen region in the normal state for each cross section based on the average diameter in the normal state. For example, in the above example, since the average diameter in the normal state is about 3 mm, the normal lumen region can be assumed to be a cylindrical region having a diameter of about 3 mm. In this case, in the cross section, the normal lumen region is a substantially circular region.
- FIG. 6 shows a coronary artery region 5, a lumen region 6, and a contour 7 of the lumen region in a normal state.
- a region 8 hatchched portion in the figure in which the presence of plaque is suspected in each cross section is specified.
- the state estimation means 103 detects the soft plaque area and the hard plaque area from the area 8 by analyzing the value of the voxel data constituting the area 8.
- the type of plaque can be distinguished by the signal value output by the modality, that is, the value of the voxel data constituting the cross section.
- the output signal value differs by about one digit between soft plaque and hard plaque.
- the signal value output by a 4-row multi-scan CT apparatus is about 40 to 50 HU for soft plaque, but 400 to 1100 HU for hard plaque.
- STIR short TI inversion recovery
- the presence or absence of soft plaque and hard plaque is determined.
- As a code indicating the presence / absence of plaque 10 when only soft plaque is detected, 01 when only hard plaque is detected, 11 when both are detected, and 00 when neither is detected.
- a 2-bit code is output.
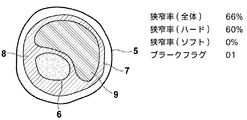
- the state estimation means 103 calculates the ratio of the soft plaque region and the hard plaque region to the area of the normal lumen region. That is, the stenosis rate for each type of plaque is calculated separately from the previously obtained stenosis rate. Thereby, as illustrated in FIG. 7, for each cross section, the overall stenosis rate, the stenosis rate focusing only on hard plaque, the stenosis rate focusing only on soft plaque, the code indicating the presence or absence of each type of plaque, These four index values are obtained.
- FIG. 7 illustrates the case where most of the region 8 is the hard plaque region 9. In the example in the figure, since soft plaque is not detected, the plaque code is 01, and the stenosis rate (60%) focusing only on hard plaque is calculated.
- index values obtained by the state estimating means 103 are supplied to the color determining means 104.
- the process of the color determination unit 104 and the process of the display control unit 105 will be described in association with each other.
- the color determination unit 104 determines a color (RGB value) representing a cross section for each cross section based on the index value supplied from the state estimation unit 103.
- a plurality of types of conversion tables for associating index values and RGB values are stored in advance in the memory, and the color determination unit 104 determines colors by referring to these conversion tables.
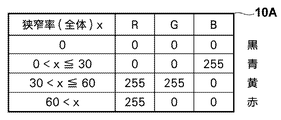
- FIG. 8 shows an example of the conversion table.
- the conversion table 10A shown in the figure is a map in which the overall stenosis rate that does not depend on the type of plaque is associated with the RGB value.
- the stenosis rates are classified into four stages, and RGB values representing “black”, “blue”, “yellow”, and “red” are associated in ascending order of stenosis rate.
- the background color of the display screen is other than black, it is preferable to associate the same color as the background color of the screen instead of “black”.
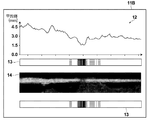
- FIG. 9 shows an example of a display screen output by the display control means 105.
- a straight CPR image 14 On the display screen 11A, a straight CPR image 14, a graph 12 indicating the average diameter of the lumen region 6, and a belt-like state presentation region 13 are arranged.
- the straight CPR image 14 is arranged in such a direction that the core line of the coronary artery extends in the horizontal direction of the screen.
- the graph 12 and the state presentation area 13 are arranged above the CPR image 14.
- the positional relationship between the straight CPR image 14, the graph 12 and the state presentation area 13 is displayed so that the horizontal scale / range of the graph 12 and the state presentation area 13 is the same as the horizontal scale / range of the CPR image. It is controlled by the control means 105. Further, the display control unit 105 controls the display of the straight CPR image 14, the graph 12, and the state presentation area 13 so that only the range designated as the observation range appears on the screen. Moreover, the change of the observation range by scroll operation etc. is received and a screen is updated according to operation.
- the graph 12 is a graph obtained by plotting the index values calculated in each cross section at intervals of 6 pixels.
- the state presentation area 13 an area having a width of 6 pixels is assigned to each cross section, and the RGB value determined by the color determination means 104 is set as the color value of each area.
- the color-coded display of the state presentation area 13 is expressed in shades, and this means red, yellow, and blue in the order of darkness.
- the figure shows that the average diameter is minimum in the graph 12 and the state presentation area 13 is colored red for the portion of the CPR image 14 where the blood vessel image is displayed so darkly.
- the state presentation area 13 is arranged above the CPR image on the display screen 11A, but may be arranged below the CPR image. Further, as in the display screen 11B shown in FIG. 10, the two state presentation areas 13 may be arranged so that the CPR image is sandwiched between the upper side and the lower side of the CPR image 14.
- the stenosis rate of each part of the coronary artery is presented as a color, so that the doctor who makes the diagnosis can intuitively grasp the stenosis part and the degree of stenosis.
- red is dangerous
- yellow is caution
- blue is safe. Therefore, for the state with high risk (stenosis rate) as shown in the conversion table shown in FIG. If a conversion table is defined so that red and yellow can be assigned, even a first-time diagnostic support device can intuitively understand the meaning of display without looking at the manual.
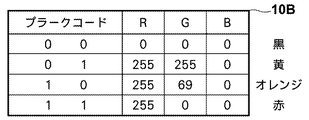
- FIG. 11 shows another example of the conversion table referred to by the color determination unit 104.
- the conversion table 10B shown in the figure is a map in which plaque codes indicating detected plaque types are associated with RGB values.
- code 00 When neither hard plaques nor soft plaques are detected (code 00), “black”, when only hard plaques are detected (code 01), “yellow”, when only soft plaques are detected (code 10) ) Is associated with “orange”, and when both hard plaque and soft plaque are detected (code 11), “red” is associated with each other.
- the display control unit 105 displays the state presentation area 13 in a color-coded manner on the display screen 11A or 11B according to the presence / absence and type of plaque.
- the presence and type of plaque alone cannot accurately diagnose the state of coronary arteries, for example, when a healthy person is included in the subject, such as during regular medical examinations, the presence or absence of plaque by color-coded display Can be determined intuitively, which is useful when it is desired to roughly classify healthy subjects and those who require observation.
- the color determining means 104 can determine the color representing the stenosis rate with reference to the conversion table 10A, and can further determine the color representing the presence and type of plaque with reference to the conversion table 10B. Further, not only two but also three or more conversion tables can be referred to and a plurality of colors can be determined for one cross section.
- the screen output by the display control means 105 is a display screen 11C as illustrated in FIG.
- the state presentation area 13 and the state presentation area 15 are arranged so as to sandwich the CPR image 14 above and below the CPR image 14.
- the state presentation area 13 is an area that is color-coded with colors determined based on the conversion table 10A.
- the state presentation area 15 is an area color-coded with colors determined based on the conversion table 10B.
- the display screen 11C it is possible to intuitively grasp the stenosis rate and the presence / absence and type of plaque by color. Care should be taken for stenosis caused by soft plaque even if the stenosis rate is low.
- the stenosis rate can be confirmed by displaying the state presenting area 13, while the type of plaque can be confirmed by displaying the state presenting area 15, so a dangerous state or a state requiring attention. Can be discovered efficiently.
- the state presentation area 13 and the state presentation area 15 may be arranged adjacent to each other above or below the CPR image. However, as shown in the example of FIG. Confusion is unlikely to occur during diagnosis.
- the memory of the diagnosis support apparatus 1 includes a conversion table that associates the stenosis rate focusing only on soft plaque with RGB values, A conversion table associating RGB with stenosis rate focusing only on hard plaque, a conversion table associating presence / absence of soft plaque with RGB values, and a conversion table associating presence / absence of hard plaque with RGB values are stored.
- the color determination unit 104 performs processing by selectively referring to one or a plurality of conversion tables selected by the user from these conversion tables. Further, the display control unit 105 determines the number of state presentation areas arranged on the screen and the screen layout according to the number of selected conversion tables.
- index values such as the stenosis rate and the type of plaque are presented as colors instead of numerical values. Therefore, the doctor can intuitively grasp the stenosis state estimated by the diagnosis support apparatus. Color coding is performed not by coloring the image for observation but by coloring the state presentation area arranged in the area outside the image for observation. Therefore, the color-coded display does not hinder the image observation. Thus, the doctor can not only refer to the color presented by the diagnosis support apparatus, but also check the image representing the inner wall of the blood vessel with his / her own eye and make a diagnosis carefully.
- a CPR image is displayed as an image for observation, and the color-coded display of the state presentation area is also performed for the same range as the CPR image. Therefore, the stenosis state can be grasped in a short time for a relatively wide range of blood vessels. can do. Further, since the straight CPR image is always a linear image even when the observation range is changed, the screen layout can be a simple layout that allows easy display control.
- the conversion table referred to by the color determination unit can be selected from a plurality of conversion tables, and the number of state presentation areas arranged on the display screen also depends on the number of index values that require an intuitive grasp. Increased or decreased. For this reason, it can respond to various diagnostic purposes.
- Patent Document 1 a method disclosed in Japanese Patent Laid-Open No. 2006-167287 (Patent Document 1) may be employed.
- a blood vessel core line is extracted by a Bessel tracking method, and a cross section perpendicular to the core line is set to extract a blood vessel contour point. Therefore, the core line and the cross section are automatically set during the blood vessel region extraction process.
- any known method can be applied to the extraction of the coronary artery region and the setting of the core line and the cross section.
- the CPR image generation means 102 may display a stretch CPR image or a project CPR image instead of the straight CPR image.
- the coronary artery image meanders, but if the state presentation regions 13 and 15 are belt-like regions that meander like the CPR image, the CPR image and the state presentation region are the same as in the straight CPR image. Can be arranged in parallel.
- the types of plaques are roughly classified into soft plaques and hard plaques.
- the state estimation unit 103 further divides the types of plaques based on the signal values output by the modality. May be separated.
- the color determination unit 104 may determine the color by performing an operation based on a predetermined mathematical expression instead of referring to the conversion table. For example, if the mathematical formula is defined so that the RGB values change in accordance with the stenosis rate, the color of the state presentation area becomes a gradation display.
- the display control unit controls the observation range, but the CPR image generation unit 102 generates a CPR image only for the range based on the observation range information. Also good.
- the state estimation unit 103 may also perform processing for only the range based on the observation range information.
- the display control unit 105 arranges the straight CPR image in such a direction that the blood vessel core line extends in the horizontal direction of the screen, but the straight CPR image is rotated 90 degrees so that the blood vessel core wire is aligned. You may arrange
- diagnosis support apparatus may be configured to share functions as blood vessel extraction means, CPR image generation means, state estimation means, color determination means, and display control means by a plurality of computers.
- a device constituting the system such as an input device and a display, all known devices can be employed.
- a joystick can be used instead of a mouse, or a touch panel can be used instead of a display.
- the present invention is useful not only for coronary arteries but also for diagnosing the stenosis of the carotid artery and other blood vessels.
Abstract
A CPR image (14) showing at least partial region of a blood vessel is generated from volume data obtained by image capturing and is arranged in a predetermined region of a display screen (11C). Outside this region, band-shaped condition presentation regions (13, 15) are arranged so as to be parallel with the blood vessel shown by the CPR image. A narrow ratio and the indication value of, for example, the presence and absence of plaque are calculated by a volume data analysis. The calculated indication value is replaced with a color (RGB value) with reference to a conversion table. The condition presentation regions (13, 15) are color-coded according to the indication value and displayed. This makes it possible to, on a blood vessel diagnosis screen, extensively and sufficiently observe the conditions of a blood vessel inner wall and simultaneously to intuitively understand the narrow ratio and the like in each region of the blood vessel.
Description
本発明は、三次元画像データの解析および可視化により、血管の診断を支援する診断支援システム、コンピュータプログラムおよび方法に関する。
The present invention relates to a diagnosis support system, a computer program, and a method for supporting blood vessel diagnosis by analyzing and visualizing three-dimensional image data.
狭窄症の早期発見は、心筋梗塞、脳梗塞等の虚血性疾患を予防する上で極めて重要である。このため、近年、血管解析機能を備えた診断支援装置や、血管解析ソフトウェアが提供されている。例えば、特許文献1には、CT撮影やMRI撮影により取得されたボリュームデータの解析により、血管の狭窄部位を検出するとともに、血管の径狭窄率や面積狭窄率を算出する血管狭窄率解析システムが示されている。このシステムは、サーフェイスレンダリングまたはボリュームレンダリングにより生成された血管の3次元画像を、算出された狭窄率に基づいて色づけ表示する(特に、第0065~0072段落参照)。
Early detection of stenosis is extremely important in preventing ischemic diseases such as myocardial infarction and cerebral infarction. For this reason, in recent years, a diagnosis support apparatus having a blood vessel analysis function and blood vessel analysis software have been provided. For example, Patent Document 1 discloses a blood vessel stenosis rate analysis system that detects a stenosis site of a blood vessel by analyzing volume data acquired by CT imaging or MRI imaging, and calculates a diameter stenosis rate or an area stenosis rate of the blood vessel. It is shown. This system colors and displays a three-dimensional image of a blood vessel generated by surface rendering or volume rendering based on the calculated stenosis rate (in particular, see paragraphs 0065 to 0072).
一般に、心筋梗塞等の疾患が発生する可能性は、血管の狭窄率が高いほど高くなる。このため、従来は、特許文献1に示されるように、狭窄部位を正確に特定し、その部位の狭窄率を正確に求めることが、血管解析における重要課題と考えられていた。しかし、近年の研究では、以下に説明するように、狭窄率が低くても危険な状態があることが明らかになっている。
Generally, the possibility of occurrence of a disease such as myocardial infarction increases as the stenosis rate of the blood vessel increases. For this reason, conventionally, as shown in Patent Document 1, it has been considered that it is an important issue in blood vessel analysis to accurately identify a stenosis site and accurately obtain the stenosis rate of the site. However, recent studies have shown that there are dangerous situations even when the stenosis rate is low, as explained below.
血管壁に形成される粥種(プラーク)としては、ハードプラークとソフトプラークが知られている。ハードプラークは、血管内膜に沈着した脂肪が石灰化したものであり、石灰化プラーク、安定プラークとも呼ばれる。ハードプラークによる狭窄は、数週間~数か月のオーダーで進行する。一方、ソフトプラークは、脂質成分が豊富なプラークで、被膜が薄く破綻しやすいため、脆弱性プラーク、不安定プラークとも呼ばれる。ソフトプラークが破綻すると出血が起こり、その出血を止めるための血栓が、短時間で形成される。これにより、血管の狭窄率が一挙に高まり、急性心筋梗塞等の重大疾患を引き起こすことがある。
ハ ー ド Hard plaques and soft plaques are known as plaques formed on the blood vessel wall. Hard plaque is a calcified fat deposited on the vascular intima and is also called a calcified plaque or a stable plaque. Stenosis due to hard plaque progresses on the order of weeks to months. Soft plaque, on the other hand, is a plaque rich in lipid components and is also called vulnerable plaque or unstable plaque because the film is thin and easily broken. When the soft plaque breaks down, bleeding occurs, and a thrombus is formed in a short time to stop the bleeding. As a result, the rate of stenosis of blood vessels increases at once, and serious diseases such as acute myocardial infarction may occur.
このため、狭窄症の診断では、狭窄率のみならず、プラークの種別(破綻し易さ)をも考慮して、危険性を判断することが必要とされている。また、狭窄率が高い範囲のみを重点的に観察するのではなく、狭窄率が低い範囲も含め、狭窄が起きている範囲は、すべて慎重に観察する必要がある。
For this reason, in the diagnosis of stenosis, it is necessary to judge the risk in consideration of not only the stenosis rate but also the type of plaque (ease of failure). In addition, it is necessary to carefully observe all the areas where stenosis occurs, including not only the range where the stenosis rate is high but also the range where the stenosis rate is low.
本発明は、上記事情に鑑みて、診断画面のレイアウトとして、狭窄率等を考慮しつつ、血管の内壁の状態を、広範囲にわたり十分に観察することができる画面レイアウトを提案する。
In view of the above circumstances, the present invention proposes a screen layout capable of sufficiently observing the state of the inner wall of the blood vessel over a wide range while considering the stenosis rate and the like as the layout of the diagnostic screen.
本発明の診断支援装置は、以下に説明する血管抽出手段、CPR画像生成手段、状態推定手段、色決定手段および表示制御手段を備えた装置である。また、本発明のコンピュータ読み取り可能な記憶媒体に記憶された診断支援プログラムは、一台または複数台のコンピュータを、以下に説明する血管抽出手段、CPR画像生成手段、状態推定手段、色決定手段および表示制御手段として機能させるためのプログラムである。診断支援プログラムは、通常、複数のプログラムモジュールからなり、上記各手段の機能は、それぞれ、一または複数のプログラムモジュールにより実現される。これらのプログラムモジュール群は、CD-ROM,DVDなどの記録メディアに記録され、またはサーバコンピュータに付属するストレージやネットワークストレージにダウンロード可能な状態で記録されて、ユーザに提供される。また、本発明の診断支援方法は、以下に説明する血管抽出処理、CPR画像生成処理、状態推定処理、色決定処理および表示制御処理を行うことにより、血管の診断を支援する方法である。
The diagnosis support apparatus of the present invention is an apparatus provided with blood vessel extraction means, CPR image generation means, state estimation means, color determination means, and display control means described below. The diagnosis support program stored in the computer-readable storage medium of the present invention includes one or a plurality of computers, blood vessel extraction means, CPR image generation means, state estimation means, color determination means, and color determination means described below. It is a program for functioning as display control means. The diagnosis support program is usually composed of a plurality of program modules, and the function of each means is realized by one or a plurality of program modules. These program module groups are recorded on a recording medium such as a CD-ROM or DVD, or recorded in a downloadable state in a storage attached to a server computer or a network storage, and provided to the user. The diagnosis support method of the present invention is a method for supporting diagnosis of blood vessels by performing blood vessel extraction processing, CPR image generation processing, state estimation processing, color determination processing, and display control processing described below.
血管抽出手段は、撮影により取得されたボリュームデータから、血管を表す血管領域を抽出するとともに、血管の芯線および芯線に垂直な複数の断面を設定する。血管領域の抽出、芯線や断面の設定については、種々の方法が提案されているが、本発明では、公知のいずれの方法を採用してもよい。
The blood vessel extraction means extracts a blood vessel region representing a blood vessel from volume data acquired by imaging, and sets a blood vessel core line and a plurality of cross sections perpendicular to the core line. Various methods have been proposed for extracting a blood vessel region and setting a core line and a cross section, but any known method may be employed in the present invention.
CPR画像生成手段は、血管領域、芯線および各断面の情報に基づいて、血管の少なくとも一部の範囲を表すCPR画像を生成する。CPR画像は、ストレートCPR(Straightened CPR)画像とすることが好ましいが、ストレッチCPR(Stretched CPR)画像や、プロジェクトCPR(Projected CPR)画像でもよい。
The CPR image generation means generates a CPR image representing at least a partial range of the blood vessel based on the blood vessel region, the core line, and information on each cross section. The CPR image is preferably a straight CPR (Straightened CPR) image, but may be a stretch CPR (Projected CPR) image or a Project CPR image.
CPR画像生成手段は、表示の要否に拘わらず血管全体についてCPR画像を生成してもよいし、観察範囲として指定された範囲についてのみCPR画像を生成してもよい。観察範囲は、自動的に決定してもよいし、ユーザからの指定入力に基づいて決定してもよい。例えば、血管抽出手段により抽出された血管領域全体の画像をボリュームレンダリング画像として画面に表示し、その画像上でユーザに血管の範囲を指定させる。
The CPR image generation means may generate a CPR image for the entire blood vessel regardless of the necessity of display, or may generate a CPR image only for the range designated as the observation range. The observation range may be determined automatically or based on a designated input from the user. For example, an image of the entire blood vessel region extracted by the blood vessel extracting means is displayed on the screen as a volume rendering image, and the range of the blood vessel is designated on the image by the user.
状態推定手段は、血管領域に含まれる情報を断面ごとに解析して、各断面における血管の狭窄状態を推定する。ここで、狭窄状態とは、血管の状態のうち狭窄につながるあらゆる状態を意味するものとする。例えば、狭窄の有無や狭窄率の推定はもちろん、沈着しているプラークの種類を推定してもよい。また、複数の狭窄状態を(例えば狭窄率とプラーク)を推定してもよい。
The state estimating means analyzes the information included in the blood vessel region for each cross section, and estimates the stenosis state of the blood vessel in each cross section. Here, the stenosis state means any state that leads to stenosis among the vascular states. For example, the presence or absence of stenosis and the stenosis rate may be estimated, as well as the type of plaque that is deposited. Further, a plurality of stenosis states (for example, stenosis rate and plaque) may be estimated.
色決定手段は、断面ごとに、推定された狭窄状態を表す少なくとも1つの色を決定する。推定された狭窄状態が複数種類あるときには、その中の1つについて色を決定してもよいし、状態ごとにそれぞれ色を決定してもよい。色は、例えば、所定の変換テーブルや変換式に基づいて、狭窄状態を示す値を、色を示すRGB値に変換することにより決定する。
The color determination means determines at least one color representing the estimated stenosis state for each cross section. When there are a plurality of types of estimated stenosis states, the color may be determined for one of them, or the color may be determined for each state. For example, the color is determined by converting a value indicating the constriction state into an RGB value indicating the color based on a predetermined conversion table or a conversion formula.
色決定手段は、狭窄状態(例えば狭窄率)を示す値を、予め記憶されている数式に基づく演算を行って求める手段としてもよいし、狭窄状態と色とを対応づける変換テーブルを予め記憶しておき、その変換テーブルを参照することにより色を決定する手段としてもよい。色分け表示したい状態が複数あるときには、数式や変換テーブルは状態ごとに用意することが好ましいが、複数の状態の組み合わせに対し、1つの色が割り当てられるように、数式や変換テーブルを定義してもよい。
The color determining means may be a means for obtaining a value indicating a stenosis state (for example, a stenosis rate) by performing a calculation based on a mathematical formula stored in advance, or a conversion table that associates a stenosis state with a color is stored in advance. The color may be determined by referring to the conversion table. When there are a plurality of states to be displayed in different colors, it is preferable to prepare a formula and a conversion table for each state. However, even if a formula and a conversion table are defined so that one color is assigned to a combination of a plurality of states. Good.
表示制御手段は、表示画面内の所定領域にCPR画像を配置し、さらに所定領域の外側にCPR画像が表す血管と並行するように帯状の状態提示領域を少なくとも一つ配置して、その状態提示領域を色決定手段の決定に基づいて色分け表示する。すなわち、血管像そのものを色づけするのではなく、血管像と並行して配置される別の領域を狭窄状態に応じて色づけすることで、血管像の観察を妨げることなく、血管の各所における狭窄状態を直感的に把握できるようにする。
The display control means arranges the CPR image in a predetermined area in the display screen, and further arranges at least one band-like state presentation area outside the predetermined area so as to be parallel to the blood vessel represented by the CPR image, and presents the state presentation. The area is displayed in different colors based on the determination by the color determining means. In other words, instead of coloring the blood vessel image itself, another region that is arranged in parallel with the blood vessel image is colored according to the stenosis state, so that the stenosis state in various parts of the blood vessel is not disturbed. Can be grasped intuitively.
状態推定手段が推定する狭窄状態、すなわち色分け表示したい状態が複数あるときには、表示制御手段は、表示画面に、複数の状態提示領域を配置してもよい。例えば、色分け表示したい状態が2つのときには、CPR画像を挟み込むように、2つの状態提示領域を配置するとよい。これにより、把握すべき状態が複数あるときでも、すべての状態を色により直感的に把握することができる。また、2つの状態提示領域の間にCPR画像が挟まれるレイアウトとすれば、診断時の混同、例えばどちらの領域がどちらの状態を示すかがわからなくなるといった事態を避けることができる。
When there are a plurality of stenosis states estimated by the state estimation means, that is, states to be displayed in different colors, the display control means may arrange a plurality of state presentation areas on the display screen. For example, when there are two states for which color-coded display is desired, two state presentation areas may be arranged so as to sandwich the CPR image. Thereby, even when there are a plurality of states to be grasped, all states can be intuitively grasped by color. Further, if the layout is such that the CPR image is sandwiched between the two state presentation regions, confusion at the time of diagnosis, for example, a situation in which it is not possible to know which region indicates which state can be avoided.
具体的な形態としては、例えば、状態推定手段が、狭窄状態として、血管の狭窄率およびプラークの種類を推定し、色決定手段が、各断面について、狭窄率に対応する色とプラークの種類に対応する色を、それぞれ決定し、表示制御手段が、第1の状態提示領域を狭窄率に基づいて色分けし、第2の状態表示領域をプラークの種類に基づいて色分けするといった形態が考えられる。
As a specific form, for example, the state estimation means estimates the stenosis rate and plaque type of the blood vessel as a stenosis state, and the color determination means sets the color and plaque type corresponding to the stenosis rate for each cross section. A corresponding color may be determined, and the display control unit may color-code the first state presentation area based on the stenosis rate and color-code the second state display area based on the type of plaque.
本発明の装置、プログラムおよび方法によれば、医師は、ボリュームデータから生成されたCPR画像を観察することにより所定範囲の血管の内壁を自らの目で確認しながら、同じボリュームデータの解析により推定された狭窄状態を、色により直感的に把握することができる。
According to the apparatus, program, and method of the present invention, a doctor can estimate by analyzing the same volume data while observing the inner wall of a blood vessel in a predetermined range by observing a CPR image generated from the volume data. The constricted state can be intuitively grasped by color.
以下、本発明の診断支援装置、診断支援プログラムおよび診断支援方法の実施形態について、図面を参照しながら詳細に説明する。
Hereinafter, embodiments of a diagnosis support apparatus, a diagnosis support program, and a diagnosis support method of the present invention will be described in detail with reference to the drawings.
図1に、医師が使用するワークステーションに、診断支援プログラムをインストールすることにより実現された診断支援装置の概略構成を示す。診断支援装置1は、標準的なワークステーションの構成として、プロセッサおよびメモリ(いずれも図示せず)を備え、さらに、HDD(Hard Disk Drive)やSSD(Solid State Drive)等のストレージ2を備えている。また、診断支援装置1には、ディスプレイ3と、マウス、キーボード等の入力装置4が接続されている。
FIG. 1 shows a schematic configuration of a diagnosis support apparatus realized by installing a diagnosis support program on a workstation used by a doctor. The diagnosis support apparatus 1 includes a processor and a memory (both not shown) as a standard workstation configuration, and further includes a storage 2 such as an HDD (Hard Disk Drive) or an SSD (Solid State Drive). Yes. The diagnosis support apparatus 1 is connected to a display 3 and an input device 4 such as a mouse and a keyboard.
診断支援プログラムと診断支援プログラムが参照するデータ(後述する変換テーブル等)は、インストール時にストレージ2に記憶され、起動時にメモリにロードされる。診断支援プログラムは、CPUに実行させる処理として、血管抽出処理、CPR画像生成処理、状態推定処理、色決定処理および表示制御処理を規定している。そして、プログラムの規定にしたがって、CPUが上記各処理を実行することにより、汎用のワークステーションは、血管抽出手段101、CPR画像生成手段102、状態推定手段103、色決定手段104および表示制御手段105として機能する。
The diagnosis support program and data referred to by the diagnosis support program (such as a conversion table described later) are stored in the storage 2 at the time of installation and loaded into the memory at the time of activation. The diagnosis support program defines blood vessel extraction processing, CPR image generation processing, state estimation processing, color determination processing, and display control processing as processing to be executed by the CPU. Then, when the CPU executes each of the above processes in accordance with the program specifications, the general-purpose workstation can perform blood vessel extraction means 101, CPR image generation means 102, state estimation means 103, color determination means 104, and display control means 105. Function as.
ストレージ2には、撮影を担当する検査部門から転送されたボリュームデータ、もしくはデータベース検索により取得されたボリュームデータが、記憶される。ボリュームデータは、マルチスキャンCT装置等から直接出力されたボリュームデータでもよいし、従来型のCT装置等から出力された2次元のスライスデータ群を再構成することにより生成されたボリュームデータでもよい。
The storage 2 stores volume data transferred from the inspection department in charge of imaging or volume data acquired by database search. The volume data may be volume data directly output from a multi-scan CT apparatus or the like, or volume data generated by reconstructing a two-dimensional slice data group output from a conventional CT apparatus or the like.
診断支援装置1は、選択メニューにおいて所定の診断支援機能が選択されたことを検出すると、ユーザに、ボリュームデータの特定に必要な情報の選択または入力を促す。そして、ユーザの操作により、ボリュームデータが特定されると、ストレージ2からメモリに、該当するボリュームデータをロードする。
When the diagnosis support apparatus 1 detects that a predetermined diagnosis support function is selected in the selection menu, the diagnosis support apparatus 1 prompts the user to select or input information necessary for specifying the volume data. When the volume data is specified by the user's operation, the corresponding volume data is loaded from the storage 2 to the memory.
ここでは、ある患者の検査において、マルチスキャンCT装置による胸部撮影が行われ、心臓や冠動脈の情報を含むボリュームデータが取得されているものとする。ユーザが冠動脈の診断支援機能を選択し、その患者の識別子や検査日を入力すると、該当するボリュームデータがメモリにロードされ、以下に説明する処理が実行される。
Here, it is assumed that in an examination of a patient, chest imaging is performed by a multi-scan CT apparatus, and volume data including heart and coronary artery information is acquired. When the user selects the coronary artery diagnosis support function and inputs the patient identifier and examination date, the corresponding volume data is loaded into the memory, and the processing described below is executed.
血管抽出手段101は、上記ボリュームデータから、冠動脈の外壁を輪郭とする冠動脈領域を抽出する。すなわち、冠動脈領域5は、血管壁と、血管壁の内部または内壁表面に沈着するプラークと、血管の内腔を表すボクセルデータにより構成される。また、血管抽出手段101は、冠動脈の芯線と、芯線に垂直な複数の断面を設定する。
The blood vessel extraction unit 101 extracts a coronary artery region having an outline of the outer wall of the coronary artery from the volume data. That is, the coronary artery region 5 is composed of a blood vessel wall, plaques deposited inside or on the inner wall surface of the blood vessel, and voxel data representing the lumen of the blood vessel. The blood vessel extraction unit 101 sets a coronary artery core line and a plurality of cross sections perpendicular to the core line.
本実施形態では、血管抽出手段101は、特願2009-48679号および特願2009-69895号において提案される方法により、冠動脈領域を抽出する。この方法では、まず、ボリュームデータを構成するボクセルデータの値に基づいて、冠動脈の芯線を構成する複数の候補点の位置と主軸方向を算出する。もしくは、ボリュームデータについてヘッセ行列を算出し、算出されたヘッセ行列の固有値を解析することにより、冠動脈の芯線を構成する複数の候補点の位置情報と主軸方向を算出する。そして、候補点周辺のボクセルデータについて冠動脈らしさを表す特徴量を算出し、算出された特徴量に基づいてそのボクセルデータが冠動脈領域を表すものであるか否かを判別する。特徴量に基づく判別は、マシンラーニングにより予め取得された評価関数に基づいて行なう。これにより、ボリュームデータから、図2に例示するような冠動脈領域5が抽出される。
In this embodiment, the blood vessel extraction means 101 extracts a coronary artery region by the method proposed in Japanese Patent Application Nos. 2009-48679 and 2009-69895. In this method, first, the positions and principal axis directions of a plurality of candidate points constituting the core line of the coronary artery are calculated based on the values of the voxel data constituting the volume data. Alternatively, the Hessian matrix is calculated for the volume data, and the eigenvalues of the calculated Hessian matrix are analyzed, thereby calculating the positional information and the principal axis direction of a plurality of candidate points constituting the core line of the coronary artery. Then, a feature amount representing the coronary artery characteristic is calculated for the voxel data around the candidate point, and it is determined whether or not the voxel data represents the coronary artery region based on the calculated feature amount. The discrimination based on the feature amount is performed based on an evaluation function acquired in advance by machine learning. As a result, the coronary artery region 5 illustrated in FIG. 2 is extracted from the volume data.
上記方法では、冠動脈領域5を抽出する過程で、冠動脈の芯線が設定される。また、芯線を構成する候補点のそれぞれについて、位置と主軸方向が算出される。よって、各候補点において、算出された情報に基づき、主軸方向と垂直な断面(直交断面)を設定することができる。断面の設定は、冠動脈領域5を抽出し終えた後に行ってもよいし、断面ごとに、主軸方向を算出した直後に行ってもよい。また、すべての候補点において断面を設定してもよいし、サンプリングした一部の候補点に対し断面を設定してもよい。
In the above method, the core line of the coronary artery is set in the process of extracting the coronary artery region 5. Further, the position and the principal axis direction are calculated for each of the candidate points constituting the core line. Therefore, at each candidate point, a cross section (orthogonal cross section) perpendicular to the principal axis direction can be set based on the calculated information. The setting of the cross section may be performed after extracting the coronary artery region 5 or may be performed immediately after calculating the main axis direction for each cross section. Moreover, a cross section may be set for all candidate points, or a cross section may be set for some sampled candidate points.
冠動脈領域5が抽出されると、血管抽出手段101は、冠動脈領域5のボリュームレンダリング画像を生成する。そして、上記処理により設定された芯線を示す標識をボリュームレンダリング画像に合成して、ディスプレイ3に出力する。続いて、血管抽出手段101は、入力装置4から、観察範囲を設定する操作入力を受け付ける。例えば、ユーザが、ボリュームレンダリング画像上で、冠動脈を構成する複数の血管枝の中から一本の血管枝を指定し、その血管枝の経路上で、観察範囲の始点と終点とを指定する操作を行うことで、観察範囲が設定される。
When the coronary artery region 5 is extracted, the blood vessel extracting means 101 generates a volume rendering image of the coronary artery region 5. Then, a sign indicating the core line set by the above processing is combined with the volume rendering image and output to the display 3. Subsequently, the blood vessel extraction unit 101 receives an operation input for setting an observation range from the input device 4. For example, the user designates one blood vessel branch from a plurality of blood vessel branches constituting the coronary artery on the volume rendering image, and designates the start point and the end point of the observation range on the route of the blood vessel branch. Is performed to set the observation range.
なお、ボリュームレンダリング画像を対象とする操作としては、観察範囲の設定のほか、芯線の経路変更、延長等の操作を、受け付けるようにしてもよい。血管抽出手段101は、経路変更等の操作を検出した場合には、操作内容にしたがって芯線や断面を再設定する。
It should be noted that as the operation for the volume rendering image, in addition to setting the observation range, operations such as changing the core path and extending the core line may be accepted. When detecting an operation such as a route change, the blood vessel extraction unit 101 resets the core line and the cross section according to the operation content.
冠動脈領域、芯線および断面の情報と、ユーザが指定した観察範囲の情報は、血管抽出手段101から、CPR画像生成手段102および状態推定手段103へと供給される。
Information on the coronary artery region, core line, and cross section, and information on the observation range designated by the user are supplied from the blood vessel extraction means 101 to the CPR image generation means 102 and the state estimation means 103.
以下、図3を参照しながら、CPR画像生成手段102と状態推定手段103の処理について説明する。図のAは、CPR画像生成手段102により生成されるCPR画像の一例を示す図である。図のBは、血管抽出手段101により抽出された冠動脈領域5の一部分を、模式的に表した図である。図のCは、冠動脈領域5の直交断面像を例示した図である。血管抽出手段101により設定された候補点および断面は、1から始まる識別番号により区別されるものとし、n番目の候補点はNn、n番目の候補点を含む断面はPnと表記する。図のBおよびCは、設定された断面のうち、i番目、(i+a)番目、(i+b)番目の候補点および断面を例示している(但し、a<b)。
Hereinafter, the processes of the CPR image generation unit 102 and the state estimation unit 103 will be described with reference to FIG. A in the figure is a diagram showing an example of a CPR image generated by the CPR image generation means 102. B in the figure is a diagram schematically showing a part of the coronary artery region 5 extracted by the blood vessel extracting means 101. C in the figure is an example of an orthogonal cross-sectional image of the coronary artery region 5. The candidate points and cross sections set by the blood vessel extracting means 101 are distinguished by identification numbers starting from 1, the n th candidate point is represented as N n , and the cross section including the n th candidate point is represented as P n . B and C in the figure illustrate the i-th, (i + a) -th, and (i + b) -th candidate points and the cross-section among the set cross-sections (where a <b).
CPR画像生成手段102は、図3のBに示される情報に基づいて、図のAに例示される画像を生成する。すなわち、血管抽出手段101により取得された情報(冠動脈領域5、各候補点の位置および主軸方向、芯線の経路、断面Pの位置や向き等)を用いて、公知の手順によりストレートCPR画像を生成する。本実施形態では、CPR画像生成手段102は、観察範囲の始点および終点が設定された血管枝を選択し、その血管枝の全範囲を表すストレートCPR画像を生成する。これにより、観察範囲の変更を要求する操作が検出されたときに、後述する表示制御手段が、生成済みのCPR画像を使って観察範囲を高速に切り換えられるようにしている。
The CPR image generation means 102 generates an image illustrated in A of the figure based on the information shown in B of FIG. That is, a straight CPR image is generated by a known procedure using information acquired by the blood vessel extraction means 101 (coronary artery region 5, position and principal axis direction of each candidate point, core path, cross section P position and orientation, etc.) To do. In the present embodiment, the CPR image generation unit 102 selects a blood vessel branch in which the start point and end point of the observation range are set, and generates a straight CPR image representing the entire range of the blood vessel branch. Thus, when an operation requesting the change of the observation range is detected, the display control means described later can switch the observation range at high speed using the generated CPR image.
状態推定手段103は、図3のBに示される情報に基づいて、図のCに例示するように、冠動脈領域5に含まれる情報を、断面ごとに解析する。すなわち、ボリュームデータから個々の断面を構成するボクセルデータ群を抽出し、それらのボクセルデータ値に基づいて、冠動脈領域5(冠動脈の外壁を輪郭とする領域)と、内腔領域6(冠動脈の内壁を輪郭とする領域)を識別する。さらに識別した領域に基づいて、内腔領域6の平均径と面積を求める。あるいは、平均径に代えて、最小径を求めてもよい。
The state estimation means 103 analyzes the information included in the coronary artery region 5 for each cross section based on the information shown in FIG. 3B, as illustrated in FIG. That is, a group of voxel data constituting individual cross sections is extracted from the volume data, and based on those voxel data values, a coronary artery region 5 (a region having an outer wall of the coronary artery as a contour) and a lumen region 6 (an inner wall of the coronary artery). Is identified as an outline). Further, the average diameter and area of the lumen region 6 are obtained based on the identified region. Alternatively, the minimum diameter may be obtained instead of the average diameter.
平均径を求めるときは、各断面に対し、図4に例示するように0度、45度、90度の3つの方向を設定し(4以上の方向を設定してもよい)、方向ごとに内腔領域6の径d1、d2、d3を算出する。そして、算出された値の平均値(d1+d2+d3)/3を、その断面における平均径とする。面積は、内腔領域6を構成するボクセルデータの数に基づいて算出する。なお、平均径に代えて最小径を求めるときは、平均径を求めるときと同様の手順により径d1、d2、d3を算出し、算出された値の中の最小値(図の例ではd1)を、その断面における最小径とすればよい。
When obtaining the average diameter, three directions of 0 degrees, 45 degrees, and 90 degrees are set for each cross section as illustrated in FIG. 4 (more than four directions may be set). The diameters d1, d2, and d3 of the lumen region 6 are calculated. And let the average value (d1 + d2 + d3) / 3 of the calculated value be an average diameter in the cross section. The area is calculated based on the number of voxel data constituting the lumen region 6. When determining the minimum diameter instead of the average diameter, the diameters d1, d2, and d3 are calculated by the same procedure as that for determining the average diameter, and the minimum value among the calculated values (d1 in the example in the figure). May be the minimum diameter in the cross section.
各断面における平均径および面積が求まると、状態推定手段103は、健常時の平均径および面積を推定する。健常時の平均径や面積は、例えば回帰分析により自動的に推定する。図5は、回帰分析による健常時の平均径の求め方を例示した図である。横軸を断面、縦軸を平均径とする平面上に、各断面において算出された平均径をプロットして回帰分析を行った場合、例えば同図に示すような回帰直線Rが算出される。但し、回帰直線Rは、回帰分析のアルゴリズムにも依存するため、同図に示す回帰直線Rは、あくまでも一例に過ぎない。回帰分析のアルゴリズムとしては、公知のあらゆるアルゴリズムを採用することができる。また、回帰直線に代えて、回帰曲線を設定してもよい。
When the average diameter and area in each cross section are obtained, the state estimating means 103 estimates the normal average diameter and area. The average diameter and area at normal time are automatically estimated by, for example, regression analysis. FIG. 5 is a diagram exemplifying how to obtain a normal average diameter by regression analysis. When regression analysis is performed by plotting the average diameter calculated in each cross section on a plane with the horizontal axis as the cross section and the vertical axis as the average diameter, a regression line R as shown in the figure is calculated, for example. However, since the regression line R also depends on the algorithm of the regression analysis, the regression line R shown in the figure is only an example. As a regression analysis algorithm, any known algorithm can be employed. A regression curve may be set instead of the regression line.
なお、状態推定手段103は、回帰直線等を設定した後、ユーザの操作入力に基づいて回帰直線等を再設定してもよい。例えば、図5に例示したプロット平面を表示画面に表示し、直線Rの位置と傾きを変更する操作入力を受け付ける。そして、ユーザの操作により設定された直線Rを、健常時における平均径を示す線と定義して、後続の処理を行う。健常時の面積も、同様の処理により、自動または半自動で推定することができる。
Note that the state estimating means 103 may reset the regression line or the like based on the user's operation input after setting the regression line or the like. For example, the plot plane illustrated in FIG. 5 is displayed on the display screen, and an operation input for changing the position and inclination of the straight line R is accepted. Then, the straight line R set by the user's operation is defined as a line indicating the average diameter in the normal state, and subsequent processing is performed. The normal area can also be estimated automatically or semi-automatically by the same processing.
また、状態推定手段103は、ユーザの操作入力に基づいて、健常時の平均径および面積を推定することもできる。この場合、状態推定手段103は、図5に例示したようなプロット平面を表示画面に表示し、横軸方向に1つまたは複数の範囲を指定する操作を受け付ける。あるいは、後述する表示制御手段が画面に表示したCPR画像上で、範囲を指定する操作を受け付けてもよい。ユーザにより、健常な、すなわち狭窄が無いと思われる範囲が指定されると、状態推定手段103は、指定された範囲に含まれるプロットのみを結ぶ直線(または曲線)を設定する。そして、設定された直線等を、健常時における平均径を示す線と定義して、後続の処理を行う。健常時の面積も、同様の処理により、推定することができる。
Moreover, the state estimation means 103 can also estimate the average diameter and area of normal based on the user's operation input. In this case, the state estimation unit 103 displays a plot plane as illustrated in FIG. 5 on the display screen, and accepts an operation for designating one or a plurality of ranges in the horizontal axis direction. Or you may receive operation which designates a range on the CPR image which the display control means mentioned later displayed on the screen. When the user designates a healthy range, that is, a range that is considered to have no stenosis, the state estimation unit 103 sets a straight line (or curve) that connects only plots included in the designated range. Then, the set straight line or the like is defined as a line indicating the average diameter in the normal state, and subsequent processing is performed. The normal area can also be estimated by a similar process.
ボリュームデータに基づいて内腔領域6の平均径が算出され、さらに、健常時における内腔領域6の平均径が推定されると、状態推定手段103は、所定の演算を行って冠動脈の狭窄率を算出する。ここでは狭窄率を、ボリュームデータに基づいて求められた平均径と、回帰分析等により求められた健常時の平均径の比、と定義する。例えば、図5の例では、健常時の平均径は約3mmで、断面Pi+aにおける平均径は約1.5mm、断面Pi+bにおける平均径は3mm強であるので、断面Pi+aにおける狭窄率は、(3-1.5)/3×100=50%となり、断面Pi+bにおける狭窄率は、(3-3)/3×100=0%となる。なお、狭窄率の定義は平均径の比に限られるものではなく、例えば最小径の比や、面積の比としてもよい。
When the average diameter of the lumen region 6 is calculated based on the volume data, and further, the average diameter of the lumen region 6 in the normal state is estimated, the state estimation unit 103 performs a predetermined calculation to calculate the stenosis rate of the coronary artery. Is calculated. Here, the stenosis rate is defined as the ratio of the average diameter obtained based on the volume data and the average diameter of normal obtained by regression analysis or the like. For example, in the example of FIG. 5, with an average diameter of about 3mm at healthy, average diameter of about 1.5mm in the cross section P i + a, since the average diameter of the cross section P i + b is 3mm little, stenosis ratio in the cross section P i + a is (3-1.5) / 3 × 100 = 50%, and the stenosis ratio in the cross section P i + b is (3-3) / 3 × 100 = 0%. The definition of the stenosis rate is not limited to the average diameter ratio, and may be, for example, the minimum diameter ratio or the area ratio.
また、状態推定手段103は、狭窄率の算出処理に続いて(あるいは、狭窄率の算出処理と並行して)、血管壁の内部または内壁表面に沈着しているプラークの種類を判別する処理を実行する。状態推定手段103は、健常時における平均径に基づいて、断面ごとに、健常時における内腔領域の輪郭を推定する。例えば、上記例では、健常時の平均径は約3mmであるので、健常時の内腔領域は、直径約3mmの筒状領域と仮定することができる。この場合、断面では、健常時の内腔領域は、略円状の領域となる。図6に、冠動脈領域5と、内腔領域6と、健常時における内腔領域の輪郭7を示す。断面ごとに輪郭7を推定することで、各断面においてプラークの存在が疑われる領域8(図の斜線部)が特定される。
Further, the state estimating means 103 performs a process of determining the type of plaque deposited on the inside of the blood vessel wall or on the inner wall surface following the calculation process of the stenosis rate (or in parallel with the calculation process of the stenosis rate). Execute. The state estimation means 103 estimates the contour of the lumen region in the normal state for each cross section based on the average diameter in the normal state. For example, in the above example, since the average diameter in the normal state is about 3 mm, the normal lumen region can be assumed to be a cylindrical region having a diameter of about 3 mm. In this case, in the cross section, the normal lumen region is a substantially circular region. FIG. 6 shows a coronary artery region 5, a lumen region 6, and a contour 7 of the lumen region in a normal state. By estimating the contour 7 for each cross section, a region 8 (hatched portion in the figure) in which the presence of plaque is suspected in each cross section is specified.
状態推定手段103は、領域8を構成するボクセルデータの値を解析することにより、領域8から、ソフトプラーク領域と、ハードプラーク領域を検出する。プラークの種類は、モダリティが出力する信号値、すなわち断面を構成するボクセルデータの値により区別することができる。
The state estimation means 103 detects the soft plaque area and the hard plaque area from the area 8 by analyzing the value of the voxel data constituting the area 8. The type of plaque can be distinguished by the signal value output by the modality, that is, the value of the voxel data constituting the cross section.
例えば、CTでは、ソフトプラークとハードプラークで、出力される信号値が1桁程度異なることが知られている。例えば、4列マルチスキャンCT装置が出力する信号値は、ソフトプラークで40~50HU程度であるのに対し、ハードプラークでは400~1100HUになるとの報告がある。また、MRIでは、STIR(short TI inversion recovery)法による撮影を行うことで、脂肪の信号を選択的に低下させることができる。よって、STIR法による撮影を行えば、脂肪成分が多いソフトプラークを、画像上でハードプラークと区別可能な状態とすることができる。
For example, in CT, it is known that the output signal value differs by about one digit between soft plaque and hard plaque. For example, it has been reported that the signal value output by a 4-row multi-scan CT apparatus is about 40 to 50 HU for soft plaque, but 400 to 1100 HU for hard plaque. Further, in MRI, fat signals can be selectively reduced by performing imaging by STIR (short TI inversion recovery) method. Therefore, if imaging by the STIR method is performed, a soft plaque having a large amount of fat components can be distinguished from a hard plaque on the image.
状態推定手段103は、各断面において、ソフトプラーク領域の面積(=ソフトプラークの値を持つボクセルデータの数)、ハードプラーク領域の面積(=ハードプラークの値を持つボクセルデータの数)を算出することにより、ソフトプラークおよびハードプラークの有無を判定する。そして、プラークの有無を示すコードとして、ソフトプラークのみが検出されたときは10、ハードプラークのみが検出されたときは01、両方が検出されたときは11、いずれも検出されなかったときは00となる2ビットのコードを出力する。
The state estimation means 103 calculates the area of the soft plaque region (= the number of voxel data having a soft plaque value) and the area of the hard plaque region (= the number of voxel data having a hard plaque value) in each cross section. Thus, the presence or absence of soft plaque and hard plaque is determined. As a code indicating the presence / absence of plaque, 10 when only soft plaque is detected, 01 when only hard plaque is detected, 11 when both are detected, and 00 when neither is detected. A 2-bit code is output.
また、状態推定手段103は、ソフトプラーク領域、ハードプラーク領域のそれぞれについて、健常時の内腔領域の面積との比を算出する。すなわち、先に求めた狭窄率とは別に、プラークの種類ごとの狭窄率を算出する。これにより、図7に例示するように、個々の断面について、全体的な狭窄率、ハードプラークのみに着目した狭窄率、ソフトプラークのみに着目した狭窄率、各種類のプラークの有無を示すコード、の4つの指標値が求められる。なお、図7は、領域8の大部分がハードプラーク領域9である場合を例示している。同図の例では、ソフトプラークは検出されないため、プラークコードは01となり、ハードプラークのみに着目した狭窄率(60%)が算出される。
Moreover, the state estimation means 103 calculates the ratio of the soft plaque region and the hard plaque region to the area of the normal lumen region. That is, the stenosis rate for each type of plaque is calculated separately from the previously obtained stenosis rate. Thereby, as illustrated in FIG. 7, for each cross section, the overall stenosis rate, the stenosis rate focusing only on hard plaque, the stenosis rate focusing only on soft plaque, the code indicating the presence or absence of each type of plaque, These four index values are obtained. FIG. 7 illustrates the case where most of the region 8 is the hard plaque region 9. In the example in the figure, since soft plaque is not detected, the plaque code is 01, and the stenosis rate (60%) focusing only on hard plaque is calculated.
状態推定手段103により求められたこれらの指標値は、色決定手段104に供給される。以下、色決定手段104の処理と表示制御手段105の処理とを関連づけながら説明する。
These index values obtained by the state estimating means 103 are supplied to the color determining means 104. Hereinafter, the process of the color determination unit 104 and the process of the display control unit 105 will be described in association with each other.
色決定手段104は、状態推定手段103から供給された指標値に基づいて、断面ごとに、その断面を表す色(RGB値)を決定する。本実施形態では、指標値とRGB値とを対応づける複数種類の変換テーブルが予めメモリに記憶されており、色決定手段104は、それらの変換テーブルを参照することにより、色を決定する。
The color determination unit 104 determines a color (RGB value) representing a cross section for each cross section based on the index value supplied from the state estimation unit 103. In this embodiment, a plurality of types of conversion tables for associating index values and RGB values are stored in advance in the memory, and the color determination unit 104 determines colors by referring to these conversion tables.
図8に、変換テーブルの一例を示す。同図に示す変換テーブル10Aは、プラークの種類に依らない全体的な狭窄率を、RGB値と対応づけたマップである。狭窄率は4段階に分類され、狭窄率が低い順に「黒」、「青」、「黄」、「赤」を表すRGB値が対応づけられている。但し、表示画面の背景色が黒以外であるときは、「黒」の代わりに画面の背景色と同じ色を対応づけることが好ましい。
FIG. 8 shows an example of the conversion table. The conversion table 10A shown in the figure is a map in which the overall stenosis rate that does not depend on the type of plaque is associated with the RGB value. The stenosis rates are classified into four stages, and RGB values representing “black”, “blue”, “yellow”, and “red” are associated in ascending order of stenosis rate. However, when the background color of the display screen is other than black, it is preferable to associate the same color as the background color of the screen instead of “black”.
図9に、表示制御手段105が出力する表示画面の一例を示す。表示画面11Aには、ストレートCPR画像14と、内腔領域6の平均径を示すグラフ12と、帯状の状態提示領域13とが配置される。ストレートCPR画像14は、冠動脈の芯線が画面の水平方向に延びるような向きで配置される。グラフ12と状態提示領域13は、CPR画像14の上方に配置される。
FIG. 9 shows an example of a display screen output by the display control means 105. On the display screen 11A, a straight CPR image 14, a graph 12 indicating the average diameter of the lumen region 6, and a belt-like state presentation region 13 are arranged. The straight CPR image 14 is arranged in such a direction that the core line of the coronary artery extends in the horizontal direction of the screen. The graph 12 and the state presentation area 13 are arranged above the CPR image 14.
ストレートCPR画像14、グラフ12および状態提示領域13の位置関係は、グラフ12および状態提示領域13の水平方向のスケール/範囲が、CPR画像の水平方向のスケール/範囲と同じになるように、表示制御手段105により制御される。また、表示制御手段105は、観察範囲として指定された範囲のみが画面に現れるように、ストレートCPR画像14、グラフ12および状態提示領域13の表示を制御する。また、スクロール操作などによる、観察範囲の変更を受け付け、操作に応じて画面を更新する。
The positional relationship between the straight CPR image 14, the graph 12 and the state presentation area 13 is displayed so that the horizontal scale / range of the graph 12 and the state presentation area 13 is the same as the horizontal scale / range of the CPR image. It is controlled by the control means 105. Further, the display control unit 105 controls the display of the straight CPR image 14, the graph 12, and the state presentation area 13 so that only the range designated as the observation range appears on the screen. Moreover, the change of the observation range by scroll operation etc. is received and a screen is updated according to operation.
例えば、CPR画像上での断面の間隔が6ピクセルであったとすると、グラフ12は、各断面において算出された指標値を6ピクセル間隔でプロットしたグラフとなる。また状態提示領域13では、断面ごとに幅6ピクセルの領域が割り当てられ、各領域の色値として色決定手段104が決定したRGB値が設定される。
For example, if the interval between the cross sections on the CPR image is 6 pixels, the graph 12 is a graph obtained by plotting the index values calculated in each cross section at intervals of 6 pixels. In the state presentation area 13, an area having a width of 6 pixels is assigned to each cross section, and the RGB value determined by the color determination means 104 is set as the color value of each area.
なお、図9では状態提示領域13の色分け表示を濃淡で表現しているが、これは濃い順に赤、黄、青を意味するものとする。同図は、グラフ12において平均径が最小となっており、CPR画像14において血管像がそこだけ暗く表示されている部分に対し、状態提示領域13が赤く色づけされることを示している。
In FIG. 9, the color-coded display of the state presentation area 13 is expressed in shades, and this means red, yellow, and blue in the order of darkness. The figure shows that the average diameter is minimum in the graph 12 and the state presentation area 13 is colored red for the portion of the CPR image 14 where the blood vessel image is displayed so darkly.
なお、状態提示領域13は、表示画面11AではCPR画像の上方に配置されているが、CPR画像の下方に配置してもよい。また、図10に示す表示画面11Bのように、CPR画像14の上方と下方とに、CPR画像を挟み込むように、2つの状態提示領域13を配置してもよい。
The state presentation area 13 is arranged above the CPR image on the display screen 11A, but may be arranged below the CPR image. Further, as in the display screen 11B shown in FIG. 10, the two state presentation areas 13 may be arranged so that the CPR image is sandwiched between the upper side and the lower side of the CPR image 14.
表示画面11Aおよび11Bでは、冠動脈の各部位の狭窄率が色として提示されるので、診断を行う医師は、狭窄部位や狭窄の度合を直感的に把握することができる。特に、色に対する認識としては、赤は危険、黄色は注意、青は安全という認識が広く浸透しているので、図8に示した変換テーブルのように危険度(狭窄率)が高い状態に対し赤や黄色が割り当てられるように変換テーブルを定義しておけば、初めて診断支援装置を使用する者でも、マニュアルを見ることなく直感的に表示の意味するところを理解することができる。
In the display screens 11A and 11B, the stenosis rate of each part of the coronary artery is presented as a color, so that the doctor who makes the diagnosis can intuitively grasp the stenosis part and the degree of stenosis. In particular, as recognition for color, red is dangerous, yellow is caution, and blue is safe. Therefore, for the state with high risk (stenosis rate) as shown in the conversion table shown in FIG. If a conversion table is defined so that red and yellow can be assigned, even a first-time diagnostic support device can intuitively understand the meaning of display without looking at the manual.
続いて、図11に、色決定手段104が参照する変換テーブルの他の例を示す。同図に示す変換テーブル10Bは、検出されたプラークの種類を示すプラークコードを、RGB値と対応づけたマップである。ハードプラーク、ソフトプラークのいずれも検出されなかったとき(コード00)は「黒」、ハードプラークのみが検出されたとき(コード01)は「黄」、ソフトプラークのみが検出されたとき(コード10)は「オレンジ」、ハードプラークとソフトプラークの両方が検出されたとき(コード11)は「赤」が、それぞれ対応づけられている。
Subsequently, FIG. 11 shows another example of the conversion table referred to by the color determination unit 104. The conversion table 10B shown in the figure is a map in which plaque codes indicating detected plaque types are associated with RGB values. When neither hard plaques nor soft plaques are detected (code 00), “black”, when only hard plaques are detected (code 01), “yellow”, when only soft plaques are detected (code 10) ) Is associated with “orange”, and when both hard plaque and soft plaque are detected (code 11), “red” is associated with each other.
色決定手段104が、変換テーブル10Bを参照して色を決定した場合には、表示制御手段105は、表示画面11Aまたは11Bにおいて、状態提示領域13をプラークの有無および種類によって色分け表示する。プラークの有無と種類だけでは冠動脈の状態を正確に診断することはできないが、例えば定期健診等、対象者の中に健常者が含まれているような場合には、色分け表示によりプラークの有無を直感的に判断することができるので、健常者と要観察者とを大まかに分別したいときに有用である。
When the color determination unit 104 determines a color with reference to the conversion table 10B, the display control unit 105 displays the state presentation area 13 in a color-coded manner on the display screen 11A or 11B according to the presence / absence and type of plaque. Although the presence and type of plaque alone cannot accurately diagnose the state of coronary arteries, for example, when a healthy person is included in the subject, such as during regular medical examinations, the presence or absence of plaque by color-coded display Can be determined intuitively, which is useful when it is desired to roughly classify healthy subjects and those who require observation.
また、色決定手段104は、変換テーブル10Aを参照して狭窄率を表す色を決定し、さらに、変換テーブル10Bを参照してプラークの有無および種類を表す色を決定することもできる。また、2つに限らず3以上の変換テーブルを参照し、1つの断面に対し複数の色を決定することもできる。
Further, the color determining means 104 can determine the color representing the stenosis rate with reference to the conversion table 10A, and can further determine the color representing the presence and type of plaque with reference to the conversion table 10B. Further, not only two but also three or more conversion tables can be referred to and a plurality of colors can be determined for one cross section.
変換テーブルを2つ参照する場合、表示制御手段105が出力する画面は、図12に例示するような表示画面11Cとなる。表示画面11Cでは、CPR画像14の上方と下方とに、CPR画像14を挟み込むように状態提示領域13および状態提示領域15が配置される。状態提示領域13は、変換テーブル10Aに基づいて決定された色で色分けされた領域である。また、状態提示領域15は、変換テーブル10Bに基づいて決定された色で色分けされた領域である。
When two conversion tables are referred to, the screen output by the display control means 105 is a display screen 11C as illustrated in FIG. On the display screen 11 </ b> C, the state presentation area 13 and the state presentation area 15 are arranged so as to sandwich the CPR image 14 above and below the CPR image 14. The state presentation area 13 is an area that is color-coded with colors determined based on the conversion table 10A. In addition, the state presentation area 15 is an area color-coded with colors determined based on the conversion table 10B.
表示画面11Cでは、狭窄率とプラークの有無および種類を、いずれも色により直感的に把握することができる。ソフトプラークに起因する狭窄は、狭窄率が低めであっても注意が必要である。これに対し、表示画面11Cでは、状態提示領域13の表示により狭窄率を確認する一方で、状態提示領域15の表示によりプラークの種類を確認することができるので、危険な状態や注意を要する状態を、効率よく発見することができる。
On the display screen 11C, it is possible to intuitively grasp the stenosis rate and the presence / absence and type of plaque by color. Care should be taken for stenosis caused by soft plaque even if the stenosis rate is low. On the other hand, on the display screen 11C, the stenosis rate can be confirmed by displaying the state presenting area 13, while the type of plaque can be confirmed by displaying the state presenting area 15, so a dangerous state or a state requiring attention. Can be discovered efficiently.
状態提示領域13と状態提示領域15は、CPR画像の上方または下方に、2つ隣接させて配置してもよいが、図12の例のように上方と下方とに分散して配置するほうが、診断の際、混乱が生じにくい。
The state presentation area 13 and the state presentation area 15 may be arranged adjacent to each other above or below the CPR image. However, as shown in the example of FIG. Confusion is unlikely to occur during diagnosis.
以上、変換テーブル10A、10Bと表示画面11A、11Bおよび11Cについて説明したが、診断支援装置1のメモリには、このほか、ソフトプラークのみに着目した狭窄率とRGB値を対応づけた変換テーブル、ハードプラークのみに着目した狭窄率とRGBを対応づけた変換テーブル、ソフトプラークの有無とRGB値を対応づけた変換テーブル、ハードプラークの有無とRGB値を対応づけた変換テーブルが記憶されている。色決定手段104は、これらの変換テーブルの中から、ユーザが選択した1つまたは複数の変換テーブルを選択的に参照して処理を行う。また、表示制御手段105は、選択された変換テーブルの数に応じて、画面に配置する状態提示領域の数と、画面レイアウトを決定する。
The conversion tables 10A and 10B and the display screens 11A, 11B, and 11C have been described above. In addition to the above, the memory of the diagnosis support apparatus 1 includes a conversion table that associates the stenosis rate focusing only on soft plaque with RGB values, A conversion table associating RGB with stenosis rate focusing only on hard plaque, a conversion table associating presence / absence of soft plaque with RGB values, and a conversion table associating presence / absence of hard plaque with RGB values are stored. The color determination unit 104 performs processing by selectively referring to one or a plurality of conversion tables selected by the user from these conversion tables. Further, the display control unit 105 determines the number of state presentation areas arranged on the screen and the screen layout according to the number of selected conversion tables.
本実施形態の診断支援装置、プログラムおよび方法によれば、狭窄率、プラークの種類等の指標値は、数値ではなく色として提示される。よって、医師は、診断支援装置が推定した狭窄状態を、直感的に把握することができる。色分けは、観察用の画像を色づけするのではなく、観察用の画像の外側の領域に配置された状態提示領域を色づけすることにより為される。よって、色分け表示により画像の観察が妨げられることはない。これにより、医師は、診断支援装置が提示する色を参照するだけでなく、自らの目で血管の内壁を表す画像を確認し、慎重に診断を下すことができる。
According to the diagnosis support apparatus, program, and method of the present embodiment, index values such as the stenosis rate and the type of plaque are presented as colors instead of numerical values. Therefore, the doctor can intuitively grasp the stenosis state estimated by the diagnosis support apparatus. Color coding is performed not by coloring the image for observation but by coloring the state presentation area arranged in the area outside the image for observation. Therefore, the color-coded display does not hinder the image observation. Thus, the doctor can not only refer to the color presented by the diagnosis support apparatus, but also check the image representing the inner wall of the blood vessel with his / her own eye and make a diagnosis carefully.
また、本実施形態では、観察用の画像としてCPR画像が表示され、状態提示領域の色分け表示もCPR画像と同じ範囲について行われるため、血管の比較的広い範囲について、短時間で狭窄状態を把握することができる。さらに、ストレートCPR画像は観察範囲が変更されても常に直線状の画像になるため、画面レイアウトを、表示制御が容易なシンプルなレイアウトとすることができる。
In this embodiment, a CPR image is displayed as an image for observation, and the color-coded display of the state presentation area is also performed for the same range as the CPR image. Therefore, the stenosis state can be grasped in a short time for a relatively wide range of blood vessels. can do. Further, since the straight CPR image is always a linear image even when the observation range is changed, the screen layout can be a simple layout that allows easy display control.
また、前述のように、狭窄の要因がソフトプラークであるときは、狭窄率がそれほど高くなくても、注意が必要である。これに対し、本実施形態では、狭窄率のみならずプラークの種類に基づく色分け表示も行っているので、ソフトプラークの早期発見、早期治療に寄与することができる。
Also, as described above, when the cause of stenosis is soft plaque, caution is required even if the stenosis rate is not so high. On the other hand, in this embodiment, since color-coded display based on not only the stenosis rate but also the type of plaque is performed, it is possible to contribute to early detection and early treatment of soft plaque.
また、本実施形態では、色決定手段が参照する変換テーブルは、複数の変換テーブルの中から選択でき、表示画面に配置する状態提示領域の数も直感的把握を要する指標値の数に応じて増減される。このため、様々な診断目的に対応することができる。
In the present embodiment, the conversion table referred to by the color determination unit can be selected from a plurality of conversion tables, and the number of state presentation areas arranged on the display screen also depends on the number of index values that require an intuitive grasp. Increased or decreased. For this reason, it can respond to various diagnostic purposes.
なお、本発明は上記実施形態に限られるものではなく、本発明の趣旨を逸脱しない範囲で、種々の変更を加えることができる。
Note that the present invention is not limited to the above embodiment, and various modifications can be made without departing from the spirit of the present invention.
例えば、血管抽出手段101が行う冠動脈領域の抽出処理では、特開2006-167287号公報(特許文献1)が示す方法を採用してもよい。同文献が開示する方法では、血管領域を抽出する過程で、ベッセルトラッキング法により血管の芯線を抽出し、芯線に直行する断面を設定して血管の輪郭点を抽出する処理を行っている。よって、芯線および断面は、血管領域抽出処理の過程で自動的に設定される。このほか、冠動脈領域の抽出および芯線と断面の設定には、公知のあらゆる方法を適用することができる。
For example, in the coronary artery region extraction processing performed by the blood vessel extraction means 101, a method disclosed in Japanese Patent Laid-Open No. 2006-167287 (Patent Document 1) may be employed. In the method disclosed in this document, in the process of extracting a blood vessel region, a blood vessel core line is extracted by a Bessel tracking method, and a cross section perpendicular to the core line is set to extract a blood vessel contour point. Therefore, the core line and the cross section are automatically set during the blood vessel region extraction process. In addition, any known method can be applied to the extraction of the coronary artery region and the setting of the core line and the cross section.
また、CPR画像生成手段102は、ストレートCPR画像に代えて、ストレッチCPR画像やプロジェクトCPR画像を表示してもよい。ストレッチCPR画像やプロジェクトCPR画像では、冠動脈像は蛇行するが、状態提示領域13、15をCPR画像と同様に蛇行する帯状領域とすれば、ストレートCPR画像の場合と同様、CPR画像と状態提示領域とを並列に配置することができる。
Further, the CPR image generation means 102 may display a stretch CPR image or a project CPR image instead of the straight CPR image. In the stretch CPR image and the project CPR image, the coronary artery image meanders, but if the state presentation regions 13 and 15 are belt-like regions that meander like the CPR image, the CPR image and the state presentation region are the same as in the straight CPR image. Can be arranged in parallel.
また、上記実施形態では、説明の便宜上、プラークの種類をソフトプラークとハードプラークに大別したが、状態推定手段103は、モダリティが出力する信号値に基づいて、プラークの種類を、さらに細かく分別してもよい。
In the above embodiment, for convenience of explanation, the types of plaques are roughly classified into soft plaques and hard plaques. However, the state estimation unit 103 further divides the types of plaques based on the signal values output by the modality. May be separated.
また、色決定手段104は、変換テーブルの参照ではなく、所定の数式に基づく演算を行うことにより色を決定してもよい。例えば、狭窄率に応じてRGB値がそれぞれ変化するように数式を定義しておけば、状態提示領域の色はグラデーション表示となる。
Further, the color determination unit 104 may determine the color by performing an operation based on a predetermined mathematical expression instead of referring to the conversion table. For example, if the mathematical formula is defined so that the RGB values change in accordance with the stenosis rate, the color of the state presentation area becomes a gradation display.
また、上記実施形態では、表示制御手段が観察範囲を制御しているが、CPR画像生成手段102が、観察範囲の情報に基づいて、その範囲のみを対象とするCPR画像を生成するようにしてもよい。状態推定手段103もまた、観察範囲の情報に基づいて、その範囲のみを対象として、処理を行ってもよい。
In the above embodiment, the display control unit controls the observation range, but the CPR image generation unit 102 generates a CPR image only for the range based on the observation range information. Also good. The state estimation unit 103 may also perform processing for only the range based on the observation range information.
また、上記実施形態では、表示制御手段105は、血管の芯線が画面の水平方向に延びるような向きでストレートCPR画像を配置しているが、ストレートCPR画像を90度回転し、血管の芯線が画面の垂直方向に延びるように配置してもよい。この場合には、グラフ12や状態提示領域13,15も、90度回転して表示する。
In the above-described embodiment, the display control unit 105 arranges the straight CPR image in such a direction that the blood vessel core line extends in the horizontal direction of the screen, but the straight CPR image is rotated 90 degrees so that the blood vessel core wire is aligned. You may arrange | position so that it may extend in the perpendicular direction of a screen. In this case, the graph 12 and the state presentation areas 13 and 15 are also rotated 90 degrees and displayed.
また、診断支援装置は、複数台のコンピュータにより、血管抽出手段、CPR画像生成手段、状態推定手段、色決定手段および表示制御手段としての機能を分担する構成としてもよい。また、入力装置、ディスプレイ等、システムを構成する装置としては、公知のあらゆる装置を採用することができる。例えば、マウスに代えてジョイスティックを採用したり、ディスプレイに代えてタッチパネルを採用したりすることができる。
Also, the diagnosis support apparatus may be configured to share functions as blood vessel extraction means, CPR image generation means, state estimation means, color determination means, and display control means by a plurality of computers. Moreover, as a device constituting the system, such as an input device and a display, all known devices can be employed. For example, a joystick can be used instead of a mouse, or a touch panel can be used instead of a display.
なお、本発明が、冠動脈に限らず、頚動脈その他あらゆる血管の狭窄状態の診断に役立つことは言うまでもない。
Needless to say, the present invention is useful not only for coronary arteries but also for diagnosing the stenosis of the carotid artery and other blood vessels.
Claims (9)
- 撮影により取得されたボリュームデータから、血管を表す血管領域を抽出するとともに、該血管の芯線および該芯線に垂直な複数の断面を設定する血管抽出手段(101)と、
前記血管領域、前記芯線および前記各断面の情報に基づいて、前記血管の少なくとも一部の範囲を表すCPR画像を生成するCPR画像生成手段(102)と、
前記血管領域に含まれる情報を前記断面ごとに解析して、各断面における前記血管の狭窄状態を推定する状態推定手段(103)と、
前記断面ごとに、推定された狭窄状態を表す少なくとも1つの色を決定する色決定手段(104)と、
表示画面内の所定領域に前記CPR画像を配置し、さらに前記所定領域の外側に前記CPR画像が表す血管と並行するように帯状の状態提示領域を少なくとも一つ配置して、該状態提示領域を前記色決定手段の決定に基づいて色分け表示する表示制御手段(105)と、
を備えたことを特徴とする診断支援装置。 Blood vessel extraction means (101) for extracting a blood vessel region representing a blood vessel from volume data acquired by imaging, and setting a core line of the blood vessel and a plurality of cross sections perpendicular to the core line;
CPR image generation means (102) for generating a CPR image representing a range of at least a part of the blood vessel based on the information on the blood vessel region, the core line, and each cross section;
Analyzing the information contained in the blood vessel region for each cross section, and estimating the blood vessel stenosis in each cross section (103),
Color determining means (104) for determining at least one color representing an estimated stenosis state for each cross section;
The CPR image is arranged in a predetermined area in the display screen, and at least one belt-like state presentation area is arranged outside the predetermined area so as to be parallel to the blood vessel represented by the CPR image, and the state presentation area is Display control means (105) for performing color-coded display based on the determination of the color determination means;
A diagnostic support apparatus comprising: - 前記状態推定手段(103)が、前記狭窄状態として、前記血管の狭窄率および/またはプラークの種類を推定することを特徴とする請求項1記載の診断支援装置。 The diagnosis support apparatus according to claim 1, wherein the state estimation means (103) estimates the stenosis rate of the blood vessel and / or the type of plaque as the stenosis state.
- 前記表示制御手段(105)が、前記表示画面に、複数の状態提示領域を配置することを特徴とする請求項1記載の診断支援装置。 The diagnosis support apparatus according to claim 1, wherein the display control means (105) arranges a plurality of state presentation areas on the display screen.
- 前記表示制御手段(105)が、前記CPR画像を挟み込むように、2つの状態提示領域を配置することを特徴とする請求項3記載の診断支援装置。 The diagnosis support apparatus according to claim 3, wherein the display control means (105) arranges two state presentation areas so as to sandwich the CPR image.
- 前記状態推定手段(103)が、前記狭窄状態として、前記血管の狭窄率およびプラークの種類を推定し、
前記色決定手段(104)が、前記断面ごとに、狭窄率に対応する色およびプラークの種類に対応する色を決定し、
前記表示制御手段(105)が、第1の状態提示領域を狭窄率に基づいて色分けし、第2の状態表示領域を前記プラークの種類に基づいて色分けすることを特徴とする請求項3または4記載の診断支援装置。 The state estimation means (103) estimates the stenosis rate of the blood vessel and the type of plaque as the stenosis state,
The color determining means (104) determines a color corresponding to the stenosis rate and a color corresponding to the type of plaque for each cross section,
The said display control means (105) color-codes a 1st state presentation area | region based on a stenosis rate, and color-codes a 2nd state display area | region based on the kind of said plaque. The diagnosis support apparatus described. - 前記CPR画像生成手段(102)が生成するCPR画像が、ストレートCPR画像であることを特徴とする請求項1記載の診断支援装置。 The diagnosis support apparatus according to claim 1, wherein the CPR image generated by the CPR image generation means (102) is a straight CPR image.
- 前記色決定手段(104)が、予め記憶されている一または複数の変換テーブルを用いて色を決定することを特徴とする請求項1記載の診断支援装置。 The diagnosis support apparatus according to claim 1, wherein the color determination means (104) determines a color using one or a plurality of conversion tables stored in advance.
- 診断支援プログラムが記憶されたコンピュータ読み取り可能な記憶媒体であって、前記診断支援プログラムが、少なくとも一台のコンピュータにより実行されたときに、前記コンピュータに、
撮影により取得されたボリュームデータから、血管を表す血管領域を抽出するとともに、該血管の芯線および該芯線に垂直な複数の断面を設定する血管抽出処理と、
前記血管領域、前記芯線および前記各断面の情報に基づいて、前記血管の少なくとも一部の範囲を表すCPR画像を生成するCPR画像生成処理と、
前記血管領域に含まれる情報を前記断面ごとに解析して、各断面における前記血管の狭窄状態を推定する状態推定処理と、
前記断面ごとに、推定された狭窄状態を表す少なくとも1つの色を決定する色決定処理と、
表示画面内の所定領域に前記CPR画像を配置し、さらに前記所定領域の外側に前記CPR画像が表す血管と並行するように帯状の状態提示領域を少なくとも一つ配置して、該状態提示領域を前記色決定手段の決定に基づいて色分け表示する表示制御処理と、
を実行させることを特徴とする、コンピュータ読み取り可能な記憶媒体。 A computer-readable storage medium storing a diagnosis support program, and when the diagnosis support program is executed by at least one computer,
A blood vessel extraction process for extracting a blood vessel region representing a blood vessel from the volume data acquired by photographing, and setting a core line of the blood vessel and a plurality of cross sections perpendicular to the core line;
CPR image generation processing for generating a CPR image representing a range of at least a part of the blood vessel based on the information on the blood vessel region, the core line, and each cross section;
Analyzing the information included in the blood vessel region for each cross section, and estimating a stenosis state of the blood vessel in each cross section; and
A color determination process for determining at least one color representing an estimated stenosis state for each cross section;
The CPR image is arranged in a predetermined area in the display screen, and at least one belt-like state presentation area is arranged outside the predetermined area so as to be parallel to the blood vessel represented by the CPR image, and the state presentation area is Display control processing for color-coded display based on the determination of the color determination means;
The computer-readable storage medium characterized by performing the above. - 撮影により取得されたボリュームデータから、血管を表す血管領域を抽出するとともに、該血管の芯線および該芯線に垂直な複数の断面を設定する血管抽出処理と、
前記血管領域、前記芯線および前記各断面の情報に基づいて、前記血管の少なくとも一部の範囲を表すCPR画像を生成するCPR画像生成処理と、
前記血管領域に含まれる情報を前記断面ごとに解析して、各断面における前記血管の狭窄状態を推定する状態推定処理と、
前記断面ごとに、推定された狭窄状態を表す少なくとも1つの色を決定する色決定処理と、
表示画面内の所定領域に前記CPR画像を配置し、さらに前記所定領域の外側に前記CPR画像が表す血管と並行するように帯状の状態提示領域を少なくとも一つ配置して、該状態提示領域を前記色決定手段の決定に基づいて色分け表示する表示制御処理と、
を行うことを特徴とする診断支援方法。 A blood vessel extraction process for extracting a blood vessel region representing a blood vessel from the volume data acquired by photographing, and setting a core line of the blood vessel and a plurality of cross sections perpendicular to the core line;
CPR image generation processing for generating a CPR image representing a range of at least a part of the blood vessel based on the information on the blood vessel region, the core line, and each cross section;
Analyzing the information included in the blood vessel region for each cross section, and estimating a stenosis state of the blood vessel in each cross section; and
A color determination process for determining at least one color representing an estimated stenosis state for each cross section;
The CPR image is arranged in a predetermined area in the display screen, and at least one belt-like state presentation area is arranged outside the predetermined area so as to be parallel to the blood vessel represented by the CPR image, and the state presentation area is Display control processing for color-coded display based on the determination of the color determination means;
A diagnostic support method characterized in that
Priority Applications (3)
| Application Number | Priority Date | Filing Date | Title |
|---|---|---|---|
| EP10820135.1A EP2484285A4 (en) | 2009-09-30 | 2010-09-29 | Diagnosis assisting system, diagnosis assisting program, and diagnosis assisting method |
| US13/499,087 US8744151B2 (en) | 2009-09-30 | 2010-09-29 | Diagnosis assisting system, diagnosis assisting program and diagnosis assisting method |
| CN201080043867.5A CN102548481B (en) | 2009-09-30 | 2010-09-29 | Diagnosis assisting system |
Applications Claiming Priority (2)
| Application Number | Priority Date | Filing Date | Title |
|---|---|---|---|
| JP2009226354A JP5436125B2 (en) | 2009-09-30 | 2009-09-30 | Diagnosis support apparatus, operation method thereof, and diagnosis support program |
| JP2009-226354 | 2009-09-30 |
Publications (1)
| Publication Number | Publication Date |
|---|---|
| WO2011040014A1 true WO2011040014A1 (en) | 2011-04-07 |
Family
ID=43825859
Family Applications (1)
| Application Number | Title | Priority Date | Filing Date |
|---|---|---|---|
| PCT/JP2010/005864 WO2011040014A1 (en) | 2009-09-30 | 2010-09-29 | Diagnosis assisting system, diagnosis assisting program, and diagnosis assisting method |
Country Status (5)
| Country | Link |
|---|---|
| US (1) | US8744151B2 (en) |
| EP (1) | EP2484285A4 (en) |
| JP (1) | JP5436125B2 (en) |
| CN (1) | CN102548481B (en) |
| WO (1) | WO2011040014A1 (en) |
Families Citing this family (26)
| Publication number | Priority date | Publication date | Assignee | Title |
|---|---|---|---|---|
| JP5950619B2 (en) * | 2011-04-06 | 2016-07-13 | キヤノン株式会社 | Information processing device |
| JP5456014B2 (en) * | 2011-12-22 | 2014-03-26 | 株式会社Aze | MEDICAL IMAGE GENERATION DEVICE, MEDICAL IMAGE GENERATION PROGRAM, AND MEDICAL IMAGE GENERATION METHOD |
| JP2013128704A (en) * | 2011-12-22 | 2013-07-04 | Aze Ltd | Medical image forming apparatus, medical image forming program, and medical image forming method |
| JP6139073B2 (en) * | 2012-08-02 | 2017-05-31 | 東芝メディカルシステムズ株式会社 | Image processing apparatus and magnetic resonance imaging apparatus |
| JP6116833B2 (en) * | 2012-09-03 | 2017-04-19 | 東芝メディカルシステムズ株式会社 | Medical image processing device |
| JP6113460B2 (en) * | 2012-11-09 | 2017-04-12 | 東芝メディカルシステムズ株式会社 | Medical image processing apparatus and medical image diagnostic apparatus |
| JP6491378B2 (en) * | 2012-11-30 | 2019-03-27 | キヤノンメディカルシステムズ株式会社 | Display method, medical image diagnostic apparatus, and program |
| JP6353827B2 (en) * | 2013-02-28 | 2018-07-04 | 株式会社日立製作所 | Image processing device |
| US9805463B2 (en) | 2013-08-27 | 2017-10-31 | Heartflow, Inc. | Systems and methods for predicting location, onset, and/or change of coronary lesions |
| WO2015045368A1 (en) * | 2013-09-26 | 2015-04-02 | テルモ株式会社 | Image processing device, image display system, imaging system, image processing method, and program |
| JP6322971B2 (en) * | 2013-11-27 | 2018-05-16 | 株式会社Aze | Medical image diagnosis support apparatus, method and program |
| US9754082B2 (en) * | 2014-05-30 | 2017-09-05 | Heartflow, Inc. | Systems and methods for reporting blood flow characteristics |
| JP6415903B2 (en) * | 2014-09-02 | 2018-10-31 | キヤノンメディカルシステムズ株式会社 | Medical image processing device |
| US10478130B2 (en) | 2015-02-13 | 2019-11-19 | Siemens Healthcare Gmbh | Plaque vulnerability assessment in medical imaging |
| KR102490069B1 (en) | 2015-08-18 | 2023-01-19 | 삼성메디슨 주식회사 | Ultrasonic diagnostic apparatus and operating method for the same |
| JP2017074320A (en) * | 2015-10-16 | 2017-04-20 | キヤノンマーケティングジャパン株式会社 | Medical image processing device, program mountable on medical image processing device, and medical image processing method |
| US10856773B2 (en) * | 2015-10-30 | 2020-12-08 | Conopco, Inc. | Hair diameter measurement |
| BR112018007512A2 (en) | 2015-10-30 | 2018-10-23 | Unilever Nv | ? method of measuring hair type indications, hair type measurement system, reference card for use with a computer program and computer program? |
| DE202017106017U1 (en) * | 2016-10-04 | 2018-02-05 | Toshiba Medical Systems Corporation | Medical information processing device |
| US11617620B2 (en) | 2017-02-24 | 2023-04-04 | Heartflow, Inc. | Systems and methods for identifying anatomically relevant blood flow characteristics in a patient |
| EP3457404A1 (en) * | 2017-09-18 | 2019-03-20 | Koninklijke Philips N.V. | Estimating flow to vessel bifurcations for simulated hemodynamics |
| US10639105B2 (en) * | 2017-11-29 | 2020-05-05 | Canon Medical Systems Corporation | Navigation apparatus and method |
| CN108564568A (en) * | 2018-03-23 | 2018-09-21 | 沈阳东软医疗系统有限公司 | Display methods, device, equipment and the storage medium of coronary artery |
| CN110428417A (en) * | 2019-08-13 | 2019-11-08 | 无锡祥生医疗科技股份有限公司 | Property method of discrimination, storage medium and the Vltrasonic device of carotid plaques |
| JP7041446B2 (en) * | 2020-08-12 | 2022-03-24 | キヤノンメディカルシステムズ株式会社 | Medical image processing methods, medical image processing equipment and medical image processing systems |
| CN112288731A (en) * | 2020-11-05 | 2021-01-29 | 杭州深睿博联科技有限公司 | Blood vessel stenosis analysis method and device |
Citations (8)
| Publication number | Priority date | Publication date | Assignee | Title |
|---|---|---|---|---|
| JP2004283373A (en) * | 2003-03-20 | 2004-10-14 | Toshiba Corp | Analyzer of luminal structure |
| JP2006167287A (en) | 2004-12-17 | 2006-06-29 | Toshiba Corp | Hemadostenosis rate analysis system |
| JP2007275141A (en) * | 2006-04-03 | 2007-10-25 | Hitachi Medical Corp | Image display device |
| JP2009048679A (en) | 2007-08-15 | 2009-03-05 | Sony Corp | Method for driving storage device |
| JP2009069895A (en) | 2007-09-10 | 2009-04-02 | Fuji Xerox Co Ltd | Document management system |
| JP2009082407A (en) * | 2007-09-28 | 2009-04-23 | Toshiba Corp | Image processor and medical image processor |
| JP2009195561A (en) * | 2008-02-22 | 2009-09-03 | Toshiba Corp | X-ray ct apparatus, image processing device and image processing program |
| WO2010055815A1 (en) * | 2008-11-13 | 2010-05-20 | 株式会社 日立メディコ | Medical image-processing device and method |
Family Cites Families (4)
| Publication number | Priority date | Publication date | Assignee | Title |
|---|---|---|---|---|
| US20020115931A1 (en) * | 2001-02-21 | 2002-08-22 | Strauss H. William | Localizing intravascular lesions on anatomic images |
| DE102004036726A1 (en) * | 2004-07-29 | 2006-03-16 | Siemens Ag | Method and device for visualizing deposits in blood vessels, in particular in coronary vessels |
| US8077939B2 (en) * | 2006-11-22 | 2011-12-13 | General Electric Company | Methods and systems for enhanced plaque visualization |
| US8229201B2 (en) * | 2007-06-15 | 2012-07-24 | General Electric Company | Systems, methods and apparatus for plaque visualization and quantification using fuzzy and adaptive region classes |
-
2009
- 2009-09-30 JP JP2009226354A patent/JP5436125B2/en not_active Expired - Fee Related
-
2010
- 2010-09-29 CN CN201080043867.5A patent/CN102548481B/en not_active Expired - Fee Related
- 2010-09-29 WO PCT/JP2010/005864 patent/WO2011040014A1/en active Application Filing
- 2010-09-29 US US13/499,087 patent/US8744151B2/en not_active Expired - Fee Related
- 2010-09-29 EP EP10820135.1A patent/EP2484285A4/en not_active Ceased
Patent Citations (8)
| Publication number | Priority date | Publication date | Assignee | Title |
|---|---|---|---|---|
| JP2004283373A (en) * | 2003-03-20 | 2004-10-14 | Toshiba Corp | Analyzer of luminal structure |
| JP2006167287A (en) | 2004-12-17 | 2006-06-29 | Toshiba Corp | Hemadostenosis rate analysis system |
| JP2007275141A (en) * | 2006-04-03 | 2007-10-25 | Hitachi Medical Corp | Image display device |
| JP2009048679A (en) | 2007-08-15 | 2009-03-05 | Sony Corp | Method for driving storage device |
| JP2009069895A (en) | 2007-09-10 | 2009-04-02 | Fuji Xerox Co Ltd | Document management system |
| JP2009082407A (en) * | 2007-09-28 | 2009-04-23 | Toshiba Corp | Image processor and medical image processor |
| JP2009195561A (en) * | 2008-02-22 | 2009-09-03 | Toshiba Corp | X-ray ct apparatus, image processing device and image processing program |
| WO2010055815A1 (en) * | 2008-11-13 | 2010-05-20 | 株式会社 日立メディコ | Medical image-processing device and method |
Non-Patent Citations (1)
| Title |
|---|
| See also references of EP2484285A4 * |
Also Published As
| Publication number | Publication date |
|---|---|
| US20120189181A1 (en) | 2012-07-26 |
| US8744151B2 (en) | 2014-06-03 |
| JP5436125B2 (en) | 2014-03-05 |
| CN102548481B (en) | 2017-05-10 |
| EP2484285A4 (en) | 2014-05-14 |
| EP2484285A1 (en) | 2012-08-08 |
| JP2011072500A (en) | 2011-04-14 |
| CN102548481A (en) | 2012-07-04 |
Similar Documents
| Publication | Publication Date | Title |
|---|---|---|
| JP5436125B2 (en) | Diagnosis support apparatus, operation method thereof, and diagnosis support program | |
| JP5642407B2 (en) | Diagnosis support system, diagnosis support program, and diagnosis support method | |
| EP2442276B1 (en) | Medical image processing apparatus and medical image processing method | |
| JP4926199B2 (en) | Diagnosis support apparatus, diagnosis support program, and diagnosis support method | |
| JP6325221B2 (en) | X-ray diagnostic apparatus and medical image processing apparatus | |
| JP6930283B2 (en) | Image processing device, operation method of image processing device, and image processing program | |
| JP5694323B2 (en) | Generating object data | |
| US8693759B2 (en) | Image processing device and image processing method | |
| US20130195339A1 (en) | Image processing apparatus, imaging system, and image processing method | |
| JP5572470B2 (en) | Diagnosis support apparatus, method, and program | |
| US9972084B2 (en) | Medical image processing apparatus and image display control method for the same | |
| JP5934071B2 (en) | Apparatus, method and program for searching for shortest path of tubular structure | |
| JP2007202957A (en) | Wall motion measuring device and medical image diagnostic apparatus | |
| US20230172451A1 (en) | Medical image visualization apparatus and method for diagnosis of aorta | |
| CN110717487A (en) | Method and system for identifying cerebrovascular abnormalities | |
| WO2012081492A1 (en) | Medical image-processing apparatus | |
| JP5135344B2 (en) | Diagnostic imaging support device | |
| JP4931638B2 (en) | Exercise test interpretation | |
| JP7365093B1 (en) | Medical image processing device, medical image processing program, and medical image processing method | |
| US20080045814A1 (en) | Method and system for the treatment of lesions | |
| JP6568375B2 (en) | Ophthalmic information processing system, image processing apparatus, and image processing method | |
| JP6411072B2 (en) | Medical image processing apparatus, medical image processing method, and program | |
| JP2022550267A (en) | Automated analysis of image data to determine blood flow reserve ratio | |
| KR20240039479A (en) | Medical image visualization apparatus and method for diagnosis of aorta |
Legal Events
| Date | Code | Title | Description |
|---|---|---|---|
| WWE | Wipo information: entry into national phase |
Ref document number: 201080043867.5 Country of ref document: CN |
|
| 121 | Ep: the epo has been informed by wipo that ep was designated in this application |
Ref document number: 10820135 Country of ref document: EP Kind code of ref document: A1 |
|
| WWE | Wipo information: entry into national phase |
Ref document number: 13499087 Country of ref document: US Ref document number: 2010820135 Country of ref document: EP |
|
| NENP | Non-entry into the national phase |
Ref country code: DE |