WO2011002793A1 - Multiple excitation capacitance polling for enhanced electronic capacitance tomography - Google Patents
Multiple excitation capacitance polling for enhanced electronic capacitance tomography Download PDFInfo
- Publication number
- WO2011002793A1 WO2011002793A1 PCT/US2010/040446 US2010040446W WO2011002793A1 WO 2011002793 A1 WO2011002793 A1 WO 2011002793A1 US 2010040446 W US2010040446 W US 2010040446W WO 2011002793 A1 WO2011002793 A1 WO 2011002793A1
- Authority
- WO
- WIPO (PCT)
- Prior art keywords
- capacitance
- electrodes
- electrode
- signals
- different
- Prior art date
- Legal status (The legal status is an assumption and is not a legal conclusion. Google has not performed a legal analysis and makes no representation as to the accuracy of the status listed.)
- Ceased
Links
Classifications
-
- G—PHYSICS
- G01—MEASURING; TESTING
- G01N—INVESTIGATING OR ANALYSING MATERIALS BY DETERMINING THEIR CHEMICAL OR PHYSICAL PROPERTIES
- G01N27/00—Investigating or analysing materials by the use of electric, electrochemical, or magnetic means
- G01N27/02—Investigating or analysing materials by the use of electric, electrochemical, or magnetic means by investigating impedance
- G01N27/22—Investigating or analysing materials by the use of electric, electrochemical, or magnetic means by investigating impedance by investigating capacitance
- G01N27/228—Circuits therefor
Definitions
- ECT Electrical capacitance tomography
- ECT is a technique to determine the dielectric permittivity distribution in the interior of an object from external capacitance measurements.
- ECT's advantages over conventional tomographic techniques include non-intrusiveness, non-destruction, no radiation hazard, and low cost.
- ECT has found many applications, such as measurement of gas/liquid and gas/solid flows in pipelines; analysis of dynamic processes in fluidized beds; monitoring of mixing and separation processes; visualization of combustion flames in engine cylinders; and detection of leakage from buried water pipes.
- ECT enables insight into the material distribution within a closed vessel, and consequently, into the governing mechanism in processes occurring within the vessel, without disturbing the processes themselves.
- Research on ECT encompasses sensor design, capacitance measuring circuit design, and image reconstruction. While sensor and circuit design involve hardware, image reconstruction typically involves software.
- FIG. 1 shows a typical ECT system 100 that includes the following components: (1) an ECT sensor 110 that registers physical responses from the object being measured; (2) excitation and measurement circuitry 120 that drives the sensor 1 10 and conditions the received signals; and (3) a computer-based data acquisition and channel switching system 130 to provide control signals 134 for the sequential excitation of the electrodes.
- the computer-based system 130 can also reconstruct tomographic images of the object based on the measured data 132.
- the ECT sensor 110 consists of a total of M electrodes 1 1 Ia-I l lm that are mounted symmetrically outside of a cylindrical container 114.
- an excitation signal in the form of an alternating current (AC) voltage is applied to one of the electrodes, e.g., electrode I l i a, and the remaining electrodes 1 1 Ib-1 1 1 m are kept at ground potential to act as detector electrodes.
- the voltage potential at each of the remaining electrodes 1 1 Ib-1 1 Im is measured, one at a time, by the measurement electronics 120 to determine the inter-electrode capacitance.
- inter- electrode capacitance is measured between electrodes I l ia and 1 1 1b
- capacitance is measured between electrodes I l ia and 111c, then between electrode I l ia and 1 1 Id, and so on.
- the capacitances is measured first between electrodes 111b and 1 11c, then between electrodes 1 1 1b and 11 Id, and so on. Measurement cycles continue with each individual electrode assuming the role of an excitation source and a detector, alternately, until all the inter-electrode capacitances are measured.
- the measured capacitances can be then represented in a matrix and used to reconstruct the tomographic image of the object within the cylindrical container.
- H M(M- 1 )/2.
- the number of electrodes M was typically chosen to be 6, 8, 12, 16, and 32.
- the number of independent capacitance measurements H was 15, 28, 66, 120, and 496, respectively.
- the number of capacitance measurements to be performed by the ECT sensor is a parameter that affects the quality of the reconstructed image. Increasing the number of electrodes improves the resolution of the reconstructed image. For a given measurement area, however, increasing the number of electrodes also causes each electrode to have a smaller surface, thus decreasing the magnitude of the inter- electrode capacitance, which, in turn, leads to a lower signal-to-noise ratio (SNR) given fixed background noise.
- SNR signal-to-noise ratio
- One solution to this problem is the grouping technique, which involves combining two or more electrodes into one segment to increase the magnitude of the received signal, as shown in FIG. 2. However, excitation of the electrodes within each segment is still performed in steps of one electrode at a time only. This grouping configuration is repeated along the sensor circumference by shifting the connection by one electrode in each measurement to form a series of independent measurements.
- FIG. 2 shows an eight-electrode sensor 1 10 operated in the four-segment mode.
- the total surface area covered by electrodes 1 1 Ia-1 1 Im equals that of a four- electrode ECT sensor without segmentation, so the SNR remains the same as that of the four-segment sensor.
- the total number of independent measurements performed by the ECT electronics in each scanning frame is twice as high (twelve vs. six) compared to a conventional four-electrode sensor, thus achieving higher resolution for better image reconstruction.
- Embodiments include an apparatus, corresponding method, and
- FIG. 3 is a schematic illustration of a multiple excitation capacitance polling (MECaP) ECT system according to embodiments of the present invention.
- MECaP multiple excitation capacitance polling
- FIGS. 4A and 4B show schematic illustrations of a circuit model and a finite element model, respectively, for evaluating an MECaP ECT system.
- FIGS. 6A and 6B are plots of output current and signal magnitude, respectively, for measurement of Cj 2 .
- FIGS. 7A and 7B are a schematic diagram and a circuit diagram, respectively, of an MECaP evaluation model for measuring Cn and C 23 .
- FIGS. 8 A and 8B are plots of output current and signal magnitude, respectively, for measurement of Ci 3 and C 23 .
- FIG. 9 is a circuit diagram for an equivalent circuit for measuring an arbitrary number of capacitances.
- FIG. 10 is a bar graph showing scanning speed with MECaP techniques for different numbers of simultaneous excitations.
- ECT alternating current electronic capacitance tomography
- MECaP Multiple Excitation Capacitance Polling
- N AC excitation signals each of which is at a different frequency, e.g.,/1,/2, ... fy, to N respective electrodes in an ECT sensor with M electrodes (N ⁇ M ⁇ 1 ) ;
- FIG. 3 shows an MECaP ECT system 300 capable of making multiple simultaneous inter-electrode capacitance measurements according to the present inventive techniques.
- the system 300 includes a sensor 310 with eight electrodes 311 a ⁇ 31 1 h (of course, other sensors may include any suitable number and configuration of electrodes).
- Oscillators 340 apply excitation signals to a subset of the electrodes 31 la— 31 Ih; here, each oscillator 340 applies a respective signal to each of electrodes 31 la— 31 Ie, where the respective signals are at different - .
- Electrode 31 Ig detects the signals from electrodes 31 1 a-311 e and couples them into bandpass filters 350, which transmit signals near their respective center frequencies, f ⁇ ,f ⁇ , .. . / N , to amplifiers 360.
- the amplified, filtered signals can then be used to compute capacitances between the various pairwise combinations of electrode 31 1 g and each of electrodes 31 1 a— 3 l ie.
- MECaP techniques involve only seven measurements as specified in Table 1. Because the delay caused by the additional bandpass filtering electronics will be on the order of nanoseconds, which is far less than the period of each measurement (typically 10 ⁇ s), the MECaP method enables a scanning speed increase of approximately three times relative to the traditional method. Other embodiments may enable even larger increases in scanning speed.
- Table 1 shows that the excitation signals are applied to the electrodes in an increasing order instead of all at once. If all the excitation signals are applied at the same time, then the equations may become unsolvable. This progressive or successive excitation, which is more than just “parallel” vs. "serial" excitation, distinguishes MECaP from other ECT techniques.
- Table 1 Measurement sequence for an eight-electrode sensor using the MECaP method.
- Table 2 shows a comparison among traditional AC techniques, grouping techniques, and MECaP techniques with and without grouping.
- MECaP can reduce the total number of measurements to be performed in each scanning frame by (M-l)(M-2)/2. If the electrodes are grouped into K sections, MECaP techniques may reduce the number of measurements by (M/K)(K-l)(K-2)/2.
- the reduction in the number of measurements is proportional to the square of the parameter M or K, As a result, increasing the number of electrodes and/or sections in the sensor significantly increases the scanning speed.
- FlG. 4A shows a circuit model 400 used to evaluate and simulate the electrode excitation process with MECaP techniques.
- a measurement object is modeled as a 100 mm diameter, 100 mm thick cylinder 401 .
- Four electrodes 41 1 a-4 ] 1 d are attached to the outer surface of the cylinder 401.
- a synthesizer 430 which is electrically coupled between ground and a first resistor 432, generates a sinusoidal excitation u ⁇ at a frequency of 1 MHz. Applying U] to the first electrode 41 1a and measuring the resulting current across a second resistor 434 coupled to the second electrode 41 1 b makes it possible to measure the capacitance Ci 2 between the first and second electrodes 41 Ia, 41 Ib.
- FIG. 4B shows a meshed finite-element model 450 used with the circuit model 400 of FIG. 4A to evaluate and simulate the electrode excitation process with MECaP techniques.
- the cylinder 401 of FIG. 4A is decomposed into numerous finite elements 451 arrayed on a cylindrical lattice.
- the capacitance between any given pair of elements 451 can be simulated by modeling a second electrical connection between the pair.
- the second electrical connection is shown as a first resistor 482 in series with a voltage source 480 and a second resistor 484.
- the behavior of the MECaP techniques can be simulated by evaluating the finite-element model 450 using standard numerical methods.
- FIG. 5 shows an equivalent circuit 500 that can be used to measure Ci 2 , the capacitance between electrodes 41 1a and 41 1b shown in FIG. 4B.
- the stray capacitance C h ⁇ and C & are assumed to be zero for the purpose of simplification.
- the current, i, going through the second resistor 434 is measured and used with other parameters to calculate the capacitance values between pairs of electrodes,
- FIGS. 6 A and 6B are plots of the output current and signal magnitude, respectively, going through the second resistor 434.
- the peak amplitude of the output current, A(i) is calculated as 8.714 mA.
- the peak value of the current can be measured by using a demodulator circuit. With the value of the second resistor 434 set to i? on - 60 ⁇ , the capacitance Cj 2 is 92 pF.
- FIG. 7A is a schematic diagram of simultaneous measurement of capacitance between two different pairs of electrodes according to MECaP techniques.
- the third electrode 41 Ic is used to collect the received signal.
- the current going through the third electrode 411c can be measured by using the demodulator circuit referred to above.
- the capacitance Cj 3 and C 23 relationships between the excitation signals, u ⁇ and M 2 , and the output signal, / 3 , need to be established.
- FIG. 7B is a diagram of a circuit 700 that can be used to establish a relationship among the excitation signals, u ⁇ and M 2 , and the output signal, z ' 3 .
- each of them can be analyzed independently by assuming the others to be held at zero potential.
- excitation signal 1 12 is first considered to be zero. Derivation yields the following relationship between the port currents, / ' 1 and Z 2 , and the input voltage, u ⁇ ⁇
- the above described measurement may be continued by connecting electrodes 41 Ia, 41 Ib, and 41 1 c to three excitation sources (not shown)
- the capacitance between each of the excited electrodes 41 la— 41 Ic and electrode 41 Id are the only unknown parameters in the above equations. They can be found by establishing the relationship between the three excitation voltages and the three filtered currents. For example, by considering that three AC voltages u ⁇ , M 2 , and m are used to excite electrodes 41 Ia, 41 Ib, and 411c, respectively, the relationship between u ⁇ and the current going through electrode 41 Id can be established as:
- Z ⁇ 1/ j ⁇ Ci k , (k, ⁇ 2, ... , N+ ⁇ ) is the equivalent impedance between the first electrode (e.g., electrode 41 1 a) and the N+ ⁇ electrode (e.g., electrode 41 Id).
- Equation (7) can be rewritten in the matrix form:
- the ratio between the current, i, and the excitation signal voltage, u ⁇ can be expressed as:
- det[ ⁇ is a first-order linear function of impedance
- Table 3 lists the maximum scanning speeds for different measurement techniques and numbers of electrodes.
- the maximum scanning speeds using MECaP and traditional AC techniques are calculated using optimal time per measurement values. Results from the two methods are compared in four different cases, where the number of the electrodes, M, is assumed to be 8, 12, 16, or 44 (grouped into 4 sections).
- FIG. 10 is a plot of scanning speed versus the number of simultaneous excitations.
- the frequency bandwidth may limit the number of excitations that can be applied simultaneously to the electrodes.
- FIG. 10 shows that significant increase in capacitance scanning speed can be achieved for the same sensor configurations when MECaP techniques are applied compared to traditional AC techniques.
- FIG. 1 1 is a plot of estimated scanning period (triangles) and estimated calculation time (circles) using MECaP techniques for different numbers of excitations N. Compared with the traditional ECT techniques, extra calculation steps may be needed to perform the calculations described above, which, in turn, may affect the application of MECaP techniques to monitoring the object in real time.
- the calculation time may include three sub-calculations:
- the calculation time is shorter than the scanning period, which allows for data processing in real time. This corresponds to an achievable scanning speed of 9,400 frames/sec.
- Embodiments of the present inventive MECaP technique may use different or optimal numbers of simultaneous excitations depending on trade-offs between the maximum scanning speed and the minimum differentiable frequency bandwidth.
- Embodiments may also use coding methods for sensing channel differentiation.
- embodiments may use signal processing methods for channel coding that complement the frequency band allocation to ensure reliable channel separation and differentiation among multiple electrodes. Coding can enhance the immunity of the circuitry to noise interference and consequently, improve the robustness of the measurement circuitry.
- different embodiments may employ different spatial distributions of electrodes, When used to sense capacitance of cylindrical bodies, such as engines, the electrodes may be distributed along the radial and axial directions to maximize the signal-to-noise ratio in sensing.
- Further embodiments may include embedded electronics for simultaneous electrode scanning. For instance, microcontroller-based parallel excitation and measurement circuitry with embedded firmware may control the switching of sensing channels and interfacing with a computer or other processor.
- Embodiments of the invention can take the form of an entirely hardware embodiment, an entirely software embodiment, or an embodiment containing both hardware and software elements.
- the invention is implemented in software, which includes but is not limited to firmware, resident software, microcode, etc.
- embodiments of the invention can take the form of a computer program product accessible from a computer-usable or non-transitory computer- readable medium providing program code for use by or in connection with a computer or any instruction execution system.
- a computer-usable or computer readable medium can be any apparatus that can contain, store, communicate, propagate, or transport the program for use by or in connection with the instruction execution system, apparatus, or device.
- the medium can be an electronic, magnetic, optical, electromagnetic, infrared, or semiconductor system (or apparatus or device) or a propagation medium.
- Examples of a computer-readable medium include a semiconductor or solid state memory, magnetic tape, a removable computer diskette, a random access memory (RAM), a read-only memory (ROM), a rigid magnetic disk and an optical disk.
- Current examples of optical disks include compact disk - read only memory (CD- ROM), compact disk - read/write (CD-R/W) and DVD.
- a data processing system suitable for storing and/or executing program code will include at least one processor coupled directly or indirectly to memory elements through a system bus.
- the memory elements can include local memory employed during actual execution of the program code, bulk storage, and cache memories which provide temporary storage of at least some program code in order to reduce the number of times code must be retrieved from bulk storage during execution.
- I/O devices including but not limited to keyboards, displays, pointing devices, etc.
- I/O controllers can be coupled to the system either directly or through intervening I/O controllers.
- Network adapters may also be coupled to the system to enable the data processing system to become coupled to other data processing systems or remote printers or storage devices through intervening private or public networks.
- Modems, cable modem and Ethernet cards are just a few of the currently available types of network adapters.
Landscapes
- Chemical & Material Sciences (AREA)
- Chemical Kinetics & Catalysis (AREA)
- Electrochemistry (AREA)
- Physics & Mathematics (AREA)
- Health & Medical Sciences (AREA)
- Life Sciences & Earth Sciences (AREA)
- Analytical Chemistry (AREA)
- Biochemistry (AREA)
- General Health & Medical Sciences (AREA)
- General Physics & Mathematics (AREA)
- Immunology (AREA)
- Pathology (AREA)
- Investigating Or Analyzing Materials By The Use Of Electric Means (AREA)
Abstract
Disclosed herein is a novel sensing technique, termed Multiple Excitation Capacitance Polling (MECaP), that improves the efficiency of Electrical Capacitance Tomography (ECT). Unlike traditional alternating current techniques, where excitation signal is applied to an electrode one at a time, MECaP involves simultaneously applying multiple excitation signals, in a progressively increasing fashion, to multiple electrodes on an ECT sensor. The received signals are filtered or otherwise decomposed (e.g., Fourier transformed) into different components, and the individual components are used to generate an image of the article or substance disposed between the electrodes. Because multiple capacitances can be simultaneously measured as a consequence, scanning with MECaP can significantly increase the image scanning speed. For example, scanning with MECaP may enable frames rates of tens of kHz for imaging dynamic processes such as engine combustion.
Description
MULTIPLE EXCITATION CAPACITANCE POLLING FOR ENHANCED ELECTRONIC CAPACITANCE TOMOGRAPHY
RELATED APPLICATION
This application claims the benefit of U.S. Provisional Application No. 61/221 ,806, filed on June 30, 2009, the entire teachings of which are incorporated herein by reference.
BACKGROUND
Electrical capacitance tomography (ECT) is a technique to determine the dielectric permittivity distribution in the interior of an object from external capacitance measurements. ECT's advantages over conventional tomographic techniques include non-intrusiveness, non-destruction, no radiation hazard, and low cost. In industry, ECT has found many applications, such as measurement of gas/liquid and gas/solid flows in pipelines; analysis of dynamic processes in fluidized beds; monitoring of mixing and separation processes; visualization of combustion flames in engine cylinders; and detection of leakage from buried water pipes.
ECT enables insight into the material distribution within a closed vessel, and consequently, into the governing mechanism in processes occurring within the vessel, without disturbing the processes themselves. Research on ECT encompasses sensor design, capacitance measuring circuit design, and image reconstruction. While sensor and circuit design involve hardware, image reconstruction typically involves software.
FIG. 1 shows a typical ECT system 100 that includes the following components: (1) an ECT sensor 110 that registers physical responses from the object being measured; (2) excitation and measurement circuitry 120 that drives the sensor 1 10 and conditions the received signals; and (3) a computer-based data acquisition and channel switching system 130 to provide control signals 134 for the
sequential excitation of the electrodes. The computer-based system 130 can also reconstruct tomographic images of the object based on the measured data 132.
As shown in FIG. 1 , the ECT sensor 110 consists of a total of M electrodes 1 1 Ia-I l lm that are mounted symmetrically outside of a cylindrical container 114. Traditionally, during each scanning frame, an excitation signal in the form of an alternating current (AC) voltage is applied to one of the electrodes, e.g., electrode I l i a, and the remaining electrodes 1 1 Ib-1 1 1 m are kept at ground potential to act as detector electrodes. Subsequently, the voltage potential at each of the remaining electrodes 1 1 Ib-1 1 Im is measured, one at a time, by the measurement electronics 120 to determine the inter-electrode capacitance. Specifically, in the first round of the measurements, inter- electrode capacitance is measured between electrodes I l ia and 1 1 1b, Next, capacitance is measured between electrodes I l ia and 111c, then between electrode I l ia and 1 1 Id, and so on. In the second round of measurements, the capacitances is measured first between electrodes 111b and 1 11c, then between electrodes 1 1 1b and 11 Id, and so on. Measurement cycles continue with each individual electrode assuming the role of an excitation source and a detector, alternately, until all the inter-electrode capacitances are measured.
The measured capacitances can be then represented in a matrix and used to reconstruct the tomographic image of the object within the cylindrical container. Analytically, with M electrodes 1 1 Ia-1 1 Im in the ECT sensor 1 10, a total number of // independent capacitance measurements take place, where H = M(M- 1 )/2. In ECT systems reported in the literature, the number of electrodes M was typically chosen to be 6, 8, 12, 16, and 32. Thus, the number of independent capacitance measurements H was 15, 28, 66, 120, and 496, respectively.
The number of capacitance measurements to be performed by the ECT sensor is a parameter that affects the quality of the reconstructed image. Increasing the number of electrodes improves the resolution of the reconstructed image. For a given measurement area, however, increasing the number of electrodes also causes each electrode to have a smaller surface, thus decreasing the magnitude of the inter- electrode capacitance, which, in turn, leads to a lower signal-to-noise ratio (SNR) given fixed background noise.
One solution to this problem is the grouping technique, which involves combining two or more electrodes into one segment to increase the magnitude of the received signal, as shown in FIG. 2. However, excitation of the electrodes within each segment is still performed in steps of one electrode at a time only. This grouping configuration is repeated along the sensor circumference by shifting the connection by one electrode in each measurement to form a series of independent measurements.
FIG. 2 shows an eight-electrode sensor 1 10 operated in the four-segment mode. The total surface area covered by electrodes 1 1 Ia-1 1 Im equals that of a four- electrode ECT sensor without segmentation, so the SNR remains the same as that of the four-segment sensor. After measuring the first six capacitance values for a first configuration 202, the electrodes 1 1 Ia-1 1 Im are re-connected in a second configuration 204. This can be viewed as a rotation of the four electrodes by θ = 45°. As a result, the total number of independent measurements performed by the ECT electronics in each scanning frame is twice as high (twelve vs. six) compared to a conventional four-electrode sensor, thus achieving higher resolution for better image reconstruction.
Scanning speed is an important parameter of an ECT system, as it determines the usability of ECT for on-line, real-time applications involving fast changing dynamics, such as combustion or explosion within an enclosure. Currently, the maximum scanning speed achieved by ECT is about 300-1 ,000 frames/second. While satisfactory for general applications, this speed is far lower than what can be achieved with optical methods, although optical methods need direct access to the process to be monitored and thus are subject to various constraints (e.g., blockage of the line of sight) in real-world environments. For engine combustion process imaging, which is not easily monitored using optical methods, it is desirable to resolve the process at every crank angle (i.e., in 1° increments) at crank rotational speeds of up to 6,000 rev/min. This requires an ECT system that can collect data at a speed of up to 36,000 frames/second.
SUMMARY
Embodiments include an apparatus, corresponding method, and
corresponding non-transitory computer-readable medium with code for electronic capacitance tomography that includes measuring multiple excitation signals simultaneously. Source and receiver electrodes capacitively coupled together measure a spatial distribution of a substance within capacitive distance of at least one pair of the source and receiver electrodes. An excitation module coupled to the source electrodes excites simultaneously each source electrode with a different excitation signal. A measurement module coupled to the receiver electrodes simultaneously measures capacitance between pairs of source and receiver electrodes. The measured capacitances represent the spatial distribution of the substance.
In some embodiments, the different excitation signals are at different frequencies. Alternatively, the different excitation signals may be modulated with different codes. In any case, each receiver electrode may receive simultaneously excitation signals from more than one source electrode. The measurement module may be configured to measure capacitances between each receiver electrode and every source electrode simultaneously.
Further embodiments may include a discrimination module coupled to the measurement module. The discrimination module may be configured to discriminate among signals received simultaneously at a given receiver electrode from more than one source electrode, possibly with a filter bank configured to filter excitation signals at different frequencies. Alternatively, the discrimination module may decompose (e.g., Fourier transform) the signals detected by the receiver electrodes to measure the capacitances.
Still other embodiments may include an imaging module coupled to the measurement module. The imaging module may be configured to convert the measured capacitances to an indication, such as a 3D rendering, of the spatial distribution of the substance. Alternatively, a storage module coupled to the measurement module may store the measured capacitances, which can be converted
into indications of the spatial distribution of the substance with a postprocessing module.
BRIEF DESCRIPTION OF THE DRAWINGS
The foregoing will be apparent from the following more particular description of example embodiments of the invention, as illustrated in the accompanying drawings in which like reference characters refer to the same parts throughout the different views. The drawings are not necessarily to scale, emphasis instead being placed upon illustrating embodiments of the present invention.
FIG. 1 is a schematic illustration of a conventional electronic capacitance tomography (ECT) system.
FIG. 2 is a schematic illustration of a conventional ECT system that uses grouping techniques to improve resolution without sacrificing signal-to-noise ratio.
FIG. 3 is a schematic illustration of a multiple excitation capacitance polling (MECaP) ECT system according to embodiments of the present invention.
FIGS. 4A and 4B show schematic illustrations of a circuit model and a finite element model, respectively, for evaluating an MECaP ECT system.
FIG. 5 shows a circuit diagram for an equivalent circuit for measuring Cn-
FIGS. 6A and 6B are plots of output current and signal magnitude, respectively, for measurement of Cj2.
FIGS. 7A and 7B are a schematic diagram and a circuit diagram, respectively, of an MECaP evaluation model for measuring Cn and C23.
FIGS. 8 A and 8B are plots of output current and signal magnitude, respectively, for measurement of Ci3 and C23.
FIG. 9 is a circuit diagram for an equivalent circuit for measuring an arbitrary number of capacitances.
FIG. 10 is a bar graph showing scanning speed with MECaP techniques for different numbers of simultaneous excitations.
FIG. 1 1 is a plot of calculation time (circles) and scanning period (triangles) using MECaP techniques as a function of the number of simultaneous excitations.
DETAILED DESCRIPTION
A description of example embodiments of the invention follows.
Traditional alternating current (AC) electronic capacitance tomography (ECT) involves applying an excitation signal at each time instance to one of the M electrodes of an ECT sensor and measuring the voltage at the other electrodes to determine the inter-electrode capacitance. Such a timely sequential, single-electrode excitation method is time consuming, especially when A/ is relatively large. As an alternative, embodiments of the present inventive methods apply multiple excitation signals to multiple electrodes at each time instance, thus enabling simultaneous measurement of more than one inter-electrode capacitance, thereby improving the efficiency of AC-based ECT measurement systems. The present inventive method, which is known as Multiple Excitation Capacitance Polling (MECaP), involves:
(1) simultaneously applying N AC excitation signals, each of which is at a different frequency, e.g.,/1,/2, ... fy, to N respective electrodes in an ECT sensor with M electrodes (N < M ~~ 1 ) ;
(2) detecting the signals from each of the //excited electrodes with one of the remaining electrodes (M- N);
(3) filtering the received signals with a bank of N bandpass filters whose central frequencies are tuned to /1,/2, ... /v, respectively; and
(4) calculating the individual inter-electrode capacitance from either the ratio of the excitation signal magnitude to that of the received signal or phase changes in the received signal.
FIG. 3 shows an MECaP ECT system 300 capable of making multiple simultaneous inter-electrode capacitance measurements according to the present inventive techniques. As shown in FIG. 3, the system 300 includes a sensor 310 with eight electrodes 311 a~31 1 h (of course, other sensors may include any suitable number and configuration of electrodes). Oscillators 340 apply excitation signals to a subset of the electrodes 31 la— 31 Ih; here, each oscillator 340 applies a respective signal to each of electrodes 31 la— 31 Ie, where the respective signals are at different
 - . - /N- Electrode 31 Ig detects the signals from electrodes 31 1 a-311 e and couples them into bandpass filters 350, which transmit signals near
their respective center frequencies, f\,fι, .. . /N, to amplifiers 360. The amplified, filtered signals can then be used to compute capacitances between the various pairwise combinations of electrode 31 1 g and each of electrodes 31 1 a— 3 l ie.
- . - /N- Electrode 31 Ig detects the signals from electrodes 31 1 a-311 e and couples them into bandpass filters 350, which transmit signals near
their respective center frequencies, f\,fι, .. . /N, to amplifiers 360. The amplified, filtered signals can then be used to compute capacitances between the various pairwise combinations of electrode 31 1 g and each of electrodes 31 1 a— 3 l ie.
For eight electrodes, as shown in FIG. 3, there are a total of M(M- 1)12 = (8 x 1)12 = 28 capacitance measurements would need to be performed within each scanning frame using the traditional AC techniques. In comparison, MECaP techniques involve only seven measurements as specified in Table 1. Because the delay caused by the additional bandpass filtering electronics will be on the order of nanoseconds, which is far less than the period of each measurement (typically 10 μs), the MECaP method enables a scanning speed increase of approximately three times relative to the traditional method. Other embodiments may enable even larger increases in scanning speed.
Table 1 shows that the excitation signals are applied to the electrodes in an increasing order instead of all at once. If all the excitation signals are applied at the same time, then the equations may become unsolvable. This progressive or successive excitation, which is more than just "parallel" vs. "serial" excitation, distinguishes MECaP from other ECT techniques.
Table 1 : Measurement sequence for an eight-electrode sensor using the MECaP method.

Table 2 shows a comparison among traditional AC techniques, grouping techniques, and MECaP techniques with and without grouping. When grouping is not used, MECaP can reduce the total number of measurements to be performed in each scanning frame by (M-l)(M-2)/2. If the electrodes are grouped into K sections, MECaP techniques may reduce the number of measurements by (M/K)(K-l)(K-2)/2.
For the traditional and grouping cases, the reduction in the number of measurements is proportional to the square of the parameter M or K, As a result, increasing the number of electrodes and/or sections in the sensor significantly increases the scanning speed.
Table 2. Numbers of Measurements for Different ECT Techni ues

FlG. 4A shows a circuit model 400 used to evaluate and simulate the electrode excitation process with MECaP techniques. In the example shown in FIG. 4A, a measurement object is modeled as a 100 mm diameter, 100 mm thick cylinder 401 . Four electrodes 41 1 a-4 ] 1 d are attached to the outer surface of the cylinder 401. A synthesizer 430, which is electrically coupled between ground and a first resistor 432, generates a sinusoidal excitation u\ at a frequency of 1 MHz. Applying U] to the first electrode 41 1a and measuring the resulting current across a second resistor 434 coupled to the second electrode 41 1 b makes it possible to measure the capacitance Ci2 between the first and second electrodes 41 Ia, 41 Ib.
FIG. 4B shows a meshed finite-element model 450 used with the circuit model 400 of FIG. 4A to evaluate and simulate the electrode excitation process with MECaP techniques. Using finite-element analysis, the cylinder 401 of FIG. 4A is decomposed into numerous finite elements 451 arrayed on a cylindrical lattice. The capacitance between any given pair of elements 451 can be simulated by modeling a second electrical connection between the pair. In FIG. 4B, for example, the second electrical connection is shown as a first resistor 482 in series with a voltage source 480 and a second resistor 484. The behavior of the MECaP techniques can be simulated by evaluating the finite-element model 450 using standard numerical methods.
FIG. 5 shows an equivalent circuit 500 that can be used to measure Ci 2, the capacitance between electrodes 41 1a and 41 1b shown in FIG. 4B. The stray
capacitance Ch \ and C& are assumed to be zero for the purpose of simplification. In the simulation, the current, i, going through the second resistor 434 is measured and used with other parameters to calculate the capacitance values between pairs of electrodes,
For the purposes of non-limiting example, the CMOS switch resistance is taken to be R0n ~ 35-60 Ω; the excitation signal frequencies are/i = 1 MIIz51-Z2 = 2 MHz, ...,fn - N MHz; and the excitation signal amplitude is taken to be 15 V.
Further details for measuring the relevant capacitance values are presented below.
Measurement of Cn
During the first measurement, shown in FIG. 4, the first electrode 41 Ia is excited by a sinusoidal wave u\ with an amplitude of 15 V and a frequency of/j = 1 MHz. Based on the Kirchhoff s law, the following relationship can be established between the capacitance, Ci 2, the resistors, and the excitation signal: κ, = H + 37? ) (1 )
j - 2πfCn
Rearrangement yields:

where a
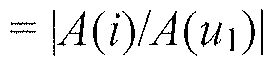 is the ratio of the current amplitude to the voltage amplitude and A(U1) = 15 V.
FIGS. 6 A and 6B are plots of the output current and signal magnitude, respectively, going through the second resistor 434. As shown in FIG. 6B, the peak amplitude of the output current, A(i), is calculated as 8.714 mA. In practice, the peak value of the current can be measured by using a demodulator circuit. With the value of the second resistor 434 set to i?on - 60 Ω, the capacitance Cj2 is 92 pF.
Measurement of Cu and C23
FIG. 7A is a schematic diagram of simultaneous measurement of capacitance between two different pairs of electrodes according to MECaP techniques. A first synthesizer 430 applies a first sinusoidal excitation signal u\ at a frequency of/i = 1 MHz to the first electrode 41 Ia. Simultaneously, a second synthesizer 440 applies a
second sinusoidal excitation signal «2 at a frequency of /2 = 2 MHz to the second electrode 41 1b via a resistor 442. The third electrode 41 Ic is used to collect the received signal.
Referring to the equivalent circuit shown in FIG. 5, the current going through the third electrode 411c can be measured by using the demodulator circuit referred to above. Thus, to determine the capacitance Cj3 and C23, relationships between the excitation signals, u\ and M2, and the output signal, /3, need to be established.
FIG. 7B is a diagram of a circuit 700 that can be used to establish a relationship among the excitation signals, u\ and M2, and the output signal, z' 3. When multiple voltage sources are present in a linear circuit (as is the case in the system of FIG. 7A), each of them can be analyzed independently by assuming the others to be held at zero potential. Thus, to analyze the effect of the input voltage M, on the circuit, excitation signal 1 12 is first considered to be zero. Derivation yields the following relationship between the port currents, /' 1 and Z2, and the input voltage, u\ \

where Z12 =
 ) and Z13 = l/(/&>C1? ) . Since the capacitances to be measured are in the picofarad to femtofarad range, the corresponding impedance of these capacitances may be much larger than that of the CMOS switch resistance R0n. For instance, for a capacitance of 100 pF, the impedance at 1 MHz is calculated as
 1,592 Ω » R0n = 60 Ω. The impedance
 may increase further if the capacitance decreases to the femtofarad level. Thus, the current flowing through the capacitances C]2 and C23 is neglected in Eq. (3). This simplification is applied to the following analysis.
The relationship between the output current, /3, and the first input voltage, u\, can be expressed as: αl 3 = Hn{j ω) h(Jω) 1
U1 (J ω) 2R0n + (R0n + Zn)[AR0n + Zn) I (IR0n + Zn) (4)
Similarly, the relationship between the output current, z' 3, and the second input voltage, m, can be expressed as:
1
Uf23— H23U ω) Wω)
u2 (j 'ώ) 2R0n +(R0n + Z23)(AR0n + Zn) / (2R0n + Zn)
(5)
Since the value of Ci2 is known from the first measurement, the values for capacitances Co and C23 can be found by substituting the values of |Hi3| and |H23| into Eqs, (4) and (5), respectively.
FIGS. 8A and 8B are plots of the output current and signal magnitude, respectively, going through the third resistor 436. The signal magnitude may be obtained by Fourier transforming the output current. As shown in FIG. 8B, there are two peaks in the output current: a first peak of 3.973 niA at 1 MFIz corresponding to C]3 and a second peak of 6.326 mA at 2 MHz corresponding to C23. These currents can be used to calculate the capacitance values as Ci3 =■ 92 pF and C23 = 75 pF. These are consistent with results obtained from measurement using a signal excitation.
Measurement of Cu, C24, and C34
The above described measurement may be continued by connecting electrodes 41 Ia, 41 Ib, and 41 1 c to three excitation sources (not shown)
simultaneously. The ratio of the output current to the input voltage, for each input signal, is then determined as above. Since the capacitance Ci 2, Ci 3, and C23 are all known in the first two measurements, the capacitance between each of the excited electrodes 41 la— 41 Ic and electrode 41 Id are the only unknown parameters in the above equations. They can be found by establishing the relationship between the three excitation voltages and the three filtered currents. For example, by considering that three AC voltages u\, M2, and m are used to excite electrodes 41 Ia, 41 Ib, and 411c, respectively, the relationship between u\ and the current going through electrode 41 Id can be established as:
1, 2R0 ^(2R0n + Zn)
-/3(2*on + Z13)
ix 2R0 +/4 (2/C + Z14)
i, +/, +u = 0 (6)
where Zj4 = l//coC14 is the impedance of C14. The equations can be solved in a similar fashion as described with respect to Eqs. (4) and (5) to derive an expression for the capacitance Ci4 as a function of the amplitude of Z4. Consequently, by measuring the amplitude of /4 at the frequency of u\ , the capacitance Ci4 can be determined. The same method can be applied to the determination of C24 and C34. As a result, a total of six capacitance values (Ci2, CB, C23, CI4, C24 and C34) are determined in three measurement steps within a scanning frame.
Measurement

FIG. 9 shows a circuit model 900 that can be used to determine relationships between currents and capacitances for N simultaneously applied excitation signals. If (iV-l)(N/2) capacitances have already been measured, then the capacitances, Cw, C2N,•■■ , C(H-I)N, niay be measured by applying N excitation signals {(wi/i) , (U2,fi), ... , (UN,/N) } are applied to the electrodes 41 l a-41 IN. The last electrode, e.g., electrode 41 1 (JV+1 ), may be used as the receiving electrode. By assuming that 112 =•= us ^ ... UN-I = 0, based on the Kirchhoff s law, the relationships between the excitation signal, w/, and the port currents, /'/, 12, ... , in, are given by the following JV> 1 equations:

where Z^ =1/ jωCik, (k, ~ 2, ... , N+ \ ) is the equivalent impedance between the first electrode (e.g., electrode 41 1 a) and the N+\ electrode (e.g., electrode 41 Id).
Equation (7) can be rewritten in the matrix form:
Ψ,•/ = «, ^
where the matrices are given as follows:

U1
U1
w, =
M1
0
Based on Cramer's rule, the ratio between the current,
 i, and the excitation signal voltage, u\, can be expressed as:

where the del[...J is the matrix determinant and (9/ is an (N+I) x (N+I) matrix formed by replacing the N+I column of Ψ\ by the column vector M1 / ' Ux :

The term det[Ψ{\ is a first-order linear function of impedance
Zi(Ni
 Thus, Eq. (9) can be expressed as:
|det[Θ, ]|
aC \ ( N + \ ) + βcUN ,l) + r (10)
a I (/V ι I )
where a, β, and γ are real constants calculated from the term, |det[ S^1]J. Given that the value of α^n) can be measured experimentally, the capacitance Ci(#Ti)Can be calculated by using the expression:
 As a result, for any M-electrode cylinder, by measurement N, there are N(N+\)/2 capacitance values that can be calculated by measuring the magnitude of output signal at each excitation frequency. As a result, for an M-electrode ECT sensor, the total number of capacitance values, M-{M-\)I2, can be measured in M-X measurements with MECaP techniques.
By using the measured capacitance values, C,Λ (/ = 1 , ... , N- 1 , j - 2, ..., N, iφj- ), the two-dimensional distribution of material permittivity ε (x, y) is given by:

where Φ(χ, y) is the potential distribution; E is the electric field; Q1, is the charge across capacitance C11 and can be calculated by using the Gauss integral law; and ΔV is the voltage of the excitation signal. Applying Eq. (12) makes it possible to calculate the spatial distribution of materials within a volume using ECT.
Table 3 lists the maximum scanning speeds for different measurement techniques and numbers of electrodes. The maximum scanning speeds using MECaP and traditional AC techniques are calculated using optimal time per measurement values. Results from the two methods are compared in four different cases, where the number of the electrodes, M, is assumed to be 8, 12, 16, or 44 (grouped into 4 sections).
As shown in Table 3, when the number of simultaneously excited electrodes N approaches the upper limit Nmdx = M-I , the maximum scanning speed achieved with MECaP techniques can be increased from about two to eight times that of traditional AC techniques (without grouping). For example, for a twelve-electrode sensor, the total number of measurements performed per frame is 12x 11/2 = 66. In comparison, a reduction to eleven measurements is possible using MECaP techniques when the number of simultaneously excited electrodes N is eleven. For grouped electrodes, MECaP techniques may achieve 2,000 frames per second, doubling the optimal speed reported elsewhere.
Table 3. Maximum Scanning Speed Achieved with Different ECT Techniques

Note: * : For grouped electrodes, N,MX— K-I
: The maximum scanning speeds for the traditional AC-method were calculated by referring to reported optimal time per measurement values.
In cases where Nmax < M-I, when the number of activated electrodes reaches the upper limit, Nmax, the remaining measurements continue with simultaneous excitation of Nmax electrodes until the end of the scanning frame. The expression of H in Table 2 is then modified as:
M(M -i)/ Nmax - (Nmax + i)-
H = N +
2 INi (13) where
 represents rounding the number X up to the nearest integer. When Nmax reaches the upper bound, Nmax = M- 1 , the right-hand side of Eq. (13) reduces to M- 1, which is consistent with the expression listed in Table 2. As an example, for Nmaχ - 2, the number of simultaneous excitations remains at two after completion of the second measurement, and the remaining capacitance values are measured using two simultaneous excitations. Therefore, for M= 12, the total number of measurements per frame is H= 2+(66-3)/2=34. The corresponding scanning speed is 1,941 frames/sec.
FIG. 10 is a plot of scanning speed versus the number of simultaneous excitations. The frequency bandwidth may limit the number of excitations that can be applied simultaneously to the electrodes. To illustrate the trend of scanning speed
increase as a function of the number of simultaneous excitations, these two parameters are plotted in FIG. 10, for the four types of sensor configurations (M = 8, 12, 16, and 44, with K = 4). FIG. 10 shows that significant increase in capacitance scanning speed can be achieved for the same sensor configurations when MECaP techniques are applied compared to traditional AC techniques.
Computation Time for MECaP
FIG. 1 1 is a plot of estimated scanning period (triangles) and estimated calculation time (circles) using MECaP techniques for different numbers of excitations N. Compared with the traditional ECT techniques, extra calculation steps may be needed to perform the calculations described above, which, in turn, may affect the application of MECaP techniques to monitoring the object in real time.
The calculations below are based on the assumption that each complex number calculation (accumulation/multiplication) can be finished in one computer cycle and that each cycle takes 0.5 ns (i.e., the processor speed is 2 GHz or more).
In cases where N electrodes are excited using AC signals, the calculation time may include three sub-calculations:
• Calculation of matrix determinants in Eqs. (8) and (9). Both Θ \ and Ψ\ are (N+ 1) x (N+ 1) matrices whose first columns include N+\ elements, whose iV*h columns include N elements, and whose other columns include two elements. Calculating each determinant requires one computer cycle per element, or (N -\ 1)N2N'! cycles, resulting a total number of cycles CTQet - (N+Ϊ)N2N
• Calculation of absolute values in Eq. (10). One accumulation and one
multiplication are needed for |det[<9 i]j. For the term |det[fi]j, the value is tripled for the three terms a, β, and γ, yielding five calculations total, or CΥCabs = 5.
• Calculation of second-order equation roots in Eq. (1 1). This may require nine computer cycles, or CYC ά^ = 9.
Since each excitation measurements measures N capacitors, the total number of cycles for each frame is:
CYC =∑ 4Φ + 1)2" + 5 + 8] (13)
Referring again to FIG. 1 1, when N < 8, the calculation time is shorter than the scanning period, which allows for data processing in real time. This corresponds to an achievable scanning speed of 9,400 frames/sec.
Further embodiments of the present inventive MECaP technique may use different or optimal numbers of simultaneous excitations depending on trade-offs between the maximum scanning speed and the minimum differentiable frequency bandwidth. Embodiments may also use coding methods for sensing channel differentiation. For example, embodiments may use signal processing methods for channel coding that complement the frequency band allocation to ensure reliable channel separation and differentiation among multiple electrodes. Coding can enhance the immunity of the circuitry to noise interference and consequently, improve the robustness of the measurement circuitry.
In addition, different embodiments may employ different spatial distributions of electrodes, When used to sense capacitance of cylindrical bodies, such as engines, the electrodes may be distributed along the radial and axial directions to maximize the signal-to-noise ratio in sensing. Further embodiments may include embedded electronics for simultaneous electrode scanning. For instance, microcontroller-based parallel excitation and measurement circuitry with embedded firmware may control the switching of sensing channels and interfacing with a computer or other processor.
Embodiments of the invention can take the form of an entirely hardware embodiment, an entirely software embodiment, or an embodiment containing both hardware and software elements. In a preferred embodiment, the invention is implemented in software, which includes but is not limited to firmware, resident software, microcode, etc.
Furthermore, embodiments of the invention can take the form of a computer program product accessible from a computer-usable or non-transitory computer- readable medium providing program code for use by or in connection with a computer or any instruction execution system. For the purposes of this description, a computer-usable or computer readable medium can be any apparatus that can
contain, store, communicate, propagate, or transport the program for use by or in connection with the instruction execution system, apparatus, or device.
The medium can be an electronic, magnetic, optical, electromagnetic, infrared, or semiconductor system (or apparatus or device) or a propagation medium. Examples of a computer-readable medium include a semiconductor or solid state memory, magnetic tape, a removable computer diskette, a random access memory (RAM), a read-only memory (ROM), a rigid magnetic disk and an optical disk. Current examples of optical disks include compact disk - read only memory (CD- ROM), compact disk - read/write (CD-R/W) and DVD.
A data processing system suitable for storing and/or executing program code will include at least one processor coupled directly or indirectly to memory elements through a system bus. The memory elements can include local memory employed during actual execution of the program code, bulk storage, and cache memories which provide temporary storage of at least some program code in order to reduce the number of times code must be retrieved from bulk storage during execution.
Input/output or I/O devices (including but not limited to keyboards, displays, pointing devices, etc.) can be coupled to the system either directly or through intervening I/O controllers.
Network adapters may also be coupled to the system to enable the data processing system to become coupled to other data processing systems or remote printers or storage devices through intervening private or public networks. Modems, cable modem and Ethernet cards are just a few of the currently available types of network adapters.
While this invention has been particularly shown and described with references to example embodiments thereof, it will be understood by those skilled in the art that various changes in form and details may be made therein without departing from the scope of the invention encompassed by the appended claims. For example, the multiple excitation polling techniques disclosed herein may be applied to other forms of tomography, such as tomography performed with acoustic, optical, radio-frequency, or other suitable signals.
Claims
CLAIMS What is claimed is:
1. An apparatus for electronic capacitance tomography, the apparatus
comprising:
source and receiver electrodes capacitively coupled together in an arrangement to measure a spatial distribution of a substance within capacitive distance of at least one pair of source and receiver electrodes; an excitation module coupled to the source electrodes, the excitation module configured to excite simultaneously each source electrode with a different excitation signal; and
a measurement module coupled to the receiver electrodes, the measurement module configured to measure simultaneously capacitance between pairs of source and receiver electrodes, the measured capacitances representing the spatial distribution of the substance. 2. The apparatus of claim 1 wherein the different excitation signals are at different frequencies.
3. The apparatus of claim 1 wherein the different excitation signals are
modulated with different codes.
4. The apparatus of claim 1 wherein each receiver electrode receives multiple excitation signals, and wherein each of the multiple excitation signals is applied simultaneously to more than one source electrode.
5. The apparatus of claim 4 wherein the measurement module is configured to simultaneously measure capacitances between each receiver electrode and every source electrode. 6. The apparatus of claim 1 further including:
a discrimination module coupled to the measurement module, the discrimination module being configured to discriminate among signals received simultaneously at a given receiver electrode from more than one source electrode. 7. The apparatus of claim 6 wherein the discrimination module includes a filter bank configured to filter excitation signals at different frequencies.
8. The apparatus of claim 6 wherein the discrimination module performs a decomposition of signals detected by the receiver electrodes to measure the capacitances. 9. The apparatus of claim 1 further including:
an imaging module coupled to the measurement module and configured to convert the measured capacitances to an indication of the spatial distribution of the substance.
10. The apparatus of claim 1 further including:
a storage module coupled to the measurement module and configured to store the measured capacitances.
11. The apparatus of claim 10 further including:
a postprocessing module coupled to the measurement module and configured to convert the stored, measured capacitances into indications of the spatial distribution of the substance.
12. A method of performing electronic capacitance tomography, the method comprising:
exciting each of multiple source electrodes simultaneously with a different excitation signal; and
measuring capacitance between a receiver electrode and each of the multiple source electrodes.
13. The method of claim 12, further including:
generating the different excitation signals, each different excitation signals being at a different frequency.
14. The method of claim 12, further including:
modulating the different excitation signals with different codes.
15. The method of claim 12, wherein measuring capacitance includes measuring more than one excitation signal at a time.
16. The method of claim 12, further including:
discriminating among signals received simultaneously at the receiver electrode from the multiple source electrodes.
17. The method of claim 12, further including:
decomposing signals detected by the receiver electrodes to measure the capacitance.
18. The method of claim 12, further including:
processing the measured capacitance values to derive a spatial distribution of a substance disposed between the at least one receiver electrode and the multiple source electrodes.
19. The method of claim 18, further including:
storing the measured capacitance. 20. A non-transitory computer readable medium including code for performing electronic capacitance tomography, the code to be executed by a computer operable to:
excite each of multiple source electrodes simultaneously with a different excitation signal; and
measure capacitance between a receiver electrode and each of the multiple source electrodes.
21. The computer readable medium of claim 20, wherein the code is further operable to:
generate the different excitation signals, each different excitation signals being at a different frequency. 22. The computer readable medium of claim 20, wherein the code is further operable to:
modulate the different excitation signals with different codes.
23. The computer readable medium of claim 20, wherein the code is further operable to:
measure more than one excitation signal at a time.
24. The computer readable medium of claim 20, wherein the code is further operable to:
discriminate among signals received simultaneously at the receiver electrode from the multiple source electrodes. 25. The computer readable medium of claim 20, wherein the code is further operable to:
decompose signals detected by the receiver electrodes to measure the capacitance.
I 1t6. The computer readable medium of claim 20, wherein the code is further operable to:
process the measured capacitance values to derive a spatial distribution of a substance disposed between the at least one receiver electrode and the multiple source electrodes.
27. The computer readable medium of claim 20, wherein the code is further operable to:
store the measured capacitance.
28. An apparatus for performing electronic capacitance tomography, the apparatus comprising:
means for transmitting multiple different excitation signals simultaneously; and
means for measuring capacitance based on the multiple different excitation signals.
Applications Claiming Priority (2)
| Application Number | Priority Date | Filing Date | Title |
|---|---|---|---|
| US22180609P | 2009-06-30 | 2009-06-30 | |
| US61/221,806 | 2009-06-30 |
Publications (1)
| Publication Number | Publication Date |
|---|---|
| WO2011002793A1 true WO2011002793A1 (en) | 2011-01-06 |
Family
ID=42697357
Family Applications (1)
| Application Number | Title | Priority Date | Filing Date |
|---|---|---|---|
| PCT/US2010/040446 Ceased WO2011002793A1 (en) | 2009-06-30 | 2010-06-29 | Multiple excitation capacitance polling for enhanced electronic capacitance tomography |
Country Status (2)
| Country | Link |
|---|---|
| US (1) | US8762084B2 (en) |
| WO (1) | WO2011002793A1 (en) |
Cited By (10)
| Publication number | Priority date | Publication date | Assignee | Title |
|---|---|---|---|---|
| CN103604843A (en) * | 2013-11-27 | 2014-02-26 | 华北电力大学 | Electrical capacitance tomography sensor used in submerged environment |
| WO2014030054A3 (en) * | 2012-08-21 | 2014-04-10 | Gonzalez Juan Valdes | Method and device for determining the electrical properties of materials |
| US20140365152A1 (en) * | 2013-05-30 | 2014-12-11 | Tech4Imaging Llc | Interactive and Adaptive Data Acquisition System for Use with Electrical Capacitance Volume Tomography |
| US9901282B2 (en) | 2015-04-27 | 2018-02-27 | Tech4Imaging Llc | Multi-phase flow decomposition using electrical capacitance volume tomography sensors |
| US9958408B2 (en) | 2016-05-11 | 2018-05-01 | Tech4Imaging Llc | Smart capacitance sensors for use with electrical capacitance volume tomography and capacitance sensing applications |
| US10281422B2 (en) | 2016-09-12 | 2019-05-07 | Tech4Imaging Llc | Displacement current phase tomography for imaging of lossy medium |
| US10359386B2 (en) | 2013-08-13 | 2019-07-23 | Tech4Imaging Llc | Modular stretchable and flexible capacitance sensors for use with electrical capacitance volume tomography and capacitance sensing applications |
| US10488236B2 (en) | 2016-02-23 | 2019-11-26 | Tech4Imaging Llc | Velocity vector field mapping using electrical capacitance sensors |
| US10502655B2 (en) | 2017-03-07 | 2019-12-10 | Tech4Imaging Llc | Magnetic pressure sensors system for measurement and imaging of steel mass |
| US10705043B2 (en) | 2017-05-31 | 2020-07-07 | Tech4Imaging Llc | Multi-dimensional approach to imaging, monitoring, or measuring systems and processes utilizing capacitance sensors |
Families Citing this family (48)
| Publication number | Priority date | Publication date | Assignee | Title |
|---|---|---|---|---|
| TWI447329B (en) | 2008-09-26 | 2014-08-01 | Univ Ohio State | Converting carbonaceous fuel into a carbon-free energy carrier |
| CN105762386A (en) | 2009-09-08 | 2016-07-13 | 俄亥俄州国家创新基金会 | Integration Of Reforming/water Splitting And Electrochemical Systems For Power Generation With Integrated Carbon Capture |
| CN102597173A (en) | 2009-09-08 | 2012-07-18 | 俄亥俄州立大学研究基金会 | Synthetic fuel and chemical production with in situ CO2 capture |
| US10010847B2 (en) | 2010-11-08 | 2018-07-03 | Ohio State Innovation Foundation | Circulating fluidized bed with moving bed downcomers and gas sealing between reactors |
| AU2012253328B2 (en) | 2011-05-11 | 2017-05-25 | Ohio State Innovation Foundation | Systems for converting fuel |
| WO2012155059A1 (en) | 2011-05-11 | 2012-11-15 | The Ohio State University | Oxygen carrying materials |
| CN102297884A (en) * | 2011-07-06 | 2011-12-28 | 北京工业大学 | Multi-array self-adaptive electrical capacitance tomography sensor apparatus |
| US9259168B2 (en) | 2011-10-04 | 2016-02-16 | The Ohio State University | Adaptive electrical capacitance volume tomography |
| US9881347B2 (en) * | 2011-12-30 | 2018-01-30 | Consumer 2.0, Inc. | Automated entry |
| CN102692433B (en) * | 2012-06-12 | 2015-05-20 | 中北大学 | Flexible combination type electric capacitance tomography data obtaining system for sensor electrode |
| US9170224B2 (en) | 2012-10-31 | 2015-10-27 | The University Of Connecticut | Multiple-excitation multiple-receiving (MEMR) capacitance tomography |
| EP2741087B1 (en) * | 2012-12-04 | 2019-10-02 | F. Hoffmann-La Roche AG | Method and system for fluid surface detection |
| WO2014118425A1 (en) * | 2013-02-01 | 2014-08-07 | Rocsole Ltd | Method and apparatus for determining the location of an interface of interest, and computer program |
| CA3148322A1 (en) | 2013-02-05 | 2014-08-14 | Ohio State Innovation Foundation | Methods for converting fuel into syngas |
| CN103149253B (en) * | 2013-03-01 | 2015-11-04 | 中原工学院 | Capacitance/image method and volume field imaging sensor |
| WO2014135741A1 (en) * | 2013-03-07 | 2014-09-12 | Rocsole Ltd | Method and apparatus for investigating permittivity in a target domain |
| WO2014152914A1 (en) | 2013-03-14 | 2014-09-25 | Ohio State Innovation Foundation | Systems and methods for converting carbonaceous fuels |
| FI125166B (en) * | 2013-04-08 | 2015-06-30 | Outotec Oyj | METHOD AND ARRANGEMENT FOR FEEDING NUTRIENT FROM THE NUTRIENT TANK TO THE OVEN Oven |
| US9964576B2 (en) * | 2013-10-09 | 2018-05-08 | Texas Instruments Incorporated | Capacitance detection circuit that detects minute changes in capacitance |
| US20150238915A1 (en) | 2014-02-27 | 2015-08-27 | Ohio State Innovation Foundation | Systems and methods for partial or complete oxidation of fuels |
| US10952927B2 (en) * | 2014-10-10 | 2021-03-23 | QuantaEd, LLC | Apparatus for monitoring the content of a container and method therefor |
| CN104569614B (en) * | 2015-01-14 | 2017-05-03 | 天津大学 | Differential type electrical capacitance tomography sensor and measurement method thereof |
| CN104677954A (en) * | 2015-01-27 | 2015-06-03 | 广西大学 | Multilayered sensor based on ECT direct three-dimensional imaging system |
| US10458940B1 (en) * | 2015-06-25 | 2019-10-29 | Atlas Sensors, LLC | Non-destructive instrument for detecting polymer inserts within polymer pipes fitted with a locator wire |
| GB201519363D0 (en) | 2015-11-02 | 2015-12-16 | Ind Tomography Systems Plc | Measurement apparatus |
| CN106996947A (en) * | 2016-01-24 | 2017-08-01 | 上海海洋大学 | A kind of irregular geometry shape capacitance tomography sensor and evaluation method |
| CA3020406A1 (en) | 2016-04-12 | 2017-10-19 | Ohio State Innovation Foundation | Chemical looping syngas production from carbonaceous fuels |
| CN110430855B (en) | 2017-02-22 | 2023-01-10 | 匡特艾德有限公司 | Modular medicine cabinet for improved regimen adherence |
| US11090624B2 (en) | 2017-07-31 | 2021-08-17 | Ohio State Innovation Foundation | Reactor system with unequal reactor assembly operating pressures |
| WO2019075102A1 (en) | 2017-10-10 | 2019-04-18 | QuantaEd, LLC | Smart packaging for improved medication regimen compliance |
| US10549236B2 (en) | 2018-01-29 | 2020-02-04 | Ohio State Innovation Foundation | Systems, methods and materials for NOx decomposition with metal oxide materials |
| US12228535B2 (en) | 2018-04-25 | 2025-02-18 | Spectrohm, Inc. | Methods for determining regional impedance characteristics of inhomogenous specimens using guided electromagnetic fields |
| US10542906B2 (en) | 2018-04-25 | 2020-01-28 | Spectrohm, Inc. | Tomographic systems and methods for determining characteristics of inhomogenous specimens using guided electromagnetic fields |
| CN110455877B (en) * | 2018-05-08 | 2021-06-01 | 中国科学院大连化学物理研究所 | A built-in electrode capacitance tomography sensor |
| US11300558B2 (en) * | 2018-06-14 | 2022-04-12 | Nokomis, Inc. | Apparatus and system for spectroscopy and tomography of fragile biologic materials |
| WO2020033500A1 (en) | 2018-08-09 | 2020-02-13 | Ohio State Innovation Foundation | Systems, methods and materials for hydrogen sulfide conversion |
| CN111175354B (en) * | 2018-11-13 | 2021-05-25 | 中国科学院大连化学物理研究所 | Capacitive tomography sensor and system |
| WO2020132099A1 (en) * | 2018-12-19 | 2020-06-25 | Spectrohm, Inc. | Methods for determining regional impedance characteristics of inhomogenous specimens using guided electromagnetic fields |
| WO2020150438A1 (en) | 2019-01-17 | 2020-07-23 | Ohio State Innovation Foundation | Systems, methods and materials for stable phase syngas generation |
| CN109900751B (en) * | 2019-02-27 | 2020-12-04 | 北京航空航天大学 | A portable capacitance tomography measuring device |
| US11453626B2 (en) | 2019-04-09 | 2022-09-27 | Ohio State Innovation Foundation | Alkene generation using metal sulfide particles |
| WO2021034888A1 (en) | 2019-08-19 | 2021-02-25 | Ohio State Innovation Foundation | Mesoporous support-immobilized metal oxide-based nanoparticles |
| WO2021046156A1 (en) | 2019-09-03 | 2021-03-11 | Ohio State Innovation Foundation | Redox reaction facilitated carbon dioxide capture from flue gas and conversion to carbon monoxide |
| CN110470706B (en) * | 2019-09-24 | 2024-02-20 | 青岛理工大学 | An ECT sensor for monitoring moisture transport inside concrete elements |
| CN111239210B (en) * | 2020-03-04 | 2022-03-25 | 东南大学 | Capacitance tomography complex flow type data set establishing method |
| WO2022006112A1 (en) | 2020-06-29 | 2022-01-06 | Ohio State Innovation Foundation | Systems and methods for high reactant conversion through multiple reactant flow ratio staging |
| CN115327223B (en) * | 2022-09-16 | 2025-07-04 | 太原理工大学 | ECT data acquisition device and data processing method |
| CN119914894B (en) * | 2025-04-07 | 2025-06-13 | 中国科学院电工研究所 | Flame detection system for multi-nozzle burner and detection method thereof |
Citations (2)
| Publication number | Priority date | Publication date | Assignee | Title |
|---|---|---|---|---|
| ZA200303451B (en) * | 2002-05-09 | 2003-11-06 | De Beers Cons Mines Ltd | Method and apparatus for electrical impedance tomography. |
| GB2454925A (en) * | 2007-11-26 | 2009-05-27 | Alistair Mcewan | Code Division Multiplexed Electrical Impedance Tomography |
Family Cites Families (2)
| Publication number | Priority date | Publication date | Assignee | Title |
|---|---|---|---|---|
| US7496450B2 (en) * | 2003-08-22 | 2009-02-24 | Instituto Mexicano Del Petroleo | Method for imaging multiphase flow using electrical capacitance tomography |
| US8264246B2 (en) * | 2010-01-05 | 2012-09-11 | General Electric Company | Electrical network representation of a distributed system |
-
2010
- 2010-06-29 WO PCT/US2010/040446 patent/WO2011002793A1/en not_active Ceased
- 2010-06-29 US US12/826,314 patent/US8762084B2/en not_active Expired - Fee Related
Patent Citations (2)
| Publication number | Priority date | Publication date | Assignee | Title |
|---|---|---|---|---|
| ZA200303451B (en) * | 2002-05-09 | 2003-11-06 | De Beers Cons Mines Ltd | Method and apparatus for electrical impedance tomography. |
| GB2454925A (en) * | 2007-11-26 | 2009-05-27 | Alistair Mcewan | Code Division Multiplexed Electrical Impedance Tomography |
Non-Patent Citations (5)
| Title |
|---|
| GAMIO J C ET AL: "A comparative analysis of single- and multiple-electrode excitation methods in electrical capacitance tomography; A comparative analysis of single- and multiple-electrode excitation methods in ECT", MEASUREMENT SCIENCE AND TECHNOLOGY, IOP, BRISTOL, GB LNKD- DOI:10.1088/0957-0233/13/12/301, vol. 13, no. 12, 1 December 2002 (2002-12-01), pages 1799 - 1809, XP020063651, ISSN: 0957-0233 * |
| HASEKIOGLU O ET AL: "MULTIPLE SIMULTANEOUS EXCITATION ELECTRICAL IMPEDANCE TOMOGRAPHY USING LOW CROSSCORRELATED SIGNALS", PROCEEDINGS OF THE INTERNATIONAL SOCIETY FOR OPTICAL ENGINEERING (SPIE), SPIE, USA LNKD- DOI:10.1117/12.131396, vol. 1818, no. PART 03, 18 November 1992 (1992-11-18), pages 1256 - 1263, XP008015681, ISSN: 0277-786X * |
| MCEWAN A ET AL: "Electrode Circuits for Frequency and Code-Division Multiplexed Impedance Tomography", BIOMEDICAL CIRCUITS AND SYSTEMS CONFERENCE, 2007. BIOCAS 2007. IEEE, IEEE, PISCATAWAY, NJ, USA, 27 November 2007 (2007-11-27), pages 130 - 133, XP031237049, ISBN: 978-1-4244-1524-3 * |
| MCEWAN ET AL: "Wide-bandwidth, high frame rate electrical impedance tomography / spectroscopy - A Code Division Multiplexing (CDM) approach", BIODEVICES 2008 - PROCEEDINGS OF THE 1ST INTERNATIONAL CONFERENCE ON BIOMEDICAL ELECTRONICS AND DEVICES; JANUARY 28-31, 2008; FUNCHAL, MADEIRA - PORTUGAL,, vol. 2, 28 January 2008 (2008-01-28), pages 196 - 203, XP001539338 * |
| YANG W Q: "Further developments in an ac-based capacitance tomography system", REVIEW OF SCIENTIFIC INSTRUMENTS, AIP, MELVILLE, NY, US LNKD- DOI:10.1063/1.1403012, vol. 72, no. 10, 1 October 2001 (2001-10-01), pages 3902 - 3907, XP012038851, ISSN: 0034-6748 * |
Cited By (17)
| Publication number | Priority date | Publication date | Assignee | Title |
|---|---|---|---|---|
| WO2014030054A3 (en) * | 2012-08-21 | 2014-04-10 | Gonzalez Juan Valdes | Method and device for determining the electrical properties of materials |
| US20140365152A1 (en) * | 2013-05-30 | 2014-12-11 | Tech4Imaging Llc | Interactive and Adaptive Data Acquisition System for Use with Electrical Capacitance Volume Tomography |
| US10269171B2 (en) * | 2013-05-30 | 2019-04-23 | Tech4Imaging Llc | Interactive and adaptive data acquisition system for use with electrical capacitance volume tomography |
| US10359386B2 (en) | 2013-08-13 | 2019-07-23 | Tech4Imaging Llc | Modular stretchable and flexible capacitance sensors for use with electrical capacitance volume tomography and capacitance sensing applications |
| CN103604843A (en) * | 2013-11-27 | 2014-02-26 | 华北电力大学 | Electrical capacitance tomography sensor used in submerged environment |
| US10512415B2 (en) | 2015-04-27 | 2019-12-24 | Tech4Imaging Llc | Multi-phase flow decomposition using electrical capacitance volume tomography sensors |
| US9901282B2 (en) | 2015-04-27 | 2018-02-27 | Tech4Imaging Llc | Multi-phase flow decomposition using electrical capacitance volume tomography sensors |
| US10244962B2 (en) | 2015-04-27 | 2019-04-02 | Tech4Imaging Llc | Multi-phase flow decomposition using electrical capacitance volume tomography sensors |
| US10806366B2 (en) | 2015-04-27 | 2020-10-20 | Tech4Imaging Llc | Multi-phase flow decomposition using electrical capacitance volume tomography sensors |
| US10488236B2 (en) | 2016-02-23 | 2019-11-26 | Tech4Imaging Llc | Velocity vector field mapping using electrical capacitance sensors |
| US9958408B2 (en) | 2016-05-11 | 2018-05-01 | Tech4Imaging Llc | Smart capacitance sensors for use with electrical capacitance volume tomography and capacitance sensing applications |
| US10551339B2 (en) | 2016-05-11 | 2020-02-04 | Tech4Imaging Llc | Smart capacitance sensors for use with electrical capacitance volume tomography and capacitance sensing applications |
| US10281422B2 (en) | 2016-09-12 | 2019-05-07 | Tech4Imaging Llc | Displacement current phase tomography for imaging of lossy medium |
| US11092564B2 (en) | 2016-09-12 | 2021-08-17 | Tech4Imaging Llc | Displacement current phase tomography for imaging of lossy medium |
| US10502655B2 (en) | 2017-03-07 | 2019-12-10 | Tech4Imaging Llc | Magnetic pressure sensors system for measurement and imaging of steel mass |
| US10705043B2 (en) | 2017-05-31 | 2020-07-07 | Tech4Imaging Llc | Multi-dimensional approach to imaging, monitoring, or measuring systems and processes utilizing capacitance sensors |
| US10746685B2 (en) | 2017-05-31 | 2020-08-18 | Tech4Imaging Llc | Multi-dimensional approach to imaging, monitoring, or measuring systems and processes utilizing capacitance sensors |
Also Published As
| Publication number | Publication date |
|---|---|
| US8762084B2 (en) | 2014-06-24 |
| US20100332170A1 (en) | 2010-12-30 |
Similar Documents
| Publication | Publication Date | Title |
|---|---|---|
| US8762084B2 (en) | Multiple excitation capacitance polling for enhanced electronic capacitance tomography | |
| Ye et al. | Image reconstruction for electrical capacitance tomography based on sparse representation | |
| CN103926276B (en) | A kind of online oil liquid abrasive grain monitoring device and detection method | |
| US9897529B2 (en) | Test system and test method for a simulation experiment of gas hydrate in a porous medium | |
| CN101241094B (en) | Non-contact type electric impedance sensor and image rebuilding method based on the sensor | |
| Zhang et al. | Simultaneous reconstruction of permittivity and conductivity using multi-frequency admittance measurement in electrical capacitance tomography | |
| Marashdeh et al. | A multimodal tomography system based on ECT sensors | |
| US10746685B2 (en) | Multi-dimensional approach to imaging, monitoring, or measuring systems and processes utilizing capacitance sensors | |
| US9791396B2 (en) | Space adaptive reconstruction technique for adaptive electrical capacitance volume tomography | |
| US20160091448A1 (en) | Apparatus and method for measuring electromagnetic properties | |
| GB2214640A (en) | System for tomographically imaging fluent material distribution | |
| CN109690260A (en) | Displacement Current Phase Tomography for Lossy Media Imaging | |
| Soleimani | Computational aspects of low frequency electrical and electromagnetic tomography: A review study | |
| CN100401044C (en) | Dual-mode electrical imaging system sensor and image reconstruction method based on the sensor | |
| Ghasemi-Varnamkhasti et al. | Development of two dielectric sensors coupled with computational techniques for detecting milk adulteration | |
| Ye et al. | Resolution analysis using fully 3D electrical capacitive tomography | |
| Gamio | A comparative analysis of single-and multiple-electrode excitation methods in electrical capacitance tomography | |
| US20170219509A1 (en) | Determining Electrophysiological Electrode Quality | |
| Fan et al. | Enhancement of measurement efficiency for electrical capacitance tomography | |
| CN111337547B (en) | Complex multi-frequency real-time capacitance tomography method based on multiple measurement vectors | |
| Dong et al. | Image reconstruction method for electrical capacitance tomography based on the combined series and parallel normalization model | |
| Liang et al. | Influence of the internal wall thickness of electrical capacitance tomography sensors on image quality | |
| Wang et al. | An ECT/ERT dual-modality sensor for oil-water two-phase flow measurement | |
| Ye et al. | Low-rank matrix recovery for electrical capacitance tomography | |
| Frias et al. | Dual-modality four-wire electrical capacitance and resistance tomography |
Legal Events
| Date | Code | Title | Description |
|---|---|---|---|
| 121 | Ep: the epo has been informed by wipo that ep was designated in this application |
Ref document number: 10731671 Country of ref document: EP Kind code of ref document: A1 |
|
| NENP | Non-entry into the national phase |
Ref country code: DE |
|
| 122 | Ep: pct application non-entry in european phase |
Ref document number: 10731671 Country of ref document: EP Kind code of ref document: A1 |