WO2010126514A1 - An analysis system including a pre-selected combination of cromophore precursors or chromophores - Google Patents
An analysis system including a pre-selected combination of cromophore precursors or chromophores Download PDFInfo
- Publication number
- WO2010126514A1 WO2010126514A1 PCT/US2009/042272 US2009042272W WO2010126514A1 WO 2010126514 A1 WO2010126514 A1 WO 2010126514A1 US 2009042272 W US2009042272 W US 2009042272W WO 2010126514 A1 WO2010126514 A1 WO 2010126514A1
- Authority
- WO
- WIPO (PCT)
- Prior art keywords
- chromophore
- analyzer
- chromophores
- test device
- wavelength
- Prior art date
- Legal status (The legal status is an assumption and is not a legal conclusion. Google has not performed a legal analysis and makes no representation as to the accuracy of the status listed.)
- Ceased
Links
Classifications
-
- G—PHYSICS
- G01—MEASURING; TESTING
- G01N—INVESTIGATING OR ANALYSING MATERIALS BY DETERMINING THEIR CHEMICAL OR PHYSICAL PROPERTIES
- G01N21/00—Investigating or analysing materials by the use of optical means, i.e. using sub-millimetre waves, infrared, visible or ultraviolet light
- G01N21/17—Systems in which incident light is modified in accordance with the properties of the material investigated
- G01N21/25—Colour; Spectral properties, i.e. comparison of effect of material on the light at two or more different wavelengths or wavelength bands
- G01N21/255—Details, e.g. use of specially adapted sources, lighting or optical systems
-
- G—PHYSICS
- G01—MEASURING; TESTING
- G01N—INVESTIGATING OR ANALYSING MATERIALS BY DETERMINING THEIR CHEMICAL OR PHYSICAL PROPERTIES
- G01N21/00—Investigating or analysing materials by the use of optical means, i.e. using sub-millimetre waves, infrared, visible or ultraviolet light
- G01N21/84—Systems specially adapted for particular applications
- G01N21/8483—Investigating reagent band
-
- G—PHYSICS
- G01—MEASURING; TESTING
- G01N—INVESTIGATING OR ANALYSING MATERIALS BY DETERMINING THEIR CHEMICAL OR PHYSICAL PROPERTIES
- G01N33/00—Investigating or analysing materials by specific methods not covered by groups G01N1/00 - G01N31/00
- G01N33/48—Biological material, e.g. blood, urine; Haemocytometers
- G01N33/50—Chemical analysis of biological material, e.g. blood, urine; Testing involving biospecific ligand binding methods; Immunological testing
- G01N33/52—Use of compounds or compositions for colorimetric, spectrophotometric or fluorometric investigation, e.g. use of reagent paper and including single- and multilayer analytical elements
-
- G—PHYSICS
- G01—MEASURING; TESTING
- G01N—INVESTIGATING OR ANALYSING MATERIALS BY DETERMINING THEIR CHEMICAL OR PHYSICAL PROPERTIES
- G01N33/00—Investigating or analysing materials by specific methods not covered by groups G01N1/00 - G01N31/00
- G01N33/48—Biological material, e.g. blood, urine; Haemocytometers
- G01N33/50—Chemical analysis of biological material, e.g. blood, urine; Testing involving biospecific ligand binding methods; Immunological testing
- G01N33/53—Immunoassay; Biospecific binding assay; Materials therefor
- G01N33/5302—Apparatus specially adapted for immunological test procedures
-
- G—PHYSICS
- G01—MEASURING; TESTING
- G01N—INVESTIGATING OR ANALYSING MATERIALS BY DETERMINING THEIR CHEMICAL OR PHYSICAL PROPERTIES
- G01N21/00—Investigating or analysing materials by the use of optical means, i.e. using sub-millimetre waves, infrared, visible or ultraviolet light
- G01N21/17—Systems in which incident light is modified in accordance with the properties of the material investigated
- G01N21/25—Colour; Spectral properties, i.e. comparison of effect of material on the light at two or more different wavelengths or wavelength bands
- G01N21/31—Investigating relative effect of material at wavelengths characteristic of specific elements or molecules, e.g. atomic absorption spectrometry
- G01N21/314—Investigating relative effect of material at wavelengths characteristic of specific elements or molecules, e.g. atomic absorption spectrometry with comparison of measurements at specific and non-specific wavelengths
- G01N2021/317—Special constructive features
- G01N2021/3177—Use of spatially separated filters in simultaneous way
-
- G—PHYSICS
- G01—MEASURING; TESTING
- G01N—INVESTIGATING OR ANALYSING MATERIALS BY DETERMINING THEIR CHEMICAL OR PHYSICAL PROPERTIES
- G01N21/00—Investigating or analysing materials by the use of optical means, i.e. using sub-millimetre waves, infrared, visible or ultraviolet light
- G01N21/62—Systems in which the material investigated is excited whereby it emits light or causes a change in wavelength of the incident light
- G01N21/63—Systems in which the material investigated is excited whereby it emits light or causes a change in wavelength of the incident light optically excited
- G01N21/64—Fluorescence; Phosphorescence
- G01N2021/6417—Spectrofluorimetric devices
- G01N2021/6421—Measuring at two or more wavelengths
Definitions
- the present disclosure relates generally to an analysis system including a pre-selected combination of chromophore precursors or chromophores.
- Color detection and measurement is used in a large number of chemical and/or biological analysis methods.
- the color or contrast may be generated, for example, via reflectance, transmittance, fluorescence, or phosphorescence.
- Fig. 1 is a flow diagram of an embodiment of a method for enhancing sensing
- Fig. 2 is a cross-sectional side view of an embodiment of a parallel analysis system
- Fig. 3 is a semi-schematic bottom view of an embodiment of a monolithic analyzer used in an embodiment of the analysis system;
- Fig. 4A is a schematic top view of an embodiment of a test device, in the form of a test strip, used in an embodiment of the analysis system
- Fig. 4B is a schematic top view of another embodiment of the test device, in the form of another test strip, used in an embodiment of the analysis system;
- Fig. 5 is a semi-schematic top view of still another embodiment of the test device, in the form of a rotatable coupon, used in an embodiment of the analysis system;
- Fig. 6 is a semi-schematic top view of yet another embodiment of the test device, in the form of a substrate having wells formed therein, used in an embodiment of the analysis system;
- Fig. 7 is a graph illustrating the filter response of each of 16 filters of an analyzer
- Fig. 8 is a graph illustrating the absorbance of chromophores tested for a window ("Series 1 ") of the analyzer having a peak response at about 400 nm;
- Fig. 9 is a graph illustrating peak response of the Series 2 window at about 415 nm
- Fig. 10 is a graph illustrating the absorbance of chromophores tested for a window ("Series 3") of the analyzer having a peak response at about 433 nm;
- Fig. 11 is a graph illustrating the absorbance of chromophores tested for a window ("Series 4") of the analyzer having a peak response at about 452 nm;
- Fig. 12 is a graph illustrating the absorbance of chromophores tested for a window ("Series 5") of the analyzer having a peak response at about 472 nm;
- Fig. 13 is a graph illustrating the absorbance of chromophores tested for a window ("Series 6") of the analyzer having a peak response at about 493 nm;
- Fig. 14 is a graph illustrating the absorbance of chromophores tested for a window ("Series 7") of the analyzer having a peak response at about 513 nm;
- Fig. 15 is a graph illustrating the absorbance of chromophores tested for a window ("Series 8") of the analyzer having a peak response at about 534 nm;
- Fig. 16 is a graph illustrating the absorbance of chromophores tested for a window ("Series 9") of the analyzer having a peak response at about 553 nm;
- Fig. 17 is a graph illustrating the absorbance of chromophores tested for a window ("Series 10") of the analyzer having a peak response at about 575 nm;
- Fig. 18 is a graph illustrating the absorbance of chromophores tested for a window ("Series 11 ”) of the analyzer having a peak response at about 596 nm;
- Fig. 19 is a graph illustrating the absorbance of chromophores tested for a window ("Series 12") of the analyzer having a peak response at about 616 nm;
- Fig. 20 is a graph illustrating the absorbance of chromophores tested for a window ("Series 13") of the analyzer having a peak response at about 636 nm;
- Fig. 21 is a graph illustrating the absorbance of chromophores tested for a window ("Series 14") of the analyzer having a peak response at about 656 nm;
- Fig. 22 is a graph illustrating the absorbance of chromophores tested for a window ("Series 15") of the analyzer having a peak response at about 677 nm;
- Fig. 23 is a graph illustrating the absorbance of chromophores tested for a window ("Series 16") of the analyzer having a peak response at about 697 nm;
- Fig. 24 is a graph illustrating the absorbance of each chromophore in one example of a chromophore set selected for the analyzer used to generate Fig. 7, the graph being superimposed on the filter response graph of Fig. 7;
- Fig. 25 is a graph illustrating the absorbance of each chromophore in another example of a chromophore set selected for the analyzer used to generate Fig. 7, the graph being superimposed on the filter response graph of Fig. 7.
- Embodiments of the analysis system disclosed herein include an analyzer and a test device.
- Test formats of the test device advantageously include a chromophore (or precursor thereof) set that is specifically matched to the various windows of the analysis system. More particularly, the waveband reflected, emitted or absorbed by each of the chromophores of the test device are detectable by a corresponding one of the windows, which is configured to detected such waveband reflectance, emission, or absorbance. As such, the reflection/em ission/absorbance fingerprint of the precursors/chromophores in the set matches the response fingerprint of the windows of the analyzer used. Furthermore, the various test formats enable multiple chemistries to occur within the test device simultaneously. The system disclosed herein may advantageously be used for parallel detection of multiple different analytes simultaneously.
- the mixture may be read with accuracy, where every analyte corresponds to a different chromophore that is part of, or is produced by a precursor in, the set.
- the color output may be the result of the chromophore color itself (e.g., when the presence of a corresponding analyte simply moves the chromophore to a detection area), or of the development of color due to chromophore production from a chromophore precursor. In either instance, the analysis system measures color. The amount of color is correlated to the qualitative and quantitative measure of the chromophore.
- the system disclosed herein advantageously enables such measurements using chromophores with non- overlapping absorbance, reflectance, or emission. Furthermore, the ability to perform multiple analyses simultaneously, and in some instances for the same analyte, using the matched precursor/chromophore sets disclosed herein allows for noise reduction and increased accuracy compared to other systems in which single wavebands are used for analysis.
- the method includes selecting a set of chromophore precursors or chromophores such that i) each chromophore precursor in the set generates, upon interacting with an analyte, a respective chromophore which absorbs, emits, or reflects a wavelength that matches a wavelength or is within a waveband detectable by one of a plurality of separate windows of an analyzer, or ii) each chromophore in the set, upon interacting with an analyte, absorbs, emits, or reflects a wavelength that matches a wavelength or is within a waveband detectable by one of a plurality of separate windows of an analyzer, as shown at reference numeral 100.
- the method further includes incorporating the set into a test device, as shown at reference numeral 102.
- waveband or “band” or “spectrum of wavelengths” refer to light frequencies, emissions, reflectance, and/or absorption corresponding with a range of wavelengths.
- the waveband of a particular response window of an analyzer includes those wavelengths that are readable via that window due to high response to those wavelengths, and the waveband of a chromophore includes the wavelengths emitted, reflected, or absorbed via the chromophore.
- the referenced waveband includes the stated wavelength (e.g., a peak absorption wavelength
- wavelength generally refers to the stated value.
- chromophores or chromophore precursors will depend, at least in part, on the analytes of interest to be tested and the wavebands detectable via the corresponding analyzer.
- Non-limiting examples of the chromophores that may be selected are shown in Table 1 with their corresponding emission and excitation wavelengths. The materials listed below are commercially available from Invitrogen, located in Eugene, OR.
- any precursors of the previously listed dyes may also be selected for the set that is incorporated into the test device.
- Table 2 illustrates some non-limiting examples of chromophore precursors that are suitable. This table also shows the corresponding analyte, the precursor/analyte interaction, the chromophore that forms as a result of the interaction, and the detection frequency.
- Table 3 illustrates further examples of suitable chromophore precursors that may be selected for the set disclosed herein. These particular chromophore precursors are used with the listed enzyme reactions to generate the desirable wavelength. This Table also illustrates the target diseases that may be simultaneously screened for using such enzymes and precursors.
- Tables 4 and 5 illustrate example chromophore sets that may be selected for an analyzer having windows with a response at either the emission or excitation wavelength.
- the chromophore set of Table 4 is believed to be a good fit for an analyzer with corresponding response windows
- the chromophore set of Table 5 is believed to be the best fit (at least of the chromophores listed in Table 1 ) for an analyzer with corresponding response windows.
- the selected precursors/chromophores may be used to test for a variety of target diseases simultaneously, either in a lateral flow assay, or combined with an antibody incorporated in a flow assay. Any combination of the previously mentioned chromophore precursors or chromophores may be selected for use in the test device to match the gated wavelengths of the detector windows. In one embodiment, it is desirable that each chromophore precursor or chromophore ultimately generates a signal in a different waveband than any of the other chromophore precursors or chromophores in the set.
- chromophores include 5-bromo-4-chloro-3-indoxyl phosphate, disodium salt; 4-nitrophenyl phosphate, disodium salt; 4-methylumbelliferyl phosphate, disodium salt; fluorescein diphosphate, tetraammonium salt; 3-amino-9-ethylcarbazole; 4-chloro-1 -naphthol; dihydrorhodamine 123; 5-(and-6)-carboxy-2',7'-dichlorodihydrofluorescein diacetate; dihydrorhodamine 6G; 2',7'-dichlorodihydrofluorescein diacetate; Dihydrocalcein; Luminol (C 8 H 7 N 3 O 2 ); benzidine dyes (such as 3,3'- diaminobenzidine tetrahydrochloride or 3,3 ⁇ 5,5'-tetramethylbenzidine dihydrochloride); 3-(4-hydroxyphenyl
- the chromophore precursors or chromophores are selected to match the detection wavebands of an associated analyzer. Any monolithic analyzer that is capable of detecting a plurality of wavebands may be utilized with the test devices and precursor/chromophore sets.
- the system 10 is a color detector which includes a light source 12 configured to generate light within a spectrum or band of wavelengths.
- a filter 16 is a component of the analyzer 20, and is in optical communication with the light source 12 via the test device 18.
- the filter 16 enables light of predetermined wavelengths to pass through to a photodetector (or other suitable sensor) 14 that is in optical communication therewith.
- the photodetector 14 is configured to output a color signal if light passes through the filter 16.
- the strength (i.e., magnitude) of the color signal indicates the amount of light within the waveband that is present.
- the magnitude of the color signal may depend, at least in part, upon the transmission characteristics of the filter 16, which may change based on the waveband.
- the filter 16 and photodetector 14 are used in an array with at least one other filter 16 and corresponding photodetector 14 (see, e.g., Fig. 3). Each filter 16 and photodetector 14 combination forms one window 22 of the analyzer 20. Each filter 16 in the array is tuned to allow light of different colors (i.e., wavelengths of a particular waveband) to pass. Because each filter 16 is tuned to allow a different color to pass, the transmission characteristics of each filter 16 in the array may be different. The sensitivity of each photodetector 14 and the amount of light emitted by the light source 20 may also vary according to color.
- each color signal generated, for a given input light signal, by each of the photodetectors 14 may have a different magnitude and/or signal-to- noise ratio. This may be corrected by adjusting the area of each of the photodetectors 14 and their corresponding filters 16. More specifically, the photodetectors 14 may have an area configured to equalize the color signal and optimize a signal-to-noise ratio of the color signal. In one embodiment, the signal- to-noise ratio may be optimized for photodetectors 14 by optimizing the signal for a reference color, which may be, for example, a neutral or white color.
- the area of the photodetector 14 may be based on a response curve of the photodetector 14 as a function of wavelength, a response curve of the filter 16 as a function of wavelength, and a wavelength of the light generated by the light source 12, among other factors.
- the light source 12 is positioned to project light onto at least a detection area (shown as reference numeral 36 in Figs. 4A, 4B, 5 and 6) the test device 18.
- a detection area shown as reference numeral 36 in Figs. 4A, 4B, 5 and 6
- suitable test devices 18 are discussed further in reference to Figs. 4A, 4B, 5 and 6 (where such devices 18 are labeled 18', 18", 18'", 18"" respectively).
- the light source 12 may be configured to generate light within a spectrum of wavelengths. In one embodiment, the light source 12 generates "white" light or any other color light.
- One example of a light source 12 is a light emitting diode. It is to be understood that other light sources may be utilized.
- the light projected onto the test device I8 is reflected or absorbed by the chromophore (either present on/in the test device 18 or formed during the analysis), or excites the chromophore to emit another wavelength. In other instances, a particular waveband is reflected or absorbed.
- the reflection, absorption, or emission signal is detectable by at least one of the photodetectors 14. It is to be understood that when in use, the analyzer 20 is positioned with respect to the incident light such that it is operational in the fluorescence mode, reflectance mode, transmittance mode, or absorption mode.
- Each photodetector 14 may be selected from a photodiode, phototransistor, avalanche photodiode, or any other photodetector 14.
- the magnitude of the output of the photodetector 14 is proportional to the amount of light that reaches the photodetector 14, and thus is proportional to the amount of light reaching the corresponding filter 16 (i.e., the color to which the filter 16 is tuned).
- Each filter 16 may be a Fabry-Perot etalon or interferometer, or any other suitable filter 16. As previously mentioned, each filter 16 is tuned to allow light within a specific waveband to pass through to the corresponding photodetector 14. Once received by the photodetector 14, a photovoltaic or gated electrical signal in the form of current or voltage is generated.
- the wavebands of the respective filters 16 do not overlap. In other embodiments, the wavebands of the respective filters 16 may at least partially overlap. Generally, each filter 16 is designed or selected to allow a peak or dominant transmission in a specific region.
- the system 10 also includes multiple corresponding photodetectors 14 - at least one for each filter 16.
- the system 10 may include seven filters 16 and seven photodetectors 14.
- each filter 16 may be tuned to allow different colors to pass through to the corresponding photodetector 14.
- the filters 16 may be configured to detect wavelength spectrums corresponding to "red,” “orange,” “yellow,” “green,” “blue,” “indigo,” and “violet.” It is to be understood that the test device 18 will include chromophore precursors and chromophores that correspond with these wavelength spectrums.
- the filter 16 having wavelengths corresponding to the "red” spectrum, and will be blocked by the other filters 16.
- the photodetector 14 corresponding to the "red” filter 16 will output an electrical signal proportional to the amount of light in the "red” spectrum. Since the test device 18 and analyzer 20 are configured to analyze multiple chemistries simultaneously, while the "red" spectrum is detected via one photodetector 14, if the sample also contains analytes within the "green” spectrum, this light will pass through another of the filters 16 having wavelengths corresponding to the "green” spectrum. Using more filters 16 and corresponding photodetectors 14 allows the system 10 to distinguish between varying hues of color. The corresponding chromophore precursor/chromophore set enhances the parallel analysis.
- additional filters 16 and corresponding photodetectors 14 enables the system 10 to distinguish between “baby blue,” “sky blue,” and “navy blue,” as opposed to just recognizing the color as being in the “blue” spectrum.
- a light blocking layer (not shown) which defines an opening over each filter 16. This may be desirable to reduce the reflection of light from one filter 16 so that such reflected light does not interfere with other photodetectors 14.
- a bottom view of the analyzer 20 is depicted.
- This embodiment includes nineteen filters 16 and corresponding photodetectors 14. It is to be understood, however, that color analyzer 20 may include more or less filters 16 and corresponding photodetectors 14 as is desired for a particular end use.
- the filters 16 and photodetectors 14 may be predisposed on an integrated circuit, and one or more of the filters 16 and photodetectors 14 on the integrated circuit may not be used in certain circumstances.
- the integrated circuit may include nineteen filters 16 and corresponding photodetectors 14, but is configured to detect sixteen colors, thus only using sixteen filters 16 and corresponding photodetectors 14.
- a first photodetector 28 is in optical communication with the first filter 26 and is configured to output a first color signal if light passes through the first filter 26.
- the first filter 26 will generally let a first color of light through to the first photodetector 28.
- the first color signal indicates the amount of the first color of light that has been received, indicating the presence of the chromophore associated with the first color of light in a sample.
- the first photodetector 28 has an area that is configured to equalize the first color signal in relation to other color signals of others filters 14 in order to optimize the signal-to- noise ratio of the first color signal. Therefore, the size of each photodetector 14 may be changed to accommodate for the different light transmission characteristics of each associated filter 16. Specifically, filters 16 having low light transmission may be disposed on photodetectors 14 having a larger area. With the larger area, the photodetector 14 may receive more of the color, even though the transmission of the color through the filter 16 is low. Similarly, filters 16 having high light transmission may be disposed on photodetectors 14 having a smaller area. The combination of larger and smaller areas of the photodetectors 14 based on the light transmission through the filter 16 equalizes the color output signals of the photodetectors 14.
- the analyzer 20 includes a second filter 30, which is configured to pass light within a second predetermined spectrum of wavelengths.
- each filter 16 is specifically designed to be unique in its total wavelength band response.
- a given filter 16 may have one or more dominant transmission peaks, but the total transmission characteristic will be different from one filter 16 to another.
- each dominant peak will cover a different waveband than any other filter 16.
- filters 16 are used that have multiple peak responses, then the response of the two filters 16 that have overlap will differ to some degree in their response in the overlapping region. This ensures that the net wavelength band transmission characteristic is different from one filter 16 to the next.
- a second photodetector 32 is in optical communication with the second filter 30 and may be configured to output a second color signal if light passes through the second filter 30.
- the second photodetector 32 has an area configured to equalize the second color signal and maximize a signal- to-noise ratio of the second color signal.
- any analyzer 20 that is capable of diffraction grating may be used.
- suitable analysis systems include AfinionTM AS100 Analyzer, Alfa-Scan Multi-Functional Reader, COULTER ® A C TTM Series, CardioChek ® Analyzer, and RAMP ® 200 Clinical System.
- Portable and/or stationary analyzers 20 may be utilized.
- a suitable analyzer 20 is a linear variable filter (i.e., a non-Fabry-Perot thin film approach), which is described in U.S. Patent Application Serial No. 11/801 ,830, filed May 11 , 2007 (corresponding to PCT/US2008/063014, filed May 8, 2008), the contents of which are incorporated herein by reference.
- any test device 18 e.g., test strips, coupons, cassettes (which house the various precursors/chromophores and a detection strip), a set of test strips on a coupon having a lateral flow matrix for directing samples thereon, substrates having wells formed therein, cuvettes, etc.
- test devices 18 e.g., test strips, coupons, cassettes (which house the various precursors/chromophores and a detection strip), a set of test strips on a coupon having a lateral flow matrix for directing samples thereon, substrates having wells formed therein, cuvettes, etc.
- the test device 18 used depends, at least in part, upon the analyzer 20 that is selected. For example, some analyzers 20 are specifically designed for receiving and reading a test strip or a coupon.
- Each embodiment of the test device 18 includes test formats including the pre-selected chromophore precursors or chromophores and associated test reagents (such as, for example, enzymes, antibodies, reducing or oxidizing agents, and pH buffers).
- the precursors and/or chromophores may be deposited into or on respective locations of the test device 18, or may all be present on or in the same location of the test device 18.
- Non-limiting examples of such test devices 18', 18", 18'", 18"" are shown and described in Figs. 4A, 4B, 5, and 6.
- Test strips, coupons, and cassettes are often lateral flow devices. Lateral flow devices work to move a liquid sample, or its extract containing an analyte of interest, along a strip of material (e.g., a polymer) or through one or more channels.
- the device often includes various zones or chambers, at least one of which includes the pre-selected chromophore precursors or chromophores that exert more or less specific interactions with the analyte(s).
- the pre-selected chromophore precursors or chromophores may be dried on the strip or within a reaction chamber. The flowing sample interacts with the pre-selected chromophore precursors or chromophores, and such interactions will continue as the sample continues to flow.
- test strip, coupon, or cassette to which the interacted flowing sample is directed is under the sensor/detector 14 when the strip/chip/coupon/cassette is inserted in or adjacent to the analyzer 20.
- the test device 18 is first inserted into the analyzer 20, and then the sample fluid is introduced.
- Figs. 4A and 4B illustrate two embodiments of the test device 18', 18". These devices 18', 18"are test strips.
- the test strip includes a sample introduction location 38 (e.g., a sample pad), a reagent location 34, and a detection location 36 (also referred to herein as a readable location).
- the test strip 18', 18" also includes an absorbent pad 58. This pad 58 maintains the flow as it wicks the liquid to the end of the strip 18', 18".
- the selected chromophore precursors or chromophores are all deposited onto the test strip material at the reagent location 34.
- the deposition of the precursors/chromophores may be accomplished via any number of printing methods (such as, for example, drop-on-demand printing techniques), auto- micropipetting, or via any suitable manual deposition technique.
- Such precursors or chromophores are generally dried onto the strip 18', 18" at the reagent location 36.
- capillary force causes mixing of the sample with the chromophore precursors or chromophores, and transports this mixture to the detection location 36.
- the interaction i) between the chromophore precursor and a corresponding analyte (which generates a chromophore) or ii) between the chromophore and a corresponding analyte generates a readable signal.
- the interaction may result in a pH change, an oxidation reaction, a reduction reaction, binding of the chromophore with the analyte, complexing the chromophore to the analyte, and/or movement of the chromophore to the detection location.
- those precursors/chromophores that interact with analytes in the sample are then moved with the flowing sample to the detection location 36.
- the chromophore either generated from the precursor or initially present
- the signal may be indicative of light reflection, light emission, or light absorption.
- each window 22 of the analyzer 20 is aligned with the detection location 36 (i.e., is in a position to receive the light from the detection location 36), and the previously described filters 16 enable or prevent certain wavelengths from reaching the respective photodetectors 14.
- those precursors/chromophores that do not interact with one or more of the analytes in the sample may remain in the reagent location 34 and thus are not detected, or may not produce a signal corresponding to response of the sensor 14 and thus are not detected.
- the precursors/chromophores are each deposited as separate dots 40 on the test device 18".
- Each dot 40 contains a different precursor or chromophore that is capable of interacting with a different analyte.
- the sample flows laterally across the test strip, and each dot 40 functions as a detection location 36. Any interaction between an analyte and a precursor or chromophore occurs at the dot 40.
- each window 22 may be specifically aligned with the dot 40 containing a corresponding precursor or chromophore, or each window 22 may be opposed from the entire device 18" and the filters 16 separate the various signals. It is to be further understood that when there is no interaction at a particular dot 40, the corresponding window 22 will not detect anything because the signals within the suitable waveband will not be generated.
- test device 18' is a rotatable coupon including a plurality of tracks 42 for performing multiple analyses.
- the same analysis may be performed multiple times, or different analyses may be performed via each track 42.
- Each track 42 includes one or more sample reservoirs 44, a precursor/chromophore set reservoir 46, and the detection location 36.
- Respective channels 48, 50 deliver the precursors and/or chromophores and the sample to the detection location 36.
- the channels 48, 50 may deliver the respective solutions to a mixing chamber 52 prior to being transmitted to the detection location 36.
- the precursor/chromophore set reservoir 46 is not utilized and the precursors and/or chromophores are present in the detection location 36.
- the sample is delivered to the detection location 36 via the single channel 48 and channel 50 may be omitted from the device 18'".
- the coupon may be rotated in order to facilitate mixing and interaction between the precursors and/or chromophores and the analytes in the sample.
- the detection location 36 is generally a rounded (e.g., having a cylindrical, oval or ellipse shape) or rectangularly-shaped, optical cuvette (i.e., a transparent cuvette) advantageously located at an outer edge 54 of the track 42. This positioning may be desirable to facilitate relative ease of optical detection.
- suitable materials for the detection location 36 include glass, plastics (such as polycarbonate, polystyrene, and/or the like), or any other material that minimizes scattering and absorption of light when the detection location 36 is scanned by the optical reader (i.e., photodetector 14).
- the detection location 36 has a volume ranging from about 1 microliter to about 100 microliters.
- optical detection may commence using the analyzer 20.
- all windows 22 of the analyzer 20 are exposed to the detection location 36 at one time.
- the respective filters 16 filter out any light signals not corresponding with the particular waveband for which they are tuned, thereby enabling multiple wavebands to be detected simultaneously and independently.
- Fig. 6 shows still another embodiment of the test device 18"".
- a plurality of parallel chambers or detection locations 36 is formed in a substrate 56 in the form of separate depressions or wells. It is to be understood that the substrate 56 may also be configured to receive separate cuvettes.
- one of the pre-selected precursors or chromophores is present in each one of the detection locations 36. Each of the pre-selected precursors or chromophores corresponds with a different predetermined analyte.
- the sample (containing one or more unknown analytes) is introduced into each of the detection locations 36.
- the test device 18"" will be aligned with the analyzer 20 (e.g., shown in Fig. 3) such that each window 22 is aligned with a corresponding detection location 36.
- the waveband detectable by each window 22 matches the wavelength absorbed, emitted or reflected by the chromophore generated or present in the corresponding and aligned detection location 36.
- the precursor/chromophore in this embodiment is specifically selected for introduction into a particular detection location 36.
- the detection locations 36 may have different sizes and may be positioned at a particular X, Y location, depending, at least in part, upon the area and location of the corresponding filter 16 of the analyzer 20. It is to be understood that in some instances, all of the locations 36 including chromophores with orthogonal wavebands may be read at the same time by many windows 22.
- the wavelengths detected range from about 400 nm to about 900 nm, and the wavelength that is incident on the sample is an excitation wavelength ranging from about 200 nm to about 700 nm.
- the selected precursors or chromophores essentially transduce the corresponding analyte to a detectable signal in the form of absorbed, reflected, or emitted light. Furthermore, the precursors or chromophores are specifically selected to match the wavelengths that are detectable by the various windows 22 of the analyzer 20.
- the matching precursor/chromophore set and analyzer 20 advantageously enables simultaneous detection of multiple chemistries at a rapid pace.
- Figs. 8 through 23 respectively illustrate the dyes that had a peak absorbance that corresponds with or matches the response of the individual windows.
- the absorption intensity of the dyes is shown on the left Y axis, and the response of the windows is shown on the right Y axis.
- Table 8 Series 3 (Response at about 433 nm) and Corresponding Dyes; See also Fig. 10
- Table 9 Series 4 (Response at about 452 nm) and Corresponding Dyes; See also Fig. 11
- Table 13 Series 8 (Response at about 534 nm) and Corresponding Dyes; See also Fig. 15
- Table 14 Series 9 (Response at about 553 nm) and Corresponding Dyes; See also Fig. 16
- Table 17 Series 12 (Response at about 616 nm) and Corresponding Dyes; See also Fig. 19
- Table 18 Series 13 (Response at about 636 nm) and Corresponding Dyes; See also Fig. 20
- Table 19 Series 14 (Response at about 656 nm) and Corresponding Dyes; See also Fig. 21
- Table 20 Series 15 (Response at about 677 nm) and Corresponding Dyes; See also Fig. 22
- the data for each of the dyes tested with the various windows of the analyzer was analyzed to determine suitable dyes (i.e., precursors or chromophores, depending on the reaction/interaction with a desirable analyte) for a dye set that will match the analyzer.
- suitable dyes i.e., precursors or chromophores, depending on the reaction/interaction with a desirable analyte
- Tables 22 and 23 illustrate two example dye sets generated from the data, and Figs. 24 and 25 illustrate the corresponding absorption spectra of the selected dyes, upon which the filter spectra of the windows of the analyzer has been superimposed.
- the dye spectra are shown as the solid thinner lines, while the filter response spectra are shown as the solid thicker lines.
Landscapes
- Health & Medical Sciences (AREA)
- Life Sciences & Earth Sciences (AREA)
- Immunology (AREA)
- Chemical & Material Sciences (AREA)
- Engineering & Computer Science (AREA)
- Molecular Biology (AREA)
- Physics & Mathematics (AREA)
- Hematology (AREA)
- Analytical Chemistry (AREA)
- Biochemistry (AREA)
- Pathology (AREA)
- General Health & Medical Sciences (AREA)
- Biomedical Technology (AREA)
- Urology & Nephrology (AREA)
- General Physics & Mathematics (AREA)
- Cell Biology (AREA)
- Microbiology (AREA)
- Biotechnology (AREA)
- Food Science & Technology (AREA)
- Medicinal Chemistry (AREA)
- Spectroscopy & Molecular Physics (AREA)
- Investigating Or Analysing Materials By The Use Of Chemical Reactions (AREA)
Abstract
An analysis system (10) includes a test device (18) and a monolithic analyzer (20). The test device (18) includes test formats using a plurality of processes involving a pre-selected combination of chromophore precursors or chromophores. Each of the pre-selected chromophore precursors or chromophores is configured to generate a measurable signal for a different analyte. Each chromophore precursor is capable of generating a chromophore that absorbs, emits or reflects a wavelength that is within a waveband that is detectable via a respective corresponding window (22) of the analyzer (20), and each chromophore is capable of absorbing, emitting or reflecting a wavelength that is within the waveband detectable via a respective corresponding window (22) of the analyzer (20). The monolithic analyzer (20) includes a plurality of separate windows (22). Each window (22) is configured to be responsive to a different waveband that matches the waveband including the wavelength that is absorbed, emitted or reflected by one of the generated chromophores or chromophores.
Description
AN ANALYSIS SYSTEM INCLUDING A PRE-SELECTED COMBINATION OF CHROMOPHORE PRECURSORS OR CHROMOPHORES
BACKGROUND The present disclosure relates generally to an analysis system including a pre-selected combination of chromophore precursors or chromophores.
Color detection and measurement is used in a large number of chemical and/or biological analysis methods. The color or contrast may be generated, for example, via reflectance, transmittance, fluorescence, or phosphorescence.
BRIEF DESCRIPTION OF THE DRAWINGS
Features and advantages of embodiments of the present disclosure will become apparent by reference to the following detailed description and drawings, in which like reference numerals correspond to similar, though perhaps not identical, components. For the sake of brevity, reference numerals or features having a previously described function may or may not be described in connection with other drawings in which they appear.
Fig. 1 is a flow diagram of an embodiment of a method for enhancing sensing; Fig. 2 is a cross-sectional side view of an embodiment of a parallel analysis system;
Fig. 3 is a semi-schematic bottom view of an embodiment of a monolithic analyzer used in an embodiment of the analysis system;
Fig. 4A is a schematic top view of an embodiment of a test device, in the form of a test strip, used in an embodiment of the analysis system;
Fig. 4B is a schematic top view of another embodiment of the test device, in the form of another test strip, used in an embodiment of the analysis system;
Fig. 5 is a semi-schematic top view of still another embodiment of the test device, in the form of a rotatable coupon, used in an embodiment of the analysis system;
Fig. 6 is a semi-schematic top view of yet another embodiment of the test device, in the form of a substrate having wells formed therein, used in an embodiment of the analysis system;
Fig. 7 is a graph illustrating the filter response of each of 16 filters of an analyzer;
Fig. 8 is a graph illustrating the absorbance of chromophores tested for a window ("Series 1 ") of the analyzer having a peak response at about 400 nm;
Fig. 9 is a graph illustrating peak response of the Series 2 window at about 415 nm; Fig. 10 is a graph illustrating the absorbance of chromophores tested for a window ("Series 3") of the analyzer having a peak response at about 433 nm;
Fig. 11 is a graph illustrating the absorbance of chromophores tested for a window ("Series 4") of the analyzer having a peak response at about 452 nm;
Fig. 12 is a graph illustrating the absorbance of chromophores tested for a window ("Series 5") of the analyzer having a peak response at about 472 nm;
Fig. 13 is a graph illustrating the absorbance of chromophores tested for a window ("Series 6") of the analyzer having a peak response at about 493 nm;
Fig. 14 is a graph illustrating the absorbance of chromophores tested for a window ("Series 7") of the analyzer having a peak response at about 513 nm; Fig. 15 is a graph illustrating the absorbance of chromophores tested for a window ("Series 8") of the analyzer having a peak response at about 534 nm;
Fig. 16 is a graph illustrating the absorbance of chromophores tested for a window ("Series 9") of the analyzer having a peak response at about 553 nm;
Fig. 17 is a graph illustrating the absorbance of chromophores tested for a window ("Series 10") of the analyzer having a peak response at about 575 nm;
Fig. 18 is a graph illustrating the absorbance of chromophores tested for a window ("Series 11 ") of the analyzer having a peak response at about 596 nm;
Fig. 19 is a graph illustrating the absorbance of chromophores tested for a window ("Series 12") of the analyzer having a peak response at about 616 nm; Fig. 20 is a graph illustrating the absorbance of chromophores tested for a window ("Series 13") of the analyzer having a peak response at about 636 nm;
Fig. 21 is a graph illustrating the absorbance of chromophores tested for a window ("Series 14") of the analyzer having a peak response at about 656 nm;
Fig. 22 is a graph illustrating the absorbance of chromophores tested for a window ("Series 15") of the analyzer having a peak response at about 677 nm;
Fig. 23 is a graph illustrating the absorbance of chromophores tested for a window ("Series 16") of the analyzer having a peak response at about 697 nm;
Fig. 24 is a graph illustrating the absorbance of each chromophore in one example of a chromophore set selected for the analyzer used to generate Fig. 7, the graph being superimposed on the filter response graph of Fig. 7; and
Fig. 25 is a graph illustrating the absorbance of each chromophore in another example of a chromophore set selected for the analyzer used to generate Fig. 7, the graph being superimposed on the filter response graph of Fig. 7.
DETAILED DESCRIPTION
Embodiments of the analysis system disclosed herein include an analyzer and a test device. Test formats of the test device advantageously include a chromophore (or precursor thereof) set that is specifically matched to the various windows of the analysis system. More particularly, the waveband reflected, emitted or absorbed by each of the chromophores of the test device are detectable by a corresponding one of the windows, which is configured to detected such waveband reflectance, emission, or absorbance. As such, the reflection/em ission/absorbance fingerprint of the precursors/chromophores in the set matches the response fingerprint of the windows of the analyzer used. Furthermore, the various test formats enable multiple chemistries to occur within
the test device simultaneously. The system disclosed herein may advantageously be used for parallel detection of multiple different analytes simultaneously.
Since the chromophores/chromophore precursors are specifically matched to the response wavebands of the analyzer used, the mixture may be read with accuracy, where every analyte corresponds to a different chromophore that is part of, or is produced by a precursor in, the set. The color output may be the result of the chromophore color itself (e.g., when the presence of a corresponding analyte simply moves the chromophore to a detection area), or of the development of color due to chromophore production from a chromophore precursor. In either instance, the analysis system measures color. The amount of color is correlated to the qualitative and quantitative measure of the chromophore. The system disclosed herein advantageously enables such measurements using chromophores with non- overlapping absorbance, reflectance, or emission. Furthermore, the ability to perform multiple analyses simultaneously, and in some instances for the same analyte, using the matched precursor/chromophore sets disclosed herein allows for noise reduction and increased accuracy compared to other systems in which single wavebands are used for analysis.
Referring now to Fig. 1 , an embodiment of the method for enhancing sensing is depicted. Generally, the method includes selecting a set of chromophore precursors or chromophores such that i) each chromophore precursor in the set generates, upon interacting with an analyte, a respective chromophore which absorbs, emits, or reflects a wavelength that matches a wavelength or is within a waveband detectable by one of a plurality of separate windows of an analyzer, or ii) each chromophore in the set, upon interacting with an analyte, absorbs, emits, or reflects a wavelength that matches a wavelength or is within a waveband detectable by one of a plurality of separate windows of an analyzer, as shown at reference numeral 100. Once the chromophore or chromophore precursors are selected, the method further includes incorporating the set into a test device, as shown at reference numeral 102.
As used herein, the terms "waveband" or "band" or "spectrum of wavelengths" refer to light frequencies, emissions, reflectance, and/or absorption corresponding with a range of wavelengths. The waveband of a particular response window of an analyzer includes those wavelengths that are readable via that window due to high response to those wavelengths, and the waveband of a chromophore includes the wavelengths emitted, reflected, or absorbed via the chromophore. When the phrase "at about" a stated value is used to describe the waveband (e.g., waveband at about 405 nm) or when the phrase "the [stated value] waveband" (e.g., the 405 nm waveband) is used, it is meant that the referenced waveband includes the stated wavelength (e.g., a peak absorption wavelength
(405 nm)) and at least ± 10 nm or at most ± 50 nm from the stated value. The term wavelength generally refers to the stated value.
Selection of the chromophores or chromophore precursors will depend, at least in part, on the analytes of interest to be tested and the wavebands detectable via the corresponding analyzer. Non-limiting examples of the chromophores that may be selected are shown in Table 1 with their corresponding emission and excitation wavelengths. The materials listed below are commercially available from Invitrogen, located in Eugene, OR.
Table 1


It is to be understood that any precursors of the previously listed dyes may also be selected for the set that is incorporated into the test device. Table 2 illustrates some non-limiting examples of chromophore precursors that are suitable. This table also shows the corresponding analyte, the precursor/analyte interaction, the chromophore that forms as a result of the interaction, and the detection frequency.
Table 2


Table 3 below illustrates further examples of suitable chromophore precursors that may be selected for the set disclosed herein. These particular chromophore precursors are used with the listed enzyme reactions to generate the desirable wavelength. This Table also illustrates the target diseases that may be simultaneously screened for using such enzymes and precursors.
Table 3

Table 4

As illustrated in some of the previous tables, the selected precursors/chromophores may be used to test for a variety of target diseases simultaneously, either in a lateral flow assay, or combined with an antibody incorporated in a flow assay.
Any combination of the previously mentioned chromophore precursors or chromophores may be selected for use in the test device to match the gated wavelengths of the detector windows. In one embodiment, it is desirable that each chromophore precursor or chromophore ultimately generates a signal in a different waveband than any of the other chromophore precursors or chromophores in the set. It is to be understood, however, that multiple chromophore precursors or chromophores that generate signals in the same waveband may be included in a single set. Furthermore, it is to be understood that the components listed in Tables 1 through 5 are examples, and that other suitable chromophore precursors and/or chromophores may be utilized. Additional examples of such chromophores include 5-bromo-4-chloro-3-indoxyl phosphate, disodium salt; 4-nitrophenyl phosphate, disodium salt; 4-methylumbelliferyl phosphate, disodium salt; fluorescein diphosphate, tetraammonium salt; 3-amino-9-ethylcarbazole; 4-chloro-1 -naphthol; dihydrorhodamine 123; 5-(and-6)-carboxy-2',7'-dichlorodihydrofluorescein diacetate; dihydrorhodamine 6G; 2',7'-dichlorodihydrofluorescein diacetate; Dihydrocalcein; Luminol (C8H7N3O2); benzidine dyes (such as 3,3'- diaminobenzidine tetrahydrochloride or 3,3\5,5'-tetramethylbenzidine dihydrochloride); 3-(4-hydroxyphenyl)propionic acid; and N-methyl-4-hydrazino-7- nitrobenzofurazan. As previously mentioned, the chromophore precursors or chromophores are selected to match the detection wavebands of an associated analyzer. Any monolithic analyzer that is capable of detecting a plurality of wavebands may be utilized with the test devices and precursor/chromophore sets.
One non-limiting example of a system 10 including such an analyzer 20 is shown in Fig. 2. The system 10 is a color detector which includes a light source 12 configured to generate light within a spectrum or band of wavelengths. A filter 16 is a component of the analyzer 20, and is in optical communication with the light source 12 via the test device 18. The filter 16 enables light of predetermined wavelengths to pass through to a photodetector (or other suitable sensor) 14 that is in optical communication therewith. The photodetector 14 is configured to output a
color signal if light passes through the filter 16. The strength (i.e., magnitude) of the color signal indicates the amount of light within the waveband that is present. The magnitude of the color signal may depend, at least in part, upon the transmission characteristics of the filter 16, which may change based on the waveband.
In the embodiments disclosed herein, the filter 16 and photodetector 14 are used in an array with at least one other filter 16 and corresponding photodetector 14 (see, e.g., Fig. 3). Each filter 16 and photodetector 14 combination forms one window 22 of the analyzer 20. Each filter 16 in the array is tuned to allow light of different colors (i.e., wavelengths of a particular waveband) to pass. Because each filter 16 is tuned to allow a different color to pass, the transmission characteristics of each filter 16 in the array may be different. The sensitivity of each photodetector 14 and the amount of light emitted by the light source 20 may also vary according to color. Accordingly, each color signal generated, for a given input light signal, by each of the photodetectors 14 may have a different magnitude and/or signal-to- noise ratio. This may be corrected by adjusting the area of each of the photodetectors 14 and their corresponding filters 16. More specifically, the photodetectors 14 may have an area configured to equalize the color signal and optimize a signal-to-noise ratio of the color signal. In one embodiment, the signal- to-noise ratio may be optimized for photodetectors 14 by optimizing the signal for a reference color, which may be, for example, a neutral or white color. The area of the photodetector 14 may be based on a response curve of the photodetector 14 as a function of wavelength, a response curve of the filter 16 as a function of wavelength, and a wavelength of the light generated by the light source 12, among other factors.
In an embodiment, the light source 12 is positioned to project light onto at least a detection area (shown as reference numeral 36 in Figs. 4A, 4B, 5 and 6) the test device 18. Non-limiting examples of suitable test devices 18 are discussed further in reference to Figs. 4A, 4B, 5 and 6 (where such devices 18 are labeled 18', 18", 18'", 18"" respectively). The light source 12 may be configured to
generate light within a spectrum of wavelengths. In one embodiment, the light source 12 generates "white" light or any other color light. One example of a light source 12 is a light emitting diode. It is to be understood that other light sources may be utilized. In one instance, the light projected onto the test device I8 is reflected or absorbed by the chromophore (either present on/in the test device 18 or formed during the analysis), or excites the chromophore to emit another wavelength. In other instances, a particular waveband is reflected or absorbed. The reflection, absorption, or emission signal is detectable by at least one of the photodetectors 14. It is to be understood that when in use, the analyzer 20 is positioned with respect to the incident light such that it is operational in the fluorescence mode, reflectance mode, transmittance mode, or absorption mode.
Each photodetector 14 may be selected from a photodiode, phototransistor, avalanche photodiode, or any other photodetector 14. The magnitude of the output of the photodetector 14 is proportional to the amount of light that reaches the photodetector 14, and thus is proportional to the amount of light reaching the corresponding filter 16 (i.e., the color to which the filter 16 is tuned).
Before reaching one of the photodetectors 14, the light passes through one of the filters 16. Each filter 16 may be a Fabry-Perot etalon or interferometer, or any other suitable filter 16. As previously mentioned, each filter 16 is tuned to allow light within a specific waveband to pass through to the corresponding photodetector 14. Once received by the photodetector 14, a photovoltaic or gated electrical signal in the form of current or voltage is generated.
In one embodiment, the wavebands of the respective filters 16 do not overlap. In other embodiments, the wavebands of the respective filters 16 may at least partially overlap. Generally, each filter 16 is designed or selected to allow a peak or dominant transmission in a specific region.
As previously mentioned, since multiple filters 16 are used, the system 10 also includes multiple corresponding photodetectors 14 - at least one for each filter 16. In a non-limiting example, the system 10 may include seven filters 16 and seven photodetectors 14. Also as previously mentioned, each filter 16 may be
tuned to allow different colors to pass through to the corresponding photodetector 14. By way of example, the filters 16 may be configured to detect wavelength spectrums corresponding to "red," "orange," "yellow," "green," "blue," "indigo," and "violet." It is to be understood that the test device 18 will include chromophore precursors and chromophores that correspond with these wavelength spectrums. If the sample tested with the test device 18 is in the "red" spectrum, the light will pass through the filter 16 having wavelengths corresponding to the "red" spectrum, and will be blocked by the other filters 16. As such, only the photodetector 14 corresponding to the "red" filter 16 will output an electrical signal proportional to the amount of light in the "red" spectrum. Since the test device 18 and analyzer 20 are configured to analyze multiple chemistries simultaneously, while the "red" spectrum is detected via one photodetector 14, if the sample also contains analytes within the "green" spectrum, this light will pass through another of the filters 16 having wavelengths corresponding to the "green" spectrum. Using more filters 16 and corresponding photodetectors 14 allows the system 10 to distinguish between varying hues of color. The corresponding chromophore precursor/chromophore set enhances the parallel analysis.
Furthermore, the use of additional filters 16 and corresponding photodetectors 14 enables the system 10 to distinguish between "baby blue," "sky blue," and "navy blue," as opposed to just recognizing the color as being in the "blue" spectrum.
In some instances, it may be desirable to include a light blocking layer (not shown) which defines an opening over each filter 16. This may be desirable to reduce the reflection of light from one filter 16 so that such reflected light does not interfere with other photodetectors 14.
Referring now to Fig. 3, a bottom view of the analyzer 20 is depicted. This embodiment includes nineteen filters 16 and corresponding photodetectors 14. It is to be understood, however, that color analyzer 20 may include more or less filters 16 and corresponding photodetectors 14 as is desired for a particular end use. In
addition, the filters 16 and photodetectors 14 may be predisposed on an integrated circuit, and one or more of the filters 16 and photodetectors 14 on the integrated circuit may not be used in certain circumstances. For example, the integrated circuit may include nineteen filters 16 and corresponding photodetectors 14, but is configured to detect sixteen colors, thus only using sixteen filters 16 and corresponding photodetectors 14.
In the embodiment shown in Fig. 3, a first photodetector 28 is in optical communication with the first filter 26 and is configured to output a first color signal if light passes through the first filter 26. The first filter 26 will generally let a first color of light through to the first photodetector 28. The first color signal indicates the amount of the first color of light that has been received, indicating the presence of the chromophore associated with the first color of light in a sample.
Different color signals have different signal-to-noise ratios. As such, the first photodetector 28 has an area that is configured to equalize the first color signal in relation to other color signals of others filters 14 in order to optimize the signal-to- noise ratio of the first color signal. Therefore, the size of each photodetector 14 may be changed to accommodate for the different light transmission characteristics of each associated filter 16. Specifically, filters 16 having low light transmission may be disposed on photodetectors 14 having a larger area. With the larger area, the photodetector 14 may receive more of the color, even though the transmission of the color through the filter 16 is low. Similarly, filters 16 having high light transmission may be disposed on photodetectors 14 having a smaller area. The combination of larger and smaller areas of the photodetectors 14 based on the light transmission through the filter 16 equalizes the color output signals of the photodetectors 14.
As shown in Fig. 3, the analyzer 20 includes a second filter 30, which is configured to pass light within a second predetermined spectrum of wavelengths. As discussed hereinabove, each filter 16 is specifically designed to be unique in its total wavelength band response. Thus, a given filter 16 may have one or more dominant transmission peaks, but the total transmission characteristic will be
different from one filter 16 to another. When filters 16 are used that have a single dominant transmission peak, each dominant peak will cover a different waveband than any other filter 16. When filters 16 are used that have multiple peak responses, then the response of the two filters 16 that have overlap will differ to some degree in their response in the overlapping region. This ensures that the net wavelength band transmission characteristic is different from one filter 16 to the next.
A second photodetector 32 is in optical communication with the second filter 30 and may be configured to output a second color signal if light passes through the second filter 30. Like the first photodetector 28, the second photodetector 32 has an area configured to equalize the second color signal and maximize a signal- to-noise ratio of the second color signal.
It is to be understood that the analyzer 20 shown and described in reference to Figs. 2 and 3 is merely an example, and that other suitable monolithic analyzers 20 may be used that are capable of simultaneously detecting multiple wavebands. In an embodiment, any analyzer 20 that is capable of diffraction grating may be used. Non-limiting examples of some suitable analysis systems include Afinion™ AS100 Analyzer, Alfa-Scan Multi-Functional Reader, COULTER® AC T™ Series, CardioChek® Analyzer, and RAMP® 200 Clinical System. Portable and/or stationary analyzers 20 may be utilized. Still another example of a suitable analyzer 20 is a linear variable filter (i.e., a non-Fabry-Perot thin film approach), which is described in U.S. Patent Application Serial No. 11/801 ,830, filed May 11 , 2007 (corresponding to PCT/US2008/063014, filed May 8, 2008), the contents of which are incorporated herein by reference. It is to be further understood that any test device 18 (e.g., test strips, coupons, cassettes (which house the various precursors/chromophores and a detection strip), a set of test strips on a coupon having a lateral flow matrix for directing samples thereon, substrates having wells formed therein, cuvettes, etc.) may be used with the analyzer 20. The test device 18 used depends, at least in part, upon the analyzer 20 that is selected. For example, some analyzers 20 are
specifically designed for receiving and reading a test strip or a coupon. Each embodiment of the test device 18 includes test formats including the pre-selected chromophore precursors or chromophores and associated test reagents (such as, for example, enzymes, antibodies, reducing or oxidizing agents, and pH buffers). The precursors and/or chromophores may be deposited into or on respective locations of the test device 18, or may all be present on or in the same location of the test device 18. Non-limiting examples of such test devices 18', 18", 18'", 18"" are shown and described in Figs. 4A, 4B, 5, and 6.
Test strips, coupons, and cassettes are often lateral flow devices. Lateral flow devices work to move a liquid sample, or its extract containing an analyte of interest, along a strip of material (e.g., a polymer) or through one or more channels. The device often includes various zones or chambers, at least one of which includes the pre-selected chromophore precursors or chromophores that exert more or less specific interactions with the analyte(s). The pre-selected chromophore precursors or chromophores may be dried on the strip or within a reaction chamber. The flowing sample interacts with the pre-selected chromophore precursors or chromophores, and such interactions will continue as the sample continues to flow. The portion of the test strip, coupon, or cassette to which the interacted flowing sample is directed is under the sensor/detector 14 when the strip/chip/coupon/cassette is inserted in or adjacent to the analyzer 20. In some instances, the test device 18 is first inserted into the analyzer 20, and then the sample fluid is introduced.
Figs. 4A and 4B illustrate two embodiments of the test device 18', 18". These devices 18', 18"are test strips. In the embodiment shown in Fig. 4A, the test strip includes a sample introduction location 38 (e.g., a sample pad), a reagent location 34, and a detection location 36 (also referred to herein as a readable location). The test strip 18', 18" also includes an absorbent pad 58. This pad 58 maintains the flow as it wicks the liquid to the end of the strip 18', 18". In this embodiment, the selected chromophore precursors or chromophores are all deposited onto the test strip material at the reagent location 34. The deposition of
the precursors/chromophores may be accomplished via any number of printing methods (such as, for example, drop-on-demand printing techniques), auto- micropipetting, or via any suitable manual deposition technique. Such precursors or chromophores are generally dried onto the strip 18', 18" at the reagent location 36. When a sample including multiple analytes of interest is introduced at the sample introduction location 38, capillary force causes mixing of the sample with the chromophore precursors or chromophores, and transports this mixture to the detection location 36.
In all of the embodiments disclosed herein, the interaction i) between the chromophore precursor and a corresponding analyte (which generates a chromophore) or ii) between the chromophore and a corresponding analyte generates a readable signal. The interaction may result in a pH change, an oxidation reaction, a reduction reaction, binding of the chromophore with the analyte, complexing the chromophore to the analyte, and/or movement of the chromophore to the detection location.
In the embodiment of Fig. 4A, those precursors/chromophores that interact with analytes in the sample are then moved with the flowing sample to the detection location 36. When light is exposed to the detection location 36, the chromophore (either generated from the precursor or initially present), as a result of the interaction with the analyte, will give off a color signal that is readable by one of the windows 22 of the analyzer 20. The signal may be indicative of light reflection, light emission, or light absorption. In this embodiment, each window 22 of the analyzer 20 is aligned with the detection location 36 (i.e., is in a position to receive the light from the detection location 36), and the previously described filters 16 enable or prevent certain wavelengths from reaching the respective photodetectors 14.
It is to be understood that those precursors/chromophores that do not interact with one or more of the analytes in the sample may remain in the reagent location 34 and thus are not detected, or may not produce a signal corresponding to response of the sensor 14 and thus are not detected.
In the test device 18" of Fig. 4B, the precursors/chromophores are each deposited as separate dots 40 on the test device 18". Each dot 40 contains a different precursor or chromophore that is capable of interacting with a different analyte. In this embodiment, the sample flows laterally across the test strip, and each dot 40 functions as a detection location 36. Any interaction between an analyte and a precursor or chromophore occurs at the dot 40. Light is then exposed to the entire test strip, and the signals given off from respective dots 40 are detectable by respective windows 22 of the analyzer 20 that are capable of detecting such signals. It is to be understood that each window 22 may be specifically aligned with the dot 40 containing a corresponding precursor or chromophore, or each window 22 may be opposed from the entire device 18" and the filters 16 separate the various signals. It is to be further understood that when there is no interaction at a particular dot 40, the corresponding window 22 will not detect anything because the signals within the suitable waveband will not be generated.
Referring now to Fig. 5, still another embodiment of the test device 18'" is depicted. In this embodiment, the test device 18'" is a rotatable coupon including a plurality of tracks 42 for performing multiple analyses. Using such a test device 18'", the same analysis may be performed multiple times, or different analyses may be performed via each track 42.
Each track 42 includes one or more sample reservoirs 44, a precursor/chromophore set reservoir 46, and the detection location 36. Respective channels 48, 50 deliver the precursors and/or chromophores and the sample to the detection location 36. In one embodiment, the channels 48, 50 may deliver the respective solutions to a mixing chamber 52 prior to being transmitted to the detection location 36. In still another embodiment, the precursor/chromophore set reservoir 46 is not utilized and the precursors and/or chromophores are present in the detection location 36. In this embodiment, the sample is delivered to the detection location 36 via the single channel 48 and channel 50 may be omitted from the device 18'".
The coupon may be rotated in order to facilitate mixing and interaction between the precursors and/or chromophores and the analytes in the sample.
In this embodiment, the detection location 36 is generally a rounded (e.g., having a cylindrical, oval or ellipse shape) or rectangularly-shaped, optical cuvette (i.e., a transparent cuvette) advantageously located at an outer edge 54 of the track 42. This positioning may be desirable to facilitate relative ease of optical detection. Non-limiting examples of suitable materials for the detection location 36 include glass, plastics (such as polycarbonate, polystyrene, and/or the like), or any other material that minimizes scattering and absorption of light when the detection location 36 is scanned by the optical reader (i.e., photodetector 14). Plastics may be particularly desirable because they are less apt to shatter or crack under pressure caused from centrifugal force generated by rotation of the coupon at relatively high speeds. In an embodiment, the detection location 36 has a volume ranging from about 1 microliter to about 100 microliters. Once the sample and precursors/chromophores are present in the detection location 36, optical detection may commence using the analyzer 20. In this embodiment, all windows 22 of the analyzer 20 are exposed to the detection location 36 at one time. As previously described hereinabove, the respective filters 16 filter out any light signals not corresponding with the particular waveband for which they are tuned, thereby enabling multiple wavebands to be detected simultaneously and independently.
Fig. 6 shows still another embodiment of the test device 18"". In this embodiment, a plurality of parallel chambers or detection locations 36 is formed in a substrate 56 in the form of separate depressions or wells. It is to be understood that the substrate 56 may also be configured to receive separate cuvettes. In this embodiment, one of the pre-selected precursors or chromophores is present in each one of the detection locations 36. Each of the pre-selected precursors or chromophores corresponds with a different predetermined analyte.
The sample (containing one or more unknown analytes) is introduced into each of the detection locations 36. The test device 18"" will be aligned with the
analyzer 20 (e.g., shown in Fig. 3) such that each window 22 is aligned with a corresponding detection location 36. In particular, the waveband detectable by each window 22 matches the wavelength absorbed, emitted or reflected by the chromophore generated or present in the corresponding and aligned detection location 36. As such, the precursor/chromophore in this embodiment is specifically selected for introduction into a particular detection location 36.
As shown in Fig. 6, the detection locations 36 may have different sizes and may be positioned at a particular X, Y location, depending, at least in part, upon the area and location of the corresponding filter 16 of the analyzer 20. It is to be understood that in some instances, all of the locations 36 including chromophores with orthogonal wavebands may be read at the same time by many windows 22.
In any of the embodiments disclosed herein, the wavelengths detected range from about 400 nm to about 900 nm, and the wavelength that is incident on the sample is an excitation wavelength ranging from about 200 nm to about 700 nm.
Furthermore, in the embodiments disclosed herein, the selected precursors or chromophores essentially transduce the corresponding analyte to a detectable signal in the form of absorbed, reflected, or emitted light. Furthermore, the precursors or chromophores are specifically selected to match the wavelengths that are detectable by the various windows 22 of the analyzer 20. The matching precursor/chromophore set and analyzer 20 advantageously enables simultaneous detection of multiple chemistries at a rapid pace.
To further illustrate the embodiment(s) of the present disclosure, an example is given herein. It is to be understood that this example is provided for illustrative purposes and is not to be construed as limiting the scope of the disclosed embodiment(s).
EXAMPLE
The filter response of each window in an analyzer having 16 different windows was measured. The analyzer used in this Example has been described in
International Patent App. Ser No. PCT/US 2008/053826, filed February 13, 2008. Such filter responses are shown in Fig. 7. Each of the labeled "Series" corresponds to a respective one of the windows, and each of the windows had a peak response at a different wavelength. Table 6 illustrates the filter responses of the windows of the analyzer. As depicted in both Fig. 7 and Table 6, each of the windows was tuned to detect absorption at a different waveband.
Table 6: Average Filter Response of Analyzer Windows

39 different dyes were incorporated into respective cuvettes, and were analyzed with the analyzer having the filter responses shown in Fig. 7. Each of the dyes was independently read by a UV spectrophotometer for standardization. Figs. 8 through 23 respectively illustrate the dyes that had a peak absorbance that corresponds with or matches the response of the individual windows. In each of Figures 8 through 25, the absorption intensity of the dyes is shown on the left Y axis, and the response of the windows is shown on the right Y axis. Tables 7 through 21 below depict a particular series and the corresponding dyes and absorbances. It is to be understood that none of the dyes tested matched Series 2 (see Fig. 9) or Series 5 (see Table 10 and Fig. 12).
Table 7: Series 1 (Response at about 400 nm) and Corresponding Dyes; See also Fig. 8

Table 8: Series 3 (Response at about 433 nm) and Corresponding Dyes; See also Fig. 10
 Table 9: Series 4 (Response at about 452 nm) and Corresponding Dyes; See also Fig. 11

Table 10: Series 5 (Response at about 472 nm) and Corresponding Dyes; See also Fig. 12

Table 11: Series 6 (Response at about 493 nm) and Corresponding Dyes; See also Fig. 13
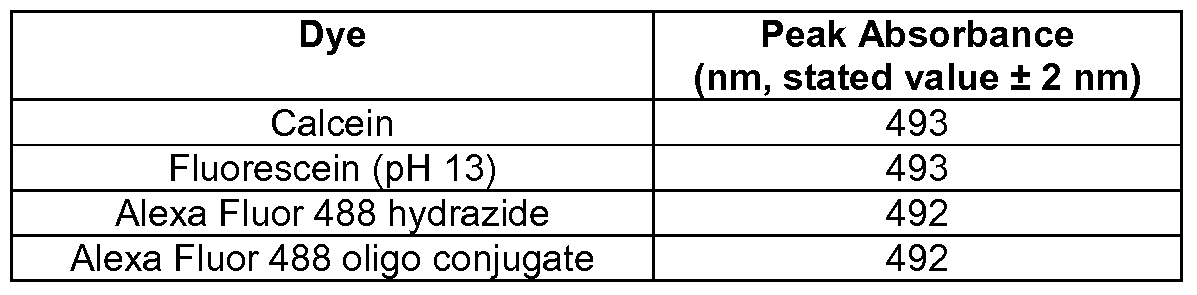
Table 12: Series 7 (Response at about 513 nm) and Corresponding Dyes; See also Fig. 14

Table 13: Series 8 (Response at about 534 nm) and Corresponding Dyes; See also Fig. 15
 Table 14: Series 9 (Response at about 553 nm) and Corresponding Dyes; See also Fig. 16

Table 15: Series 10 (Response at about 575 nm) and Corresponding Dyes; See also Fig. 17

Table 16: Series 11 (Response at about 596 nm) and Corresponding Dyes; See also Fig. 18

Table 17: Series 12 (Response at about 616 nm) and Corresponding Dyes; See also Fig. 19
 Table 18: Series 13 (Response at about 636 nm) and Corresponding Dyes; See also Fig. 20

Table 19: Series 14 (Response at about 656 nm) and Corresponding Dyes; See also Fig. 21
 Table 20: Series 15 (Response at about 677 nm) and Corresponding Dyes; See also Fig. 22

Table 21: Series 16 (Response at about 697 nm) and Corresponding Dyes; See also Fig. 23
The data for each of the dyes tested with the various windows of the analyzer was analyzed to determine suitable dyes (i.e., precursors or chromophores, depending on the reaction/interaction with a desirable analyte) for a dye set that will match the analyzer.
Tables 22 and 23 illustrate two example dye sets generated from the data, and Figs. 24 and 25 illustrate the corresponding absorption spectra of the selected dyes, upon which the filter spectra of the windows of the analyzer has been superimposed. The dye spectra are shown as the solid thinner lines, while the filter response spectra are shown as the solid thicker lines. For the dye set of Table 22 and Fig. 24, one or more dyes having a maximum absorbance at a wavelength close to the response wavelength of the corresponding window (Series) was/were selected; and for the dye set of Table 23 and Fig. 25, the dye having the maximum absorbance at the wavelength closest to the response wavelength of the corresponding window (Series) was selected. To reiterate, it is to be understood that the Series peaks shown in Fig. 7 have been superimposed on the dye absorption spectra of the dyes selected for the matching dye set. As shown in Tables 22 and 23 and Figures 24 and 25, no matching dyes (of the dyes tested) were found for Series 2 and Series 5.
Table 22: Example Dye Set 1 for the Analyzer; See also Fig. 24

Table 23: Example Dye Set 2 for the Analyzer; See also Fig. 25

While several embodiments have been described in detail, it will be apparent to those skilled in the art that the disclosed embodiments may be
modified. Therefore, the foregoing description is to be considered exemplary rather than limiting.
Claims
1. An analysis system (10), comprising: a test device (18) including test formats using a plurality of processes involving a pre-selected combination of chromophore precursors or chromophores, each of the chromophore precursors or chromophores in the pre-selected combination configured to generate a measurable signal for a different analyte, each chromophore precursor capable of generating a chromophore that absorbs, emits or reflects a wavelength that is within a waveband that is detectable via a respective corresponding window (22) of a monolithic analyzer (20), and each chromophore capable of absorbing, emitting or reflecting a wavelength that is within the waveband detectable via a respective corresponding window (22) of the monolithic analyzer (20); and the monolithic analyzer (20) including a plurality of separate windows (22), each window (22) configured to be responsive to a different waveband that matches the waveband including the wavelength that is absorbed, emitted or reflected by one of the generated chromophores or chromophores.
2. The analysis system (10) as defined in claim 1 wherein reaction of the analyte results in the chromophore precursor generating a chromophore to produce the measurable signal or the chromophore producing the measurable signal as a result of: i) a pH change, ii) an oxidation reaction, iii) a reduction reaction, iv) binding to the analyte, or v) forming a complex with the analyte.
3. The analysis system (10) as defined in claim 1 wherein the test device (18) further includes a readable location (36) configured to receive the generated chromophore or chromophore after a corresponding analyte reacts or interacts with the chromophore.
4. The analysis system (10) as defined in any of the preceding claims wherein the test device (18) includes multiple chambers (36), wherein each chamber (36) includes a different one of the plurality of test formats for a predetermined analyte, wherein the test device (18) is aligned with the monolithic analyzer (20) such that each window (22) is aligned with a corresponding chamber (36), and wherein the waveband detectable by each window (22) matches the wavelength absorbed, emitted or reflected by the chromophore generated or present in the corresponding chamber (36).
5. The analysis system (10) as defined in claim 4 wherein the multiple chambers (36) are parallel to one another, thereby enabling multiple, parallel analysis of a plurality of different analytes simultaneously.
6. The analysis system (10) as defined in any of claims 1 through 3 wherein the test device includes a single channel (48 or 50) that connects to a single chamber (36) having therein each of the pre-selected chromophore precursors or chromophores, and wherein the test device (18) is aligned with the monolithic analyzer (20) such that all windows (22) are exposed to the chamber (36) simultaneously.
7. The analysis system (10) as defined in any of claims 1 through 3 wherein the test device (18) includes a plurality of locations (36), each of which is configured to have one of the chromophore precursors or chromophores therein, wherein the plurality of locations is selected from cuvettes, depressions in a substrate, or wells.
8. The analysis system (10) as defined in any of the preceding claims wherein the analyzer (20) is positioned with respect to incident light such that the analyzer (20) is operational in a fluorescence mode, reflectance mode, transmittance mode, or an absorption mode.
9. The analysis system (10) as defined in any of the preceding claims wherein each window includes: a photodetector (14) configured to detect the wavelength absorbed, emitted or reflected by the chromophore generated or present in a corresponding chamber (36) of the test device (18); and at least one filter (16) configured to selectively enable wavelengths within a waveband absorbed, emitted or reflected by the chromophore to pass through to the photodetector (14) while rejecting wavelengths within other wavebands.
10. The analysis system (10) as defined in any of the preceding claims wherein the test device (18) is selected from a test strip, a coupon with a lateral flow matrix, or combinations thereof.
11. A method for enhancing sensing, the method comprising: selecting a set of chromophore precursors or chromophores such that each chromophore precursor in the set generates, upon interacting with an analyte, a respective chromophore which absorbs, emits, or reflects a wavelength that matches a wavelength or is within a waveband detectable by one of a plurality of separate windows (22) of an analyzer (20), or each chromophore in the set, upon interacting with an analyte, absorbs, emits, or reflects a wavelength that matches a wavelength or is within a waveband detectable by one of a plurality of separate windows (220 of an analyzer (20); and incorporating the set into a test device (18).
12. The method as defined in claim 11 wherein the test device (18) includes multiple chambers (36), and wherein the method further comprises: incorporating each of the chromophore precursors or chromophores into a different chamber (36) of the test device (18); and aligning the test device (28) with the analyzer (20) such that the wavelength emitted by the chromophore in each chamber (36) is detectable by a corresponding one of the plurality of separate windows (22).
13. The method as defined in claim 12 wherein the multiple chambers (36) are parallel to one another, and wherein the method further comprises performing parallel simultaneous sensing of a plurality of different analytes.
14. The method as defined in any of claims 12 or 13 wherein incorporating the set into the test device (18) includes adding one of the chromophore precursors or chromophores to a corresponding one of a plurality of locations (36) defined in or on the test device (18).
15. The method as defined in any of claims 12 through 14 wherein each generated or present chromophore is selected from the group consisting of Ca2+ arsenazo III complex; 2-chloro-p-nitrophenol; red quinoneimine dye; nicotinamide adenine dinucleotide (NAD+); NADH + H+; o-nitrophenyl and galactose; a streptavidin conjugate dye; R-phycoehthrin; 4,4-difluoro-5,7-dimethyl-4-bora-3a,4a- diaza-s-indacene; 5,5',6,6'-tetrachloro-1 ,1',3,3'- tetraethylbenzimidazolylcarbocyanine iodide.
Priority Applications (1)
| Application Number | Priority Date | Filing Date | Title |
|---|---|---|---|
| PCT/US2009/042272 WO2010126514A1 (en) | 2009-04-30 | 2009-04-30 | An analysis system including a pre-selected combination of cromophore precursors or chromophores |
Applications Claiming Priority (1)
| Application Number | Priority Date | Filing Date | Title |
|---|---|---|---|
| PCT/US2009/042272 WO2010126514A1 (en) | 2009-04-30 | 2009-04-30 | An analysis system including a pre-selected combination of cromophore precursors or chromophores |
Publications (1)
| Publication Number | Publication Date |
|---|---|
| WO2010126514A1 true WO2010126514A1 (en) | 2010-11-04 |
Family
ID=43032450
Family Applications (1)
| Application Number | Title | Priority Date | Filing Date |
|---|---|---|---|
| PCT/US2009/042272 Ceased WO2010126514A1 (en) | 2009-04-30 | 2009-04-30 | An analysis system including a pre-selected combination of cromophore precursors or chromophores |
Country Status (1)
| Country | Link |
|---|---|
| WO (1) | WO2010126514A1 (en) |
Citations (3)
| Publication number | Priority date | Publication date | Assignee | Title |
|---|---|---|---|---|
| WO1991006859A1 (en) * | 1989-10-25 | 1991-05-16 | Jaffe Russell M | Enzyme assay and assay kit to measure cellular activation |
| WO1992003579A1 (en) * | 1990-08-16 | 1992-03-05 | Diagnostic Biotechnology, Inc. | An augmented western blot format and immunoassay for detection of viral antibodies |
| US20020022239A1 (en) * | 1999-03-19 | 2002-02-21 | John Clark Lagarias | Phytofluors as fluorescent labels |
-
2009
- 2009-04-30 WO PCT/US2009/042272 patent/WO2010126514A1/en not_active Ceased
Patent Citations (3)
| Publication number | Priority date | Publication date | Assignee | Title |
|---|---|---|---|---|
| WO1991006859A1 (en) * | 1989-10-25 | 1991-05-16 | Jaffe Russell M | Enzyme assay and assay kit to measure cellular activation |
| WO1992003579A1 (en) * | 1990-08-16 | 1992-03-05 | Diagnostic Biotechnology, Inc. | An augmented western blot format and immunoassay for detection of viral antibodies |
| US20020022239A1 (en) * | 1999-03-19 | 2002-02-21 | John Clark Lagarias | Phytofluors as fluorescent labels |
Similar Documents
| Publication | Publication Date | Title |
|---|---|---|
| Passos et al. | Detection in UV-visible spectrophotometry: Detectors, detection systems, and detection strategies | |
| EP1634062B1 (en) | Readhead for optical inspection apparatus | |
| US7869009B2 (en) | Method for determining an analyte concentration in a fluid | |
| US20190226985A1 (en) | Analytical test device | |
| TW200533908A (en) | A handheld device with a disposable element for chemical analysis of multiple analytes | |
| KR20080016603A (en) | Analytical Methods of Biochemicals | |
| US20050032089A1 (en) | Sample preparation for colorimetric and fluorescent assays as implemented on optical analysis discs | |
| US20070166721A1 (en) | Fluidic circuits, methods and apparatus for use of whole blood samples in colorimetric assays | |
| US20250389657A1 (en) | Compact detection system | |
| US20060128034A1 (en) | Diagnostic test using gated measurement of fluorescence from quantum dots | |
| WO2010126514A1 (en) | An analysis system including a pre-selected combination of cromophore precursors or chromophores | |
| GB2150704A (en) | Filter assembly for fluorescence spectroscopy | |
| Squillante | Applications of fiber-optic evanescent wave spectroscopy | |
| WO2019122872A1 (en) | Apparatus | |
| RU2797009C2 (en) | Devices and method for measuring analyte concentration in physiological fluid sample | |
| RU2797009C9 (en) | Devices and method for measuring analyte concentration in physiological fluid sample | |
| US20210311027A1 (en) | Devices and method for measuring an analyte concentration in a sample of bodily fluid | |
| Pereira et al. | Development of an image-based fluorometer with smartphone control for paper analytical devices | |
| WO2024033027A1 (en) | Reader system for a lateral flow test and according method | |
| HK40050710A (en) | Devices and method for measuring an analyte concentration in a sample of bodily fluid | |
| Vo-Dinh | In Vitro Clinical Diagnostic Instrumentation |
Legal Events
| Date | Code | Title | Description |
|---|---|---|---|
| 121 | Ep: the epo has been informed by wipo that ep was designated in this application |
Ref document number: 09844169 Country of ref document: EP Kind code of ref document: A1 |
|
| NENP | Non-entry into the national phase |
Ref country code: DE |
|
| 122 | Ep: pct application non-entry in european phase |
Ref document number: 09844169 Country of ref document: EP Kind code of ref document: A1 |