WO2010119752A1 - 緊急エリア提示装置及び緊急エリア提示方法 - Google Patents
緊急エリア提示装置及び緊急エリア提示方法 Download PDFInfo
- Publication number
- WO2010119752A1 WO2010119752A1 PCT/JP2010/055003 JP2010055003W WO2010119752A1 WO 2010119752 A1 WO2010119752 A1 WO 2010119752A1 JP 2010055003 W JP2010055003 W JP 2010055003W WO 2010119752 A1 WO2010119752 A1 WO 2010119752A1
- Authority
- WO
- WIPO (PCT)
- Prior art keywords
- emergency
- information
- emergency call
- area
- mobile terminal
- Prior art date
- Legal status (The legal status is an assumption and is not a legal conclusion. Google has not performed a legal analysis and makes no representation as to the accuracy of the status listed.)
- Ceased
Links
Images


Classifications
-
- G—PHYSICS
- G08—SIGNALLING
- G08B—SIGNALLING SYSTEMS, e.g. PERSONAL CALLING SYSTEMS; ORDER TELEGRAPHS; ALARM SYSTEMS
- G08B25/00—Alarm systems in which the location of the alarm condition is signalled to a central station, e.g. fire or police telegraphic systems
- G08B25/14—Central alarm receiver or annunciator arrangements
-
- G—PHYSICS
- G08—SIGNALLING
- G08B—SIGNALLING SYSTEMS, e.g. PERSONAL CALLING SYSTEMS; ORDER TELEGRAPHS; ALARM SYSTEMS
- G08B31/00—Predictive alarm systems characterised by extrapolation or other computation using updated historic data
Definitions
- the present invention relates to an emergency area presentation device that provides information about an area from which an emergency call is transmitted based on an emergency call transmitted from a mobile terminal, and an emergency area presentation method performed by the emergency area presentation device.
- Patent Literature 1 a system for performing communication based on a communication history at a detailed position of a mobile terminal.
- the mobile terminal selects a communication condition according to the position of the mobile terminal from a plurality of pieces of communication history information stored in the information storage device, and the communication relay device based on the selected communication condition
- a mobile communication system that communicates with the Internet is disclosed.
- the present invention has been made to solve the above-described problems, and an emergency area presentation device and an emergency area capable of providing information indicating the frequency of sending emergency calls for each region based on the communication history of the mobile terminal
- the purpose is to provide an area presentation method.
- the inventor intensively studied to achieve the above-described object, and an emergency area presentation device and an emergency call transmission capable of providing information on a region indicating the frequency of transmission of an emergency call based on the communication history of the mobile terminal Invented an information provision method.
- the emergency area presentation device is an emergency area presentation device that provides information related to an area from which an emergency call is transmitted based on an emergency call transmitted from a mobile terminal, and is transmitted from the mobile terminal.
- the receiving means for receiving emergency call information including the current location information of the mobile terminal and the current location information included in the emergency call information received by the receiving means, the frequency of transmission of emergency call information in each of a plurality of predetermined areas
- generating means for generating emergency area information and display means for displaying the emergency area information generated by the generating means.
- the emergency area presentation device first receives emergency call information transmitted from a mobile terminal, and based on the current location information included in the emergency call information, the frequency of transmission of emergency call information in each of a plurality of predetermined areas The emergency area information indicating is generated. Then, the emergency area presentation device displays this emergency area information. For this reason, it is possible to provide emergency area information, which is information indicating the transmission frequency of emergency calls for each predetermined area as a region, based on the communication history of the mobile terminal such as transmission of emergency call information.
- the emergency call information includes time information indicating a time at which the emergency call information is transmitted, and the generation unit includes a plurality of pieces of information based on current location information and time information included in the emergency call information received by the reception unit. It is also preferable to generate emergency area information indicating the transmission frequency of emergency call information in each of the predetermined areas for each of a plurality of predetermined time zones.
- the emergency area presenting device displays the emergency call information transmission frequency in each of the plurality of predetermined areas for each of the plurality of predetermined time zones based on the current location information and time information included in the emergency call information. Generate information. Therefore, it is possible to provide emergency area information indicating the frequency of sending emergency calls for each of a plurality of predetermined time zones.
- the emergency call information includes identification information for identifying the mobile terminal that transmitted the emergency call information, and the emergency call information for each mobile terminal based on the identification information included in the emergency call information received by the receiving unit.
- the calculation means further includes a calculation means for calculating the number of transmissions transmitted, and the generation means includes the remaining information excluding the current location information included in the emergency call information transmitted from the mobile terminal whose number of transmissions calculated by the calculation means is a predetermined number or more. It is also preferable to generate emergency area information based on the current location information.
- the emergency area presentation device calculates the number of times of transmission of the emergency call information for each of the mobile terminals based on the identification information included in the emergency call information, and the number of times of transmission is greater than or equal to a predetermined number of times.
- the emergency area information is generated based on the remaining current location information excluding the current location information included in the emergency call information transmitted from. In this way, by excluding emergency call information transmitted from a mobile terminal whose emergency call information is transmitted a predetermined number of times or more, for example, emergency call information transmitted from a mischievous mobile terminal having a relatively large number of transmissions Can be excluded. As a result, it is possible to provide emergency area information generated with higher accuracy.
- the generation means based on the time information and the identification information included in the emergency call information received by the reception means, the more the number of mobile terminals identified by the different identification information in the same predetermined time zone, It is also preferable to generate emergency area information by performing weighting to reduce the addition number to be added to the transmission frequency of the emergency call information transmitted from the mobile terminal in the same predetermined time zone.
- the emergency area presenting device increases the number of mobile terminals identified by the different identification information in the same predetermined time zone based on the time information and identification information included in the emergency call information.
- Emergency area information is generated by weighting to reduce the addition number to be added to the transmission frequency of the emergency call information transmitted from the mobile terminal in the predetermined time period.
- weighting is performed so that the number of additions added to the transmission frequency of the emergency call information transmitted from the mobile terminal is reduced. It is possible to prevent an increase in the transmission frequency due to a plurality of emergency calls related to the situation. As a result, it is possible to provide emergency area information generated with higher accuracy.
- the emergency area presenting method is an emergency area presenting method performed by an emergency area presenting device that provides information related to an area from which an emergency call is transmitted based on an emergency call transmitted from a mobile terminal.
- the emergency area presentation device receives emergency call information including the current location information of the mobile terminal transmitted from the mobile terminal, and based on the current location information included in the emergency call information received in the reception step, a plurality of A generation step in which the emergency area presentation device generates emergency area information indicating the transmission frequency of emergency call information in each of the predetermined areas, and a display step in which the emergency area presentation device displays the emergency area information generated in the generation step. It is characterized by having.
- emergency area presenting method first, emergency call information transmitted from a mobile terminal is received, and based on the current location information included in the emergency call information, the frequency of emergency call information transmission in each of a plurality of predetermined areas The emergency area information indicating is generated. Then, the emergency area presentation device displays this emergency area information. For this reason, it is possible to provide emergency area information, which is information indicating the transmission frequency of emergency calls for each predetermined area as a region, based on the communication history of the mobile terminal such as transmission of emergency call information.
- an emergency area presentation device and an emergency area presentation method capable of providing information indicating the frequency of emergency call transmission for each region based on the communication history of the mobile terminal.
- FIG. 1 is a configuration diagram for explaining an outline of the overall configuration of a system including the emergency area presentation device P.
- the emergency area presentation device P is configured so that each of a plurality of predetermined areas is based on report data (emergency call information) related to an emergency call (eg, 110, 118, 119, etc.) transmitted from a mobile terminal such as a mobile phone terminal.
- report data emergency call information
- an emergency call eg, 110, 118, 119, etc.
- This is a device that provides a crime map (that is, emergency area information indicating a crime-prone area) indicating the frequency of transmission of emergency calls and the transmission occurrence rate.
- the report data is data that can be acquired and owned by a telecommunications carrier that provides a communication service to the user of the mobile terminal.
- current location information about the current location of the mobile terminal that transmitted the report data or report data Includes time information indicating the time at which the transmission is performed, a user identifier (identification information) described later that uniquely identifies the mobile terminal that transmitted the report data, and the like.
- the above-mentioned current location information is acquired by using, for example, a GPS (Global Positioning System, that is, a global positioning system) or a position positioning system using a mobile phone terminal.
- GPS Global Positioning System
- the emergency area presentation device P includes the sector information storage device C1, the terminal location information storage device C2, the GPS data storage device C3, the map information storage device C4, the customer information storage device C5, etc.
- the above-described crime map is created by receiving various data including the report data and provided to the company D1, the government office D2, the individual D3, and the like.
- the sector information storage device C1 is a mobile communication switching system such as MMS / xGSN, and is a device that transmits sector data to the emergency area presentation device P.
- the terminal location information storage device C2 is a provider authentication connection management device such as EBSCP (External Business user Service Control Point), and transmits current location information such as i area (registered trademark) -GPS data to the emergency area presentation device P. It is a device to do.
- the GPS data storage device C3 is a packet communication service execution system such as CiRCUS, for example, and is a device that transmits current location information such as ATF-GPS data to the emergency area presentation device P.
- the emergency area presentation device P includes a social sensor unit U1 (receiving means), a petamining unit U2 (ie, PMU. Generating means), a mobile demography unit U3 (ie, MDU. Generating means), and a visualization solution unit U4. (I.e., VSU, display means).
- the main units having the main functions of the emergency area presentation device P are the mobile demography unit U3 and the visualization solution unit U4. However, the main unit may be configured by adding a petamining unit U2.
- the social sensor unit U1 is a unit of a server group for receiving various data including the notification data.
- the social sensor unit U1 includes at least several social sensor servers. Each of these social sensor servers receives various data from each of the sector information storage device C1, the terminal location information storage device C2, and the GPS data storage device C3.
- the petamining unit U2 is a unit of a server group for identifying the mobile terminal that has made an emergency call based on the received various data.
- the petamining unit U2 includes at least several dozen petamining servers. Each of these petamining servers receives various data from the social sensor server.
- the mobile demography unit U3 is a server group unit for generating a crime map for each of a plurality of predetermined time zones based on the specified mobile terminal.
- the mobile demography unit U3 includes at least several mobile demography servers. Each of these mobile demography servers receives various data from the petamining server.
- the visualization solution unit U4 is a unit of a server group for transmitting the generated crime map to a terminal used by each of the company D1, the government office D2, the individual D3, etc., and providing and displaying it.
- the visualization solution unit U4 includes a plurality of visualization solution servers. Each of these visualization solution servers receives various data from the mobile demography server.
- the company D1 performs store development, product development, and the like based on the received crime map.
- the government office D2 performs national census, road traffic survey, disaster countermeasure, environmental countermeasure, etc. based on the received crime map.
- the individual D3 grasps information related to store congestion and a forecast related to a local area that is likely to be popular based on the received crime map.
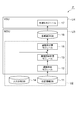
- FIG. 2 is a functional configuration diagram for explaining a main functional configuration of the emergency area presentation device P
- FIG. 3 is a physical configuration diagram for explaining a physical configuration of the emergency area presentation device P.
- the emergency area presentation device P communicates with CPUP01 (Central Processing Unit) as physical components, RAMP02 (Random Access Memory) and ROMP03 (Read Only Memory) as main storage devices.
- CPUP01 Central Processing Unit
- RAMP02 Random Access Memory
- ROMP03 Read Only Memory
- a computer including hardware such as a communication module P04 and an auxiliary storage device P05 such as a hard disk.
- the function of the emergency area presentation device P is exhibited by the operation of these components.
- the emergency area presentation device P includes, as main functional components, a mobile demography unit U3, a visualization solution unit U4, a location information DB 11 (database), and a population distribution DB 14 (database). ).
- the mobile demography unit U3 includes a report extraction module 12, a report count calculation module 13 (calculation means), a report rate calculation module 15, and various statistical DBs 16 (database), and a visualization solution unit U4. Is configured to have a visualization module 17.
- the location information DB 11 is a database that stores location information by specifying the location of a mobile terminal that has made an emergency call or normal transmission as point data based on various data received by the social sensor unit U1.
- the notification extraction module 12 uses an emergency notification flag indicating whether or not an emergency notification has been transmitted out of point data including a user identifier (identification information) described later that uniquely identifies a mobile terminal whose position is specified. This is a module that extracts and reads the point data that indicates the execution of sending the report.
- the contents indicated by the emergency notification flag are determined by ELIS (Emergency Location Immediate Service, ie, emergency location quick service) or ELRS (Emergency Location Reporting Service, ie, emergency location reporting service).
- ELIS Electronic Location Immediate Service
- ELRS Emergency Location Reporting Service
- the point data extracted and read is stored in a point data table, which will be described later, included in the report extraction module 12.
- the number-of-reports calculation module 13 determines each of the mobile terminals based on the point data extracted as the emergency notification flag indicates execution of the transmission of the emergency call and a user identifier described later included in the point data. It is a module that performs a calculation process such as the sum of the number of outgoing calls (that is, the number of emergency notification transmissions).
- the number-of-reports calculation module 13 is uniquely identified by different user identifiers in the same predetermined time zone (for example, the morning time zone or the afternoon time zone) based on time information included in the report data and a user identifier described later. As the number of mobile terminals identified in (2) increases, the number of counts (that is, the number of additions) counted by adding to the number of emergency notification transmissions of the notification data transmitted from the mobile terminal in the same predetermined time period is reduced. Perform weighting.
- weighting for example, a normal count (for example, 1) and a numerical value (here, 0.3) obtained by integrating a predetermined numerical value (for example, 0.3) smaller than 1 are counted for addition. Weighting is performed by determining the number (here, 0.3) and adding and counting. When further counting is performed, a numerical value (here, 0. 0) obtained by integrating a normal count number (here, 1) and a numerical value (here, 0.2) smaller than the predetermined numerical value. 2) is determined as a count number for addition (here, 0.2), and weighting is performed by adding and counting.
- the population distribution DB 14 is a database that stores population distribution data in each area managed by the above-mentioned communication carrier.
- the population distribution data in each area is stored in a population distribution table by town chome described later in the population distribution DB 14 or in a population distribution table by mesh described in the population distribution DB 14 described later.
- the population distribution data by town chome and the population distribution data by mesh may be data relating to the population distribution obtained by, for example, the national census, etc., and the population distribution based on the location information of the mobile terminal stored in the location information DB 11 It may be data regarding.
- the report rate calculation module 15 transmits an emergency report for each area while referring to the population distribution data stored in the population distribution DB 14 based on the total number of transmissions obtained by the above calculation process.
- This is a module for generating various statistical information such as a crime map by performing statistical calculation such as a notification rate (that is, an emergency notification occurrence rate).
- the crime map may be generated for each street or for each mesh.
- the various statistics DB 16 is a database that stores various statistical information such as a generated crime map.
- Various statistics DB16 has the emergency call occurrence rate table classified by town chome and the emergency call occurrence rate table classified by mesh mentioned later.
- Various statistical information such as the generated crime map is stored in this town-specific emergency call occurrence rate table or mesh-specific emergency call occurrence rate table.
- the visualization module 17 is a module that edits various statistical information such as stored crime maps into visualized information, and transmits the information to terminals used by the company D1, the government office D2, the individual D3, and the like.
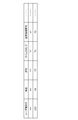
- FIG. 4 is a table configuration diagram showing a table configuration of the point data table.
- the point data table has, for example, a user identifier, latitude, longitude, time stamp, position information type, etc., which will be described later, as data items.
- the user identifier stores an identifier for uniquely identifying the mobile terminal used by the user, such as “111”. In each of the latitude and longitude, for example, “X1” and “Y1”, respectively, the latitude and longitude of the current location of the mobile terminal specified by using the GPS are stored.
- the time stamp for example, “T1”
- the time when the report data is transmitted in the mobile terminal specified by the user identifier is stored.
- the position information type for example, “V1”
- flag information indicating whether or not the content transmitted from the mobile terminal is an emergency call is stored.
- the location information type may store the type of emergency call (for example, 110, 118, 119, etc.).
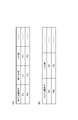
- FIG. Fig.5 (a) is a table block diagram which shows the table structure of the population distribution table according to town chome.
- the town-specific population distribution table includes, for example, a town-chome identifier, a town-chome name, and the number of populations as data items.
- the town chome identifier stores an identifier for uniquely identifying the town chome, such as “N1”.
- N1 the name of the street identified by the street identifier
- L1 the name of the street identified by the street identifier
- “P1” stores the number of populations in the area identified by the town chome identifier.
- FIG. 5B is a table configuration diagram showing a table configuration of the mesh-specific population distribution table.
- the mesh-specific population distribution table includes, for example, mesh identifiers, population numbers, and the like as data items.
- the mesh identifier stores an identifier for uniquely identifying each mesh when the regional area is divided into meshes, such as “M1”. For example, “Q1” stores the number of populations in the area identified by the mesh identifier.
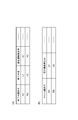
- FIG. Fig.6 (a) is a table block diagram which shows the table structure of the emergency report occurrence rate table according to town chome.
- the emergency call occurrence rate table by town chome has, for example, a town chome identifier, a town chome name, an emergency call occurrence rate, and the like as data items.
- the town chome identifier stores an identifier for uniquely identifying the town chome, such as “N1”.
- the street name for example, the name of the street identified by the street identifier is stored, such as “L1”.
- the emergency call occurrence rate stores the emergency call occurrence rate at which the emergency call is transmitted in the area identified by the town chome identifier, for example, “A1”.
- FIG.6 (b) is a table block diagram which shows the table structure of the emergency notification occurrence rate table classified by mesh.
- the mesh-specific emergency call occurrence rate table includes, for example, a mesh identifier and an emergency call occurrence rate as data items.
- the mesh identifier stores an identifier for uniquely identifying each mesh when the regional area is divided into meshes, such as “M1”.
- the emergency call occurrence rate stores an emergency call occurrence rate at which an emergency call is transmitted in the area identified by the mesh identifier, for example, “Q1”.
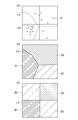
- FIG. 7 is an explanatory diagram for explaining an example of a crime map.
- the report extraction module 12 extracts point data in which execution of an emergency call is indicated by an emergency notification flag from point data that is data including a user identifier. .
- the extracted point data is shown as a plurality of points P on the map, as shown in FIG.
- a broken line La indicates a town chome boundary that is a boundary between town chomes
- a cross-shaped solid line Lb indicates a mesh field that is a boundary between meshes.
- the area area shown in FIG. 7A is divided into three parts by the town-chome world and is equally divided into four parts by the mesh world.
- the number-of-reports calculation module 13 performs a calculation process such as the total number of times the emergency call has been transmitted, and the notification rate calculation module 15 performs various statistical information such as a crime map based on the total number of times of transmission. Is generated. Then, the visualization module 17 edits various statistical information such as a crime map into visualized information.
- various statistical information such as a crime map stored in the emergency call occurrence rate table by town chome is divided into three regional areas divided by the town chome circle indicated by the broken line La.
- the occurrence frequency in each of A1, A2 and A3 is shown as a criminal map after analysis visualized by patterns and colors. That is, the number of point data included in each of the area areas A1, A2, and A3 is 12, 6, and 2, and the occurrence frequency for the area of the area area A1 is higher than the occurrence frequency for each area of the area areas A2 and A3. From the calculation result of high, the area A1 is visualized by a red pattern as the color having the highest occurrence frequency.
- the area A2 is visualized with a yellow pattern as the color with the next highest occurrence frequency.
- the remaining area A3 is visualized by a green pattern as the color with the lowest occurrence frequency.
- the visualized crime map may indicate the transmission frequency of the notification data for each of a plurality of predetermined time zones (for example, each of the morning time zone and the afternoon time zone).
- various statistical information such as a crime map stored in the mesh emergency call occurrence rate table is divided into four regional areas B1 and B2 divided by the mesh field indicated by the solid line Lb. , B3, and B4, the frequency of occurrence is shown as a criminal map after analysis visualized by patterns and colors. That is, the number of point data included in each of the area areas B1, B2, B3, and B4 is 12, 4, 2, and 2, and the occurrence frequency for the area of the area area B1 is that of each of the area areas B2, B3, and B4. From the calculation result that the occurrence frequency is higher than the area, the area B1 is visualized by a red pattern as the color having the highest occurrence frequency.
- the area area B2 is visualized by a yellow pattern as the color having the next highest occurrence frequency. . Then, the remaining area areas B3 and B4 are visualized by a green pattern as the color with the lowest occurrence frequency.
- the visualized crime map may indicate the transmission frequency of the notification data for each of a plurality of predetermined time zones (for example, each of the morning time zone and the afternoon time zone).
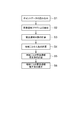
- FIG. 8 is a sequence diagram showing an overall flow of the emergency area presentation process executed by the emergency area presentation device P
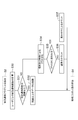
- FIG. 9 is a sequence diagram showing a part of the emergency area presentation process in detail.
- the report extraction module 12 reads point data that is data including a user identifier (step S1, receiving step). Then, the message extraction module 12 extracts and reads the point data indicated by the emergency notification flag that the emergency notification is transmitted from the point data (step S2).
- the number-of-reports calculation module 13 calculates the sum of the number of emergency notifications for which an emergency call has been sent, based on the point data extracted that the emergency notification flag indicates that an emergency call has been issued. Is performed (step S3). Then, the notification rate calculation module 15 calculates the number of people for each area based on the population distribution data stored in the population distribution DB 14 (step S4).
- the report rate calculation module 15 calculates statistics such as the emergency report occurrence rate for each area. Calculation is performed to generate various statistical information such as a crime map (step S5, generation step). The crime map may be generated for each street or for each mesh. Then, the visualization module 17 edits various statistical information such as a crime map stored in various statistical DBs 16 into visualized information, and transmits it to terminals used by the company D1, the government office D2, the individual D3, etc. (Step S6, display step). Thereby, the emergency call occurrence rate for each area is displayed.
- the number-of-reports calculation module 13 performs a calculation process such as the total number of emergency notifications for each user of the mobile terminal (step S30). Then, the number-of-reports calculation module 13 determines, for each user of the mobile terminal, whether or not the number of emergency notifications is a predetermined number (that is, a threshold value) or more (step S31). When it is determined that the number of emergency notifications is equal to or greater than the threshold, the notification count calculation module 13 determines that the data related to the user who made the emergency notifications equal to or greater than the threshold is a mischievous notification and deletes it (step S32), the process proceeds to step S4. On the other hand, when it is determined that the number of emergency notifications is not greater than or equal to the threshold (that is, less than the threshold), the process proceeds to step S34 described later.
- step S34 the number-of-reports calculation module 13 is used for sorting and organizing (that is, clustering) according to a predetermined place (that is, a regional area) and a predetermined time zone (for example, the morning time zone and the afternoon time zone). Determine the criteria.
- a predetermined place that is, a regional area
- a predetermined time zone for example, the morning time zone and the afternoon time zone.
- the report count calculation module 13 determines whether or not the extracted data can be newly included in a cluster that already contains one or more point data (step S35). When it is determined that it cannot be newly included in a cluster that already contains one or more point data, the process proceeds to step S36 described later. On the other hand, if it is determined that it can be newly included in a cluster that already contains one or more point data, the process proceeds to step S37 described later.
- step S36 the number-of-reports calculation module 13 performs a process of counting by adding a normal count to the number of emergency notification transmissions in the corresponding cluster. And it transfers to said step S4.
- step S37 the number-of-reports calculation module 13 performs a process of adding and counting by reducing the number of counts added to the number of emergency notification transmissions in the corresponding cluster. And it transfers to said step S4.
- the emergency area presentation device P first receives report data transmitted from the mobile terminal, and reports data in each of a plurality of predetermined areas based on the current location information included in the report data.
- the crime map which shows the transmission frequency of is generated.
- the emergency area presentation apparatus P displays this crime map. For this reason, it is possible to provide various statistical information such as a crime map, which is information indicating the frequency of emergency call transmission for each predetermined area, based on the communication history of the mobile terminal such as transmission of report data.
- the emergency area presentation device P generates a crime map indicating the transmission frequency of the emergency call information in each of the plurality of predetermined areas for each of the plurality of predetermined time zones, based on the current location information and time information included in the report data. To do. For this reason, it is possible to provide a crime map indicating the frequency of emergency call transmission for each of a plurality of predetermined time periods.
- the emergency area presentation device P calculates the number of emergency notification transmissions for each of the mobile terminals based on the identification information included in the notification data, and the notification transmitted from the mobile terminal whose emergency notification transmission count is a predetermined number or more A crime map is generated based on the remaining current location information excluding the data. In this way, by excluding report data transmitted from a mobile terminal whose emergency notification transmission count is a predetermined number or more, for example, report data transmitted from a mischievous mobile terminal having a relatively large number of emergency notification transmission counts is excluded. be able to. As a result, it is possible to provide emergency area information generated with higher accuracy.
- the emergency area presenting device P has the same information as the number of mobile terminals uniquely identified by different user identifiers in the same predetermined time zone increases based on the time information and user identifier included in the notification data.
- the crime map is generated by performing weighting to reduce the number of counts to be added to the transmission frequency of the notification data transmitted from the mobile terminal in the predetermined time period.
- weighting is performed to reduce the number of counts to be added to the transmission frequency of the notification data transmitted from the mobile terminal. It is possible to prevent an increase in the transmission frequency due to duplicate emergency calls. As a result, it is possible to provide emergency area information generated with higher accuracy.
- the mobile demography unit U3 includes a notification extraction module 12, a notification count calculation module 13, a notification rate calculation module 15, and various statistical DBs 16.
- the position information DB 11, the report extraction module 12, the report count calculation module 13, the population distribution DB 14, and the report rate calculation module 15 are connected to the petamining unit U 2. It is good also as a mode to constitute.
- an emergency area presentation device and an emergency area presentation method capable of providing information indicating the frequency of emergency call transmission for each region based on the communication history of the mobile terminal.
Landscapes
- Business, Economics & Management (AREA)
- Emergency Management (AREA)
- Physics & Mathematics (AREA)
- General Physics & Mathematics (AREA)
- Engineering & Computer Science (AREA)
- Computing Systems (AREA)
- Telephonic Communication Services (AREA)
- Alarm Systems (AREA)
- Mobile Radio Communication Systems (AREA)
Abstract
移動端末の通信履歴に基づいた、緊急通報の発信頻度を地域ごとに示す情報の提供が可能な緊急エリア提示装置及び緊急エリア提示方法を提供する。緊急エリア提示装置Pは、移動端末から発信された緊急通報に基づいて、当該緊急通報が発信されたエリアに関する情報を提供する緊急エリア提示装置であって、移動端末から送信された、当該移動端末の現在地情報を含む緊急通報情報を受信する社会センサユニットU1と、受信された緊急通報情報が含む現在地情報に基づいて、複数の所定エリアのそれぞれにおける緊急通報情報の送信頻度を示す犯罪マップを生成するペタマイニングユニットU2及びモバイルデモグラフィーユニットU3と、生成された犯罪マップを表示する可視化ソリューションユニットU4と、を備える。
Description
本発明は、移動端末から発信された緊急通報に基づいて、当該緊急通報が発信されたエリアに関する情報を提供する緊急エリア提示装置と、当該緊急エリア提示装置が行なう緊急エリア提示方法に関する。
従来、移動端末の詳細な位置での通信履歴に基づいて通信を行うシステムが提案されている。例えば、特許文献1には、移動端末が、情報記憶装置が記憶する複数の通信履歴情報の中から当該移動端末の位置に応じた通信条件を選択し、選択した通信条件に基づいて通信中継装置と通信を行う移動通信システムが開示されている。
近年、移動端末の通信履歴に基づいた、緊急通報の発信頻度を地域ごとに把握できるようにすることの要請が高まっている。しかしながら、上記の特許文献1に記載の移動通信システムでは、移動端末の通信履歴に基づいた、緊急通報の発信頻度を地域ごとに示す情報の提供に関してはなんら考慮されていないため、利便性が低い。
そこで本発明は、上記問題点を解消する為になされたものであり、移動端末の通信履歴に基づいた、緊急通報の発信頻度を地域ごとに示す情報の提供が可能な緊急エリア提示装置及び緊急エリア提示方法を提供することを目的とする。
発明者は、上記した目的を達成するため鋭意検討し、移動端末の通信履歴に基づいた、緊急通報が発信された発信頻度を示す地域に関する情報の提供が可能な緊急エリア提示装置及び緊急通報発信情報提供方法を発明した。
即ち、本発明に係る緊急エリア提示装置は、移動端末から発信された緊急通報に基づいて、当該緊急通報が発信されたエリアに関する情報を提供する緊急エリア提示装置であって、移動端末から送信された、当該移動端末の現在地情報を含む緊急通報情報を受信する受信手段と、受信手段により受信された緊急通報情報が含む現在地情報に基づいて、複数の所定エリアのそれぞれにおける緊急通報情報の送信頻度を示す緊急エリア情報を生成する生成手段と、生成手段により生成された緊急エリア情報を表示する表示手段と、を備えることを特徴とする。
本発明に係る緊急エリア提示装置は、まず、移動端末から送信された緊急通報情報を受信し、この緊急通報情報が含む現在地情報に基づいて、複数の所定エリアのそれぞれにおける緊急通報情報の送信頻度を示す緊急エリア情報を生成する。そして、緊急エリア提示装置は、この緊急エリア情報を表示する。このため、緊急通報情報の送信といった移動端末の通信履歴に基づいた、緊急通報の発信頻度を地域としての所定エリアごとに示す情報である緊急エリア情報の提供が可能になる。
また、緊急通報情報は、当該緊急通報情報の送信が行なわれた時刻を示す時刻情報を含み、生成手段は、受信手段により受信された緊急通報情報が含む現在地情報及び時刻情報に基づいて、複数の所定エリアのそれぞれにおける緊急通報情報の送信頻度を、複数の所定時間帯のそれぞれについて示す緊急エリア情報を生成するのも好ましい。
この構成により、緊急エリア提示装置は、緊急通報情報が含む現在地情報及び時刻情報に基づいて、複数の所定エリアのそれぞれにおける緊急通報情報の送信頻度を、複数の所定時間帯のそれぞれについて示す緊急エリア情報を生成する。このため、緊急通報の発信頻度を、複数の所定時間帯のそれぞれについて示す緊急エリア情報の提供が可能になる。
また、緊急通報情報は、当該緊急通報情報を送信した移動端末を識別する識別情報を含み、受信手段により受信された緊急通報情報が含む識別情報に基づいて、移動端末のそれぞれについて当該緊急通報情報を送信した送信回数を計算する計算手段を更に備え、生成手段は、計算手段により計算された送信回数が所定回数以上である移動端末から送信された緊急通報情報が含む現在地情報を除いた残りの現在地情報に基づいて、緊急エリア情報を生成するのも好ましい。
この構成により、緊急エリア提示装置は、緊急通報情報が含む識別情報に基づいて、移動端末のそれぞれについて当該緊急通報情報を送信した送信回数を計算し、この送信回数が所定回数以上である移動端末から送信された緊急通報情報が含む現在地情報を除いた残りの現在地情報に基づいて、緊急エリア情報を生成する。このように、緊急通報情報の送信回数が所定回数以上である移動端末から送信された緊急通報情報を除くことによって、例えば送信回数が比較的多いいたずら目的の移動端末から送信された緊急通報情報を除外することができる。この結果、より精度が高められて生成された緊急エリア情報の提供が可能になる。
また、生成手段は、受信手段により受信された緊急通報情報が含む時刻情報及び識別情報に基づいて、同一の所定時間帯における互いに異なる当該識別情報により識別される移動端末の個数が多くなる程、当該同一の所定時間帯における当該移動端末から送信された当該緊急通報情報の送信頻度に加算する加算数を少なくする重み付けを行って緊急エリア情報を生成するのも好ましい。
この構成により、緊急エリア提示装置は、緊急通報情報が含む時刻情報及び識別情報に基づいて、同一の所定時間帯における互いに異なる当該識別情報により識別される移動端末の個数が多くなる程、当該同一の所定時間帯における当該移動端末から送信された当該緊急通報情報の送信頻度に加算する加算数を少なくする重み付けを行って緊急エリア情報を生成する。このように、同一の所定時間帯における移動端末の個数が多くなる程、当該移動端末から送信された当該緊急通報情報の送信頻度に加算する加算数を少なくする重み付けを行なうことによって、同一の緊急事態に関する複数の緊急通報による送信頻度の増加を防ぐことができる。この結果、より精度が高められて生成された緊急エリア情報の提供が可能になる。
また、本発明に係る緊急エリア提示方法は、移動端末から発信された緊急通報に基づいて、当該緊急通報が発信されたエリアに関する情報を提供する緊急エリア提示装置が行なう緊急エリア提示方法であって、移動端末から送信された、当該移動端末の現在地情報を含む緊急通報情報を緊急エリア提示装置が受信する受信ステップと、受信ステップで受信された緊急通報情報が含む現在地情報に基づいて、複数の所定エリアのそれぞれにおける緊急通報情報の送信頻度を示す緊急エリア情報を緊急エリア提示装置が生成する生成ステップと、生成ステップで生成された緊急エリア情報を緊急エリア提示装置が表示する表示ステップと、を有することを特徴とする。
本発明に係る緊急エリア提示方法では、まず、移動端末から送信された緊急通報情報を受信し、この緊急通報情報が含む現在地情報に基づいて、複数の所定エリアのそれぞれにおける緊急通報情報の送信頻度を示す緊急エリア情報を生成する。そして、緊急エリア提示装置は、この緊急エリア情報を表示する。このため、緊急通報情報の送信といった移動端末の通信履歴に基づいた、緊急通報の発信頻度を地域としての所定エリアごとに示す情報である緊急エリア情報の提供が可能になる。
本発明によれば、移動端末の通信履歴に基づいた、緊急通報の発信頻度を地域ごとに示す情報の提供が可能な緊急エリア提示装置及び緊急エリア提示方法を提供することができる。
以下、添付図面を参照しながら本発明の好適な実施形態を説明する。なお、図面の説明において同一要素には同一符号を付し、重複する説明を省略する。
(1)緊急エリア提示装置の構成
まず、本実施形態に係る緊急エリア提示装置について、図1~図3を用いて説明する。図1は、この緊急エリア提示装置Pを含むシステムの全体構成の概略を説明するための構成図である。緊急エリア提示装置Pは、携帯電話端末といった移動端末から発信された緊急通報(例えば、110番、118番、119番等)に関する通報データ(緊急通報情報)に基づいて、複数の所定エリアのそれぞれにおける緊急通報の送信頻度や送信発生率を示す犯罪マップ(即ち、犯罪多発エリアを示す緊急エリア情報)を提供する装置である。
まず、本実施形態に係る緊急エリア提示装置について、図1~図3を用いて説明する。図1は、この緊急エリア提示装置Pを含むシステムの全体構成の概略を説明するための構成図である。緊急エリア提示装置Pは、携帯電話端末といった移動端末から発信された緊急通報(例えば、110番、118番、119番等)に関する通報データ(緊急通報情報)に基づいて、複数の所定エリアのそれぞれにおける緊急通報の送信頻度や送信発生率を示す犯罪マップ(即ち、犯罪多発エリアを示す緊急エリア情報)を提供する装置である。
なお、上記の通報データは、移動端末のユーザに通信サービスを提供する通信事業者が取得して所有可能なデータであり、例えば通報データを送信した移動端末の現在位置に関する現在地情報や、通報データの送信が行なわれた時刻を示す時刻情報や、通報データを送信した移動端末を一意に識別する後述のユーザ識別子(識別情報)等が含まれている。上記の現在地情報は、例えばGPS(Global Positioning System。即ち、全地球測位システム)や携帯電話端末の無線を使った位置測位システムを利用することによって取得される。
緊急エリア提示装置Pは、図1に示されるように、セクタ情報格納装置C1、端末位置情報格納装置C2、GPSデータ格納装置C3、地図情報格納装置C4、及び顧客情報格納装置C5等から、上記の通報データを含む各種データを受信して上記の犯罪マップを作成し、企業D1、官公庁D2、個人D3等に提供する。
ここで、セクタ情報格納装置C1は、例えばMMS/xGSNといった移動通信交換システムであり、緊急エリア提示装置Pにセクタデータを送信する装置である。また、端末位置情報格納装置C2は、例えばEBSCP(External Business user Service Control Point)といった対プロバイダ認証接続管理装置であり、緊急エリア提示装置Pにiエリア(登録商標)-GPSデータといった現在地情報を送信する装置である。
また、GPSデータ格納装置C3は、例えばCiRCUSといったパケット通信サービス実施システムであり、緊急エリア提示装置PにATF-GPSデータといった現在地情報を送信する装置である。
また、緊急エリア提示装置Pは、社会センサユニットU1(受信手段)、ペタマイニングユニットU2(即ち、PMU。生成手段)、モバイルデモグラフィーユニットU3(即ち、MDU。生成手段)、及び可視化ソリューションユニットU4(即ち、VSU。表示手段)を備えて構成されている。緊急エリア提示装置Pの主な機能を有するメインユニットは、モバイルデモグラフィーユニットU3及び可視化ソリューションユニットU4であるが、メインユニットにペタマイニングユニットU2を加えた構成としてもよい。
ここで、社会センサユニットU1は、上記の通報データを含む各種データを受信するためのサーバ群のユニットである。社会センサユニットU1は、社会センサーサーバを少なくとも数機備えて構成されている。これらの社会センサーサーバのそれぞれが、セクタ情報格納装置C1、端末位置情報格納装置C2、及びGPSデータ格納装置C3のそれぞれから各種データを受信する。
また、ペタマイニングユニットU2は、受信された各種データに基づいて、緊急通報を行なった移動端末を特定するためのサーバ群のユニットである。ペタマイニングユニットU2は、ぺタマイニングサーバを少なくとも数十機備えて構成されている。これらのぺタマイニングサーバのそれぞれが、上記の社会センサーサーバから各種データを受信する。
また、モバイルデモグラフィーユニットU3は、特定された移動端末に基づいて、複数の所定時間帯のそれぞれについての犯罪マップを生成するためのサーバ群のユニットである。モバイルデモグラフィーユニットU3は、モバイルデモグラフィーサーバを少なくとも数機備えて構成されている。これらのモバイルデモグラフィーサーバのそれぞれが、上記のぺタマイニングサーバから各種データを受信する。
また、可視化ソリューションユニットU4は、生成された犯罪マップを企業D1、官公庁D2、個人D3等のそれぞれが利用する端末に送信して提供表示するためのサーバ群のユニットである。可視化ソリューションユニットU4は、可視化ソリューションサーバを数機備えて構成されている。これらの可視化ソリューションサーバのそれぞれが、上記のモバイルデモグラフィーサーバから各種データを受信する。
なお、企業D1は、受信した犯罪マップに基づいて、店舗開発や商品開発等を行なう。また、官公庁D2は、受信した犯罪マップに基づいて、国勢調査、道路交通調査、災害対策、環境対策等を行なう。また、個人D3は、受信した犯罪マップに基づいて、店舗の混雑に関する情報や人気が出そうな地域エリアに関する予報を把握する。
(2)緊急エリア提示装置の構成
次に、本実施形態に係る緊急エリア提示装置について、図2及び図3を用いて説明する。図2は、緊急エリア提示装置Pの主な機能構成を説明するための機能構成図であり、図3は、緊急エリア提示装置Pの物理構成を説明するための物理構成図である。緊急エリア提示装置Pは、図3に示されるように、物理的な構成要素としてCPUP01(Central Processing Unit)、主記憶装置であるRAMP02(Random Access Memory)及びROMP03(Read Only Memory)、通信を行うための通信モジュールP04、並びにハードディスク等の補助記憶装置P05等のハードウェアを備えるコンピュータとして構成される。これらの構成要素が動作することにより、緊急エリア提示装置Pの機能が発揮される。
次に、本実施形態に係る緊急エリア提示装置について、図2及び図3を用いて説明する。図2は、緊急エリア提示装置Pの主な機能構成を説明するための機能構成図であり、図3は、緊急エリア提示装置Pの物理構成を説明するための物理構成図である。緊急エリア提示装置Pは、図3に示されるように、物理的な構成要素としてCPUP01(Central Processing Unit)、主記憶装置であるRAMP02(Random Access Memory)及びROMP03(Read Only Memory)、通信を行うための通信モジュールP04、並びにハードディスク等の補助記憶装置P05等のハードウェアを備えるコンピュータとして構成される。これらの構成要素が動作することにより、緊急エリア提示装置Pの機能が発揮される。
また、緊急エリア提示装置Pは、図2に示されるように、主な機能的な構成要素として、モバイルデモグラフィーユニットU3、可視化ソリューションユニットU4、位置情報DB11(データベース)、及び人口分布DB14(データベース)を備えて構成される。なお、モバイルデモグラフィーユニットU3は、通報抽出モジュール12、通報回数計算モジュール13(計算手段)、通報率計算モジュール15、及び各種統計DB16(データベース)を有して構成されており、可視化ソリューションユニットU4は、可視化モジュール17を有して構成されている。
位置情報DB11は、社会センサユニットU1によって受信された各種データに基づいて、緊急通報や通常発信等を行なった移動端末の位置をポイントデータとして特定して位置情報を格納するデータベースである。
通報抽出モジュール12は、位置が特定された移動端末を一意に識別する後述のユーザ識別子(識別情報)を含むポイントデータのうち、緊急通報の発信が実行されたか否かを示す緊急通知フラグによって緊急通報の発信の実行が示されたポイントデータを抽出して読み込むモジュールである。緊急通知フラグが示す内容は、ELIS(Emergency Location Immediate Service。即ち、緊急位置迅速サービス)や、ELRS(Emergency Location Reporting Service。即ち、緊急位置報告サービス)により決定される。抽出して読み込んだポイントデータは、通報抽出モジュール12が有する後述のポイントデータテーブルに格納される。
通報回数計算モジュール13は、緊急通知フラグによって緊急通報の発信の実行が示されているとして抽出されたポイントデータと、このポイントデータに含まれる後述のユーザ識別子とに基づいて、移動端末のそれぞれについて緊急通報が発信された発信回数(即ち、緊急通知送信回数)の合計等の演算処理を行なうモジュールである。
また、通報回数計算モジュール13は、通報データに含まれる時刻情報及び後述のユーザ識別子に基づいて、同一の所定時間帯(例えば、午前の時間帯や午後の時間帯)における互いに異なるユーザ識別子により一意に識別される移動端末の個数が多くなる程、この同一の所定時間帯における移動端末から送信された通報データの緊急通知送信回数に加算してカウントするカウント数(即ち、加算数)を少なくする重み付けを行なう。
この重み付けに関して、例えば、通常のカウント数(例えば1)と、1より小さい所定の数値(例えば0.3)とを積算して得られる数値(ここでは0.3)を、加算のためのカウント数(ここでは0.3)として決定して加算してカウントする重み付けが行なわれる。そして、更にカウントが行なわれる場合は、通常のカウント数(ここでは1)と、上記の所定の数値よりも小さい数値(ここでは0.2)とを積算して得られる数値(ここでは0.2)を、加算のためのカウント数(ここでは0.2)として決定して加算してカウントする重み付けが行なわれる。
人口分布DB14は、上記の通信事業者が管理する各地域エリアにおける人口分布データを格納するデータベースである。各地域エリアにおける人口分布データは、人口分布DB14が有する後述の町丁目別人口分布テーブルや、人口分布DB14が有する後述のメッシュ別人口分布テーブルに格納される。この町丁目別人口分布データや、メッシュ別人口分布データは、例えば国勢調査等によって得られた人口分布に関するデータであってもよく、位置情報DB11に格納された移動端末の位置情報に基づく人口分布に関するデータであってもよい。
通報率計算モジュール15は、上記の演算処理によって求められた上記の発信回数の合計に基づいて、人口分布DB14に格納されている人口分布データを参照しながら、地域エリアごとの緊急通報が発信された通報率(即ち、緊急通報発生率)等の統計計算を行なって、犯罪マップ等の各種統計情報を生成するモジュールである。犯罪マップは、町丁目別に生成してもよく、メッシュ別に生成してもよい。
各種統計DB16は、生成された犯罪マップ等の各種統計情報を格納するデータベースである。各種統計DB16は、後述の町丁目別緊急通報発生率テーブルやメッシュ別緊急通報発生率テーブルを有する。そして、生成された犯罪マップ等の各種統計情報は、この町丁目別緊急通報発生率テーブルやメッシュ別緊急通報発生率テーブルに格納される。
可視化モジュール17は、格納された犯罪マップ等の各種統計情報を可視化した情報に編集して、企業D1、官公庁D2、個人D3等のそれぞれが利用する端末に送信して提供するモジュールである。
(3)ポイントデータテーブルのテーブル構成
次に、上記のポイントデータテーブルのテーブル構成について、図4を用いて説明する。図4は、ポイントデータテーブルのテーブル構成を示すテーブル構成図である。ポイントデータテーブルは、データ項目として例えば、後述のユーザ識別子、緯度、経度、タイムスタンプ、位置情報種別等を有する。ユーザ識別子には、例えば“111”のように、ユーザが用いる移動端末を一意に識別するための識別子が格納される。緯度及び経度のそれぞれには、例えば“X1”及び“Y1”のそれぞれのように、GPSの利用によって特定された移動端末の現在地の緯度及び経度のそれぞれが格納される。タイムスタンプには、例えば“T1”のように、ユーザ識別子によって特定された移動端末において通報データの送信が行なわれた時刻が格納される。位置情報種別には、例えば“V1”のように、移動端末からの発信内容が緊急通報であるか否かを示すフラグ情報が格納される。この位置情報種別には、緊急通報の種別(例えば、110番、118番、119番等)が格納される構成であってもよい。
次に、上記のポイントデータテーブルのテーブル構成について、図4を用いて説明する。図4は、ポイントデータテーブルのテーブル構成を示すテーブル構成図である。ポイントデータテーブルは、データ項目として例えば、後述のユーザ識別子、緯度、経度、タイムスタンプ、位置情報種別等を有する。ユーザ識別子には、例えば“111”のように、ユーザが用いる移動端末を一意に識別するための識別子が格納される。緯度及び経度のそれぞれには、例えば“X1”及び“Y1”のそれぞれのように、GPSの利用によって特定された移動端末の現在地の緯度及び経度のそれぞれが格納される。タイムスタンプには、例えば“T1”のように、ユーザ識別子によって特定された移動端末において通報データの送信が行なわれた時刻が格納される。位置情報種別には、例えば“V1”のように、移動端末からの発信内容が緊急通報であるか否かを示すフラグ情報が格納される。この位置情報種別には、緊急通報の種別(例えば、110番、118番、119番等)が格納される構成であってもよい。
(4)人口分布テーブルのテーブル構成
次に、上記の町丁目別人口分布テーブルのテーブル構成について、図5(a)を用いて説明する。図5(a)は、町丁目別人口分布テーブルのテーブル構成を示すテーブル構成図である。町丁目別人口分布テーブルは、データ項目として例えば、町丁目識別子、町丁目名、人口数等を有する。町丁目識別子には、例えば“N1”のように、町丁目を一意に識別するための識別子が格納される。町丁目名には、例えば“L1”のように、町丁目識別子によって識別された町丁目の名前が格納される。人口数には、例えば“P1”のように、町丁目識別子によって識別された地域エリアにおける人口数が格納される。
次に、上記の町丁目別人口分布テーブルのテーブル構成について、図5(a)を用いて説明する。図5(a)は、町丁目別人口分布テーブルのテーブル構成を示すテーブル構成図である。町丁目別人口分布テーブルは、データ項目として例えば、町丁目識別子、町丁目名、人口数等を有する。町丁目識別子には、例えば“N1”のように、町丁目を一意に識別するための識別子が格納される。町丁目名には、例えば“L1”のように、町丁目識別子によって識別された町丁目の名前が格納される。人口数には、例えば“P1”のように、町丁目識別子によって識別された地域エリアにおける人口数が格納される。
次に、上記のメッシュ別人口分布テーブルのテーブル構成について、図5(b)を用いて説明する。図5(b)は、メッシュ別人口分布テーブルのテーブル構成を示すテーブル構成図である。メッシュ別人口分布テーブルは、データ項目として例えば、メッシュ識別子、人口数等を有する。メッシュ識別子には、例えば“M1”のように、地域エリアをメッシュ状に分割した場合の各メッシュを一意に識別するための識別子が格納される。人口数には、例えば“Q1”のように、メッシュ識別子によって識別された地域エリアにおける人口数が格納される。
(5)緊急通報発生率テーブルのテーブル構成
次に、上記の町丁目別緊急通報発生率テーブルのテーブル構成について、図6(a)を用いて説明する。図6(a)は、町丁目別緊急通報発生率テーブルのテーブル構成を示すテーブル構成図である。町丁目別緊急通報発生率テーブルは、データ項目として例えば、町丁目識別子、町丁目名、緊急通報発生率等を有する。町丁目識別子には、例えば“N1”のように、町丁目を一意に識別するための識別子が格納される。町丁目名には、例えば“L1”のように、町丁目識別子によって識別された町丁目の名前が格納される。緊急通報発生率には、例えば“A1”のように、町丁目識別子によって識別された地域エリアにおいて緊急通報が発信された緊急通報発生率が格納される。
次に、上記の町丁目別緊急通報発生率テーブルのテーブル構成について、図6(a)を用いて説明する。図6(a)は、町丁目別緊急通報発生率テーブルのテーブル構成を示すテーブル構成図である。町丁目別緊急通報発生率テーブルは、データ項目として例えば、町丁目識別子、町丁目名、緊急通報発生率等を有する。町丁目識別子には、例えば“N1”のように、町丁目を一意に識別するための識別子が格納される。町丁目名には、例えば“L1”のように、町丁目識別子によって識別された町丁目の名前が格納される。緊急通報発生率には、例えば“A1”のように、町丁目識別子によって識別された地域エリアにおいて緊急通報が発信された緊急通報発生率が格納される。
次に、上記のメッシュ別緊急通報発生率テーブルのテーブル構成について、図6(b)を用いて説明する。図6(b)は、メッシュ別緊急通報発生率テーブルのテーブル構成を示すテーブル構成図である。メッシュ別緊急通報発生率テーブルは、データ項目として例えば、メッシュ識別子、緊急通報発生率等を有する。メッシュ識別子には、例えば“M1”のように、地域エリアをメッシュ状に分割した場合の各メッシュを一意に識別するための識別子が格納される。緊急通報発生率には、例えば“Q1”のように、メッシュ識別子によって識別された地域エリアにおいて緊急通報が発信された緊急通報発生率が格納される。
(6)犯罪マップの一例
次に、モバイルデモグラフィーユニットU3によって生成された犯罪マップの一例について、図7を用いて説明する。図7は、犯罪マップの一例を説明するための説明図である。
次に、モバイルデモグラフィーユニットU3によって生成された犯罪マップの一例について、図7を用いて説明する。図7は、犯罪マップの一例を説明するための説明図である。
まず、犯罪マップの生成及び分析前の処理として、通報抽出モジュール12が、ユーザ識別子を含むデータであるポイントデータのうち、緊急通知フラグによって緊急通報の発信の実行が示されたポイントデータを抽出する。抽出されたポイントデータは、図7(a)に示されるように、地図上に複数のポイントPとして示される。図7(a)において、破線Laは町丁目の境界である町丁目界を示しており、十字状の実線Lbはメッシュの境界であるメッシュ界を示している。このため、図7(a)に示された地域エリアは、この町丁目界によって三分割されているとともに、メッシュ界によって四等分割されている。
次に、通報回数計算モジュール13が、緊急通報が発信された発信回数の合計等の演算処理を行ない、通報率計算モジュール15が、この発信回数の合計に基づいて、犯罪マップ等の各種統計情報を生成する。そして、可視化モジュール17が、犯罪マップ等の各種統計情報を可視化した情報に編集する。
ここで、町丁目別緊急通報発生率テーブルに格納された犯罪マップ等の各種統計情報は、図7(b)に示されるように、破線Laが示す町丁目界によって分割された3つの地域エリアA1,A2,A3のそれぞれにおける発生頻度が模様や色によって可視化された分析後の犯罪マップとして示される。即ち、地域エリアA1,A2,A3のそれぞれに含まれるポイントデータの数は12、6、2であり、地域エリアA1の面積に対する発生頻度は地域エリアA2,A3のそれぞれの面積に対する発生頻度よりも高いという演算結果から、地域エリアA1が、発生頻度が最も高い色としての赤色の模様によって可視化される。
また、地域エリアA2の面積に対する発生頻度は地域エリアA3の面積に対する発生頻度よりも高いという演算結果から、地域エリアA2が、発生頻度が次に高い色としての黄色の模様によって可視化される。そして、残る地域エリアA3が、発生頻度が最も低い色としての緑色の模様によって可視化される。なお、上記の可視化した犯罪マップは、通報データの送信頻度を、複数の所定の時間帯のそれぞれ(例えば、午前の時間帯と午後の時間帯のそれぞれ)について示すものであってもよい。
一方、メッシュ別緊急通報発生率テーブルに格納された犯罪マップ等の各種統計情報は、図7(c)に示されるように、実線Lbが示すメッシュ界によって分割された4つの地域エリアB1,B2,B3,B4のそれぞれにおける発生頻度が模様や色によって可視化された分析後の犯罪マップとして示される。即ち、地域エリアB1,B2,B3,B4のそれぞれに含まれるポイントデータの数は12、4、2、2であり、地域エリアB1の面積に対する発生頻度は地域エリアB2,B3,B4のそれぞれの面積に対する発生頻度よりも高いという演算結果から、地域エリアB1が、発生頻度が最も高い色としての赤色の模様によって可視化される。
また、地域エリアB2の面積に対する発生頻度は地域エリアB3,B4の面積に対する発生頻度よりも高いという演算結果から、地域エリアB2が、発生頻度が次に高い色としての黄色の模様によって可視化される。そして、残る地域エリアB3,B4が、発生頻度が最も低い色としての緑色の模様によって可視化される。なお、上記の可視化した犯罪マップは、通報データの送信頻度を、複数の所定の時間帯のそれぞれ(例えば、午前の時間帯と午後の時間帯のそれぞれ)について示すものであってもよい。
(7)緊急エリア提示処理の流れ
次に、本実施形態に係る緊急エリア提示装置Pで実行される緊急エリア提示処理アルゴリズムの流れ(緊急エリア提示方法)について、図8及び図9を用いて説明する。図8は、緊急エリア提示装置Pで実行される緊急エリア提示処理の全体の流れを示すシーケンス図であり、図9は、この緊急エリア提示処理の一部を詳細に示すシーケンス図である。
次に、本実施形態に係る緊急エリア提示装置Pで実行される緊急エリア提示処理アルゴリズムの流れ(緊急エリア提示方法)について、図8及び図9を用いて説明する。図8は、緊急エリア提示装置Pで実行される緊急エリア提示処理の全体の流れを示すシーケンス図であり、図9は、この緊急エリア提示処理の一部を詳細に示すシーケンス図である。
最初に、図8を用いて、緊急エリア提示処理の全体の流れを説明する。まず、通報抽出モジュール12が、ユーザ識別子を含むデータであるポイントデータを読み込む(ステップS1、受信ステップ)。そして、通報抽出モジュール12が、上記のポイントデータのうち、緊急通知フラグによって緊急通報の発信の実行が示されたポイントデータを抽出して読み込む(ステップS2)。
次に、通報回数計算モジュール13が、緊急通知フラグによって緊急通報の発信の実行が示されているとして抽出されたポイントデータに基づいて、緊急通報が発信された緊急通知回数の合計等の計算処理を行なう(ステップS3)。そして、通報率計算モジュール15が、人口分布DB14に格納されている人口分布データに基づいて、地域エリアごとの人数を計算する(ステップS4)。
次に、通報率計算モジュール15が、ステップS3で求められた緊急通知回数の合計と、ステップS4で求められた地域エリアごとの人数とに基づいて、地域エリアごとの緊急通報発生率等の統計計算を行なって、犯罪マップ等の各種統計情報を生成する(ステップS5、生成ステップ)。犯罪マップは、町丁目別に生成してもよく、メッシュ別に生成してもよい。そして、可視化モジュール17が、各種統計DB16に格納された犯罪マップ等の各種統計情報を可視化した情報に編集して、企業D1、官公庁D2、個人D3等のそれぞれが利用する端末に送信して表示させる(ステップS6、表示ステップ)。これにより、地域エリアごとの緊急通報発生率等が表示される。
ここで、図9を用いて、上記のステップS3の詳細を説明する。まず、通報回数計算モジュール13が、移動端末のユーザごとの緊急通知回数の合計等の計算処理を行なう(ステップS30)。そして、通報回数計算モジュール13が、移動端末のユーザごとに、緊急通知回数が所定回数(即ち、閾値)以上であるか否かを判定する(ステップS31)。緊急通知回数は閾値以上であると判定された場合、通報回数計算モジュール13が、この閾値以上の回数の緊急通報を行なったユーザに関するデータをいたずら目的の通報だと判断して削除して(ステップS32)、上記のステップS4に移行する。一方、緊急通知回数は閾値以上でない(即ち、閾値未満である)と判定された場合、後述のステップS34に移行する。
ステップS34では、通報回数計算モジュール13が、所定の場所(即ち、地域エリア)及び所定の時間帯(例えば、午前の時間帯と午後の時間帯)による区分整理(即ち、クラスタ化)のための基準を決定する。
そして、通報回数計算モジュール13が、上記の取り出したデータに関して、既に1つ以上のポイントデータが含まれているクラスタに新たに含めることができるか否かを判定する(ステップS35)。既に1つ以上のポイントデータが含まれているクラスタに新たに含めることができないと判定された場合、後述のステップS36に移行する。一方、既に1つ以上のポイントデータが含まれているクラスタに新たに含めることができると判定された場合、後述のステップS37に移行する。
ステップS36では、通報回数計算モジュール13が、対応するクラスタにおける緊急通知送信回数に通常のカウント数を加算してカウントする処理を行なう。そして、上記のステップS4に移行する。
ステップS37では、通報回数計算モジュール13が、対応するクラスタにおける緊急通知送信回数に加算してカウントするカウント数を少なくして加算してカウントする処理を行なう。そして、上記のステップS4に移行する。
(8)本発明による作用及び効果
緊急エリア提示装置Pは、まず、移動端末から送信された通報データを受信し、この通報データが含む現在地情報に基づいて、複数の所定エリアのそれぞれにおける通報データの送信頻度を示す犯罪マップを生成する。そして、緊急エリア提示装置Pは、この犯罪マップを表示する。このため、通報データの送信といった移動端末の通信履歴に基づいた、緊急通報の発信頻度を所定エリアごとに示す情報である犯罪マップ等の各種統計情報の提供が可能になる。
緊急エリア提示装置Pは、まず、移動端末から送信された通報データを受信し、この通報データが含む現在地情報に基づいて、複数の所定エリアのそれぞれにおける通報データの送信頻度を示す犯罪マップを生成する。そして、緊急エリア提示装置Pは、この犯罪マップを表示する。このため、通報データの送信といった移動端末の通信履歴に基づいた、緊急通報の発信頻度を所定エリアごとに示す情報である犯罪マップ等の各種統計情報の提供が可能になる。
また、緊急エリア提示装置Pは、通報データが含む現在地情報及び時刻情報に基づいて、複数の所定エリアのそれぞれにおける緊急通報情報の送信頻度を、複数の所定時間帯のそれぞれについて示す犯罪マップを生成する。このため、緊急通報の発信頻度を、複数の所定時間帯のそれぞれについて示す犯罪マップの提供が可能になる。
また、緊急エリア提示装置Pは、通報データが含む識別情報に基づいて、移動端末のそれぞれについて緊急通知送信回数を計算し、この緊急通知送信回数が所定回数以上である移動端末から送信された通報データを除いた残りの現在地情報に基づいて、犯罪マップを生成する。このように、緊急通知送信回数が所定回数以上である移動端末から送信された通報データを除くことによって、例えば緊急通知送信回数が比較的多いいたずら目的の移動端末から送信された通報データを除外することができる。この結果、より精度が高められて生成された緊急エリア情報の提供が可能になる。
また、緊急エリア提示装置Pは、通報データが含む時刻情報及びユーザ識別子に基づいて、同一の所定時間帯における互いに異なる当該ユーザ識別子により一意に識別される移動端末の個数が多くなる程、当該同一の所定時間帯における当該移動端末から送信された当該通報データの送信頻度に加算するカウント数を少なくする重み付けを行って犯罪マップを生成する。このように、同一の所定時間帯における移動端末の個数が多くなる程、当該移動端末から送信された当該通報データの送信頻度に加算するカウント数を少なくする重み付けを行なうことによって、同一の緊急事態に関する重複した緊急通報による送信頻度の増加を防ぐことができる。この結果、より精度が高められて生成された緊急エリア情報の提供が可能になる。
(9)変形例
上記の実施例では、図2に示されるように、モバイルデモグラフィーユニットU3は、通報抽出モジュール12、通報回数計算モジュール13、通報率計算モジュール15、及び各種統計DB16を有する構成であるとして説明したが、同時に、図2の破線で示されるように、位置情報DB11、通報抽出モジュール12、通報回数計算モジュール13、人口分布DB14、及び通報率計算モジュール15がペタマイニングユニットU2を構成する態様としてもよい。
上記の実施例では、図2に示されるように、モバイルデモグラフィーユニットU3は、通報抽出モジュール12、通報回数計算モジュール13、通報率計算モジュール15、及び各種統計DB16を有する構成であるとして説明したが、同時に、図2の破線で示されるように、位置情報DB11、通報抽出モジュール12、通報回数計算モジュール13、人口分布DB14、及び通報率計算モジュール15がペタマイニングユニットU2を構成する態様としてもよい。
本発明によれば、移動端末の通信履歴に基づいた、緊急通報の発信頻度を地域ごとに示す情報の提供が可能な緊急エリア提示装置及び緊急エリア提示方法を提供することができる。
11…位置情報DB、12…通報抽出モジュール、13…通報回数計算モジュール、14…人口分布DB、15…通報率計算モジュール、16…各種統計DB、17…可視化モジュール、A1~A3,B1~B4…地域エリア、C1…セクタ情報格納装置、C2…端末位置情報格納装置、C3…GPSデータ格納装置、C4…地図情報格納装置、C5…顧客情報格納装置、D1…企業、D2…官公庁、D3…個人、La…破線、Lb…実線、P…緊急エリア提示装置、P01…CPU、P02…RAM、P03…ROM、P04…通信モジュール、P05…補助記憶装置、U1…社会センサユニット、U2…ペタマイニングユニット、U3…モバイルデモグラフィーユニット、U4…可視化ソリューションユニット。
Claims (5)
- 移動端末から発信された緊急通報に基づいて、当該緊急通報が発信されたエリアに関する情報を提供する緊急エリア提示装置であって、
前記移動端末から送信された、当該移動端末の現在地情報を含む緊急通報情報を受信する受信手段と、
前記受信手段により受信された前記緊急通報情報が含む前記現在地情報に基づいて、複数の所定エリアのそれぞれにおける前記緊急通報情報の送信頻度を示す緊急エリア情報を生成する生成手段と、
前記生成手段により生成された前記緊急エリア情報を表示する表示手段と、
を備えることを特徴とする緊急エリア提示装置。 - 前記緊急通報情報は、当該緊急通報情報の送信が行なわれた時刻を示す時刻情報を含み、
前記生成手段は、前記受信手段により受信された前記緊急通報情報が含む前記現在地情報及び前記時刻情報に基づいて、前記複数の所定エリアのそれぞれにおける前記緊急通報情報の送信頻度を、複数の所定時間帯のそれぞれについて示す緊急エリア情報を生成する、
ことを特徴とする請求項1に記載の緊急エリア提示装置。 - 前記緊急通報情報は、当該緊急通報情報を送信した前記移動端末を識別する識別情報を含み、
前記受信手段により受信された前記緊急通報情報が含む前記識別情報に基づいて、前記移動端末のそれぞれについて当該緊急通報情報を送信した送信回数を計算する計算手段を更に備え、
前記生成手段は、前記計算手段により計算された前記送信回数が所定回数以上である前記移動端末から送信された前記緊急通報情報が含む前記現在地情報を除いた残りの前記現在地情報に基づいて、前記緊急エリア情報を生成する、
ことを特徴とする請求項1又は2に記載の緊急エリア提示装置。 - 前記生成手段は、前記受信手段により受信された前記緊急通報情報が含む前記時刻情報及び前記識別情報に基づいて、同一の所定時間帯における互いに異なる当該識別情報により識別される前記移動端末の個数が多くなる程、当該同一の所定時間帯における当該移動端末から送信された当該緊急通報情報の送信頻度に加算する加算数を少なくする重み付けを行って前記緊急エリア情報を生成する、
ことを特徴とする請求項3に記載の緊急エリア提示装置。 - 移動端末から発信された緊急通報に基づいて、当該緊急通報が発信されたエリアに関する情報を提供する緊急エリア提示装置が行なう緊急エリア提示方法であって、
前記移動端末から送信された、当該移動端末の現在地情報を含む緊急通報情報を前記緊急エリア提示装置が受信する受信ステップと、
前記受信ステップで受信された前記緊急通報情報が含む前記現在地情報に基づいて、複数の所定エリアのそれぞれにおける前記緊急通報情報の送信頻度を示す緊急エリア情報を前記緊急エリア提示装置が生成する生成ステップと、
前記生成ステップで生成された前記緊急エリア情報を前記緊急エリア提示装置が表示する表示ステップと、
を有することを特徴とする緊急エリア提示方法。
Applications Claiming Priority (2)
| Application Number | Priority Date | Filing Date | Title |
|---|---|---|---|
| JP2009-101093 | 2009-04-17 | ||
| JP2009101093A JP5069272B2 (ja) | 2009-04-17 | 2009-04-17 | 緊急エリア提示装置及び緊急エリア提示方法 |
Publications (1)
| Publication Number | Publication Date |
|---|---|
| WO2010119752A1 true WO2010119752A1 (ja) | 2010-10-21 |
Family
ID=42982417
Family Applications (1)
| Application Number | Title | Priority Date | Filing Date |
|---|---|---|---|
| PCT/JP2010/055003 Ceased WO2010119752A1 (ja) | 2009-04-17 | 2010-03-23 | 緊急エリア提示装置及び緊急エリア提示方法 |
Country Status (2)
| Country | Link |
|---|---|
| JP (1) | JP5069272B2 (ja) |
| WO (1) | WO2010119752A1 (ja) |
Families Citing this family (2)
| Publication number | Priority date | Publication date | Assignee | Title |
|---|---|---|---|---|
| JP2012108638A (ja) * | 2010-11-16 | 2012-06-07 | Hitachi Ltd | 事件・事故情報共有システム |
| JP6207047B2 (ja) * | 2015-08-04 | 2017-10-04 | 株式会社トライウェア | 緊急時の避難誘導装置 |
Citations (2)
| Publication number | Priority date | Publication date | Assignee | Title |
|---|---|---|---|---|
| JP2003288680A (ja) * | 2002-03-28 | 2003-10-10 | Casio Comput Co Ltd | 交通情報通報/表示ネットワークシステム、ナビゲーション装置、交通情報通報/表示方法及びプログラム |
| JP2005277952A (ja) * | 2004-03-25 | 2005-10-06 | Nifty Corp | 移動通信ネットワークを用いた犯罪情報提供システム |
-
2009
- 2009-04-17 JP JP2009101093A patent/JP5069272B2/ja not_active Expired - Fee Related
-
2010
- 2010-03-23 WO PCT/JP2010/055003 patent/WO2010119752A1/ja not_active Ceased
Patent Citations (2)
| Publication number | Priority date | Publication date | Assignee | Title |
|---|---|---|---|---|
| JP2003288680A (ja) * | 2002-03-28 | 2003-10-10 | Casio Comput Co Ltd | 交通情報通報/表示ネットワークシステム、ナビゲーション装置、交通情報通報/表示方法及びプログラム |
| JP2005277952A (ja) * | 2004-03-25 | 2005-10-06 | Nifty Corp | 移動通信ネットワークを用いた犯罪情報提供システム |
Non-Patent Citations (1)
| Title |
|---|
| TAKAHITO SHIMADA ET AL.: "Disclosing Crime Map Using WWW", PAPERS AND PROCEEDINGS OF THE GEOGRAPHIC INFORMATION SYSTEMS ASSOCIATION, vol. 12, 30 September 2003 (2003-09-30), pages 127 - 130 * |
Also Published As
| Publication number | Publication date |
|---|---|
| JP2010252169A (ja) | 2010-11-04 |
| JP5069272B2 (ja) | 2012-11-07 |
Similar Documents
| Publication | Publication Date | Title |
|---|---|---|
| Blondel et al. | A survey of results on mobile phone datasets analysis | |
| EP3014904B1 (en) | Categorized location identification based on historical locations of a user device | |
| US11004110B2 (en) | Systems and methods for providing situational awareness via bidirectional multi-modal notifications | |
| US20130210455A1 (en) | Aggregating demographic distribution information | |
| US12548038B2 (en) | Realtime busyness for places | |
| CN111080501B (zh) | 基于手机信令数据的真实人群密度时空分布估算方法 | |
| US8600957B2 (en) | Mesh data creation method | |
| US8972167B1 (en) | Enhanced geocoding | |
| CN107730375B (zh) | 一种税务地图管理的方法、系统及终端设备 | |
| US20260050502A1 (en) | Method and apparatus for monitoring network system, and computing device | |
| EP2416290A1 (en) | Position information analysis device and position information analysis method | |
| EP2897088A1 (en) | Method and apparatus for optimum spatial clustering | |
| CN109669835A (zh) | MySQL数据库监控方法、装置、设备及可读存储介质 | |
| CN110765220A (zh) | 一种基于热力图的地理位置确定方法和电子设备 | |
| CN111917597A (zh) | 一种宽带业务监测方法和设备 | |
| US7933592B2 (en) | Cellular telephone signal monitoring method and system | |
| JP5069272B2 (ja) | 緊急エリア提示装置及び緊急エリア提示方法 | |
| CN107800557B (zh) | 一种告警监控方法及装置 | |
| JP2012054921A (ja) | 移動機分布算出システム及び移動機分布算出方法 | |
| JP5379635B2 (ja) | 避難状況出力装置及び避難状況出力方法 | |
| US10089165B2 (en) | Monitoring data events using calendars | |
| KR20140138209A (ko) | 맵 표현을 이용하는 소프트웨어 애플리케이션의 론칭 | |
| US20250063398A1 (en) | System andmethod for identifying utilization of low telecom services in a predefined area | |
| CN116861056A (zh) | 智能中台的气象数据处理方法、系统、装置及介质 | |
| Cloquet et al. | Forecasting event attendance with anonymized mobile phone data |
Legal Events
| Date | Code | Title | Description |
|---|---|---|---|
| 121 | Ep: the epo has been informed by wipo that ep was designated in this application |
Ref document number: 10764337 Country of ref document: EP Kind code of ref document: A1 |
|
| NENP | Non-entry into the national phase |
Ref country code: DE |
|
| 122 | Ep: pct application non-entry in european phase |
Ref document number: 10764337 Country of ref document: EP Kind code of ref document: A1 |