WO2010100891A1 - 波形再構成装置、波形再構成システム及び波形再構成方法 - Google Patents
波形再構成装置、波形再構成システム及び波形再構成方法 Download PDFInfo
- Publication number
- WO2010100891A1 WO2010100891A1 PCT/JP2010/001397 JP2010001397W WO2010100891A1 WO 2010100891 A1 WO2010100891 A1 WO 2010100891A1 JP 2010001397 W JP2010001397 W JP 2010001397W WO 2010100891 A1 WO2010100891 A1 WO 2010100891A1
- Authority
- WO
- WIPO (PCT)
- Prior art keywords
- spectrum
- optical signal
- input optical
- phase
- power spectrum
- Prior art date
- Legal status (The legal status is an assumption and is not a legal conclusion. Google has not performed a legal analysis and makes no representation as to the accuracy of the status listed.)
- Ceased
Links
Images




Classifications
-
- G—PHYSICS
- G01—MEASURING; TESTING
- G01J—MEASUREMENT OF INTENSITY, VELOCITY, SPECTRAL CONTENT, POLARISATION, PHASE OR PULSE CHARACTERISTICS OF INFRARED, VISIBLE OR ULTRAVIOLET LIGHT; COLORIMETRY; RADIATION PYROMETRY
- G01J11/00—Measuring the characteristics of individual optical pulses or of optical pulse trains
-
- G—PHYSICS
- G01—MEASURING; TESTING
- G01J—MEASUREMENT OF INTENSITY, VELOCITY, SPECTRAL CONTENT, POLARISATION, PHASE OR PULSE CHARACTERISTICS OF INFRARED, VISIBLE OR ULTRAVIOLET LIGHT; COLORIMETRY; RADIATION PYROMETRY
- G01J3/00—Spectrometry; Spectrophotometry; Monochromators; Measuring colours
- G01J3/02—Details
-
- G—PHYSICS
- G01—MEASURING; TESTING
- G01J—MEASUREMENT OF INTENSITY, VELOCITY, SPECTRAL CONTENT, POLARISATION, PHASE OR PULSE CHARACTERISTICS OF INFRARED, VISIBLE OR ULTRAVIOLET LIGHT; COLORIMETRY; RADIATION PYROMETRY
- G01J3/00—Spectrometry; Spectrophotometry; Monochromators; Measuring colours
- G01J3/02—Details
- G01J3/0205—Optical elements not provided otherwise, e.g. optical manifolds, diffusers, windows
- G01J3/0213—Optical elements not provided otherwise, e.g. optical manifolds, diffusers, windows using attenuators
-
- G—PHYSICS
- G01—MEASURING; TESTING
- G01J—MEASUREMENT OF INTENSITY, VELOCITY, SPECTRAL CONTENT, POLARISATION, PHASE OR PULSE CHARACTERISTICS OF INFRARED, VISIBLE OR ULTRAVIOLET LIGHT; COLORIMETRY; RADIATION PYROMETRY
- G01J3/00—Spectrometry; Spectrophotometry; Monochromators; Measuring colours
- G01J3/02—Details
- G01J3/0205—Optical elements not provided otherwise, e.g. optical manifolds, diffusers, windows
- G01J3/0218—Optical elements not provided otherwise, e.g. optical manifolds, diffusers, windows using optical fibers
-
- G—PHYSICS
- G01—MEASURING; TESTING
- G01J—MEASUREMENT OF INTENSITY, VELOCITY, SPECTRAL CONTENT, POLARISATION, PHASE OR PULSE CHARACTERISTICS OF INFRARED, VISIBLE OR ULTRAVIOLET LIGHT; COLORIMETRY; RADIATION PYROMETRY
- G01J3/00—Spectrometry; Spectrophotometry; Monochromators; Measuring colours
- G01J3/02—Details
- G01J3/0205—Optical elements not provided otherwise, e.g. optical manifolds, diffusers, windows
- G01J3/0245—Optical elements not provided otherwise, e.g. optical manifolds, diffusers, windows using an optical amplifier of light, e.g. doped fiber
Definitions
- the present invention relates to a waveform reconstruction device and the like for reconstructing a time waveform of an optical signal.
- the intensity distribution of the time waveform of the optical signal is measured using an optical sampling oscilloscope, an autocorrelator, or the like.
- the amplitude information of the optical signal is acquired from the measured intensity distribution.
- phase information of the optical signal cannot be acquired from the measured intensity distribution. That is, it is not possible to acquire information on the time waveform of the optical signal only by measuring the intensity distribution of the optical signal.
- Non-Patent Documents 1 and 2 are methods for acquiring the phase of an optical signal based on time-resolved spectroscopy. Specifically, in the methods described in Non-Patent Documents 1 and 2, the phase of an optical signal is acquired by using an ultrafast time gate or a reference light source. And the time waveform of an optical signal is reconfigure
- an object of the present invention is to provide a waveform reconstruction device that can easily reconstruct the time waveform of an optical signal.
- a waveform reconstruction device is a waveform reconstruction device that reconstructs a time waveform of an input optical signal, and is an input that acquires a power spectrum of the input optical signal.
- a spectrum acquisition unit and a power spectrum obtained by measuring an output optical signal output after propagation of the input optical signal in an optical fiber that induces self-phase modulation, and a plurality of intensities of the input as a measurement power spectrum
- the input optical signal of the plurality of intensities Calculate the power spectrum of the output optical signal when it is assumed that the phase spectrum has a given phase spectrum.
- phase spectrum calculation unit calculates the given phase spectrum that has a difference value between the calculated power spectrum and the measured power spectrum below a predetermined threshold as the phase spectrum of the input optical signal
- the time waveform of the input optical signal is re-converted by frequency / time conversion of the phase spectrum calculation unit, the phase spectrum calculated by the phase spectrum calculation unit, and the power spectrum acquired by the input spectrum acquisition unit.
- a waveform reconstructing unit to be configured.
- the time waveform of the input optical signal can be reconstructed using the power spectrum of the output optical signal that is output after the input optical signal propagates through the optical fiber that induces self-phase modulation.
- This time waveform can be easily reconstructed.
- phase spectrum calculation unit searches for the given phase spectrum in which the difference value is equal to or less than the predetermined threshold while changing the given phase spectrum according to a predetermined algorithm.
- the phase spectrum of the signal may be calculated.
- the waveform reconstruction system is a waveform reconstruction system that reconstructs a time waveform of an input optical signal, and changes the intensity of the input optical signal to a plurality of different intensities.
- An optical fiber for inducing self-phase modulation of an optical signal propagating in the optical fiber, the optical fiber having a known parameter relating to the self-phase modulation, and the intensity changed by the intensity adjuster A spectrum measuring instrument that measures the power spectrum of an output optical signal output after the input optical signal propagates through the optical fiber for each of the plurality of intensities, and the waveform reconstruction device, and the output spectrum acquisition unit includes The power spectrum measured by the spectrum measuring device is acquired as a measured power spectrum.
- the time waveform of the input optical signal can be reconstructed if there is an optical fiber with a known parameter and a spectrum measuring instrument, so that an ultrafast time gate or a reference light source need not necessarily be provided. That is, the time waveform of the optical signal can be easily reconstructed.
- the optical fiber has known parameters relating to self-phase modulation of at least second-order, third-order dispersion, and fourth-order dispersion.
- each step included in the waveform reconstruction method can be realized as a program for causing a computer to execute the steps.
- a program can be distributed via a recording medium such as a CD-ROM (Compact Disc-Read Only Memory) or a transmission medium such as the Internet.
- the waveform reconstruction device uses the power spectrum of the output optical signal output after the input optical signal propagates through the optical fiber that induces self-phase modulation. Since the time waveform of the input optical signal can be reconstructed, the time waveform of the optical signal can be easily reconstructed.
- FIG. 1 is a diagram showing an overall configuration of a waveform reconstruction system according to an embodiment of the present invention.
- FIG. 2 is a block diagram showing a characteristic functional configuration of the waveform reconstruction device according to the embodiment of the present invention.
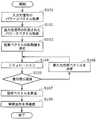
- FIG. 3 is a flowchart showing the operation of the waveform reconstruction device according to the embodiment of the present invention.
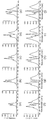
- FIG. 4 is a graph showing experimental results of the power spectrum of the output optical signal measured by the spectroscope.
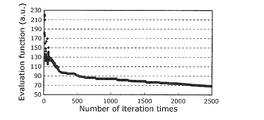
- FIG. 5 is a graph showing experimental results of changes in the evaluation function during the search for the phase spectrum.
- FIG. 6 is a diagram showing a power spectrum and a phase spectrum obtained by experiments.
- FIG. 7 is a diagram showing experimental results of the time waveform of the input optical signal reconstructed by the waveform reconstruction device.
- FIG. 1 is a diagram showing an overall configuration of a waveform reconstruction system according to an embodiment of the present invention.
- FIG. 2 is a block diagram showing a characteristic functional configuration of the waveform reconstruction device according to the embodiment of
- FIG. 8 is a graph showing a comparison result between the actually measured value and the calculated value of the power spectrum of the output optical signal corresponding to the intensity of the seven types of input optical signals.
- FIG. 9 corresponds to the intensities of the three types of input optical signals that were not used for the calculation of the phase spectrum, among the power spectra of the output optical signals corresponding to the intensities of the ten types of input optical signals measured by the spectrometer. It is a graph which shows the comparison result of the actual value and calculation value of the power spectrum of an output optical signal.
- FIG. 10 is a diagram illustrating an example of a hardware configuration of a computer.
- the waveform reconstruction system and the waveform reconstruction device use the characteristic of the nonlinear optical effect that the time waveform causing a combination of a plurality of spectral changes is limited, and the time waveform of the input optical signal Perform reconfiguration. Specifically, the waveform reconstruction system and the waveform reconstruction device compare a plurality of spectrum changes due to the nonlinear optical effect, which are obtained when the intensity of the input optical signal is changed, between an actual measurement value and a calculated value, The comparison result is used to reconstruct the time waveform of the input optical signal.
- the phase spectrum required for reconstruction of the time waveform is changed so that the calculated power spectrum (calculated value) calculated by simulation according to an optimization algorithm such as annealing method approaches the measured power spectrum (actually measured value). It is decided by going.
- FIG. 1 is a diagram showing an overall configuration of a waveform reconstruction system 100 according to an embodiment of the present invention.
- the waveform reconstruction system 100 is a system for reconstructing a time waveform of an input optical signal.
- the waveform reconstruction system 100 includes an intensity adjuster 110, a highly nonlinear optical fiber 120, a spectrometer 130, and a waveform reconstruction device 140.
- the intensity adjuster 110 changes the intensity of the input optical signal generated by the input optical signal generation device 200.
- the highly nonlinear optical fiber 120 is an example of an optical fiber, and induces self-phase modulation of an optical signal propagating through the highly nonlinear optical fiber 120.
- self-phase modulation is an example of a nonlinear optical effect. Since the refractive index of a medium such as an optical fiber slightly changes in proportion to the intensity of the optical signal propagating therethrough, phase modulation occurs in the optical signal itself. The phase modulation generated in this way is called self-phase modulation.
- the highly nonlinear optical fiber 120 is a fiber with known parameters relating to self-phase modulation.
- the highly nonlinear optical fiber 120 is, for example, an optical fiber in which parameters indicating up to the fourth order dispersion in addition to the second order and the third order are known.
- An input optical signal whose intensity has been changed by the intensity adjuster 110 propagates through the highly nonlinear optical fiber 120.
- the spectroscope 130 is an example of a spectrum measuring instrument, and is expressed as a digital value by decomposing an output optical signal into light for each wavelength and performing O / E conversion and A / D conversion on the decomposed light for each wavelength. Generate a power spectrum. That is, the spectroscope 130 measures the power spectrum of the output optical signal.
- the output optical signal is an optical signal output after the input optical signal has propagated through the highly nonlinear optical fiber 120.
- the waveform reconstruction device 140 is realized by a computer as shown in FIG. 10, for example, and reconstructs the time waveform of the input optical signal. Details of the waveform reconstruction device 140 will be described later with reference to FIG.
- the input optical signal generation device 200 is a device that generates an input optical signal.
- the input optical signal generation device 200 includes, for example, an MLLD (Mode-Locked Laser Diode), an SMF (Single Mode Fiber), and an EDFA (Erbium Doped Fiber Amplifier).
- the input optical signal generation device 200 performs dispersion compensation on the optical pulse output from the MLLD by using the SMF, and amplifies it by using the EDFA.
- FIG. 2 is a block diagram showing a characteristic functional configuration of the waveform reconstruction device 140 according to the embodiment of the present invention. As shown in FIG. 2, an input spectrum acquisition unit 141, an output spectrum acquisition unit 142, a phase spectrum calculation unit 143, and a waveform reconstruction unit 144 are provided.
- the input spectrum acquisition unit 141 acquires the power spectrum of the input optical signal generated by the input optical signal generation device 200. For example, when the power spectrum of the input optical signal generated by the input optical signal generation device 200 is known, the input spectrum acquisition unit 141 reads the data of the power spectrum stored in the storage unit or the like, thereby Get the power spectrum of. On the other hand, when the power spectrum of the input optical signal generated by the input optical signal generation device 200 is not known, the input spectrum acquisition unit 141 calculates the power spectrum of the input optical signal measured using a spectroscope (not shown). get.
- the power spectrum acquired by the input spectrum acquisition unit 141 is data indicating the light intensity for each wavelength of the input optical signal.
- the output spectrum acquisition unit 142 is a power spectrum of an output optical signal that is output after the input optical signal has propagated through the highly nonlinear optical fiber 120, and a plurality of power spectra measured by the spectrometer 130 are measured power spectra. Acquired for each input light signal of intensity.
- the measured power spectrum is data indicating the intensity of light for each wavelength of the output optical signal.
- the phase spectrum calculation unit 143 simulates the propagation of the input optical signal in the highly nonlinear optical fiber 120 using the parameters, so that the output when it is assumed that the input optical signals having a plurality of intensities have a given phase spectrum.
- the power spectrum of the optical signal is calculated as a calculated power spectrum for each input optical signal having a plurality of intensities.
- the phase spectrum calculation unit 143 is configured such that the difference value between the calculated power spectrum for each of the plurality of intensities and the measured power spectrum for each of the plurality of intensities acquired by the output spectrum acquisition unit 142 is equal to or less than a predetermined threshold.
- a given phase spectrum is calculated as the phase spectrum of the input optical signal.
- the phase spectrum calculation unit 143 searches for a given phase spectrum whose difference value is equal to or less than a predetermined threshold while changing the given phase spectrum according to the annealing method, thereby obtaining the phase spectrum of the input optical signal. calculate.
- the phase spectrum calculated by the phase spectrum calculation unit 143 is data indicating the phase for each wavelength of the optical signal.
- the parameter is a parameter related to self-phase modulation, and is a parameter specific to the highly nonlinear optical fiber 120.
- the simulation executed by the phase spectrum calculation unit 143 is, for example, a pulse propagation simulation by a split step method or the like. That is, the simulation executed by the phase spectrum calculation unit 143 is an optical signal propagation simulation for calculating the power spectrum of the output optical signal by using a known parameter unique to the highly nonlinear optical fiber 120.
- the predetermined threshold value in the above may be a predetermined constant value or a value that dynamically changes during the simulation. For example, even if the predetermined threshold value is a difference value obtained when the convergence condition of the solution sequentially searched by the annealing method is satisfied (for example, when the change rate of the solution is equal to or lower than a predetermined change rate) Good. Further, for example, the predetermined threshold value may be a difference value obtained when a solution search is performed a predetermined number of times.
- the waveform reconstruction unit 144 reconstructs the time waveform of the input optical signal by performing frequency / time conversion on the phase spectrum calculated by the phase spectrum calculation unit 143 and the power spectrum acquired by the input spectrum acquisition unit 141. To do. Specifically, the waveform reconstruction unit 144 reconstructs a time waveform by, for example, inverse Fourier transforming the phase spectrum and the power spectrum.
- FIG. 3 is a flowchart showing the operation of the waveform reconstruction device 140 according to the embodiment of the present invention.
- the input spectrum acquisition unit 141 acquires the power spectrum of the input optical signal generated by the input optical signal generation device 200 (step S101). Subsequently, the output spectrum acquisition unit 142 acquires the power spectrum of the output optical signal corresponding to the input optical signals having a plurality of intensities measured by the spectrometer 130 as a measured power spectrum (step S102).
- the phase spectrum calculation unit 143 determines a phase spectrum as an initial value (step S103). For example, the phase spectrum calculation unit 143 determines an arbitrary phase spectrum as an initial value. Further, for example, the phase spectrum calculation unit 143 may determine the phase spectrum obtained when it is assumed that the input optical signal is a pulse of a predetermined type as an initial value.
- the phase spectrum calculation unit 143 simulates propagation of the input optical signal in the highly nonlinear optical fiber 120 using the parameters related to the self-phase modulation of the highly nonlinear optical fiber 120. Thereby, the phase spectrum calculation unit 143 uses the power spectrum of the output optical signal as the calculated power spectrum when it is assumed that the phase spectrum of the input optical signal having a plurality of intensities has the phase spectrum determined in step S103 or step S106. The calculation is performed for each input optical signal having a plurality of intensities (step S104).
- the phase spectrum calculation unit 143 calculates each of the calculated power spectrum for each of the plurality of intensities and the measured power spectrum for each of the plurality of intensities measured by the spectroscope 130 (obtained in step S102). It is determined whether or not the sum of the difference values in intensity is equal to or less than a predetermined threshold value (step S105).
- the phase spectrum calculation unit 143 determines a new phase spectrum to be used for the simulation according to the annealing method (Step S106). Then, the processing from step S104 is repeated again.
- step S105 when it is determined that the difference value is equal to or smaller than the predetermined threshold value (Yes in step S105), the phase spectrum used for the simulation is calculated as the phase spectrum of the input optical signal (step S107).
- step S108 by performing frequency / time conversion between the power spectrum of the input optical signal and the calculated phase spectrum, the time waveform of the input optical signal is reconstructed (step S108), and the process is terminated.
- the waveform reconstruction device 140 simply uses the power spectrum of the output optical signal that is output after the input optical signal propagates through the optical fiber that induces self-phase modulation, to simplify the time waveform of the optical signal. Reconfiguration is possible.
- the input optical signal generation device 200 amplifies the 1.3 ps optical pulse output from the MLLD with a period of 10 GHz by EDFA after dispersion-compensating with 65 m SMF.
- the input optical signal generation device 200 outputs the optical pulse thus amplified by the EDFA as an input optical signal.
- VOA Variable Optical Attenuator
- the intensity adjuster 110 changed the intensity of the input optical signal generated by the input optical signal generation apparatus 200 to 10 different intensities by increasing the power from 17.2 mW by 10.3 mW.
- the intensity adjuster 110 then outputs the input optical signal whose intensity has been changed to the highly nonlinear optical fiber 120.
- the highly nonlinear optical fiber 120 an optical fiber having parameters shown in Table 1 in consideration of the fourth order dispersion in addition to the second order and the third order was used.
- FIG. 4 show the power spectrum of the output optical signal corresponding to the ten types of intensity of the input optical signal, measured by the spectroscope 130.
- the horizontal axis of the graph indicates the wavelength (Wavelength (nm)), and the vertical axis indicates the intensity (Intensity (au)).
- the power of the intensity adjuster 110 is 17.2 mW, 27.5 mW, 37.8 mW, 48.1 mW, 58.4 mW, 68. It is the power spectrum of an output optical signal when it is 7mW, 79.0mW, 89.4mW, 99.7mW, and 110.0mW.
- the phase spectrum calculation unit 143 included in the waveform reconstruction device 140 includes an actual measurement value of the power spectrum of the output optical signal (shown in (a) to (g) of FIG. 4) corresponding to seven types of intensity, Using the difference value from the calculated value of the power spectrum of the output optical signal obtained by the simulation as an evaluation function, the phase spectrum that minimizes the evaluation function was searched while changing the phase spectrum according to the annealing method. At that time, as the initial value of the phase spectrum, the phase spectrum obtained by approximating the optical pulse by the Gerchberg-Saxton method based on the pulse width obtained by autocorrelation was used. By using such a phase spectrum as an initial value, it is possible to converge the evaluation function at an early stage.
- FIG. 5 is a graph showing experimental results of changes in the evaluation function during the search for the phase spectrum.
- the horizontal axis of the graph indicates the number of iterations of the evaluation function (Number of iteration times), and the vertical axis indicates the value of the evaluation function (Evaluation function (au)).
- the phase spectrum calculation unit 143 determines the phase spectrum when the evaluation function converges to a constant value (for example, 2500th in FIG. 5) as the phase spectrum of the input optical signal.
- FIG. 6 is a diagram showing a power spectrum and a phase spectrum obtained by experiments.
- the horizontal axis indicates the wavelength (Wavelength (nm)).
- the left side indicates intensity (Intensity (au)), and the right side indicates phase (Phase (rad)).
- the power spectrum 601 corresponds to the intensity on the left vertical axis
- the phase spectrum 602 corresponds to the phase on the right vertical axis.
- the waveform reconstruction unit 144 included in the waveform reconstruction device 140 reconstructs the time waveform of the input optical signal using the phase spectrum 602 calculated as shown in FIG. 6 and the power spectrum 601 of the input optical signal.
- FIG. 7 is a diagram showing experimental results of the time waveform of the input optical signal reconstructed by the waveform reconstructing device 140.
- the horizontal axis indicates time (Delay time (ps)), and the vertical axis indicates intensity (Intensity (au)).
- the time waveform of the reconstructed input optical signal is different from the sech type or Gaussian type time waveform approximated as general pulse light. That is, it is considered that the waveform reconstruction device 140 can reconstruct a time waveform that is more accurate than a time waveform obtained by general approximation.
- FIG. 8 is a graph showing a comparison result between the measured value and the calculated value of the power spectrum of the output optical signal corresponding to the intensity of the seven types of input optical signals.
- the calculated value of the power spectrum is a value of the power spectrum obtained when the evaluation function has converged by repeated calculation.
- the seven types of intensities of the input optical signal are those when the power of the intensity adjuster 110 is 17.2 mW, 27.5 mW, 37.8 mW, 48.1 mW, 58.4 mW, 68.7 mW, and 79.0 mW. It is strength.
- the actually measured value 801 and the calculated value 802 substantially coincide with each other. Therefore, in this experiment, it can be seen that the power spectrum change due to self-phase modulation, which responds sensitively to the time waveform of the input optical signal, can be accurately simulated.
- FIG. 9 corresponds to the intensity of three types of input optical signals that were not used for the calculation of the phase spectrum among the power spectra of the output optical signals corresponding to the intensity of the ten types of input optical signals measured by the spectrometer 130. It is a graph which shows the comparison result of the measured value and the calculated value of the power spectrum of the output optical signal.
- the calculated value of the power spectrum is a value when a simulation is performed using the phase spectrum of the input optical signal calculated by the phase spectrum calculation unit 143.
- the intensity of the three types of input optical signals that are not used for calculating the phase spectrum is the intensity when the power of the intensity adjuster 110 is 89.4 mW, 99.7 mW, and 110.0 mW.
- the actually measured value 901 and the calculated value 902 substantially coincide with each other. That is, the power spectrum of the output optical signal is accurately calculated using the phase spectrum calculated by the phase spectrum calculation unit 143 even for the intensity of the input optical signal that is not the target of the evaluation function in the annealing method. Therefore, it can be seen that the accuracy of the phase spectrum of the input optical signal calculated by the phase spectrum calculation unit 143 is high. That is, it can be said that the time waveform accuracy of the input optical signal reconstructed using the phase spectrum of the input optical signal calculated by the phase spectrum calculating unit 143 is high.
- the waveform reconstruction system 100 and the waveform reconstruction device 140 have the power spectrum of the output optical signal output after the input optical signal propagates through the optical fiber that induces self-phase modulation. Can be used to reconstruct the time waveform of the input optical signal. Therefore, in the waveform reconstruction system 100 and the waveform reconstruction device 140, time-resolved spectroscopic data is not always necessary. That is, the waveform reconstruction system 100 does not necessarily include an ultrafast time gate or a reference light source necessary for obtaining time-resolved spectroscopic data in order to reconstruct the time waveform of the optical signal. The waveform can be easily reconstructed.
- the waveform reconstruction system 100 and the waveform reconstruction device 140 can search for a difference value that is equal to or smaller than a predetermined threshold while changing the phase spectrum in accordance with the annealing method that is a well-known technique. It becomes possible to calculate a phase spectrum with high accuracy.
- the waveform reconstruction device and the waveform reconstruction system according to one aspect of the present invention have been described based on the embodiments.
- the present invention is not limited to these embodiments. Unless it deviates from the meaning of this invention, what made the various deformation
- the phase spectrum calculation unit 143 calculates the phase spectrum of the input optical signal by searching for a phase spectrum in which the difference value is equal to or less than a predetermined threshold while changing the phase spectrum according to the annealing method.
- the waveform reconstruction device and the waveform reconstruction system according to one aspect of the present invention are not limited to such a waveform reconstruction device and a waveform reconstruction system.
- the phase spectrum calculation unit 143 may search for a phase spectrum in which the difference value is equal to or less than a predetermined threshold while changing the phase spectrum according to a genetic algorithm.
- the waveform reconstruction device and the waveform reconstruction system may be an algorithm for calculating a phase spectrum that minimizes an evaluation function when a difference value equal to or less than a predetermined threshold is used as an evaluation function. Any algorithm may be used. Further, for example, the phase spectrum calculation unit 143 may search for a phase spectrum in which the difference value is equal to or less than a predetermined threshold while changing the phase spectrum randomly, for example, without using an algorithm.
- the highly nonlinear optical fiber 120 is an optical fiber in which the parameters considered up to the fourth-order dispersion are known, but the parameters considered up to higher-order dispersion are known.
- An optical fiber may be used.
- the present invention can also be realized as a waveform reconstruction method for executing processing performed by the characteristic components of such a waveform reconstruction device.
- the waveform reconstruction method can be realized as a program for causing a computer as shown in FIG.
- Such a program can be distributed via a recording medium such as a CD-ROM or a transmission medium such as the Internet.
- FIG. 10 is a diagram illustrating an example of a hardware configuration of a computer.
- a program for causing a computer to execute the waveform reconstruction method is stored in, for example, a CD-ROM 515 that is a computer-readable medium, and is read out via the CD-ROM device 514. Further, for example, a program for causing a computer to execute the waveform reconstruction method is transmitted via a wired or wireless network, broadcast, or the like.
- the computer 500 includes a CPU (Central Processing Unit) 501, a ROM (Read Only Memory) 502, a RAM (Random Access Memory) 503, a hard disk 504, a communication interface 505, and the like.
- a CPU Central Processing Unit
- ROM Read Only Memory
- RAM Random Access Memory
- the CPU 501 executes a program read via the CD-ROM device 514 or a program received via the communication interface 505. Specifically, the CPU 501 expands a program read via the CD-ROM device 514 or a program received via the communication interface 505 in the RAM 503. Then, the CPU 501 executes each coded instruction in the program expanded in the RAM 503.
- the ROM 502 is a read-only memory that stores programs and data necessary for the operation of the computer 500.
- the RAM 503 is used as a work area when the CPU 501 executes a program. Specifically, the RAM 503 temporarily stores data such as parameters at the time of program execution, for example.
- the hard disk 504 stores programs, data, and the like.
- the communication interface 505 communicates with other computers via a network.
- the bus 506 connects the CPU 501, ROM 502, RAM 503, hard disk 504, communication interface 505, display 511, keyboard 512, mouse 513 and CD-ROM device 514 to one another.
- the waveform reconstruction device and waveform reconstruction system according to an aspect of the present invention can be used as a time waveform measurement device for ultrafast optical pulses used in research fields such as optical communication.
- the use of optical communication codes using phases and nonlinear optical signal processing that is sensitive to the state of optical pulses has been actively studied or used, so that accurate and accurate time waveforms can be measured.
- the waveform reconstruction device and waveform reconstruction system according to one aspect of the present invention are very useful not only in the industrial field but also in the basic science field.
Landscapes
- Physics & Mathematics (AREA)
- Spectroscopy & Molecular Physics (AREA)
- General Physics & Mathematics (AREA)
- Photometry And Measurement Of Optical Pulse Characteristics (AREA)
- Optical Modulation, Optical Deflection, Nonlinear Optics, Optical Demodulation, Optical Logic Elements (AREA)
- Spectrometry And Color Measurement (AREA)
Abstract
超高速時間ゲート又は参照光源を用いることなく、正確な光信号の時間波形を簡便に再構成できる波形再構成装置を提供することを目的とする。 波形再構成装置(140)は、光ファイバの自己位相変調に関するパラメータを用いて入力光信号の光ファイバ内の伝播をシミュレーションすることにより、複数の強度の入力光信号の位相スペクトルが所与の位相スペクトルを有すると仮定した場合における出力光信号のパワースペクトルを複数の強度の入力光信号ごとに計算し、計算したパワースペクトルと計測されたパワースペクトルとの差分値が所定閾値以下となる所与の位相スペクトルを入力光信号の位相スペクトルとして算出する位相スペクトル算出部(143)と、算出された位相スペクトルと入力光信号のパワースペクトルとを周波数/時間変換することにより、入力光信号の時間波形を再構成する波形再構成部(144)とを備える。
Description
本発明は、光信号の時間波形を再構成する波形再構成装置等に関するものである。
近年、非線形光学効果を利用した情報通信システム等の実用化に向け、光信号の正確な時間波形の情報を得ることは極めて重要となっている。そこで、光信号の正確な時間波形の情報を取得するために、光サンプリングオシロスコープ、オートコリレータなどを用いて、光信号の時間波形の強度分布が計測される。その結果、計測された強度分布から、光信号の振幅情報が取得される。しかしながら、計測された強度分布からは、光信号の位相情報は取得できない。つまり、光信号の強度分布を計測しただけでは、光信号の時間波形の情報を取得することはできない。
そこで、光信号の位相を取得するための様々な方法が、提案されている(例えば、非特許文献1及び2を参照)。非特許文献1及び2に記載の方法は、時間分解分光に基づいて光信号の位相を取得する方法である。具体的には、非特許文献1及び2に記載の方法では、超高速時間ゲート又は参照光源を利用することにより、光信号の位相を取得する。そして、取得した位相を用いて、光信号の時間波形が再構成される。
D.J.Kane、R.Trebino、「Characterization of arbitrary femtosecond pulses using frequency-resolved optical gating」、IEEE J.Quantum Electron、Vol.29、1993、pp571~pp579
C.Dorrer、M.Joffre、「Characterization of the spectral phase of ultrashort light pulses」、C.R.Acad.Sci.Paris、Vol.2、2001、pp1415
しかしながら、上記従来の方法では、超高速時間ゲート又は参照光源を必要とするために、光信号とゲートとの時間調整並びに安定性及びSN(Signal-Noise)比の確保など非常に高い技術レベルが要求される。
そこで、本発明は、光信号の時間波形を簡便に再構成できる波形再構成装置を提供することを目的とする。
上記目的を達成するために、本発明の一態様に係る波形再構成装置は、入力光信号の時間波形を再構成する波形再構成装置であって、前記入力光信号のパワースペクトルを取得する入力スペクトル取得部と、自己位相変調を誘起する光ファイバ内を前記入力光信号が伝播した後に出力される出力光信号を計測することにより得られるパワースペクトルを計測パワースペクトルとして、複数の強度の前記入力光信号ごとに取得する出力スペクトル取得部と、前記光ファイバの自己位相変調に関するパラメータを用いて前記入力光信号の前記光ファイバ内の伝播をシミュレーションすることにより、前記複数の強度の入力光信号の位相スペクトルが所与の位相スペクトルを有すると仮定した場合における出力光信号のパワースペクトルを計算パワースペクトルとして前記複数の強度の入力光信号ごとに計算し、前記計算パワースペクトルと前記計測パワースペクトルとの差分値が所定閾値以下となる前記所与の位相スペクトルを前記入力光信号の位相スペクトルとして算出する位相スペクトル算出部と、前記位相スペクトル算出部により算出された位相スペクトルと、前記入力スペクトル取得部により取得されたパワースペクトルとを周波数/時間変換することにより、前記入力光信号の時間波形を再構成する波形再構成部とを備える。
これによって、自己位相変調を誘起する光ファイバ内を入力光信号が伝播した後に出力される出力光信号のパワースペクトルを用いて、入力光信号の時間波形を再構成することができるので、光信号の時間波形を簡便に再構成することが可能となる。
また、前記位相スペクトル算出部は、予め定められたアルゴリズムに従って前記所与の位相スペクトルを変化させながら前記差分値が前記所定閾値以下となる前記所与の位相スペクトルを探索することにより、前記入力光信号の位相スペクトルを算出してもよい。
これによって、予め定められたアルゴリズムに従って位相スペクトルを変化させながら、所定閾値以下となる差分値を探索することができるので、比較的短時間に精度の高い位相スペクトルを得ることが可能となる。
また、本発明の一態様に係る波形再構成システムは、入力光信号の時間波形を再構成する波形再構成システムであって、前記入力光信号の強度を互いに異なる複数の強度に変化させる強度調節器と、当該光ファイバ内を伝播する光信号の自己位相変調を誘起する光ファイバであって、前記自己位相変調に関するパラメータが既知である光ファイバと、前記強度調節器により強度が変化された前記入力光信号が前記光ファイバ内を伝播した後に出力される出力光信号のパワースペクトルを前記複数の強度ごとに計測するスペクトル計測器と、前記波形再構成装置とを備え、前記出力スペクトル取得部は、前記スペクトル計測器により計測されたパワースペクトルを計測パワースペクトルとして取得する。
これによって、パラメータが既知の光ファイバとスペクトル計測器とがあれば入力光信号の時間波形を再構成できるので、超高速時間ゲート又は参照光源を必ずしも備えなくてもよい。つまり、光信号の時間波形を簡便に再構成することが可能となる。
また、前記光ファイバは、少なくとも二次、三次及び四次分散の自己位相変調に関するパラメータが既知であることが好ましい。
これによって、光信号の時間波形を、より高精度に再構成することが可能となる。
なお、本発明は、このような波形再構成装置として実現することができるだけでなく、このような波形再構成装置が備える特徴的な構成部の動作をステップとする波形再構成方法として実現することができる。さらに、波形再構成方法に含まれる各ステップをコンピュータに実行させるプログラムとして実現することもできる。そして、そのようなプログラムは、CD-ROM(Compact Disc-Read Only Memory)等の記録媒体又はインターネット等の伝送媒体を介して配信することができるのは言うまでもない。
以上の説明から明らかなように、本発明の一態様に係る波形再構成装置は、自己位相変調を誘起する光ファイバ内を入力光信号が伝播した後に出力される出力光信号のパワースペクトルを用いて、入力光信号の時間波形を再構成することができるので、光信号の時間波形を簡便に再構成することが可能となる。
本発明の一態様に係る波形再構成システム及び波形再構成装置は、ある複数のスペクトル変化の組合せを引き起こす時間波形は限定されるという非線形光学効果の特徴を利用し、入力光信号の時間波形の再構成を行う。具体的には、波形再構成システム及び波形再構成装置は、入力光信号の強度を変化させたときに得られる、非線形光学効果による複数のスペクトル変化を、実測値と計算値とで比較し、その比較結果を利用して入力光信号の時間波形の再構成を行う。時間波形の再構成に必要な位相スペクトルは、焼きなまし法などの最適化アルゴリズムに従ってシミュレーションにより計算された計算パワースペクトル(計算値)が計測パワースペクトル(実測値)に近づくように位相スペクトルを変化させていくことにより決定される。
以下に、本発明の実施の形態について、図面を参照しながら説明する。
図1は、本発明の実施の形態に係る波形再構成システム100の全体的な構成を示す図である。この波形再構成システム100は、入力光信号の時間波形を再構成するシステムである。図1に示すように、波形再構成システム100は、強度調節器110、高非線形光ファイバ120、分光器130及び波形再構成装置140を備える。
強度調節器110は、入力光信号生成装置200により生成された入力光信号の強度を変化させる。
高非線形光ファイバ120は、光ファイバの一例であり、当該高非線形光ファイバ120内を伝播する光信号の自己位相変調を誘起する。ここで、自己位相変調とは、非線形光学効果の一例である。光ファイバなどの媒質の屈折率は、その中を伝播する光信号の強度に比例してわずかに変化するため、光信号自身に位相変調が生じる。このようにして生じる位相変調を自己位相変調という。
また、高非線形光ファイバ120は、自己位相変調に関するパラメータが既知のファイバである。具体的には、高非線形光ファイバ120は、例えば、二次及び三次に加え、四次分散までを示すパラメータが既知である光ファイバである。なお、強度調節器110により強度が変化された入力光信号が高非線形光ファイバ120内を伝播する。
分光器130は、スペクトル計測器の一例であり、出力光信号を波長ごとの光に分解し、波長ごとに分解した光をO/E変換及びA/D変換することにより、デジタル値で表されたパワースペクトルを生成する。すなわち、分光器130は、出力光信号のパワースペクトルを計測する。ここで出力光信号とは、入力光信号が高非線形光ファイバ120内を伝播した後に出力される光信号である。
波形再構成装置140は、例えば、図10に示すようなコンピュータにより実現され、入力光信号の時間波形を再構成する。波形再構成装置140の詳細は図2を用いて後述する。
入力光信号生成装置200は、入力光信号を生成する装置である。具体的には、入力光信号生成装置200は、例えば、MLLD(Mode-Locked Laser Diode)と、SMF(Single Mode Fiber)と、EDFA(Erbium Doped Fiber Amplifier)とを備える。入力光信号生成装置200は、MLLDから出力された光パルスを、SMFにより分散補償し、EDFAにより増幅する。
図2は、本発明の実施の形態に係る波形再構成装置140の特徴的な機能構成を示すブロック図である。図2に示すように、入力スペクトル取得部141、出力スペクトル取得部142、位相スペクトル算出部143及び波形再構成部144を備える。
入力スペクトル取得部141は、入力光信号生成装置200により生成された入力光信号のパワースペクトルを取得する。例えば、入力光信号生成装置200により生成された入力光信号のパワースペクトルが既知である場合、入力スペクトル取得部141は、記憶手段等に格納されたパワースペクトルのデータを読み出すことにより、入力光信号のパワースペクトルを取得する。一方、入力光信号生成装置200により生成された入力光信号のパワースペクトルが既知でない場合、入力スペクトル取得部141は、図示していない分光器等を用いて計測された入力光信号のパワースペクトルを取得する。なお、入力スペクトル取得部141が取得するパワースペクトルとは、入力光信号の波長ごとの光の強度を示したデータである。
出力スペクトル取得部142は、入力光信号が高非線形光ファイバ120内を伝播した後に出力される出力光信号のパワースペクトルであって、分光器130により計測されたパワースペクトルを計測パワースペクトルとして複数の強度の入力光信号ごとに取得する。ここで、計測パワースペクトルとは、出力光信号の波長ごとの光の強度を示したデータである。
位相スペクトル算出部143は、パラメータを用いて入力光信号の高非線形光ファイバ120内の伝播をシミュレーションすることにより、複数の強度の入力光信号が所与の位相スペクトルを有すると仮定した場合における出力光信号のパワースペクトルを計算パワースペクトルとして複数の強度の入力光信号ごとに計算する。そして、位相スペクトル算出部143は、計算した複数の強度ごとの計算パワースペクトルと、出力スペクトル取得部142により取得された複数の強度ごとの計測パワースペクトルとの差分値が、所定閾値以下となる所与の位相スペクトルを入力光信号の位相スペクトルとして算出する。具体的には、位相スペクトル算出部143は、焼きなまし法に従って所与の位相スペクトルを変化させながら差分値が所定閾値以下となる所与の位相スペクトルを探索することにより、入力光信号の位相スペクトルを算出する。
なお、位相スペクトル算出部143が算出する位相スペクトルとは、光信号の波長ごとの位相を示すデータである。また、パラメータとは、自己位相変調に関するパラメータであり、高非線形光ファイバ120に固有のパラメータである。また、位相スペクトル算出部143により実行されるシミュレーションは、例えば、スプリットステップ法などによるパルス伝播シミュレーションである。すなわち、位相スペクトル算出部143により実行されるシミュレーションは、高非線形光ファイバ120に固有の既知のパラメータを利用して、出力光信号のパワースペクトルを計算するための光信号伝播シミュレーションである。
また、上記における所定閾値は、予め定められた一定値であってもよいし、シミュレーション中に動的に変化する値であってもよい。例えば、所定閾値は、焼きなまし法により順次探索される解の収束条件を満たしたとき(例えば、解の変化率が予め定められた変化率以下となったとき)に得られる差分値であってもよい。さらに、例えば、所定閾値は、予め定められた探索回数だけ解の探索がなされたときに得られる差分値であってもよい。
波形再構成部144は、位相スペクトル算出部143により算出された位相スペクトルと、入力スペクトル取得部141により取得されたパワースペクトルとを周波数/時間変換することにより、入力光信号の時間波形を再構成する。具体的には、波形再構成部144は、例えば、位相スペクトルとパワースペクトルとを逆フーリエ変換することにより、時間波形を再構成する。
次に、以上のように構成された波形再構成装置140における各種動作について説明する。
図3は、本発明の実施の形態に係る波形再構成装置140における動作を示すフローチャートである。
まず、入力スペクトル取得部141は、入力光信号生成装置200により生成された入力光信号のパワースペクトルを取得する(ステップS101)。続いて、出力スペクトル取得部142は、分光器130により計測された、複数の強度の入力光信号に対応する出力光信号のパワースペクトルを計測パワースペクトルとして取得する(ステップS102)。
次に、位相スペクトル算出部143は、初期値となる位相スペクトルを決定する(ステップS103)。例えば、位相スペクトル算出部143は、任意の位相スペクトルを初期値と決定する。また、例えば、位相スペクトル算出部143は、入力光信号が予め定められた型のパルスであると仮定したときに得られる位相スペクトルを初期値と決定してもよい。
そして、位相スペクトル算出部143は、高非線形光ファイバ120の自己位相変調に関するパラメータを用いて入力光信号の高非線形光ファイバ120内の伝播をシミュレーションする。これにより、位相スペクトル算出部143は、複数の強度の入力光信号の位相スペクトルがステップS103又はステップS106において決定された位相スペクトルを有すると仮定した場合における出力光信号のパワースペクトルを計算パワースペクトルとして、複数の強度の入力光信号ごとに計算する(ステップS104)。
次に、位相スペクトル算出部143は、計算された複数の強度ごとの計算パワースペクトルと、分光器130により計測された(ステップS102において取得された)複数の強度ごとの計測パワースペクトルとの、各強度における差分値の合計が、所定閾値以下か否かを判定する(ステップS105)。
ここで、差分値の合計が所定閾値より大きいと判定された場合(ステップS105のNo)、位相スペクトル算出部143は、シミュレーションに用いる新たな位相スペクトルを、焼きなまし法に従って決定する(ステップS106)。そして、再度、ステップS104からの処理が繰り返される。
一方、差分値が所定閾値以下であると判定された場合(ステップS105のYes)、シミュレーションに用いた位相スペクトルを入力光信号の位相スペクトルとして算出する(ステップS107)。
最後に、入力光信号のパワースペクトルと、算出された位相スペクトルとを周波数/時間変換することにより、入力光信号の時間波形を再構成し(ステップS108)、処理を終了する。
以上の処理により、波形再構成装置140は、自己位相変調を誘起する光ファイバ内を入力光信号が伝播した後に出力される出力光信号のパワースペクトルを用いて、光信号の時間波形を簡便に再構成することが可能となる。
次に、上記の波形再構成システム100により得られた実験結果について説明する。
本実験では、入力光信号生成装置200は、MLLDから10GHzの周期で出力された1.3psの光パルスを、65mのSMFにより分散補償した後に、EDFAにより増幅した。このようにEDFAにより増幅された光パルスを、入力光信号生成装置200は入力光信号として出力した。
強度調節器110には、可変光減衰器(VOA:Variable Optical Attenuator)を用いた。強度調節器110は、電力を17.2mWから10.3mWずつ上げていくことにより、入力光信号生成装置200により生成された入力光信号の強度を10種類の異なる強度に変更した。そして、強度調節器110は、強度を変更した入力光信号を高非線形光ファイバ120に出力した。
高非線形光ファイバ120には、二次及び三次に加え、四次分散まで考慮した、表1に示すパラメータを有する光ファイバを用いた。

分光器130により計測された、入力光信号の10種類の強度に対応する出力光信号のパワースペクトルを、図4の(a)~(j)に示す。図において、グラフの横軸は波長(Wavelength(nm))を示し、縦軸は強度(Intensity(a.u.))を示す。また、図4の(a)~(j)に示すパワースペクトルのそれぞれは、強度調節器110の電力が順に17.2mW、27.5mW、37.8mW、48.1mW、58.4mW、68.7mW、79.0mW、89.4mW、99.7mW、及び110.0mWであるときの出力光信号のパワースペクトルである。
本実験では、波形再構成装置140が備える位相スペクトル算出部143は、7種類の強度に対応する(図4の(a)~(g)に示す)出力光信号のパワースペクトルの実測値と、シミュレーションにより得られる出力光信号のパワースペクトルの計算値との差分値を評価関数として、焼きなまし法に従って位相スペクトルを変化させながら評価関数が最小となる位相スペクトルを探索した。その際、位相スペクトルの初期値には、オートコリレーションにより求めたパルス幅を元にGerchberg-Saxton法によりSech型光パルスに近似した際の位相スペクトルを用いた。このような位相スペクトルを初期値として利用することにより、早期に評価関数を収束させることが可能となった。
図5は、位相スペクトルの探索中における評価関数の変化の実験結果を示すグラフである。図5において、グラフの横軸は評価関数の繰り返し計算回数(Number of iteration times)を示し、縦軸は評価関数の値(Evaluation function(a.u.))を示す。
図5から明らかなように、比較的早期に評価関数が一定値に収束している。位相スペクトル算出部143は、評価関数が一定値に収束したとき(例えば、図5における2500回目)の位相スペクトルを入力光信号の位相スペクトルと決定した。
図6は、実験により得られたパワースペクトルと位相スペクトルとを示す図である。図6において、横軸は波長(Wavelength(nm))を示す。また、縦軸は左側が強度(Intensity(a.u.))を示し、右側が位相(Phase(rad))を示す。ここで、パワースペクトル601が左側縦軸の強度に対応し、位相スペクトル602が右側縦軸の位相に対応する。
波形再構成装置140が備える波形再構成部144は、図6のように算出された位相スペクトル602と、入力光信号のパワースペクトル601とを用いて、入力光信号の時間波形を再構成する。
図7は、波形再構成装置140により再構成された入力光信号の時間波形の実験結果を示す図である。図7において、横軸は時間(Delay time(ps))を示し、縦軸は強度(Intensity(a.u.))を示す。
図7から明らかなように、再構成された入力光信号の時間波形は、一般的なパルス光として近似されるSech型又はGaussian型の時間波形とは異なる。すなわち、波形再構成装置140は、一般的な近似により得られる時間波形よりも正確な時間波形を再構成できたと考えられる。
次に、上記実験において位相スペクトル算出部143により実行されたシミュレーションと算出された位相スペクトルとの妥当性を検証する。
図8は、7種類の入力光信号の強度に対応する出力光信号のパワースペクトルの実測値と計算値との比較結果を示すグラフである。なお、パワースペクトルの計算値は、繰り返し計算により評価関数が収束したときに得られたパワースペクトルの値である。また、入力光信号の7種類の強度は、強度調節器110の電力が17.2mW、27.5mW、37.8mW、48.1mW、58.4mW、68.7mW、及び79.0mWのときの強度である。
図8の(a)~(g)に示すように、実測値801と計算値802とは略一致している。したがって、本実験において、入力光信号の時間波形に敏感に反応する、自己位相変調によるパワースペクトルの変化を正確にシミュレーションできていることが分かる。
図9は、分光器130により計測された10種類の入力光信号の強度に対応する出力光信号のパワースペクトルのうち、位相スペクトルの算出に利用されなかった3種類の入力光信号の強度に対応する出力光信号のパワースペクトルの実測値と計算値との比較結果を示すグラフである。なお、パワースペクトルの計算値は、位相スペクトル算出部143により算出された入力光信号の位相スペクトルを用いてシミュレーションしたときの値である。また、位相スペクトルの算出に利用されなかった3種類の入力光信号の強度は、強度調節器110の電力が89.4mW、99.7mW、及び110.0mWのときの強度である。
図9の(a)~(c)に示すように、実測値901と計算値902とは略一致している。つまり、焼きなまし法における評価関数の対象としなかった入力光信号の強度においても、位相スペクトル算出部143により算出された位相スペクトルを用いて出力光信号のパワースペクトルが正確に計算されている。したがって、位相スペクトル算出部143により算出された入力光信号の位相スペクトルの精度が高いことがわかる。つまり、位相スペクトル算出部143により算出された入力光信号の位相スペクトルを用いて再構成される入力光信号の時間波形の精度も高いということができる。
以上のように、上記実施の形態に係る波形再構成システム100及び波形再構成装置140は、自己位相変調を誘起する光ファイバ内を入力光信号が伝播した後に出力される出力光信号のパワースペクトルを用いて、入力光信号の時間波形を再構成することができる。したがって、波形再構成システム100及び波形再構成装置140では、時間分解分光データが必ずしも必要ではない。すなわち、波形再構成システム100は、光信号の時間波形を再構成するために、時間分解分光データを得るために必要な超高速時間ゲート又は参照光源が必ずしも備える必要がないので、光信号の時間波形を簡便に再構成することが可能となる。
さらに、波形再構成システム100及び波形再構成装置140は、公知の技術である焼きなまし法に従って位相スペクトルを変化させながら、所定閾値以下となる差分値を探索することができるので、比較的短時間に精度の高い位相スペクトルを算出することが可能となる。
以上、本発明の一態様に係る波形再構成装置及び波形再構成システムについて、実施の形態に基づいて説明したが、本発明は、これらの実施の形態に限定されるものではない。本発明の趣旨を逸脱しない限り、当業者が思いつく各種変形を本実施の形態に施したものも、本発明の範囲内に含まれる。
例えば、上記実施の形態において、位相スペクトル算出部143は、焼きなまし法に従って位相スペクトルを変化させながら差分値が所定閾値以下となる位相スペクトルを探索することにより入力光信号の位相スペクトルを算出したが、本発明の一態様に係る波形再構成装置及び波形再構成システムは、このような波形再構成装置及び波形再構成システムに限定されるわけではない。例えば、位相スペクトル算出部143は、遺伝的アルゴリズムに従って位相スペクトルを変化させながら差分値が所定閾値以下となる位相スペクトルを探索してもよい。すなわち、本発明の一態様に係る波形再構成装置及び波形再構成システムは、所定閾値以下となる差分値を評価関数とした場合の評価関数が最小となる位相スペクトルを算出するためのアルゴリズムであれば、どのようなアルゴリズムであってもよい。また例えば、位相スペクトル算出部143は、アルゴリズムを用いずに、例えばランダムに位相スペクトルを変化させながら差分値が所定閾値以下となる位相スペクトルを探索してもよい。
また、例えば、上記実施の形態では、高非線形光ファイバ120は、四次分散まで考慮されたパラメータが既知である光ファイバであったが、さらに高次の分散まで考慮されたパラメータが既知である光ファイバであってもよい。
さらに、本発明は、このような波形再構成装置の特徴的な構成要素が行う処理を実行する波形再構成方法として実現することもできる。また、その波形再構成方法を図10に示すようなコンピュータに実行させるためのプログラムとして実現することもできる。そして、そのようなプログラムは、CD-ROM等の記録媒体、インターネット等の伝送媒体を介して配信することができる。
図10は、コンピュータのハードウェア構成の一例を示す図である。波形再構成方法をコンピュータに実行させるためのプログラムは、例えば、コンピュータが読取可能な媒体であるCD-ROM515に記憶され、CD-ROM装置514を介して読み出される。また例えば、波形再構成方法をコンピュータに実行させるためのプログラムは、有線若しくは無線ネットワーク、又は放送などを介して伝送される。
コンピュータ500は、CPU(Central Processing Unit)501、ROM(Read Only Memory)502、RAM(Random Access Memory)503、ハードディスク504、通信インタフェース505等を備える。
CPU501は、CD-ROM装置514を介して読み出されたプログラム、又は通信インタフェース505を介して受信したプログラムを実行する。具体的には、CPU501は、CD-ROM装置514を介して読み出されたプログラム、又は通信インタフェース505を介して受信したプログラムをRAM503に展開する。そして、CPU501は、RAM503に展開されたプログラム中のコード化された各命令を実行する。
ROM502は、コンピュータ500の動作に必要なプログラム及びデータを記憶する読み出し専用メモリである。RAM503は、CPU501がプログラムを実行するときにワークエリアとして使用される。具体的には、RAM503は、例えば、プログラム実行時のパラメータなどのデータを一時的に記憶する。ハードディスク504は、プログラム、データなどを記憶する。
通信インタフェース505は、ネットワークを介して他のコンピュータとの通信を行なう。バス506は、CPU501、ROM502、RAM503、ハードディスク504、通信インタフェース505、ディスプレイ511、キーボード512、マウス513及びCD-ROM装置514を相互に接続する。
本発明の一態様に係る波形再構成装置及び波形再構成システムは、光通信等の研究分野で用いられる超高速光パルスの時間波形の測定装置として利用することができる。特に近年、位相を用いた光通信符号の利用及び光パルスの状態に敏感な非線形光信号処理が盛んに研究又は利用されるようになってきていることから、簡便に正確な時間波形を測定可能な本発明の一態様に係る波形再構成装置及び波形再構成システムは、産業分野だけでなく基礎科学分野にも非常に有用である。
100 波形再構成システム
110 強度調節器
120 高非線形光ファイバ
130 分光器
140 波形再構成装置
141 入力スペクトル取得部
142 出力スペクトル取得部
143 位相スペクトル算出部
144 波形再構成部
110 強度調節器
120 高非線形光ファイバ
130 分光器
140 波形再構成装置
141 入力スペクトル取得部
142 出力スペクトル取得部
143 位相スペクトル算出部
144 波形再構成部
Claims (6)
- 入力光信号の時間波形を再構成する波形再構成装置であって、
前記入力光信号のパワースペクトルを取得する入力スペクトル取得部と、
自己位相変調を誘起する光ファイバ内を前記入力光信号が伝播した後に出力される出力光信号を計測することにより得られるパワースペクトルを計測パワースペクトルとして、複数の強度の前記入力光信号ごとに取得する出力スペクトル取得部と、
前記光ファイバの自己位相変調に関するパラメータを用いて前記入力光信号の前記光ファイバ内の伝播をシミュレーションすることにより、前記複数の強度の入力光信号の位相スペクトルが所与の位相スペクトルを有すると仮定した場合における出力光信号のパワースペクトルを計算パワースペクトルとして前記複数の強度の入力光信号ごとに計算し、前記計算パワースペクトルと前記計測パワースペクトルとの差分値が所定閾値以下となる前記所与の位相スペクトルを前記入力光信号の位相スペクトルとして算出する位相スペクトル算出部と、
前記位相スペクトル算出部により算出された位相スペクトルと、前記入力スペクトル取得部により取得されたパワースペクトルとを周波数/時間変換することにより、前記入力光信号の時間波形を再構成する波形再構成部とを備える
波形再構成装置。 - 前記位相スペクトル算出部は、予め定められたアルゴリズムに従って前記所与の位相スペクトルを変化させながら前記差分値が前記所定閾値以下となる前記所与の位相スペクトルを探索することにより、前記入力光信号の位相スペクトルを算出する
請求項1に記載の波形再構成装置。 - 入力光信号の時間波形を再構成する波形再構成システムであって、
前記入力光信号の強度を互いに異なる複数の強度に変化させる強度調節器と、
当該光ファイバ内を伝播する光信号の自己位相変調を誘起する光ファイバであって、前記自己位相変調に関するパラメータが既知である光ファイバと、
前記強度調節器により強度が変化された前記入力光信号が前記光ファイバ内を伝播した後に出力される出力光信号のパワースペクトルを前記複数の強度ごとに計測するスペクトル計測器と、
請求項1に記載の波形再構成装置とを備え、
前記出力スペクトル取得部は、前記スペクトル計測器により計測されたパワースペクトルを計測パワースペクトルとして取得する
波形再構成システム。 - 前記光ファイバは、少なくとも二次、三次及び四次分散の自己位相変調に関するパラメータが既知である
請求項3に記載の波形再構成システム。 - 入力光信号の時間波形を再構成する波形再構成方法であって、
前記入力光信号のパワースペクトルを取得する入力スペクトル取得ステップと、
自己位相変調を誘起する光ファイバ内を前記入力光信号が伝播した後に出力される出力光信号を計測することにより得られるパワースペクトルを計測パワースペクトルとして、複数の強度の前記入力光信号ごとに取得する出力スペクトル取得ステップと、
前記光ファイバの自己位相変調に関するパラメータを用いて前記入力光信号の前記光ファイバ内の伝播をシミュレーションすることにより、前記複数の強度の入力光信号の位相スペクトルが所与の位相スペクトルを有すると仮定した場合における出力光信号のパワースペクトルを計算パワースペクトルとして前記複数の強度の入力光信号ごとに計算し、前記計算パワースペクトルと前記計測パワースペクトルとの差分値が所定閾値以下となる前記所与の位相スペクトルを前記入力光信号の位相スペクトルとして算出する位相スペクトル算出ステップと、
前記位相スペクトル算出ステップにおいて算出された位相スペクトルと、前記入力スペクトル取得ステップにおいて取得されたパワースペクトルとを周波数/時間変換することにより、前記入力光信号の時間波形を再構成する波形再構成ステップとを含む
波形再構成方法。 - 請求項5に記載の波形再構成方法をコンピュータに実行させるためのプログラム。
Priority Applications (1)
| Application Number | Priority Date | Filing Date | Title |
|---|---|---|---|
| US13/254,624 US8886037B2 (en) | 2009-03-02 | 2010-03-02 | Waveform reconstruction device, waveform reconstruction system, and waveform reconstruction method |
Applications Claiming Priority (2)
| Application Number | Priority Date | Filing Date | Title |
|---|---|---|---|
| JP2009-048608 | 2009-03-02 | ||
| JP2009048608A JP5158810B2 (ja) | 2009-03-02 | 2009-03-02 | 波形再構成装置、波形再構成システム及び波形再構成方法 |
Publications (1)
| Publication Number | Publication Date |
|---|---|
| WO2010100891A1 true WO2010100891A1 (ja) | 2010-09-10 |
Family
ID=42709458
Family Applications (1)
| Application Number | Title | Priority Date | Filing Date |
|---|---|---|---|
| PCT/JP2010/001397 Ceased WO2010100891A1 (ja) | 2009-03-02 | 2010-03-02 | 波形再構成装置、波形再構成システム及び波形再構成方法 |
Country Status (3)
| Country | Link |
|---|---|
| US (1) | US8886037B2 (ja) |
| JP (1) | JP5158810B2 (ja) |
| WO (1) | WO2010100891A1 (ja) |
Cited By (2)
| Publication number | Priority date | Publication date | Assignee | Title |
|---|---|---|---|---|
| WO2013125166A1 (ja) * | 2012-02-20 | 2013-08-29 | 国立大学法人大阪大学 | 波形再構成装置、波形再構成システム及び波形再構成方法 |
| CN117118509A (zh) * | 2023-09-13 | 2023-11-24 | 徐州光引科技发展有限公司 | 一种光通道监控器和监控方法 |
Families Citing this family (4)
| Publication number | Priority date | Publication date | Assignee | Title |
|---|---|---|---|---|
| DK2947446T3 (da) | 2013-01-21 | 2020-03-02 | Univ Osaka | Fremgangsmåde til måling af fysiske konstanter for lys og anordning til vurdering af fysiske konstanter for lys |
| JP6290697B2 (ja) * | 2014-04-22 | 2018-03-07 | 浜松ホトニクス株式会社 | 波形計測装置およびパルス光生成装置 |
| JP7149857B2 (ja) | 2019-01-08 | 2022-10-07 | 浜松ホトニクス株式会社 | データ作成装置、光制御装置、データ作成方法、及びデータ作成プログラム |
| WO2021261476A1 (ja) * | 2020-06-23 | 2021-12-30 | 国立大学法人大阪大学 | 光信号検出システム、光信号検出装置及び光信号検出方法 |
Citations (3)
| Publication number | Priority date | Publication date | Assignee | Title |
|---|---|---|---|---|
| JP2002118315A (ja) * | 2000-05-23 | 2002-04-19 | Imra America Inc | モジュール式、高エネルギ、広波長可変性、超高速、ファイバ光源 |
| JP2005315858A (ja) * | 2004-03-31 | 2005-11-10 | Sun Tec Kk | 光パルス評価装置およびインサービス光パルス評価装置 |
| WO2006102056A1 (en) * | 2005-03-17 | 2006-09-28 | The Board Of Trustees Of The Leland Stanford Junior University | Method of retrieving phase and magnitude of weak ultra-short optical pulses using a stronger unknown pulse |
Family Cites Families (9)
| Publication number | Priority date | Publication date | Assignee | Title |
|---|---|---|---|---|
| JP3018173B1 (ja) | 1998-09-10 | 2000-03-13 | 大阪大学長 | 極短光パルスの波形計測方法 |
| US6456380B1 (en) * | 1999-05-19 | 2002-09-24 | Nippon Telegraph And Telephone Corporation | Method and apparatus for measuring waveform of optical signal |
| US7190705B2 (en) | 2000-05-23 | 2007-03-13 | Imra America. Inc. | Pulsed laser sources |
| US7088756B2 (en) | 2003-07-25 | 2006-08-08 | Imra America, Inc. | Polarization maintaining dispersion controlled fiber laser source of ultrashort pulses |
| US7394591B2 (en) | 2000-05-23 | 2008-07-01 | Imra America, Inc. | Utilization of Yb: and Nd: mode-locked oscillators in solid-state short pulse laser systems |
| US7567596B2 (en) * | 2001-01-30 | 2009-07-28 | Board Of Trustees Of Michigan State University | Control system and apparatus for use with ultra-fast laser |
| JP4296070B2 (ja) | 2003-10-01 | 2009-07-15 | 浜松ホトニクス株式会社 | 位相特性測定装置 |
| WO2005116706A2 (en) * | 2004-05-15 | 2005-12-08 | The Board Of Trustees Of The Leland Stanford Junior University | Method of characterizing fiber bragg gratings using iterative processing |
| US8170874B2 (en) * | 2007-07-02 | 2012-05-01 | Canon Kabushiki Kaisha | Apparatus and method for recognizing speech based on feature parameters of modified speech and playing back the modified speech |
-
2009
- 2009-03-02 JP JP2009048608A patent/JP5158810B2/ja not_active Expired - Fee Related
-
2010
- 2010-03-02 WO PCT/JP2010/001397 patent/WO2010100891A1/ja not_active Ceased
- 2010-03-02 US US13/254,624 patent/US8886037B2/en active Active
Patent Citations (3)
| Publication number | Priority date | Publication date | Assignee | Title |
|---|---|---|---|---|
| JP2002118315A (ja) * | 2000-05-23 | 2002-04-19 | Imra America Inc | モジュール式、高エネルギ、広波長可変性、超高速、ファイバ光源 |
| JP2005315858A (ja) * | 2004-03-31 | 2005-11-10 | Sun Tec Kk | 光パルス評価装置およびインサービス光パルス評価装置 |
| WO2006102056A1 (en) * | 2005-03-17 | 2006-09-28 | The Board Of Trustees Of The Leland Stanford Junior University | Method of retrieving phase and magnitude of weak ultra-short optical pulses using a stronger unknown pulse |
Non-Patent Citations (4)
| Title |
|---|
| C.DORRER ET AL.: "Highly sensitive direct characterization of femtosecond pulses by electro-optic spectral shearing interferometry", OPTICS LETTERS, vol. 28, no. 6, 15 March 2003 (2003-03-15), pages 477 - 479 * |
| HIROOMI GOTO ET AL.: "[Encouragement Talk] All-optical limiter based on signal from transformation -In serach of ideal limiting charactersitics", IEICE TECHNICAL REPORT, vol. 108, no. 476, 2 March 2009 (2009-03-02), pages 23 - 28 * |
| KENTARO KAWANISHI ET AL.: "Hi Senkei Kogaku Koka no Heiko Jotai o Riyo shita Ko Seido Zenko Kyodo Limiter ni yoru Hikari Shingo Shori no Anteika ni Kansuru Kento", 2009 NEN THE INSTITUTE OF ELECTRONICS, INFORMATION AND COMMUNICATION ENGINEERS SOGO TAIKAI KOEN RONBUNSHU TSUSHIN [2], 4 March 2009 (2009-03-04), pages 487 * |
| M. SATO ET AL.: "Adaptive Pulse Shaping of Femtosecond Laser Pulses in Amplitude and Phase through a Single-Mode Fiber by Referring to Frequency-Resolved Optical Gating Patterns", JAPANESE JOURNAL OF APPLIED PHYSICS, vol. 41, no. 6A, 15 June 2002 (2002-06-15), pages 3704 - 3709 * |
Cited By (4)
| Publication number | Priority date | Publication date | Assignee | Title |
|---|---|---|---|---|
| WO2013125166A1 (ja) * | 2012-02-20 | 2013-08-29 | 国立大学法人大阪大学 | 波形再構成装置、波形再構成システム及び波形再構成方法 |
| JP2013170905A (ja) * | 2012-02-20 | 2013-09-02 | Osaka Univ | 波形再構成装置、波形再構成システム及び波形再構成方法 |
| US9337922B2 (en) | 2012-02-20 | 2016-05-10 | Osaka University | Waveform reconstruction device, waveform reconstruction system, and waveform reconstruction method |
| CN117118509A (zh) * | 2023-09-13 | 2023-11-24 | 徐州光引科技发展有限公司 | 一种光通道监控器和监控方法 |
Also Published As
| Publication number | Publication date |
|---|---|
| JP5158810B2 (ja) | 2013-03-06 |
| US20110311223A1 (en) | 2011-12-22 |
| JP2010204308A (ja) | 2010-09-16 |
| US8886037B2 (en) | 2014-11-11 |
Similar Documents
| Publication | Publication Date | Title |
|---|---|---|
| JP6025013B2 (ja) | 波形再構成装置、波形再構成システム及び波形再構成方法 | |
| JP5158810B2 (ja) | 波形再構成装置、波形再構成システム及び波形再構成方法 | |
| Wu et al. | Efficient physics-informed neural network for ultrashort pulse dynamics in optical fibers | |
| WO2019198485A1 (ja) | 光スペクトル線幅演算方法、装置およびプログラム | |
| JP6095235B2 (ja) | 光物性定数計測方法および光物性定数推定装置 | |
| CN119880849B (zh) | 瞬态吸收光谱动力学的拟合方法与装置 | |
| EP1859242B1 (en) | Method of retrieving phase and magnitude of weak ultra-short optical pulses using a stronger unknown pulse | |
| Xiao et al. | Self-referenced spectral interferometry for single-shot characterization of ultrashort free-electron laser pulses | |
| CN113252170B (zh) | 一种太赫兹波谱系统噪声模拟方法及系统 | |
| US12123802B2 (en) | Method for measuring light transmission medium, device for measuring light transmission medium, program for measuring light transmission medium, and recording medium | |
| Hong et al. | Electric-field reconstruction of femtosecond laser pulses from interferometric autocorrelation using an evolutionary algorithm | |
| Ye et al. | KerrNet: Artificial neural networks to speed up perturbation analysis-based models by five orders of magnitude | |
| Jiang et al. | Active learning–augmented end-to-end modeling toward fast inverse design in chirped pulse amplification | |
| Peng et al. | Deep Learning Enabled High-Speed and High-Accuracy Distributed Optical Fiber Temperature Sensing | |
| de Negreiros Júnior et al. | Ultrashort pulses propagation through different approaches of the Split-Step Fourier method | |
| Lanoue et al. | Effects of reference laser intensity noise in a fourier transform spectrometer | |
| CN119538738A (zh) | 一种噪声非线性高精度联合建模方法、装置、设备及介质 | |
| Ma et al. | Probing fiber parameters and predicting pulse evolution by using machine learning algorithms | |
| Laforge et al. | Multiobjective adaptive feedback control of two-photon absorption coupled with propagation through a dispersive medium | |
| Konishi et al. | Optical pulse waveform profiling through real-time stamping to corresponding characteristic spectra | |
| Uddin et al. | Probing power-dependent intensity noise in ultrafast pulses by dispersive Fourier transform | |
| Dorrer | Analysis of pulse replicators for high-bandwidth, high-dynamic-range, single-shot optical characterization | |
| Prade et al. | New method for the determination of the phase and amplitude of intense femtosecond optical pulses | |
| Manzoni et al. | The evolution of signal-to-noise ratio in superfluorescence-contaminated optical parametric chirped-pulse amplification | |
| Fridman | The Picoseconds Structure of Ultrafast Rogue Waves |
Legal Events
| Date | Code | Title | Description |
|---|---|---|---|
| 121 | Ep: the epo has been informed by wipo that ep was designated in this application |
Ref document number: 10748490 Country of ref document: EP Kind code of ref document: A1 |
|
| NENP | Non-entry into the national phase |
Ref country code: DE |
|
| WWE | Wipo information: entry into national phase |
Ref document number: 13254624 Country of ref document: US |
|
| 122 | Ep: pct application non-entry in european phase |
Ref document number: 10748490 Country of ref document: EP Kind code of ref document: A1 |