WO2010061157A1 - Water distribution systems - Google Patents
Water distribution systems Download PDFInfo
- Publication number
- WO2010061157A1 WO2010061157A1 PCT/GB2009/001257 GB2009001257W WO2010061157A1 WO 2010061157 A1 WO2010061157 A1 WO 2010061157A1 GB 2009001257 W GB2009001257 W GB 2009001257W WO 2010061157 A1 WO2010061157 A1 WO 2010061157A1
- Authority
- WO
- WIPO (PCT)
- Prior art keywords
- prv
- benefit
- determining
- year
- water
- Prior art date
Links
Classifications
-
- E—FIXED CONSTRUCTIONS
- E03—WATER SUPPLY; SEWERAGE
- E03B—INSTALLATIONS OR METHODS FOR OBTAINING, COLLECTING, OR DISTRIBUTING WATER
- E03B7/00—Water main or service pipe systems
- E03B7/02—Public or like main pipe systems
-
- G—PHYSICS
- G06—COMPUTING; CALCULATING OR COUNTING
- G06Q—INFORMATION AND COMMUNICATION TECHNOLOGY [ICT] SPECIALLY ADAPTED FOR ADMINISTRATIVE, COMMERCIAL, FINANCIAL, MANAGERIAL OR SUPERVISORY PURPOSES; SYSTEMS OR METHODS SPECIALLY ADAPTED FOR ADMINISTRATIVE, COMMERCIAL, FINANCIAL, MANAGERIAL OR SUPERVISORY PURPOSES, NOT OTHERWISE PROVIDED FOR
- G06Q50/00—Systems or methods specially adapted for specific business sectors, e.g. utilities or tourism
- G06Q50/06—Electricity, gas or water supply
-
- Y—GENERAL TAGGING OF NEW TECHNOLOGICAL DEVELOPMENTS; GENERAL TAGGING OF CROSS-SECTIONAL TECHNOLOGIES SPANNING OVER SEVERAL SECTIONS OF THE IPC; TECHNICAL SUBJECTS COVERED BY FORMER USPC CROSS-REFERENCE ART COLLECTIONS [XRACs] AND DIGESTS
- Y02—TECHNOLOGIES OR APPLICATIONS FOR MITIGATION OR ADAPTATION AGAINST CLIMATE CHANGE
- Y02A—TECHNOLOGIES FOR ADAPTATION TO CLIMATE CHANGE
- Y02A20/00—Water conservation; Efficient water supply; Efficient water use
Definitions
- This invention relates to a water distribution system, and in particular to methods and systems for use in the design and operation of such a water system. Although most of the description herein is directed towards mains cold water supply, it will be appreciated that the invention is equally applicable to other utilities such as district heating systems in which hot water is being supplied.
- PRVs pressure reducing valves
- a PRV is installed in a water distribution system in such a manner as to ensure that the minimum required water pressure is maintained at one or more critical locations within the system.
- difficulties are experienced in trying to determine the most appropriate location for the PRVs and also in determining the most appropriate type of PRV to install at a given location.
- One object of the invention is to provide a method and system for use in the design of a water system to assist in determining appropriate locations for PRVs and/or to assist in determining the appropriate type of PRV to install at a given location.
- a method for use in the design of a water distribution by determining whether to locate a pressure reducing valve (PRV) in a given location comprising the steps of: (a) determining the benefit arising from reduced water leakage achieved by locating a PRV in that location;
- the benefit of locating a PRV in a chosen location can be accurately modelled, thereby assisting in determining whether or not it is worthwhile installing the PRV in that location.
- the method can be used to determine a most appropriate one of the locations in which to install the PRV.
- the method can be used not only to determine whether or where to install a PRV but also to assist in determining, by repetition of the method, the relative merits of a series of different types of PRV, and hence assist in determining which type of PRV is best installed at a given location.
- the method can thus be used to determine whether a fixed-setting, time or flow modulated PRV is best suited for use in a given location.
- the method further includes a step of determining or proposing the most suitable location, type and setting for a number of PRVs.
- the at least one parameter preferably comprises one or more parameters selected from a list including pressure-sensitive demand reductions, direct energy savings, reductions in active leakage control effort, reductions in customer contacts, indirect water savings and indirect energy savings. Preferably all of these parameters are taken into account in calculation of the net benefit value.
- the step of calculating the net benefit value preferably involves calculation of:
- the values of these parameters may be derived in a number of ways, and specific examples of ways of deriving them are set out hereinafter.
- the NWC method has been initially developed for estimating the leakage reduction on DMA level as a function of Average Zone Pressure (AZP) in meters.
- the method is based on computing the "leakage index" which allows comparison of relative leakage rates due to changes in the average zone or network pressure.
- the Leakage Index (L/) is calculated as follows:
- the leakage reduction is then estimated as follows:
- Ll 0 and Ll 1 are the leakage indices before and after pressure reduction, respectively.
- the second methodology applied to estimate the water leakage reduction is the IWA- WLTF method which assumes that reduction of water leakage in water distribution networks is a function of pressure change as follows:
- N 1 leakage exponent (varies between 0.5 and 2.5) which is a function of a pipe material and type of failure.
- N 1 is assumed to be a function " of pipe material only.
- the burst frequency reduction is estimated in accordance with the teaching of Pearson, D., Fantozzi, M., Soares, D., and Waldron, T. (2005). "Searching for N2: How does Pressure Reduction reduce Burst Frequency?" Proceedings of IWA Special Conference 'Leakage 2005', Why, Nova Scotia, Canada, 12-14 September 2005, 368-381 as follows:
- N 2 burst exponent which can be a function of traffic loading, pipe cover depth, working pressure in relation with surges and design pressure, pipe age, soil conditions, quality of installation, pipe material, and change in temperature.
- N 2 burst exponent which can be a function of traffic loading, pipe cover depth, working pressure in relation with surges and design pressure, pipe age, soil conditions, quality of installation, pipe material, and change in temperature.
- N 2 value could be anywhere in the range 0.5 to 6.5 while the analysis of more than 50 international sites done by Pearson et al. mentioned above shows that N 2 values varied between 0.2 and 8.5 (mean value of 2.47) for mains' breaks and between 0.2 and 12 (mean value of 2.36) for service pipe breaks.
- the pressure before and after reduction is evaluated as the average hydraulic pressure in the system.
- pipe bursts are allocated to each network node using the same logic outlined in the previous section.
- CDR ⁇ [WD O * - WD] Jx [CWP + RWWx CWWT]
- CDR b PMD x [WDI - WD] ⁇ xCWT
- WD 0 * and WD] are the pressure-sensitive annual water demand (m 3 /year) before and after pressure reduction;
- CWP unit cost of water at the DMA entrance (£/m 3 );
- RWW ratio of volume of waste water to produced water;
- CWWT unit cost of treating wastewater including costs of chemicals and power used in the wastewater treatment plant (£/m 3 );
- PMD percentage of total demand that is metered;
- CWT water price paid by the customer for using water supply and wastewater collection services (£/m 3 ).
- WD can be estimated in accordance with the teaching of Fantozzi, M., and Lambert,
- N 3 empirical exponent. According to the Fantozzi and Lambert paper mentioned above the value of N 3 varies between 0.1 for internal residential consumption and 0.5 for external consumption. If the customer-has a roof tank then N 3 is equal to zero.
- Calculation of the net benefit due to pressure-sensitive demand reduction is evaluated at each node and each time step using actual pressure values.
- the computed value can be negative in which case it represents a cost rather than a net benefit to the water company.
- Direct Energy Reduction Benefit Reducing water demand and leakage will also reduce the energy required for lifting the saved quantity of water.
- the total benefit of direct energy saved CDE (£/year) is estimated as follows:
- CAL 0 active leakage control cost before pressure reduction (£/year; estimated from the historical costs arising from the (average) labour, vehicle and/or sub-contractors usage to do the ALC).
- customer contacts In some water systems, costs related to customer contacts can present a significant cost.
- the purpose of customer contacts is usually classified as follows: (i) Burst or leak, (ii) No water, (iii) Low pressure, (iv) Discoloured water, (v) Hard water, (vi) High pressure, (vii) Bill complaint, or (viii) other.
- the following equation is used here to estimate the benefit of customer contact reduction:
- CCC N 4 x(n, xc, + n 2 Xc 2 + n 3 xc 3 )
- C 1 initial cost of dealing with customer contact (simple call centre's response, £/contact);
- C 2 cost of a contact that needs a follow-up call;
- C 3 cost of contact which needs a follow-up visit (£/contact);
- n 1 number of initial contacts per year;
- n 2 number of follow-up calls per year;
- n 3 number of follow-up visit per year;
- N 4 percent reduction in customer contacts as a consequence of pressure management.
- the DeMonsabert paper mentioned above states that, for all electricity generated, roughly 5% is used in-plant and 8% is lost in distribution through line losses.
- the indirect energy reduction benefit CIE (£/year) is estimated by 13% from the energy saved inside water treatment plant, lifting water, and treating wastewater. It is also assumed here that the average energy used inside water treatment and wastewater treatment plants are 0.40 kWh/m 3 and 0.75 kWh/m 3 , respectively.
- the CIE is then estimated as follows:
- a control method for use in the evaluation of faults comprising the steps of: (a) receiving a fault notification;
- the step of determining an impact evaluation for each potential cause may include determining the likelihood of that potential cause being the actual cause giving rise to the fault notification.
- the impact evaluation may be dependent upon, for example, the type or number of customers affected by the notified fault.
- the importance indication can be used to determine how quickly the notified fault requires a response, and also to determine a priority or order in which a series of notified faults should be investigated.
- the method may also be used to determine , the effects of various solutions to a reported fault.
- FIGS -1a and 1 b are illustrations of parts of two water distribution systems
- Figures 2 and 3 are graphs illustrating the effects of the use of different types of PRV on pressures in parts of the system shown in Figure 1a;
- FIGS. 4 to 9 are diagrams illustrating control methodologies for use in the evaluation of potential faults.
- Figures 1a and 1 b illustrate parts of two water distribution systems, identifying the location of the inlet and the location of the critical node, ie the part of the system or DMA in which a minimum water pressure has to be maintained.
- the proposed location of the PRV is at the inlet.
- the invention is not restricted to such location of the PRV, and is equally applicable to determining whether or not to locate a PRV elsewhere in the DMA.
- the DMA illustrated in Figure 1a does not yet include a PRV.
- the DMA has a single inlet and is supplying water by gravity.
- the total pipe length is 24,744 m.
- the hydraulic model of this DMA consists of 1 ,005 nodes and 1 ,082 pipes.
- the total water consumption is about 1 ,877 m 3 /day distributed as follows: measured water demand equal to 452.6 m 3 /day (24%), unmeasured water demand equal to 900.1 m 3 /day (48%) and water leakage equal to 524.3 m 3 /day (28%).
- the calibrated hydraulic model shows that the minimum pressure recorded over a typical daily demand pattern with the 15 min time step is 24.44 m.
- Figure 2 shows the time variation of the minimum pressure at the critical node before pressure reduction.
- the second DMA as shown in Figure 1 b has a fixed-setting PRV already installed at its inlet. It also has a single entry point and is supplying water to the customers by gravity.
- the total pipe length is 28,386 m.
- the hydraulic model of the DMA consists of 362 nodes and 368 pipes.
- the total water consumption, which is equal to 377.4 m 3 /day, is distributed as follows: measured water demand equal to 132.2 m 3 /day (35%), unmeasured water demand equal to 183.9 m 3 /day (49%) and water leakage of 61.3 m 3 /day (16%).
- the minimum pressure in current conditions is 22.5 m at 7:45 am.
- the methodology described herein can be used to determine the best type, location and settings of PRVs in a DMA.
- the method is being used to determine the best type of PRV to locate at the DMA inlet, but the same methodology may be used to determine, for example, the most appropriate location for a PRV.
- the method is used to determine which type of PRV to install from a list comprising: (1 ) single setting PRV, (2) time-modulated PRV with two and four daily switching periods, and (3) flow modulated PRV.
- the relevant PRV settings are determined as follows:
- the pressure at the DMA entrance is reduced by the amount leading to the target minimum pressure at the DMA critical point (i.e. by the amount equal to the difference between the minimum recorded pressure in the DMA before implementing the pressure management scheme and the target minimum pressure).
- the PRV setting for each switching period (two or four) is determined by satisfying the minimum acceptable pressure during that time period. Economic net benefits are then calculated for all possible cases
- the solution with maximum benefit is selected by the total enumeration method. Therefore, for a time- modulated PRV with two-switching periods, the number of daily cases evaluated is, 4,560 when using 96 time steps (every 15 min). In the case of PRV with four- switching periods, time step was increased to 1 hour leading to 10,626 possible cases evaluated.
- the setting of PRV at each time step has been selected in order to maintain the minimum acceptable pressure at the critical node for all time steps/loading condition.
- the PRV setting at each time step is equal to the sum of minimum acceptable pressure and the friction loss occurring between the PRV location and the critical node.
- the target (i.e. minimum acceptable/required) pressure is assumed equal to 15m in all above cases analysed.
- the average cost of repairing a pipe burst for the illustrated DMAs are 1 ,099 fVburst and 977 £/burst, respectively.
- the volume of wastewater to water (RWW) was assumed to be 95%.
- the N 4 which has been used for estimating the customer contacts reduction benefits was assumed to be 0.3.
- the number of customer contacts per year is 129 and 276 for the DMAs, respectively.
- the cost of each contact has been estimated and classified. Subsequently, the customer contacts cost has been estimated and the expected benefit has been evaluated for the DMA of Figure 1a, which equals 2,121 £/year while for the DMA of Figure 2b equals 1 ,199 £/year.
- the capital cost of time-modulated or flow-modulated PRVs has been considered as the difference between their costs and the cost of the fixed-setting PRV.
- Other values used in the cost model are shown in Table 2. Table 2
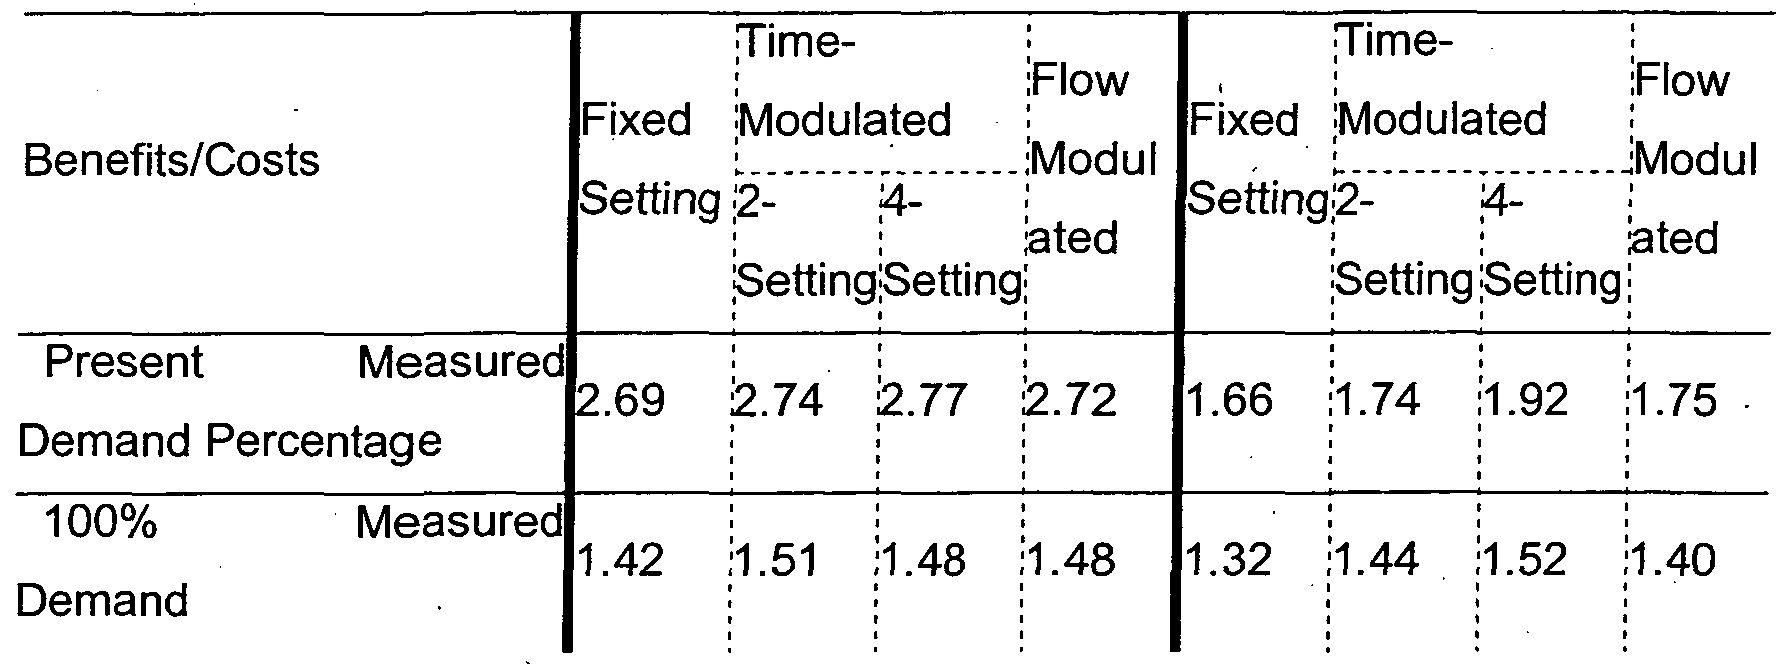
- Table 3 shows the detailed values of all benefits and costs obtained for both DMAs. The associated benefit/cost ratios are presented in Table 4.
- the most efficient pressure reduction is achieved by installing the flow-modulated PRV.
- the most efficient pressure management scheme is the one involving four-setting time-modulated PRVs.
- the least efficient pressure management scheme is the one based on fixed-setting PRV.
- the WLTF method produces slightly lower leakage reduction benefits when compared to the NWC method (approximately 10% in both case studies analysed). This is due to the fact that the two methods produce slightly different leakage estimates.
- the methodology described herein is beneficial in that it permits evaluation of the net benefit associated with the PRV-based pressure management in water distribution systems.
- a number of principal benefits were identified and associated cost models developed.
- the models developed rely on various company/other data (e.g. existing leakage rate, current/target system pressure, pipe materials, current burst frequency, fraction of demand which is pressure-sensitive, percentage of measured properties, cost of produced water, etc).
- Most of the cost models suggested are approximate and may be updated in the future. It preferably further includes an automated optimisation procedure to determine the most suitable location, type and setting of a number of PRVs in a system to maximise the net benefit and trade-off different numbers of PRVs against the corresponding benefits.
- WDS water distribution system
- the process of discovering that the WDS is not functioning normally, investigating the problems and deciding on how to deal with them is still difficult, even with the recent progress in monitoring and communication technologies.
- Data coming from sensors and notifications from customers in the form of phone calls are the two main indicators that a problem has occurred in a WDS that warrants further investigation and possibly repairs.
- the operator then has to check and process information coming from various systems in order to assess whether the perceived problem in the network is real, ra,ther than a consequence of malfunctioning monitoring and communication devices.
- DSS integrated decision support system
- a DSS which operates on the basis of risk assessment of failure conditions could comprise of several fundamental modules whose interaction is Shown in Figure 5.
- the Detector module is responsible for recognition of anomalies in time series data and customer contacts. When a sufficient level of confidence is gained that an anomaly is a true event an alarm is raised to notify the operator. The detector also identifies a set of potential incidents that could be the cause of a particular anomaly.
- the Risk Evaluator processes the inputs from the detector and assesses the risks caused by potential incidents (based on the likelihood of occurrence and potential impact on customers) also considering the operator's attitude towards risk. It then proceeds to aggregate these partial risks in order to calculate a single measure reflecting the overall risk of an anomaly, which is then used to prioritise the alarm it triggered.
- the Intervention Manager generates a set of possible responses to a particular incident.
- IM Intervention Manager
- it also enables the operators to develop their own solutions by modifying existing ones or by creating a completely new response, which is then stored in the knowledge base for future use. It interacts closely with the RE to estimate the reduction of risk after the implementation of a chosen response.
- GUI Graphical User Interface
- RE and IM modules which form the core of the DSS architecture, are described herein in greater detail.
- risk is defined as a set of triplets comprising of risk scenario, probability and impact.
- the task of the RE is to evaluate the probability of occurrence of a particular potential incident, under a particular risk scenario (defined below) and to estimate its impact over a specified period of time (typically 24 hours).
- the RE is also utilised if an intervention is proposed to mitigate the impact of a particular incident for computing the subsequent reduction of risk (i.e. reduction of the impact) for the same (or alternative) risk scenarios.
- the estimation of risk associated with an alarm for the purpose of prioritisation of actions is shown in Figure 6.
- the risk is estimated by generating a set of the most likely causes (potential incidents) of the anomaly, calculating the probability of occurrence and impact of each of the potential incidents within the set and aggregating the overall risk of the set - for a given risk scenario.
- an aggregation function based on Yager's ordered weighted averaging (OWA) operators is used expressing operator's level of risk-aversion.
- the real incident (cause) which has triggered the investigation is expected to (ideally) be a member of the set of potential incidents and have a higher probability of occurrence than any other potential incident (cause).
- the "risk scenario” is defined as the ensemble of: (1 ) a potential (i.e. assumed) incident (in terms of its type, location, timing, etc.), (2) the known initial, i.e. current network conditions (pressures/flows, tank levels, statuses of automatically regulating devices, etc.) and (3) the assumed future network conditions (e.g. forecasted nodal demands and assumed statuses of manually controlled devices) over some risk analysis horizon (e.g. next 24hr hours).
- a potential incident i.e. assumed incident
- the assumed future network conditions e.g. forecasted nodal demands and assumed statuses of manually controlled devices
- some risk analysis horizon e.g. next 24hr hours.
- risk scenario can potentially be used as a tool for handling various uncertainties inherent in the understanding and modelling of the actual WDS (e.g. uncertain forecasted demands).
- Various types of incidents can occur in WDS (e.g. water quality problems, deliberate acts of terrorism, hydraulic failures, etc.), but focus is put on pipe bursts, equipment failures and power outages.
- D-S Dempster-Shafer
- the Dempster-Shafer (D-S) theory of evidence has proven to be a powerful method for dealing with uncertainty and has already been successfully applied in many other industries and also in the water sector.
- it is utilised to combine probabilities of correct identification of a potential incident, generated by several independent bodies of evidence and to compute levels of belief and plausibility (i.e. lower and upper bounds for these probabilities).
- the credibility (W 1 , W 2 w N ) of each body of evidence is dynamically adjusted based on the quality of evidence it provides and also its performance in terms of its success rate of correct identifications, (e.g. using entropy and specificity measures).
- the impact model employed herein builds upon a list of basic impact factors (i.e. water and energy losses, supply interruptions, low pressure problems, discolouration and damage to third parties) as shown in Figure 8.
- the impact factors have been classified into two broad categories representing the parties of main interest in this research to form a value tree.
- the first category of impact factors affects directly, or indirectly, the water utility and the other affects the customers.
- the impact of failures is simulated using a pressure-driven version of EPANET and a GIS is applied to relate the physical effects of failures to the customers.
- GIS has been suggested as a powerful visualisation tool for water resources problems, particularly suitable for use in DSS applications.
- combining hydraulic models with a GIS is not straightforward and one faces many difficulties and challenges.
- the primary source of lack of correspondence between hydraulic models and a GIS stems from the different purpose of use of the two.
- GIS is meant to serve as spatial database whereas a model is focused on reproducing the hydraulics of the system and thus the pipe network is frequently simplified (skeletonised).
- the impact model estimates the development of the incident over a specified period of time using demand forecasts to predict future water consumption.
- Water utilities in the UK are obliged to report their performance to the Water Services Regulation Authority (OFWAT) on a yearly basis.
- OFWAT Water Services Regulation Authority
- Some of the indicators monitored by the regulator consider the quality of service provided by the water utility.
- the DG2 (low pressure) and DG3 (interruptions) indicators although being important for the water utility, do not consider the character and sensitivity of individual customers, thus, are unsatisfactory for a comprehensive impact assessment.
- Customers in this work are hence classified into the following groups:
- sub-zones representing whole DMAs whose supply depends on an affected network and for which service could thus be compromised.
- Each type of customer is assigned a particular weight reflecting its criticality as it is perceived by the operators and management of a particular water utility.
- the weights reflecting the criticality of specific customer groups as well as the weights indicating the importance of impact factors and impact categories, as shown in Figure 8, can be obtained from industrial partners using the Analytic Hierarchy Process.
- Figure 9 is a sample screen of the envisaged DSS showing the impact of a pipe burst at peak hour affecting a part of a DMA.
- the DSS is further able to display such impact maps for any time within a 24-hour window beginning from the time at which an alarm was raised.
- the current effort on the intervention management module is concentrated on valve manipulation for isolating parts of a WDS to contain an incident to allow repairs.
- the module consists of the pre-generated knowledge base, developed using the techniques presented in Jun, H., and Loganathan, G. V. (2007). "Valve-controlled segments in water distribution systems.” Journal of Water Resources Planning and
- Management-Asce, 133(2), 145-155 for the identification of segments of a WDS affected by valve closures. Particular attention is paid to considering the isolating valve size, age and perceived condition, valves on smaller diameter pipes and those which are older and those receiving less maintenance and, therefore, more likely to be inoperative. The effects of these factors are studied and contained in an offline knowledge base, which is anticipated to be updated periodically as further data, particularly from valve exercise programs, becomes available. Other types of responses, such as the manipulation of pumps, provision of by-pass, booster pumping and the use of spare or reserve capacity will subsequently be considered and incorporated into the module.
- a risk-based approach for the development of a DSS offers a way of supporting the operation of a WDS under normal and particularly in failure conditions.
- the approach considers both the frequency of occurrence of failures and (importantly) the impact of failures to customers which is of growing importance to the water industry.
- the broad risk assessment process proposed in this work will allow the operators to explicitly visualise and accommodate a wider range of risks and to assist them in prioritising actions and interventions more effectively.
- the methodology presented introduces a novel concept in risk-based operation for WDS under failure conditions, proposes a new definition of risk - appropriate for operational conditions - and extends existing impact models to account for further impact classes.
Abstract
Description


Claims
Priority Applications (7)
| Application Number | Priority Date | Filing Date | Title |
|---|---|---|---|
| CA2724966A CA2724966A1 (en) | 2008-05-19 | 2009-05-19 | Water distribution systems |
| BRPI0912896A BRPI0912896A2 (en) | 2008-05-19 | 2009-05-19 | water distribution system |
| MX2010012653A MX2010012653A (en) | 2008-05-19 | 2009-05-19 | Water distribution systems. |
| US12/993,461 US20110191267A1 (en) | 2008-05-19 | 2009-05-19 | Water Distribution Systems |
| EP09784579A EP2313564A1 (en) | 2008-05-19 | 2009-05-19 | Water distribution systems |
| AU2009321416A AU2009321416A1 (en) | 2008-05-19 | 2009-05-19 | Water distribution systems |
| ZA2010/09106A ZA201009106B (en) | 2008-05-19 | 2010-12-17 | Water distribution systems |
Applications Claiming Priority (2)
| Application Number | Priority Date | Filing Date | Title |
|---|---|---|---|
| GB0808985.6 | 2008-05-19 | ||
| GBGB0808985.6A GB0808985D0 (en) | 2008-05-19 | 2008-05-19 | Analysis of pressure management economics in water distribution systems and conceptual risk-based decision support methodology for improved near real time- |
Publications (1)
| Publication Number | Publication Date |
|---|---|
| WO2010061157A1 true WO2010061157A1 (en) | 2010-06-03 |
Family
ID=39596058
Family Applications (1)
| Application Number | Title | Priority Date | Filing Date |
|---|---|---|---|
| PCT/GB2009/001257 WO2010061157A1 (en) | 2008-05-19 | 2009-05-19 | Water distribution systems |
Country Status (9)
| Country | Link |
|---|---|
| US (1) | US20110191267A1 (en) |
| EP (2) | EP2313564A1 (en) |
| AU (1) | AU2009321416A1 (en) |
| BR (1) | BRPI0912896A2 (en) |
| CA (1) | CA2724966A1 (en) |
| GB (1) | GB0808985D0 (en) |
| MX (1) | MX2010012653A (en) |
| WO (1) | WO2010061157A1 (en) |
| ZA (1) | ZA201009106B (en) |
Cited By (2)
| Publication number | Priority date | Publication date | Assignee | Title |
|---|---|---|---|---|
| CN107194621A (en) * | 2017-07-14 | 2017-09-22 | 水联网技术服务中心(北京)有限公司 | A kind of Water supply network system and method |
| RU2742108C1 (en) * | 2019-11-29 | 2021-02-02 | Федеральное государственное казённое военное образовательное учреждение высшего образования "Военная академия материально-технического обеспечения имени генерала армии А.В. Хрулева" Министерства обороны Российской Федерации | Method of detecting unaccounted inflows in water disposal systems |
Families Citing this family (22)
| Publication number | Priority date | Publication date | Assignee | Title |
|---|---|---|---|---|
| US9053519B2 (en) * | 2012-02-13 | 2015-06-09 | TaKaDu Ltd. | System and method for analyzing GIS data to improve operation and monitoring of water distribution networks |
| US10088335B2 (en) * | 2012-04-13 | 2018-10-02 | International Business Machines Corporation | Anomaly detection using usage data for metering system |
| US9582775B2 (en) | 2012-12-10 | 2017-02-28 | International Business Machines Corporation | Techniques for iterative reduction of uncertainty in water distribution networks |
| US9506785B2 (en) | 2013-03-15 | 2016-11-29 | Rain Bird Corporation | Remote flow rate measuring |
| US10120962B2 (en) | 2014-09-02 | 2018-11-06 | International Business Machines Corporation | Posterior estimation of variables in water distribution networks |
| CN104268796B (en) * | 2014-09-22 | 2017-12-29 | 中国水利水电科学研究院 | A kind of tri-layer water operation method |
| GB2545899B (en) * | 2015-12-21 | 2018-07-25 | Imperial Innovations Ltd | Management of liquid conduit systems |
| CN105913146B (en) * | 2016-04-11 | 2021-06-11 | 中山大学 | Southern wet area water resource optimal allocation system |
| CN105785951B (en) * | 2016-04-15 | 2018-12-21 | 王跃军 | The processing automatic operating system of sewage is realized using statistical modeling technology |
| US10634538B2 (en) | 2016-07-13 | 2020-04-28 | Rain Bird Corporation | Flow sensor |
| CN109661627B (en) * | 2016-08-31 | 2021-09-03 | 3M创新有限公司 | System and method for modeling, analyzing, detecting and monitoring a fluid network |
| WO2019072809A2 (en) * | 2017-10-09 | 2019-04-18 | Viega Technology Gmbh & Co. Kg | Drinking water supply system having an acoustic sensor or a presence detector, method for controlling the same, and computer program |
| US10473494B2 (en) | 2017-10-24 | 2019-11-12 | Rain Bird Corporation | Flow sensor |
| CN109118073B (en) * | 2018-08-01 | 2021-09-07 | 河海大学 | Reservoir flood resource utilization risk decision method |
| GB201817011D0 (en) * | 2018-10-18 | 2018-12-05 | Inflowmatix Ltd | Hydraulic network model |
| US11662242B2 (en) | 2018-12-31 | 2023-05-30 | Rain Bird Corporation | Flow sensor gauge |
| CN109886506B (en) * | 2019-03-14 | 2023-05-23 | 重庆大学 | Water supply network pipe explosion risk analysis method |
| US11580273B2 (en) | 2019-06-07 | 2023-02-14 | Jonathan Paul West | Real-time system and method for calibrating a water distribution network hydraulic model |
| CN111047173B (en) * | 2019-12-05 | 2022-09-09 | 国网河南省电力公司 | Community credibility evaluation method based on improved D-S evidence theory |
| CN111401666B (en) * | 2020-04-28 | 2021-07-27 | 中国水利水电科学研究院 | Method for forecasting influence of upstream reservoir group on runoff by utilizing forecasting errors |
| CN111677045B (en) * | 2020-05-28 | 2021-08-03 | 上海巨忠水务科技(集团)有限公司 | Self-controlled running water supply device |
| CN113944883B (en) * | 2021-09-18 | 2023-06-02 | 江苏禹治流域管理技术研究院有限公司 | Monitoring and dispatching integrated system of urban water supply network |
Citations (2)
| Publication number | Priority date | Publication date | Assignee | Title |
|---|---|---|---|---|
| US4200911A (en) * | 1976-10-20 | 1980-04-29 | Hitachi, Ltd. | Control of the flow rate and fluid pressure in a pipeline network for optimum distribution of the fluid to consumers |
| EP0574241A1 (en) * | 1992-06-09 | 1993-12-15 | Technolog Limited | Fluid supply pressure control method and apparatus |
Family Cites Families (2)
| Publication number | Priority date | Publication date | Assignee | Title |
|---|---|---|---|---|
| JP3520440B2 (en) * | 1998-03-12 | 2004-04-19 | 作治 藏田 | Method of using the entire pipeline in underground objects and structures as a comprehensive crisis prediction warning sensor and a comprehensive crisis prediction disaster prevention monitoring system |
| US6614354B2 (en) * | 2001-03-02 | 2003-09-02 | Gas Research Institute | In-ground pipeline monitoring |
-
2008
- 2008-05-19 GB GBGB0808985.6A patent/GB0808985D0/en not_active Ceased
-
2009
- 2009-05-19 CA CA2724966A patent/CA2724966A1/en not_active Abandoned
- 2009-05-19 WO PCT/GB2009/001257 patent/WO2010061157A1/en active Application Filing
- 2009-05-19 BR BRPI0912896A patent/BRPI0912896A2/en not_active IP Right Cessation
- 2009-05-19 US US12/993,461 patent/US20110191267A1/en not_active Abandoned
- 2009-05-19 EP EP09784579A patent/EP2313564A1/en not_active Withdrawn
- 2009-05-19 MX MX2010012653A patent/MX2010012653A/en not_active Application Discontinuation
- 2009-05-19 AU AU2009321416A patent/AU2009321416A1/en not_active Abandoned
- 2009-05-19 EP EP11162312A patent/EP2351887A2/en not_active Withdrawn
-
2010
- 2010-12-17 ZA ZA2010/09106A patent/ZA201009106B/en unknown
Patent Citations (2)
| Publication number | Priority date | Publication date | Assignee | Title |
|---|---|---|---|---|
| US4200911A (en) * | 1976-10-20 | 1980-04-29 | Hitachi, Ltd. | Control of the flow rate and fluid pressure in a pipeline network for optimum distribution of the fluid to consumers |
| EP0574241A1 (en) * | 1992-06-09 | 1993-12-15 | Technolog Limited | Fluid supply pressure control method and apparatus |
Non-Patent Citations (1)
| Title |
|---|
| CHAN C ET AL: "Development of an intelligent control system for a municipal water distribution network", ELECTRICAL AND COMPUTER ENGINEERING, 1999 IEEE CANADIAN CONFERENCE ON EDMONTON, ALTA., CANADA 9-12 MAY 1999, PISCATAWAY, NJ, USA,IEEE, US, vol. 2, 9 May 1999 (1999-05-09), pages 1108 - 1113, XP010359949, ISBN: 978-0-7803-5579-8 * |
Cited By (3)
| Publication number | Priority date | Publication date | Assignee | Title |
|---|---|---|---|---|
| CN107194621A (en) * | 2017-07-14 | 2017-09-22 | 水联网技术服务中心(北京)有限公司 | A kind of Water supply network system and method |
| CN107194621B (en) * | 2017-07-14 | 2024-01-26 | 水联网技术服务中心(北京)有限公司 | Water supply network management system and method |
| RU2742108C1 (en) * | 2019-11-29 | 2021-02-02 | Федеральное государственное казённое военное образовательное учреждение высшего образования "Военная академия материально-технического обеспечения имени генерала армии А.В. Хрулева" Министерства обороны Российской Федерации | Method of detecting unaccounted inflows in water disposal systems |
Also Published As
| Publication number | Publication date |
|---|---|
| EP2351887A2 (en) | 2011-08-03 |
| MX2010012653A (en) | 2011-05-30 |
| GB0808985D0 (en) | 2008-06-25 |
| ZA201009106B (en) | 2011-09-28 |
| EP2313564A1 (en) | 2011-04-27 |
| BRPI0912896A2 (en) | 2015-10-06 |
| US20110191267A1 (en) | 2011-08-04 |
| AU2009321416A1 (en) | 2010-06-03 |
| CA2724966A1 (en) | 2010-06-03 |
Similar Documents
| Publication | Publication Date | Title |
|---|---|---|
| EP2351887A2 (en) | Water distribution systems | |
| JP7105830B2 (en) | Systems and methods for resource consumption analytics | |
| KR102101625B1 (en) | ICT integrated monitoring water management system for smart water city construction, and integrated control server for the same | |
| KR101205103B1 (en) | System for operating and managing water supply network | |
| US9568392B2 (en) | System and method for monitoring resources in a water utility network | |
| Christodoulou et al. | A study on the effects of intermittent water supply on the vulnerability of urban water distribution networks | |
| Bakker et al. | Heuristic burst detection method using flow and pressure measurements | |
| KR100893424B1 (en) | Performance evaluation and rehabilitation of water networks and its method | |
| GB2507184A (en) | Anomaly event classification in a network of pipes for resource distribution | |
| Savic et al. | Intelligent urban water infrastructure management | |
| Temido et al. | SCADA and Smart Metering systems in water companies. A perspective based on the value creation analysis | |
| Awad et al. | Analysis of pressure management economics in water distribution systems | |
| Bicik et al. | Conceptual risk-based decision support methodology for improved near real-time response to WDS failures | |
| Sorbello et al. | Applications for intelligent water network systems | |
| Animah et al. | Techno-economic feasibility assessment of life extension decision for safety critical assets | |
| Bicik et al. | Operational perspective of the impact of failures in water distribution systems | |
| Tchórzewska-Cieślak et al. | Methods for integrated failure risk analysis of water network in terms of water supply system functioning management | |
| Xu et al. | Water supply system reliability: concepts and measures | |
| عبدالوهاب محمد عوض بوبطينة | Rehabilitation Strategy for Water Networks using Risk-Performance Based Decision Making | |
| Abdullah et al. | Isolation Valve Density of a Water Distribution System for Varying Water Usage Options in the Dhaka District Metered Areas | |
| Fošumpaurová | Security Risks for Critical Infrastructure in the Water Management Sector | |
| Bicik | A risk-based decision support system for failure management in water distribution networks | |
| Mamo et al. | The potential future innovative application of municipal water supply database | |
| YILMAZ et al. | Analysis of network useful life and cost-benefits for sustainable water management | |
| MacLeod et al. | Design of drinking water distribution networks with consideration of future retrofit |
Legal Events
| Date | Code | Title | Description |
|---|---|---|---|
| 121 | Ep: the epo has been informed by wipo that ep was designated in this application |
Ref document number: 09784579 Country of ref document: EP Kind code of ref document: A1 |
|
| WWE | Wipo information: entry into national phase |
Ref document number: MX/A/2010/012653 Country of ref document: MX Ref document number: 2724966 Country of ref document: CA |
|
| NENP | Non-entry into the national phase |
Ref country code: DE |
|
| WWE | Wipo information: entry into national phase |
Ref document number: 2009784579 Country of ref document: EP |
|
| WWE | Wipo information: entry into national phase |
Ref document number: 9000/DELNP/2010 Country of ref document: IN Ref document number: 2009321416 Country of ref document: AU |
|
| WWE | Wipo information: entry into national phase |
Ref document number: DZP2010000774 Country of ref document: DZ |
|
| ENP | Entry into the national phase |
Ref document number: 2009321416 Country of ref document: AU Date of ref document: 20090519 Kind code of ref document: A |
|
| WWE | Wipo information: entry into national phase |
Ref document number: 12993461 Country of ref document: US |
|
| ENP | Entry into the national phase |
Ref document number: PI0912896 Country of ref document: BR Kind code of ref document: A2 Effective date: 20101119 |