WO2010026821A1 - Method for discrimination between bipolar disorder and schizophrenia - Google Patents
Method for discrimination between bipolar disorder and schizophrenia Download PDFInfo
- Publication number
- WO2010026821A1 WO2010026821A1 PCT/JP2009/061158 JP2009061158W WO2010026821A1 WO 2010026821 A1 WO2010026821 A1 WO 2010026821A1 JP 2009061158 W JP2009061158 W JP 2009061158W WO 2010026821 A1 WO2010026821 A1 WO 2010026821A1
- Authority
- WO
- WIPO (PCT)
- Prior art keywords
- seq
- expression level
- schizophrenia
- bipolar disorder
- gene
- Prior art date
Links
Images


Classifications
-
- C—CHEMISTRY; METALLURGY
- C12—BIOCHEMISTRY; BEER; SPIRITS; WINE; VINEGAR; MICROBIOLOGY; ENZYMOLOGY; MUTATION OR GENETIC ENGINEERING
- C12Q—MEASURING OR TESTING PROCESSES INVOLVING ENZYMES, NUCLEIC ACIDS OR MICROORGANISMS; COMPOSITIONS OR TEST PAPERS THEREFOR; PROCESSES OF PREPARING SUCH COMPOSITIONS; CONDITION-RESPONSIVE CONTROL IN MICROBIOLOGICAL OR ENZYMOLOGICAL PROCESSES
- C12Q1/00—Measuring or testing processes involving enzymes, nucleic acids or microorganisms; Compositions therefor; Processes of preparing such compositions
- C12Q1/68—Measuring or testing processes involving enzymes, nucleic acids or microorganisms; Compositions therefor; Processes of preparing such compositions involving nucleic acids
- C12Q1/6876—Nucleic acid products used in the analysis of nucleic acids, e.g. primers or probes
- C12Q1/6883—Nucleic acid products used in the analysis of nucleic acids, e.g. primers or probes for diseases caused by alterations of genetic material
-
- C—CHEMISTRY; METALLURGY
- C12—BIOCHEMISTRY; BEER; SPIRITS; WINE; VINEGAR; MICROBIOLOGY; ENZYMOLOGY; MUTATION OR GENETIC ENGINEERING
- C12Q—MEASURING OR TESTING PROCESSES INVOLVING ENZYMES, NUCLEIC ACIDS OR MICROORGANISMS; COMPOSITIONS OR TEST PAPERS THEREFOR; PROCESSES OF PREPARING SUCH COMPOSITIONS; CONDITION-RESPONSIVE CONTROL IN MICROBIOLOGICAL OR ENZYMOLOGICAL PROCESSES
- C12Q2600/00—Oligonucleotides characterized by their use
- C12Q2600/158—Expression markers
Definitions
- the present invention relates to a method for discriminating between bipolar disorder and schizophrenia.
- Bipolar disorder (manic-depressive illness) is a mental illness that has a high incidence along with schizophrenia, and repeats a manic state and a depressive state.
- the lifetime prevalence of bipolar disorder is said to be 0.2-1.6%, often recurring, and is often said to require lifelong drug treatment.
- an objective diagnostic method using biological markers for schizophrenia or bipolar disorder is established, early diagnosis and early treatment will be possible, and it will be possible to avoid the severity and improve the cure rate.
- diagnostic methods using biological markers that have been reported so far include a method of diagnosing schizophrenia (schizophrenia) using serum concentration of epidermal growth factor as an index (Patent Document 1).
- Patent Document 1 a method of diagnosing schizophrenia (schizophrenia) using serum concentration of epidermal growth factor as an index
- Patent Document 2 there is a method using blood as a sample and using the expression level of a specific gene as an index.
- these methods cannot accurately diagnose and diagnose schizophrenia and bipolar disorder.
- an object of the present invention is to provide means capable of objectively diagnosing schizophrenia or bipolar disorder with high accuracy using patient blood as a sample.
- the inventors of the present application use blood as a sample, compare the expression levels of about 55,000 types of genes between bipolar patients and schizophrenia patients, select genes whose expression levels vary significantly, and further described later
- a considerable number of classification prediction candidate genes are narrowed down according to the criteria that the inventors have independently devised, and a low-cost and highly versatile microarray equipped with these genes is created, and the expression data measured using this gene is used as a neural network.
- the classification prediction algorithm is constructed by the variable increase method and the cross-validation method making full use of, and the detection sensitivity (true positive rate) and specificity (true negative rate) are actually over 80% using a large number of samples.
- the present invention was completed by finding out.
- the present invention provides a method for discriminating between bipolar disorder and schizophrenia using the expression levels of the following gene groups (1) to (12) in a sample isolated from a living body as an index.
- FLJ21881 SEQ ID NO: 1
- DLGAP3 SEQ ID NO: 2
- FAM20A SEQ ID NO: 3
- MAX SEQ ID NO: 4
- ZNF74 SEQ ID NO: 5
- DIAPH2 SEQ ID NO: 6
- CR1 SEQ ID NO: 7
- RAD54B SEQ ID NO: 8)
- GPR30 SEQ ID NO: 9)
- SCD5 SEQ ID NO: 10
- (11) IMAGE: 5785888 SEQ ID NO: 11
- INSL3 SEQ ID NO: 12
- the present invention provides for the first time a means capable of objectively diagnosing either bipolar disorder or schizophrenia with high accuracy.
- the present invention uses the expression level of the gene groups (1) to (12) as an index.
- the sample for measuring the expression level of each gene is not particularly limited as long as it is a sample isolated from a living body, but as described in detail in the following examples, the gene group is selected using blood as a sample. Therefore, it is preferable to use blood as a sample.
- the gene group includes those whose expression level is increased and decreased in patients with schizophrenia than those with bipolar disorder. Further, in the following examples, determination can be made based on the expression levels of only the above 12 types of genes that have been confirmed to have a detection sensitivity (true positive rate) and specificity (true negative rate) of 80% or more. preferable.
- the expression level of other genes such as various genes for normalization in order to ensure measurement accuracy.
- “based on the expression level of only the 12 types of genes” means that the expression level of only the 12 types of genes is used as a direct variable for classification prediction.
- the correct answer rate is (a + d) / (a + b + c + d).
- Measurement of the expression level of each gene in the sample itself can be performed by a known method.
- the measurement method is not particularly limited, but a method using a single-stranded oligonucleotide probe that hybridizes to the sense strand or antisense strand of each gene, preferably a DNA array on which a DNA probe is immobilized, is simple and preferred.
- oligonucleotide probes that extract total mRNA from blood, prepare cRNA labeled with biotin from the extracted mRNA, and hybridize with cRNA derived from each gene.
- CRNA is applied to the immobilized array, the cRNA and probe are hybridized, the array is washed, and the amount of label remaining on the substrate is measured to determine the amount of cRNA, and hence the amount of mRNA, that is, the gene expression level. Can be measured.
- the probe to be immobilized has a size that specifically hybridizes with cRNA, and usually has a size of about 18 to 50 bases, preferably about 20 to 40 bases.
- the probe to be immobilized is preferably completely complementary to the region of RNA to which it is hybridized, but the normal hybridization when using a DNA array as specifically described in the following examples. A small number (usually 1 or 2) of mismatches is acceptable as long as it hybridizes under the conditions. Therefore, even when a natural SNP occurs in a gene, it can be measured using the same DNA array.
- the expression level of the gene group is SEQ ID NO: 18, SEQ ID NO: 44, SEQ ID NO: 61, SEQ ID NO: 90, SEQ ID NO: 97, SEQ ID NO: 120, SEQ ID NO: 125, SEQ ID NO: 161, SEQ ID NO: 167, sequence It is measured using oligonucleotide probes having the nucleotide sequences shown in No. 195, SEQ ID No. 218 and SEQ ID No. 220, and a DNA array on which these probes are immobilized can be preferably used. In addition, according to the measured values using these probes, 10 out of 12 probes have a significant difference (p ⁇ 0.05, t test) in the expression level between schizophrenia and healthy subjects. Met.
- the determination based on the expression level of the gene group is basically performed by comparing the expression level of the gene group with the expression level of the gene group in known schizophrenia patients and bipolar disorder patients. Done. This comparison is preferably performed by a neural network trained by the variable increment method using the expression level of the gene group in known schizophrenia patients and bipolar disorder patients. Input the expression levels of the above 12 genes measured in the constructed learned neural network (construction method will be described later), output the prediction probability of the group classified into the neural network, and use this prediction probability as a criterion Whether schizophrenia or bipolar disorder can be determined.
- the above comparison is preferably performed by multiple regression analysis.
- a prediction formula multiple regression formula
- the expression level of the above gene group in the subject whose disease should be determined is input to obtain a dependent variable, and the value of this dependent variable is calculated as the dependent of known schizophrenic patients and bipolar disorder patients.
- the value of the dependent variable that can preferably classify both groups as a cutoff value is, for example, based on the dependent variable calculated for each patient of the known schizophrenia patient group and bipolar disorder patient group, the value of the dependent variable that can preferably classify both groups as a cutoff value. This can be done by comparing the subject's dependent variable with this cutoff value. For example, if the expression level is analyzed in a patient with schizophrenia and the dependent variable is set to be large, if the numerical value of the dependent variable calculated for the subject is greater than the cutoff value, the subject is integrated. Can be predicted to be ataxia.
- the cut-off value can be appropriately determined by routine statistical processing based on the dependent variables calculated for known schizophrenia patients and bipolar disorder patients.
- the technique of multiple regression analysis itself is well known, and various software and the like for performing multiple regression analysis are known, and there are many commercially available products. Any software may be used in the present invention.
- the prediction formula can be determined once the analysis for the known patient is performed. Therefore, it is not necessary to perform the analysis for the known patient group every time it is performed. Can also be used.
- an analysis method including a step of obtaining a dependent variable of a sample using the obtained multiple regression equation is widely included, and an analysis step for obtaining a multiple regression equation includes Not necessarily included. Therefore, as described above, any method for discriminating a disease using the already obtained multiple regression equation is included in the “discrimination method for performing comparison by multiple regression analysis” in the present invention.
- the measurement value of the expression level used in the present invention is preferably a value obtained by normalizing the measured signal intensity by a global normalization method as described in the following examples.
- the global normalization method is a method of calculating the relative expression level by calculating the median value of the expression levels of all genes mounted on the DNA microarray and dividing the expression level of each gene by this median value. .
- the neural network When performing the method of the present invention using a neural network, the neural network itself is well known and a commercially available neural network can be used. However, although the neural network itself can use a commercial product, in the present invention, there is a feature in the data to be learned by the neural network, and sensitivity (true positive rate) and specificity (true negative rate) can be obtained by learning any data. It is necessary to devise whether both can be increased to 80% or more (described later).
- An optimal model of a classification prediction model using a neural network can be constructed by a method detailed in the following example, for example. Briefly, for example, the optimum model can be determined as follows. First, the expression levels of various genes are measured using samples collected from a large number of schizophrenia patients, bipolar disorder patients, and healthy individuals. The expression level of the gene can be performed using a DNA microarray as described above. In the following examples, a commercially available DNA microarray equipped with DNA probes of about 55,000 types of human genes was used.
- data cleansing is performed on the expression level measured using a DNA microarray.
- the data cleansing can be performed, for example, by excluding probes of genes less than 30% tile or 98% tile or more of the entire expression level.
- probes other than Quality Flag “Good”, probes of genes located on the Y chromosome, probes set distally from the mRNA 3 ′ end, etc. are excluded, and 10,498 from about 55,000 probes. Narrow down to the probe.
- the quality “Flag” being “Good” means that the measured expression level is larger than 1.5SD of the background around the spot and can be trusted as the measurement value.
- the gene located on the Y chromosome is present only in males, it was excluded because the sensitivity and / or specificity of detection might be lowered when females were examined.
- Probes set distal from the mRNA 3 'end are excluded because they are subject to bias in the preparation of cRNA and are a significant variation in the measured values. Furthermore, preliminary analysis excluded those with a missing value of 25% or more, those with a large difference in expression between men and women, and those with a large difference between batches during array production.
- the expression level of the gene derived from the RNA hybridized with each probe, measured for each probe selected in this way, is input to the neural network, and the two-group test (t test), that is, the learning example
- t test A significant difference test (t-test) is performed between schizophrenia (unmedicated) and bipolar disorder groups.
- a significant difference test is performed between the schizophrenia group and the bipolar disorder group, between the schizophrenia group and the healthy person group, and between the bipolar disorder group and the healthy person group.
- samples were also narrowed down. That is, the median value of 56 healthy subjects was calculated for each probe, the correlation of each sample was examined for the data set, and the parameters of the approximate curve and the signal intensity ratio greatly separated were excluded from the analysis target.
- variable increasing method itself is well known, and is performed by adding explanatory variables (measurement results of each probe) one by one and obtaining a combination having a high correlation with the objective variable (correct answer rate).
- the variable increase method is performed, and the number of probes with the highest correct answer rate is selected. At this time, it is preferable to perform the selection by combining N-fold cross validation methods.
- the cross-validation method itself is also well known.
- N-fold cross validation data (measurement results of each probe) is divided into N subsets of approximately the same size, and neural network learning (training) is performed a total of N times while excluding one subset.
- the data set of the learning example is divided into three subsets, and the neural network performs classification prediction using the probes with significant differences one by one while switching the data sets. The combination of was identified.
- the inventors of the present application produced a practical microarray in which the 216 types of probes are mounted on a substrate as a low-cost microarray for practical use.
- the practical array was also equipped with a probe used for global normalization and a management probe (for alignment) (detailed examples below).
- the global normalization was selected with small variation between arrays.
- a plurality of chambers (16 in the following embodiment) can be formed on a single substrate, that is, 16 samples can be simultaneously tested with a single array.
- a DNA microarray equipped with about 55,000 types of probes is expensive, and only one specimen can be processed with one microarray.
- the cost of preparing the array and the cost and labor of testing are greatly reduced. Can do.
- the sensitivity and specificity are 80 for both schizophrenia and bipolar disorder. It was confirmed that schizophrenia and bipolar disorder can be discriminated with high sensitivity and high specificity.
- the method of the present invention can be preferably carried out to examine whether a patient is suspected of having psychiatric disorder, particularly schizophrenia or bipolar disorder, whether it is schizophrenia or bipolar disorder.
- a method for detecting schizophrenia that is, a method for determining whether schizophrenia is a healthy person
- Various detection methods for schizophrenia are known (see, for example, the above-mentioned patent document).
- an oligonucleotide probe having the base sequence represented by SEQ ID NO: 18 means an oligonucleotide probe having a base sequence of attttgcctt cacataccag acatgagaca represented by SEQ ID NO: 18 and having a size of 30 bases.
- cRNA cRNA was prepared using 0.5 ⁇ g of extracted total RNA.
- Biotin-labeled cRNA was prepared using an iExpress kit (GE Healthcare Bioscience, Chandler, CA, USA) according to the manufacturer's instructions.
- the quantification and quality confirmation of the prepared cRNA were performed in the same manner as the quantification and quality confirmation of the extracted total RNA. That is, the absorbance of 230, 260, and 280 nm of cRNA solution diluted 50 times was measured, and the concentration of total RNA was measured. The quality of the cRNA was confirmed using an Agilent 2100 bioanalyzer.
- Codelink TM 55K Bioarray (GE Healthcare Bioscience) was used. Codelink (trademark) 55K Bioarray is coated with acrylamide with special chemical modification on the surface of glass slide, and 30mer probe is fixed three-dimensionally. It is an excellent microarray, and probes corresponding to about 55000 genes in humans are immobilized.
- cRNA 10 ⁇ g was prepared with RNase-Free H 2 O to a final volume of 20 ⁇ l, 5 ⁇ l of 5 ⁇ Fragmentation Buffer of iExpress kit was added, and then incubated at 94 ° C. for 20 minutes to fragment the cRNA.
- the array was fixed using Hybridization® Removal Tool, the hybridization chamber was peeled off, and the array was set on Bioarray® Rack.
- the Bioarray® Rack with the array set was transferred to a Large® Reagent reservoir containing 0.75 ⁇ TNT® Buffer at 46 ° C. and incubated at 46 ° C. for 1 hour.
- the Bioarray® Rack was transferred to a Small® Reagent reservoir filled with 3.4 ⁇ ml of Streptavidin-Cy5 diluted solution and incubated at room temperature for 30 minutes. After staining, the Bioarray Rack was transferred to a Large Reagent reservoir filled with 240 ml of 1 ⁇ TNT Buffer, and washed by repeating the operation of incubating at room temperature for 5 minutes 4 times. Next, the Bioarray® Rack was transferred to a Large® Reagent reservoir filled with 0.1 ⁇ SSC / 0.05% Tween-20, washed for 30 seconds, the array was centrifuged and dried, and then stored in the dark until scanning.
- Array Scanning The washed and dried arrays were scanned with an Agilent Scanner (Agilent Technologies, Santa Clara, CA, USA). The scanner settings were Red PMT [%] 70%, Dye Channel Red (Red is Cy5). The other settings are the default. The scanned array data was saved as a TIF file and digitized.
- probes other than Quality Flag “Good”, probes located on the Y chromosome, probes set distal from the mRNA 3 ′ end, and the like were excluded. Furthermore, preliminary analysis also excluded those with a missing value of 25% or more, those with a large difference in the expression level between men and women, and those with a large difference between batches during array production. These narrowed down from about 55,000 probes to 10,498 probes.
- CodeLink (trade name) 55K Bioarray is very expensive, and only one sample can be processed and analyzed. In order to put it to practical use, a microarray that can be analyzed at a lower cost is required. Therefore, the same surface treatment as CodeLink 55K Bioarray is applied, and this is divided into 16 chambers, so that CodeLink (trade name) 16-Assay can process and analyze up to 16 samples at a time.
- a practical array based on Bioarray (Applied Microarrays) was designed. In addition to the 216 gene probes, probes used for global normalization (SEQ ID NOs: 229 to 527) and management probes by manufacturers were added to design the following array.
- CodeLink (trade name) 16-Assay Bioarray classification prediction based on measurement results (neural network) Based on gene expression information of 60 untreated schizophrenic patients (schizophrenic patients antipsychotic untreated group) and 48 bipolar disorder patients, we tried to construct a classification prediction model by neural network with excellent classification prediction It was.
- a classification prediction algorithm is a series of algorithms that can output an optimal solution by inputting a data set whose attributes have been clarified in advance and performing “learning and training”. It is said that an algorithm with high classification accuracy can be constructed from the high learning effect.
- a part of the normalized data (40 untreated schizophrenia patients, 32 bipolar disorder patients) was input to the ArrayAssist neural network as a learning example, and an algorithm was constructed.
- N-fold cross validation (N 3)
- the data set of the learning example was divided into three parts, and the prediction was made using one of the 216 probes with significant difference one by one while changing the data set.
- the data set of the test example was analyzed using the algorithm learned in this way. Enter the normalized data for the probe set used at the point where Number of Class Accuracy reaches the plateau into the learned algorithm above to verify how well the classification of the test example matches the clinical diagnosis did.
- Numerous algorithms are constructed by variously changing various parameters of the neural network (learning efficiency, momentum, number of repetitions, number of layers, number of neurons), and learning accuracy by using cross-validation and test examples described above for each. Verification was performed.
- Table 4 and Table 5 show the prediction results for learning examples and test examples based on this algorithm. Further, FIG. 1 shows the result of Forward Selection for this algorithm.
- schizophrenia and bipolar disorder can be classified with high accuracy using expression data from 12 probes (Table 2, supra).
- CodeLink (trade name) 16-Assay Bioarray classification prediction based on measurement results (multiple regression analysis) Similar to the above, classification prediction by multiple regression analysis was attempted using gene expression information of 60 untreated schizophrenia patients and 48 bipolar disorder patients. Using the expression data from the 12 probes as explanatory variables, a multiple regression analysis was performed on the learning example using commercially available software (SPSS) to construct a prediction formula. Multiple regression analysis was performed so that the dependent variable was increased in patients with schizophrenia. Subsequently, the dependent variable was calculated about the said test example using the constructed prediction formula. The obtained prediction formula is as follows.
- X 1 is the gene expression level of FLJ21881 (GE492524 SEQ ID NO: 18)
- X 2 is the gene expression level of DLGAP3 (GE54859 SEQ ID NO: 44)
- X 3 is the gene expression level of FAM20A (GE56606 SEQ ID NO: 61)
- X 4 is the gene expression level of MAX (GE59858 SEQ ID NO: 90)
- X 5 is the gene expression level of ZNF74 (GE60153 SEQ ID NO: 97)
- X 6 is the gene expression level of DIAPH2 (GE62680 SEQ ID NO: 120)
- X 7 is the gene expression level of CR1 (GE62914 SEQ ID NO: 125)
- a 1 is -0.166864749248881
- a 2 is 0.578595208826776
- a 3 is -0.251720387137894
- a 4 is 0.285088434152454
- a 5 is, 0.149134281702735
- 6 is -0.581754365047968
- a 7 is 0.965099433225613
- 8 is -0.237927470298808
- a 9 is 0.724852821407317
- a 10 is 0.467110697687733
- a 11 is 1.55443576023811
- a 12 is -0.0695649776248728
- Constant C is -1.20827077326351 It is.
- Tables 6 and 7 show the results of tabulating the dependent variable 50 as a cutoff value. Moreover, the dependent variable calculated about each sample of a learning example and a test example is shown in FIG.
- Sensitivity 95.0% (38/40), Specificity: 87.5% (28/32), Correct answer rate: 91.7% (66/72)
- Sensitivity 85.0% (17/20), Specificity: 81.3% (13/16), Correct answer rate: 83.3% (30/36)
Abstract
Disclosed is a novel means which can diagnose schizophrenia and bipolar disorder distinctively, objectively and with high accuracy by using blood collected from a patient as a sample. Specifically disclosed is a method for discriminating between schizophrenia and bipolar disorder, which utilizes the expression levels of specific 12 genes in a sample isolated from a living body as measures. The method enables the distinctive, objective and highly accurate diagnosis of schizophrenia and bipolar disorder. It is confirmed actually by using multiple samples that both the sensitivity (true positive rate) and the degree of specificity (true negative rate) of the detection are 80% or more. The method utilizes blood as a sample, and therefore can be practiced conveniently.
Description
本発明は、双極性障害と統合失調症を判別する方法に関する。
The present invention relates to a method for discriminating between bipolar disorder and schizophrenia.
日本国内における統合失調症の発症率は人口の約0.8%であり、主に青年期に発症する。該疾患の予後は多様である。概ね全体の1/3の患者については、顕著で継続的な改善をみる。1/3はいくらか改善するが,間欠性再発と残遺性障害を残す。残りの1/3は重篤で,永久的に能力が失われ、社会的機能遂行に支障をきたす重大な精神疾患である。
The incidence of schizophrenia in Japan is about 0.8% of the population, and it occurs mainly in adolescence. The prognosis for the disease varies. About 1/3 of all patients see significant and continuous improvement. 1/3 improves somewhat, but leaves intermittent recurrence and residual disability. The remaining 1/3 is a serious mental illness that is severely impaired and permanently impairs social functioning.
双極性障害(躁鬱病)は、統合失調症と並び発症率の高い精神疾患であり、躁状態とうつ状態を繰り返す。双極性障害の生涯有病率は0.2~1.6%といわれており、再発することが多く、生涯にわたる薬物投与による治療が必要となる場合が多いといわれている。
Bipolar disorder (manic-depressive illness) is a mental illness that has a high incidence along with schizophrenia, and repeats a manic state and a depressive state. The lifetime prevalence of bipolar disorder is said to be 0.2-1.6%, often recurring, and is often said to require lifelong drug treatment.
双極性障害と統合失調症のいずれも、早期に適切な治療を行うことが重要である。従来、これらの精神疾患の診断は、米国精神医学会(APA)が制定した精神疾患の診断・統計マニュアルであるDSM-IV (Diagnostic and Statistical Manual of Mental Disorders-IV)による包括的評価に基いて下される。しかし、このような方法は、診断医の主観や技量に大きく依存する。双極性障害の躁状態が統合失調症の陽性症状に、双極性障害のうつ状態が統合失調症の陰性症状に類似することから、ときに該疾患を客観的かつ早期に診断することは困難であり、適切な治療が施されずに重症化するケースも少なくない。
∙ It is important that both bipolar disorder and schizophrenia be treated appropriately at an early stage. Traditionally, the diagnosis of these mental disorders is based on a comprehensive evaluation by DSM-IV (Diagnostic and Manual Manual of Mental Disorders-IV), a diagnostic and statistical manual for mental disorders established by the American Psychiatric Association (APA). Be defeated. However, such a method greatly depends on the subjectivity and skill of the diagnostician. Bipolar mania is similar to positive symptoms of schizophrenia and bipolar depression is similar to negative symptoms of schizophrenia, so it is sometimes difficult to diagnose the disease objectively and early. Yes, there are many cases that become severe without appropriate treatment.
統合失調症や双極性障害の生物学的マーカー等を用いた客観的な診断方法が確立すれば、早期診断、早期治療が可能になり、重症化の回避や治癒率の向上が可能になる。現在までに報告されている、生物学的マーカーを用いた診断方法としては、例えば、上皮細胞成長因子の血清中濃度を指標として精神分裂病(統合失調症)を診断する方法(特許文献1)や、血液を試料として用い、特定の遺伝子の発現量を指標とする方法がある(特許文献2)。しかしながら、これらの方法では、統合失調症と双極性障害とを精度良く区別して診断することはできない。
If an objective diagnostic method using biological markers for schizophrenia or bipolar disorder is established, early diagnosis and early treatment will be possible, and it will be possible to avoid the severity and improve the cure rate. Examples of diagnostic methods using biological markers that have been reported so far include a method of diagnosing schizophrenia (schizophrenia) using serum concentration of epidermal growth factor as an index (Patent Document 1). Alternatively, there is a method using blood as a sample and using the expression level of a specific gene as an index (Patent Document 2). However, these methods cannot accurately diagnose and diagnose schizophrenia and bipolar disorder.
従って、本発明の目的は、患者血液を試料として高い精度で客観的に統合失調症と双極性障害とのいずれであるかを診断することができる手段を提供することにある。
Therefore, an object of the present invention is to provide means capable of objectively diagnosing schizophrenia or bipolar disorder with high accuracy using patient blood as a sample.
本願発明者らは、血液を試料として用い、約55000種類の遺伝子の発現量を双極性患者と統合失調症患者の間で比較し、発現量が有意に変動する遺伝子を選び、さらに後述する本願発明者らが独自に考え出した基準でかなりの数の分類予測候補遺伝子を絞り込み、これら遺伝子群を搭載した低コストで汎用性の高いマイクロアレイを作製し、これを用いて測定した発現データをニューラルネットワークを駆使した変数増加法とcross validation法にかけて分類予測アルゴリズムを構築し、実際に多数の検体を用いて検出の感度(真陽性率)及び特異度(真陰性率)が80%以上になるアルゴリズムを見出すことにより、本発明を完成した。
The inventors of the present application use blood as a sample, compare the expression levels of about 55,000 types of genes between bipolar patients and schizophrenia patients, select genes whose expression levels vary significantly, and further described later A considerable number of classification prediction candidate genes are narrowed down according to the criteria that the inventors have independently devised, and a low-cost and highly versatile microarray equipped with these genes is created, and the expression data measured using this gene is used as a neural network. The classification prediction algorithm is constructed by the variable increase method and the cross-validation method making full use of, and the detection sensitivity (true positive rate) and specificity (true negative rate) are actually over 80% using a large number of samples. The present invention was completed by finding out.
すなわち、本発明は、生体から分離された試料における下記(1)~(12)の遺伝子群の発現量を指標とする、双極性障害と統合失調症の判別方法を提供する。
(1) FLJ21881(配列番号1)
(2) DLGAP3(配列番号2)
(3) FAM20A(配列番号3)
(4) MAX(配列番号4)
(5) ZNF74(配列番号5)
(6) DIAPH2(配列番号6)
(7) CR1(配列番号7)
(8) RAD54B(配列番号8)
(9) GPR30(配列番号9)
(10) SCD5(配列番号10)
(11) IMAGE:5785888(配列番号11)
(12) INSL3(配列番号12) That is, the present invention provides a method for discriminating between bipolar disorder and schizophrenia using the expression levels of the following gene groups (1) to (12) in a sample isolated from a living body as an index.
(1) FLJ21881 (SEQ ID NO: 1)
(2) DLGAP3 (SEQ ID NO: 2)
(3) FAM20A (SEQ ID NO: 3)
(4) MAX (SEQ ID NO: 4)
(5) ZNF74 (SEQ ID NO: 5)
(6) DIAPH2 (SEQ ID NO: 6)
(7) CR1 (SEQ ID NO: 7)
(8) RAD54B (SEQ ID NO: 8)
(9) GPR30 (SEQ ID NO: 9)
(10) SCD5 (SEQ ID NO: 10)
(11) IMAGE: 5785888 (SEQ ID NO: 11)
(12) INSL3 (SEQ ID NO: 12)
本発明により、双極性障害と統合失調症とのいずれであるかを高い精度で客観的に診断できる手段が初めて提供された。
The present invention provides for the first time a means capable of objectively diagnosing either bipolar disorder or schizophrenia with high accuracy.
上記の通り、本発明は、(1)~(12)の遺伝子群の発現量を指標とする。各遺伝子の発現量を測定する試料は、生体から分離された試料であれば特に限定されるわけではないが、下記実施例で詳述するとおり、上記遺伝子群は、血液を試料として用いて選定されたものであるので、血液を試料とすることが好ましい。なお、上記遺伝子群には、統合失調症患者において双極性障害患者よりも発現量が増大しているものも減少しているものも含まれる。また、下記実施例において、検出の感度(真陽性率)及び特異度(真陰性率)が80%以上となることが確認された上記12種類の遺伝子のみの発現量に基づいて判定することが好ましい。なお、下記実施例に具体的に記載するように、測定の精度を確保する等のために、正規化のための種々の遺伝子等の他の遺伝子の発現量を同時に測定することは好ましいことであり、「上記12種類の遺伝子のみの発現量に基づく」とは、上記12種類の遺伝子のみの発現量を分類予測の直接的な変数として用いるという意味である。また、感度を表わす真陽性率は、下記表1におけるa/(a+b)、特異度を表わす真陰性率は、1-偽陽性=d/(c+d)である。また、正答率は、(a+d)/(a+b+c+d)である。
As described above, the present invention uses the expression level of the gene groups (1) to (12) as an index. The sample for measuring the expression level of each gene is not particularly limited as long as it is a sample isolated from a living body, but as described in detail in the following examples, the gene group is selected using blood as a sample. Therefore, it is preferable to use blood as a sample. In addition, the gene group includes those whose expression level is increased and decreased in patients with schizophrenia than those with bipolar disorder. Further, in the following examples, determination can be made based on the expression levels of only the above 12 types of genes that have been confirmed to have a detection sensitivity (true positive rate) and specificity (true negative rate) of 80% or more. preferable. As specifically described in the examples below, it is preferable to simultaneously measure the expression levels of other genes such as various genes for normalization in order to ensure measurement accuracy. Yes, “based on the expression level of only the 12 types of genes” means that the expression level of only the 12 types of genes is used as a direct variable for classification prediction. The true positive rate representing sensitivity is a / (a + b) in Table 1 below, and the true negative rate representing specificity is 1-false positive = d / (c + d). The correct answer rate is (a + d) / (a + b + c + d).

上記12種類の遺伝子の配列は、上記した各配列番号に記載されているが、各遺伝子のGenBankアクセション番号、遺伝子産物、下記実施例で用いた、各遺伝子の発現量の測定に用いたプローブ番号及びその配列番号を下記表2に示す。
The sequences of the above 12 types of genes are described in each of the above SEQ ID Nos. The GenBank accession number of each gene, the gene product, and the probe used for measuring the expression level of each gene used in the following Examples The numbers and their sequence numbers are shown in Table 2 below.

試料中の各遺伝子の発現量の測定自体は公知の方法により行なうことができる。測定方法は、特に限定されないが、各遺伝子のセンス鎖又はアンチセンス鎖とハイブリダイズする一本鎖オリゴヌクレオチドプローブ、好ましくはDNAプローブが固定化されたDNAアレイを用いる方法が簡便で好ましい。例えば、下記実施例に具体的に記載するように、血液から全mRNAを抽出し、抽出したmRNAから、ビオチン等で標識されたcRNAを調製し、各遺伝子由来のcRNAとハイブリダイズするオリゴヌクレオチドプローブが固定化されたアレイにcRNAを施してcRNAとプローブとをハイブリダイズさせ、アレイを洗浄後、基板上に残留する標識量を測定することによりcRNA量、ひいてはmRNA量、すなわち遺伝子の発現量を測定することができる。
Measurement of the expression level of each gene in the sample itself can be performed by a known method. The measurement method is not particularly limited, but a method using a single-stranded oligonucleotide probe that hybridizes to the sense strand or antisense strand of each gene, preferably a DNA array on which a DNA probe is immobilized, is simple and preferred. For example, as specifically described in the Examples below, oligonucleotide probes that extract total mRNA from blood, prepare cRNA labeled with biotin from the extracted mRNA, and hybridize with cRNA derived from each gene. CRNA is applied to the immobilized array, the cRNA and probe are hybridized, the array is washed, and the amount of label remaining on the substrate is measured to determine the amount of cRNA, and hence the amount of mRNA, that is, the gene expression level. Can be measured.
なお、固定化されるプローブは、cRNAと特異的にハイブリダイズするサイズを有するものであり、通常、18塩基~50塩基、好ましくは20塩基~40塩基程度のサイズを有する。また、固定化するプローブは、それがハイブリダイズするRNAの領域と完全に相補的であることが好ましいが、下記実施例に具体的に記載するような、DNAアレイを用いる際の通常のハイブリダイズ条件下でハイブリダイズするものであれば少数(通常、1個か2個)のミスマッチがあっても許容できる。従って、遺伝子に天然のSNPが生じている場合でも、同じDNAアレイを用いて測定可能である。
The probe to be immobilized has a size that specifically hybridizes with cRNA, and usually has a size of about 18 to 50 bases, preferably about 20 to 40 bases. In addition, the probe to be immobilized is preferably completely complementary to the region of RNA to which it is hybridized, but the normal hybridization when using a DNA array as specifically described in the following examples. A small number (usually 1 or 2) of mismatches is acceptable as long as it hybridizes under the conditions. Therefore, even when a natural SNP occurs in a gene, it can be measured using the same DNA array.
下記実施例では、前記遺伝子群の発現量は、配列番号18、配列番号44、配列番号61、配列番号90、配列番号97、配列番号120、配列番号125、配列番号161、配列番号167、配列番号195、配列番号218及び配列番号220に示される塩基配列を有するオリゴヌクレオチドプローブを用いて測定されており、これらのプローブを固定化したDNAアレイを好ましく利用することができる。なお、これらのプローブを用いた測定値によると、12個のプローブのうちの10個は統合失調症と健常者との間で発現量に有意差(p<0.05、t検定)が認められるプローブであった。
In the following examples, the expression level of the gene group is SEQ ID NO: 18, SEQ ID NO: 44, SEQ ID NO: 61, SEQ ID NO: 90, SEQ ID NO: 97, SEQ ID NO: 120, SEQ ID NO: 125, SEQ ID NO: 161, SEQ ID NO: 167, sequence It is measured using oligonucleotide probes having the nucleotide sequences shown in No. 195, SEQ ID No. 218 and SEQ ID No. 220, and a DNA array on which these probes are immobilized can be preferably used. In addition, according to the measured values using these probes, 10 out of 12 probes have a significant difference (p <0.05, t test) in the expression level between schizophrenia and healthy subjects. Met.
上記遺伝子群の発現量に基づく判定は、基本的には前記遺伝子群の発現量を、あらかじめ測定した、既知の統合失調症患者及び双極性障害患者における前記遺伝子群の発現量と対比することにより行われる。この対比は、既知の統合失調症患者及び双極性障害患者における前記遺伝子群の発現量を用いて変数増加法により学習させたニューラルネットワークにより行なうことが好ましい。構築した学習済みのニューラルネットワーク(構築方法は後述)に測定した上記12種類の遺伝子の発現量を入力し、該ニューラルネットワークに分類される群の予測確率を出力させ、この予測確率を判定基準として統合失調症か双極性障害かを判別することができる。
The determination based on the expression level of the gene group is basically performed by comparing the expression level of the gene group with the expression level of the gene group in known schizophrenia patients and bipolar disorder patients. Done. This comparison is preferably performed by a neural network trained by the variable increment method using the expression level of the gene group in known schizophrenia patients and bipolar disorder patients. Input the expression levels of the above 12 genes measured in the constructed learned neural network (construction method will be described later), output the prediction probability of the group classified into the neural network, and use this prediction probability as a criterion Whether schizophrenia or bipolar disorder can be determined.
あるいはまた、上記対比は、重回帰分析により行なうことも好ましい。測定した上記12種類の遺伝子の発現量を説明変数とし、既知の統合失調症患者及び双極性障害患者における前記遺伝子群の発現量を重回帰分析すると、予測式(重回帰式)を得ることができる。得られた予測式に、疾患を判別すべき被検者における上記遺伝子群の発現量を入力して従属変数を求め、この従属変数の数値を既知の統合失調症患者及び双極性障害患者の従属変数と対比することで、該被検者が統合失調症か双極性障害かを判別することができる。この対比は、例えば、既知の統合失調症患者群と双極性障害患者群の各患者について計算された従属変数をもとに、両群を好ましく分類できる従属変数の値をカットオフ値として定め、被検者の従属変数をこのカットオフ値と対比することにより行なうことができる。例えば、統合失調症患者で従属変数が大きくなるように設定して発現量を分析した場合、被検者について計算された従属変数の数値がカットオフ値よりも大きければ、該被検者は統合失調症であると予測することができる。カットオフ値は、既知の統合失調症患者及び双極性障害患者について計算された従属変数をもとに、常法の統計処理により適宜定めることができる。重回帰分析の手法自体は周知であり、重回帰分析を行なうソフトウェア等も種々のものが公知で、市販品も多く存在する。本発明ではいずれのソフトウェアを用いてもよい。なお、予測式は、既知の患者についての分析を一度行なえば定めることができるので、実施の都度既知の患者群についての分析を行なう必要はなく、一旦得られた予測式をその後に実施する際にも用いることができる。
Alternatively, the above comparison is preferably performed by multiple regression analysis. Using the measured expression levels of the 12 genes as explanatory variables, and performing multiple regression analysis of the expression levels of the genes in known schizophrenia patients and bipolar disorder patients, a prediction formula (multiple regression formula) can be obtained. it can. In the obtained prediction formula, the expression level of the above gene group in the subject whose disease should be determined is input to obtain a dependent variable, and the value of this dependent variable is calculated as the dependent of known schizophrenic patients and bipolar disorder patients. By comparing with the variable, it can be determined whether the subject is schizophrenia or bipolar disorder. This contrast is, for example, based on the dependent variable calculated for each patient of the known schizophrenia patient group and bipolar disorder patient group, the value of the dependent variable that can preferably classify both groups as a cutoff value, This can be done by comparing the subject's dependent variable with this cutoff value. For example, if the expression level is analyzed in a patient with schizophrenia and the dependent variable is set to be large, if the numerical value of the dependent variable calculated for the subject is greater than the cutoff value, the subject is integrated. Can be predicted to be ataxia. The cut-off value can be appropriately determined by routine statistical processing based on the dependent variables calculated for known schizophrenia patients and bipolar disorder patients. The technique of multiple regression analysis itself is well known, and various software and the like for performing multiple regression analysis are known, and there are many commercially available products. Any software may be used in the present invention. The prediction formula can be determined once the analysis for the known patient is performed. Therefore, it is not necessary to perform the analysis for the known patient group every time it is performed. Can also be used.
なお、本発明において「重回帰分析」といった場合には、得られた重回帰式を用いて試料の従属変数を求める工程を含む分析方法を広く包含し、重回帰式を得るための分析工程は必ずしも含まれない。従って、上記したように、既に求められた重回帰式を用いて疾患の判別を行う方法であれば、本発明にいう「重回帰分析により対比を行なう判別方法」に包含される。
In the present invention, in the case of “multiple regression analysis”, an analysis method including a step of obtaining a dependent variable of a sample using the obtained multiple regression equation is widely included, and an analysis step for obtaining a multiple regression equation includes Not necessarily included. Therefore, as described above, any method for discriminating a disease using the already obtained multiple regression equation is included in the “discrimination method for performing comparison by multiple regression analysis” in the present invention.
本発明で用いる発現量の測定値は、下記実施例に記載される通り、測定されるシグナル強度をグローバルノーマライゼーション(global normalization)法により正規化したものであることが好ましい。ここで、グローバルノーマライゼーション法とは、DNAマイクロアレイ上に搭載した全遺伝子の発現量の中央値を求め、この中央値で各遺伝子の発現量を除することで相対的発現量を算出する方法である。
The measurement value of the expression level used in the present invention is preferably a value obtained by normalizing the measured signal intensity by a global normalization method as described in the following examples. Here, the global normalization method is a method of calculating the relative expression level by calculating the median value of the expression levels of all genes mounted on the DNA microarray and dividing the expression level of each gene by this median value. .
ニューラルネットワークを用いて本発明の方法を実施する場合、ニューラルネットワーク自体は周知であり、市販のニューラルネットワークを用いることができる。もっとも、ニューラルネットワーク自体は市販品を利用できるが、本発明では、ニューラルネットワークに学習させるデータに特徴があり、いかなるデータを学習させることにより感度(真陽性率)及び特異度(真陰性率)の両者を80%以上にできるかは工夫が必要である(後述)。
When performing the method of the present invention using a neural network, the neural network itself is well known and a commercially available neural network can be used. However, although the neural network itself can use a commercial product, in the present invention, there is a feature in the data to be learned by the neural network, and sensitivity (true positive rate) and specificity (true negative rate) can be obtained by learning any data. It is necessary to devise whether both can be increased to 80% or more (described later).
ニューラルネットワークを用いた分類予測モデルの最適モデルは、例えば下記実施例に詳述する方法により構築することができる。簡単に説明すると、例えば、次のようにして最適モデルを決定することができる。まず、多数の統合失調症患者、双極性障害患者及び健常者から採取した試料を用い、種々の遺伝子の発現量を測定する。遺伝子の発現量は、上記の通り、DNAマイクロアレイを用いて行なうことができる。下記実施例では、約55000種類のヒト遺伝子のDNAプローブが搭載された市販のDNAマイクロアレイを用いた。
An optimal model of a classification prediction model using a neural network can be constructed by a method detailed in the following example, for example. Briefly, for example, the optimum model can be determined as follows. First, the expression levels of various genes are measured using samples collected from a large number of schizophrenia patients, bipolar disorder patients, and healthy individuals. The expression level of the gene can be performed using a DNA microarray as described above. In the following examples, a commercially available DNA microarray equipped with DNA probes of about 55,000 types of human genes was used.
次に、DNAマイクロアレイを用いて測定した発現量をデータクレンジングする。ここで、データクレンジングは、例えば、全体の発現量の30%tile未満の遺伝子のプローブや98%tile以上の遺伝子のプローブを除外することにより行なうことができる。
Next, data cleansing is performed on the expression level measured using a DNA microarray. Here, the data cleansing can be performed, for example, by excluding probes of genes less than 30% tile or 98% tile or more of the entire expression level.
多数の統合失調症患者及び双極性障害患者のDNAマイクロアレイのデータを、学習例と、学習例と独立した試験例とに分け、学習例をニューラルネットワークに学習させ、構築された分類予測モデルによりどの程度の感度及び特異度が達成されるかを試験例を用いて算出、評価を行うHold out cross validation法により構築した。分類予測モデル構築には、ニューラルネットワークのパラメーターを変更して行い、学習例と試験例に振り分けた検体の独立性は担保して検証を続け、最も良い成績のモデルを採用した。
Divide the DNA microarray data of a large number of schizophrenia patients and bipolar disorder patients into learning examples and learning examples independent of the learning examples. It was constructed by the Hold-out-cross-validation method in which the degree of sensitivity and specificity was achieved and calculated using test examples. The classification prediction model was constructed by changing the parameters of the neural network, ensuring the independence of the samples assigned to the learning examples and test examples, and continuing the verification, and adopting the model with the best results.
まず、ニューラルネットワークに学習させる学習用データを準備する。下記実施例では、Quality Flag "Good"以外のプローブ、Y染色体上に座位する遺伝子のプローブ、mRNA 3'末端から遠位に設定されているプローブなどを除外し、約55000個のプローブから10,498個のプローブに絞り込んだ。ここで、Quality Flagが "Good"とは、測定された発現量がスポット周囲のバックグラウンドの1.5SDより大きく、測定値として信頼できるということを意味する。またY染色体上に座位する遺伝子は男性にしか存在しないため、女性の検査を行った際に検出の感度及び/又は特異度が下がる恐れがあるので除外した。また、mRNA 3'末端から遠位に設定されているプローブは、cRNAの調製におけるバイアスを受けやすいため、測定値の大きな変動要因であるため除外した。さらに、予備分析により、欠損値が25%以上あるもの、男女間の発現量の差が大きいもの、アレイ製造時のバッチ間差が大きいものも除外した。
First, prepare the learning data to be learned by the neural network. In the following examples, probes other than Quality Flag “Good”, probes of genes located on the Y chromosome, probes set distally from the mRNA 3 ′ end, etc. are excluded, and 10,498 from about 55,000 probes. Narrow down to the probe. Here, the quality “Flag” being “Good” means that the measured expression level is larger than 1.5SD of the background around the spot and can be trusted as the measurement value. Further, since the gene located on the Y chromosome is present only in males, it was excluded because the sensitivity and / or specificity of detection might be lowered when females were examined. Probes set distal from the mRNA 3 'end are excluded because they are subject to bias in the preparation of cRNA and are a significant variation in the measured values. Furthermore, preliminary analysis excluded those with a missing value of 25% or more, those with a large difference in expression between men and women, and those with a large difference between batches during array production.
次にこのようにして選択した各プローブについて測定された、各プローブがハイブリダイズするRNAが由来する遺伝子の発現量をニューラルネットワークに入力し、2群間検定(t検定)、すなわち、学習例の統合失調症(未投薬)と双極性障害群の間で有意差検定(t検定)を行なう。下記実施例では、統合失調症群-双極性障害群間、統合失調症群-健常者群間、及び双極性障害群-健常者群間でそれぞれ有意差検定を行ない、各群間で有意差のあるプローブを合計216個絞り込んだ。なお、下記実施例では、試料の絞込みも行なった。すなわち、健常者56例の中央値をプローブごとに計算し、そのデータセットを対象として各試料の相関を調べ、近似曲線のパラメータやシグナル強度比が大きく隔たったものは分析対象から除外した。
Next, the expression level of the gene derived from the RNA hybridized with each probe, measured for each probe selected in this way, is input to the neural network, and the two-group test (t test), that is, the learning example A significant difference test (t-test) is performed between schizophrenia (unmedicated) and bipolar disorder groups. In the following examples, a significant difference test is performed between the schizophrenia group and the bipolar disorder group, between the schizophrenia group and the healthy person group, and between the bipolar disorder group and the healthy person group. A total of 216 probes with squeezed out. In the following examples, samples were also narrowed down. That is, the median value of 56 healthy subjects was calculated for each probe, the correlation of each sample was examined for the data set, and the parameters of the approximate curve and the signal intensity ratio greatly separated were excluded from the analysis target.
有意差検定により有意差が認められたプローブについて、変数増加法(forward selection)による選択を行なう。変数増加法自体は周知であり、説明変数(各プローブの測定結果)を1つずつ足していき、目的変数(正答率)との相関が高い組合せを得ることにより行なう。コンピューターにインストールされたニューラルネットワークを用いて変数増加法を行ない、最も正答率が高いプローブ数を選択する。この際、N-fold cross validation法を組み合わせて上記選択を行うことが好ましい。cross validation法自体も周知である。N-fold cross validationでは、データ(各プローブの測定結果)をほぼ同サイズのN個のサブセットに分割し、1つのサブセットを除外しながらニューラルネットワークの学習(訓練)を合計N回行う。下記実施例では、学習例のデータセットを3つのサブセットに分割し、データセットを入れ替えながら有意差のあったプローブを1つずつ使ってニューラルネットワークに分類予測を行わせ、最も正答率が高いプローブの組み合わせを同定した。
プ ロ ー ブ Select a probe for which a significant difference is recognized by the significant difference test by the forward selection method. The variable increasing method itself is well known, and is performed by adding explanatory variables (measurement results of each probe) one by one and obtaining a combination having a high correlation with the objective variable (correct answer rate). Using a neural network installed on the computer, the variable increase method is performed, and the number of probes with the highest correct answer rate is selected. At this time, it is preferable to perform the selection by combining N-fold cross validation methods. The cross-validation method itself is also well known. In N-fold cross validation, data (measurement results of each probe) is divided into N subsets of approximately the same size, and neural network learning (training) is performed a total of N times while excluding one subset. In the following example, the data set of the learning example is divided into three subsets, and the neural network performs classification prediction using the probes with significant differences one by one while switching the data sets. The combination of was identified.
ここで、本願発明者らは、実用化のための低コストのマイクロアレイとして、上記216種類のプローブを基板に搭載した実用化マイクロアレイを作製した。該実用化アレイには、さらに、グローバルノーマライゼーションに用いるプローブ及び管理用プローブ(位置合わせ用)も搭載した(詳細は下記実施例)。グローバルノーマライゼーションには、アレイ間での変動が小さなものを選択した。この実用化アレイは、1枚の基板上に複数(下記実施例では16個)のチャンバーを形成することができ、すなわち、1枚のアレイで16検体の検査を同時に行なうことができる。約55000種類のプローブを搭載したDNAマイクロアレイは高価であり、1枚のマイクロアレイで1検体しか処理できないが、該実用化アレイによれば、アレイ作製のコスト並びに検査のコスト及び手間を大幅に下げることができる。
Here, the inventors of the present application produced a practical microarray in which the 216 types of probes are mounted on a substrate as a low-cost microarray for practical use. The practical array was also equipped with a probe used for global normalization and a management probe (for alignment) (detailed examples below). The global normalization was selected with small variation between arrays. In this practical array, a plurality of chambers (16 in the following embodiment) can be formed on a single substrate, that is, 16 samples can be simultaneously tested with a single array. A DNA microarray equipped with about 55,000 types of probes is expensive, and only one specimen can be processed with one microarray. However, according to the practical array, the cost of preparing the array and the cost and labor of testing are greatly reduced. Can do.
上記実用化アレイを用いた測定値を利用して、コンピューターにインストールされたニューラルネットワークを用いて、上記した通りcross validation法及び変数増加法を駆使して、正答率が最高となるプローブの組合せを求めた。その結果、上記した12種類の遺伝子が特定された。
Using the measured values using the above practical array, using the neural network installed in the computer, using the cross-validation method and the variable increase method as described above, the combination of probes with the highest correct answer rate is selected. Asked. As a result, the above 12 genes were identified.
上記した12種類の遺伝子のプローブの測定値を説明変数として学習済みニューラルネットワークに入力し、試験例について感度及び特異度を算出すると、統合失調症及び双極性障害のいずれも感度及び特異度が80%を超え、高感度及び高特異度で統合失調症と双極性障害の判別が可能であることが確認された。
When the measured values of the above 12 kinds of gene probes are input to the learned neural network as explanatory variables and the sensitivity and specificity are calculated for the test examples, the sensitivity and specificity are 80 for both schizophrenia and bipolar disorder. It was confirmed that schizophrenia and bipolar disorder can be discriminated with high sensitivity and high specificity.
また、上記した12種類の遺伝子のプローブの測定値を説明変数として用いて重回帰分析を行ない、試験例について感度及び特異度を算出した場合にも、統合失調症及び双極性障害のいずれも感度及び特異度が80%を超えた。重回帰分析によっても、上記12種類の遺伝子発現量を用いて、高感度及び高特異度で統合失調症と双極性障害の判別が可能であることが確認された。
In addition, when multiple regression analysis was performed using the measured values of the above 12 kinds of gene probes as explanatory variables, and sensitivity and specificity were calculated for the test examples, both schizophrenia and bipolar disorder were sensitive. And the specificity exceeded 80%. Multiple regression analysis also confirmed that schizophrenia and bipolar disorder can be distinguished with high sensitivity and high specificity using the above 12 gene expression levels.
本発明の方法は、精神疾患、特に統合失調症ないしは双極性障害が疑われる患者について、統合失調症か双極性障害かを調べるために好ましく実施することができる。例えば、統合失調症の検出方法(すなわち、統合失調症か健常者かを判別する方法)と組み合わせて本発明の方法を用いると、より精度の高い診断が可能になる。統合失調症の検出方法は種々のものが公知である(例えば上記特許文献参照)。
The method of the present invention can be preferably carried out to examine whether a patient is suspected of having psychiatric disorder, particularly schizophrenia or bipolar disorder, whether it is schizophrenia or bipolar disorder. For example, when the method of the present invention is used in combination with a method for detecting schizophrenia (that is, a method for determining whether schizophrenia is a healthy person), a more accurate diagnosis is possible. Various detection methods for schizophrenia are known (see, for example, the above-mentioned patent document).
なお、本発明において、「塩基配列を有する」とは、塩基がそのような順序で配列しているという意味である。従って、例えば、「配列番号18で示される塩基配列を有するオリゴヌクレオチドプローブ」とは、配列番号18に示されるattttgcctt cacataccag acatgagacaの塩基配列を持つ、30塩基のサイズのオリゴヌクレオチドプローブを意味する。
In the present invention, “having a base sequence” means that the bases are arranged in such an order. Therefore, for example, “an oligonucleotide probe having the base sequence represented by SEQ ID NO: 18” means an oligonucleotide probe having a base sequence of attttgcctt cacataccag acatgagaca represented by SEQ ID NO: 18 and having a size of 30 bases.
以下、実施例に基づき本発明をより具体的に説明する。
Hereinafter, the present invention will be described more specifically based on examples.
1. プローブの絞込み
採血および試料の保管
統合失調症患者 抗精神病薬 未投薬群58例、健常者56例、双極性障害患者41例より、PAXgene Blood RNA Kit (Qiagen, Valencia, CA, USA) を用いて採血及びRNA抽出を行なった。PAXgene Blood RNA Tubes 2本に2.5mlづつ採血し、転倒混和したあと凍結し、実験室への搬送を行った。保管は-80℃とした。 1. Narrowed blood sampling and sample storage Schizophrenia patients Antipsychotics 58 untreated groups, 56 healthy subjects, 41 bipolar patients, PAXgene Blood RNA Kit (Qiagen, Valencia, CA, USA) The blood was collected and RNA was extracted. Two PAXgene Blood RNA Tubes were collected 2.5 ml each, mixed by inversion, frozen, and transported to the laboratory. Storage was -80 ° C.
RNA抽出
-80℃に保管しておいたPAXgene Blood RNA Tubesを室温で融解し、製造者の指示書に従ってtotal RNAを抽出した。抽出したtotal RNAは、-80℃で保管した。 RNA extraction PAXgene Blood RNA Tubes stored at -80 ° C were thawed at room temperature and total RNA was extracted according to the manufacturer's instructions. The extracted total RNA was stored at -80 ° C.
-80℃に保管しておいたPAXgene Blood RNA Tubesを室温で融解し、製造者の指示書に従ってtotal RNAを抽出した。抽出したtotal RNAは、-80℃で保管した。 RNA extraction PAXgene Blood RNA Tubes stored at -80 ° C were thawed at room temperature and total RNA was extracted according to the manufacturer's instructions. The extracted total RNA was stored at -80 ° C.
抽出したRNAの濃度、クォリティーの確認
抽出したtotal RNAを10mM Tris-HCl(pH7.5)で50倍に希釈し、230, 260, 280nmの吸光度を測定し、total RNAの濃度を測定した。抽出したRNAのクォリティーは、Agilent 2100バイオアナライザー(Agilent Technologies, Inc. Santa Clara, CA, USA)で確認を行った。 Confirmation of concentration and quality of extracted RNA Extracted total RNA was diluted 50-fold with 10 mM Tris-HCl (pH 7.5), absorbance at 230, 260, and 280 nm was measured, and the concentration of total RNA was measured. The quality of the extracted RNA was confirmed with an Agilent 2100 bioanalyzer (Agilent Technologies, Inc. Santa Clara, CA, USA).
抽出したtotal RNAを10mM Tris-HCl(pH7.5)で50倍に希釈し、230, 260, 280nmの吸光度を測定し、total RNAの濃度を測定した。抽出したRNAのクォリティーは、Agilent 2100バイオアナライザー(Agilent Technologies, Inc. Santa Clara, CA, USA)で確認を行った。 Confirmation of concentration and quality of extracted RNA Extracted total RNA was diluted 50-fold with 10 mM Tris-HCl (pH 7.5), absorbance at 230, 260, and 280 nm was measured, and the concentration of total RNA was measured. The quality of the extracted RNA was confirmed with an Agilent 2100 bioanalyzer (Agilent Technologies, Inc. Santa Clara, CA, USA).
cRNAの調製
抽出したtotal RNA 0.5μgを用いてcRNAを調製した。iExpress kit(GE Healthcare Bioscience, Chandler, CA, USA)を用い、製造者の指示書に従ってBiotin標識したcRNAを調製した。 Preparation of cRNA cRNA was prepared using 0.5 μg of extracted total RNA. Biotin-labeled cRNA was prepared using an iExpress kit (GE Healthcare Bioscience, Chandler, CA, USA) according to the manufacturer's instructions.
抽出したtotal RNA 0.5μgを用いてcRNAを調製した。iExpress kit(GE Healthcare Bioscience, Chandler, CA, USA)を用い、製造者の指示書に従ってBiotin標識したcRNAを調製した。 Preparation of cRNA cRNA was prepared using 0.5 μg of extracted total RNA. Biotin-labeled cRNA was prepared using an iExpress kit (GE Healthcare Bioscience, Chandler, CA, USA) according to the manufacturer's instructions.
調製したcRNAの定量およびクォリティーの確認は、抽出したtotal RNAの定量及びクォリティーの確認と同様に行った。すなわち、50倍に希釈したcRNA溶液の230, 260, 280 nmの吸光度を測定し、total RNAの濃度を測定した。cRNAのクォリティーの確認は、Agilent 2100バイオアナライザーで行った。
The quantification and quality confirmation of the prepared cRNA were performed in the same manner as the quantification and quality confirmation of the extracted total RNA. That is, the absorbance of 230, 260, and 280 nm of cRNA solution diluted 50 times was measured, and the concentration of total RNA was measured. The quality of the cRNA was confirmed using an Agilent 2100 bioanalyzer.
アレイへのハイブリダイゼーションと洗浄
マイクロアレイとして、Codelink(商標) 55K Bioarray(GEヘルスケア バイオサイエンス)を用いた。Codelink(商標) 55K Bioarrayは、スライドガラス表面を特殊な化学修飾を施したアクリルアミドでコーティングし、30merのプローブが3次元的に固定されているため、ハイブリダイズの効率が良く、再現性や感度に優れたマイクロアレイであり、ヒトの約約55000遺伝子に対応するプローブが固定されている。 Hybridization and Washing to Array As a microarray, Codelink ™ 55K Bioarray (GE Healthcare Bioscience) was used. Codelink (trademark) 55K Bioarray is coated with acrylamide with special chemical modification on the surface of glass slide, and 30mer probe is fixed three-dimensionally. It is an excellent microarray, and probes corresponding to about 55000 genes in humans are immobilized.
マイクロアレイとして、Codelink(商標) 55K Bioarray(GEヘルスケア バイオサイエンス)を用いた。Codelink(商標) 55K Bioarrayは、スライドガラス表面を特殊な化学修飾を施したアクリルアミドでコーティングし、30merのプローブが3次元的に固定されているため、ハイブリダイズの効率が良く、再現性や感度に優れたマイクロアレイであり、ヒトの約約55000遺伝子に対応するプローブが固定されている。 Hybridization and Washing to Array As a microarray, Codelink ™ 55K Bioarray (GE Healthcare Bioscience) was used. Codelink (trademark) 55K Bioarray is coated with acrylamide with special chemical modification on the surface of glass slide, and 30mer probe is fixed three-dimensionally. It is an excellent microarray, and probes corresponding to about 55000 genes in humans are immobilized.
10μgのcRNAを最終容量が20μlになるようRNase-Free H2Oで調製し、iExpress kit の5×Fragmentation Bufferを5μl添加した後、94℃で20分間インキュベートしてcRNAを断片化した。
10 μg of cRNA was prepared with RNase-Free H 2 O to a final volume of 20 μl, 5 μl of 5 × Fragmentation Buffer of iExpress kit was added, and then incubated at 94 ° C. for 20 minutes to fragment the cRNA.
10μgの断片化したcRNA(25μl)、78μlのiExpress kitのHybridization Buffer A、130μlのiExpress kit のHybridization Buffer Bを混合し、計260μlになるように調製した。90℃で5分間インキュベートした後、氷上で5~30分間インキュベートした。
10 μg of fragmented cRNA (25 μl), 78 μl of iExpress® kit Hybridization Buffer A, and 130 μl of iExpress kit Hybridization Buffer B were mixed to prepare a total of 260 μl. After incubating at 90 ° C. for 5 minutes, it was incubated on ice for 5-30 minutes.
250μlのハイブリダイゼーション溶液をCodeLink(商標) 55K Bioarray(GE Healthcare Bioscience, Chandler, CA, USA)のチャンバーへ注入し、CodeLink(商標) INNOVAシェイカー(GE Healthcare Bioscience, Chandler, CA, USA)を用いて、アレイを300rpmで旋回させながら、37℃で18~24時間インキュベートした。
250 μl of hybridization solution was injected into the chamber of CodeLink ™ 55K Bioarray (GE Healthcare Bioscience, Chandler, CA, USA) and using a CodeLink ™ INNOVA shaker (GE Healthcare Bioscience, Chandler, CA, USA) The array was incubated for 18-24 hours at 37 ° C. with swirling at 300 rpm.
Hybridization Removal Toolを使用してアレイを固定し、ハイブリダイゼーションチャンバーを引き剥がし、Bioarray Rackにアレイをセットした。アレイをセットしたBioarray Rackを46℃の0.75×TNT Bufferの入ったLarge Reagentリザーバーに移し、46℃で1時間インキュベーションした。
The array was fixed using Hybridization® Removal Tool, the hybridization chamber was peeled off, and the array was set on Bioarray® Rack. The Bioarray® Rack with the array set was transferred to a Large® Reagent reservoir containing 0.75 × TNT® Buffer at 46 ° C. and incubated at 46 ° C. for 1 hour.
Bioarray Rackを3.4 mlのStreptavidin-Cy5希釈溶液で満たしたSmall Reagentリザーバーに移し、室温で30分間インキュベートした。染色後、Bioarray Rack を240mlの1×TNT Bufferで満たしたLarge Reagentリザーバーに移し、室温で5分間インキュベートする操作を4回繰り返して洗浄した。次にBioarray Rackを0.1×SSC/0.05% Tween 20で満たしたLarge Reagentリザーバーに移し、30秒間洗浄し、アレイを遠心して乾燥した後、スキャニングまで遮光して保存した。
The Bioarray® Rack was transferred to a Small® Reagent reservoir filled with 3.4 μml of Streptavidin-Cy5 diluted solution and incubated at room temperature for 30 minutes. After staining, the Bioarray Rack was transferred to a Large Reagent reservoir filled with 240 ml of 1 × TNT Buffer, and washed by repeating the operation of incubating at room temperature for 5 minutes 4 times. Next, the Bioarray® Rack was transferred to a Large® Reagent reservoir filled with 0.1 × SSC / 0.05% Tween-20, washed for 30 seconds, the array was centrifuged and dried, and then stored in the dark until scanning.
アレイのスキャニング
洗浄後乾燥させたアレイをAgilent Scanner (Agilent Technologies, Santa Clara, CA, USA)にてスキャニングした。スキャナーの設定は、Red PMT [%] を70%、 Dye ChannelをRed (RedはCy5)とした。これ以外の設定はデフォルトとした。スキャンしたアレイデータはTIFファイルで保存し、数値化を行った。 Array Scanning The washed and dried arrays were scanned with an Agilent Scanner (Agilent Technologies, Santa Clara, CA, USA). The scanner settings were Red PMT [%] 70%, Dye Channel Red (Red is Cy5). The other settings are the default. The scanned array data was saved as a TIF file and digitized.
洗浄後乾燥させたアレイをAgilent Scanner (Agilent Technologies, Santa Clara, CA, USA)にてスキャニングした。スキャナーの設定は、Red PMT [%] を70%、 Dye ChannelをRed (RedはCy5)とした。これ以外の設定はデフォルトとした。スキャンしたアレイデータはTIFファイルで保存し、数値化を行った。 Array Scanning The washed and dried arrays were scanned with an Agilent Scanner (Agilent Technologies, Santa Clara, CA, USA). The scanner settings were Red PMT [%] 70%, Dye Channel Red (Red is Cy5). The other settings are the default. The scanned array data was saved as a TIF file and digitized.
アレイデータの数値化
製造者の指示書に従い、CodeLink(商標) Expression AnalysisによりTIFファイルで保存したアレイデータの数値化とグローバルノーマライゼーションによる正規化を行った。 Digitization of array data According to the manufacturer's instructions, CodeLink (trademark) Expression Analysis was used to digitize array data saved in TIF files and normalize by global normalization.
製造者の指示書に従い、CodeLink(商標) Expression AnalysisによりTIFファイルで保存したアレイデータの数値化とグローバルノーマライゼーションによる正規化を行った。 Digitization of array data According to the manufacturer's instructions, CodeLink (trademark) Expression Analysis was used to digitize array data saved in TIF files and normalize by global normalization.
プローブの絞込み
上記で得られた実験結果から、Quality Flag "Good"以外のプローブ、Y染色体上に座位するプローブ、mRNA 3’末端から遠位に設定されているプローブなどを除外した。さらに、さらに、予備分析により、欠損値が25%以上あるもの、男女間の発現量の差が大きいもの、アレイ製造時のバッチ間差が大きいものも除外した。これらにより、約55000個のプローブから10,498個のプローブに絞り込んだ。 Narrowing down probes From the experimental results obtained above, probes other than Quality Flag “Good”, probes located on the Y chromosome, probes set distal from themRNA 3 ′ end, and the like were excluded. Furthermore, preliminary analysis also excluded those with a missing value of 25% or more, those with a large difference in the expression level between men and women, and those with a large difference between batches during array production. These narrowed down from about 55,000 probes to 10,498 probes.
上記で得られた実験結果から、Quality Flag "Good"以外のプローブ、Y染色体上に座位するプローブ、mRNA 3’末端から遠位に設定されているプローブなどを除外した。さらに、さらに、予備分析により、欠損値が25%以上あるもの、男女間の発現量の差が大きいもの、アレイ製造時のバッチ間差が大きいものも除外した。これらにより、約55000個のプローブから10,498個のプローブに絞り込んだ。 Narrowing down probes From the experimental results obtained above, probes other than Quality Flag “Good”, probes located on the Y chromosome, probes set distal from the
2. 統計処理
以上のような条件で絞り込んだプローブから、統合失調症患者 抗精神病薬 未投薬群43検体、健常者38検体の2群間での有意差および双極性障害患者32検体と統合失調症患者 抗精神病薬 未投薬群40検体の間で統計学的有意差の認められたプローブ、さらに双極性障害患者32検体と健常者38検体の間で統計学的有意差の認められたプローブを216個抽出した。これらのプローブの配列を配列表の配列番号13~228に示す。また、各プローブが由来する遺伝子名及びGenBank Accession No.を下記表3に示す。 2. Statistical processing Based on the above-mentioned conditions, schizophrenic patients, antipsychotics, 43 untreated groups and 38 healthy subjects, significant differences between the 2 groups, and 32 bipolar patients and schizophrenia Patients who have a statistically significant difference between 40 specimens of the antipsychotic drug untreated group, and a probe that has a statistically significant difference between 32 specimens of bipolar disorder patients and 38 specimens of healthy individuals 216 were extracted. The sequences of these probes are shown in SEQ ID NOs: 13 to 228 in the sequence listing. In addition, Table 3 below shows the gene name and GenBank Accession No. from which each probe is derived.
以上のような条件で絞り込んだプローブから、統合失調症患者 抗精神病薬 未投薬群43検体、健常者38検体の2群間での有意差および双極性障害患者32検体と統合失調症患者 抗精神病薬 未投薬群40検体の間で統計学的有意差の認められたプローブ、さらに双極性障害患者32検体と健常者38検体の間で統計学的有意差の認められたプローブを216個抽出した。これらのプローブの配列を配列表の配列番号13~228に示す。また、各プローブが由来する遺伝子名及びGenBank Accession No.を下記表3に示す。 2. Statistical processing Based on the above-mentioned conditions, schizophrenic patients, antipsychotics, 43 untreated groups and 38 healthy subjects, significant differences between the 2 groups, and 32 bipolar patients and schizophrenia Patients who have a statistically significant difference between 40 specimens of the antipsychotic drug untreated group, and a probe that has a statistically significant difference between 32 specimens of bipolar disorder patients and 38 specimens of healthy individuals 216 were extracted. The sequences of these probes are shown in SEQ ID NOs: 13 to 228 in the sequence listing. In addition, Table 3 below shows the gene name and GenBank Accession No. from which each probe is derived.


3. 実用化アレイの設計
CodeLink(商品名) 55K Bioarrayは、非常に高価であり、1枚で1検体しか処理、解析ができない。実用化をはかるためには、より低コストで解析が可能なマイクロアレイが必要となる。そこで、CodeLink(商品名) 55K Bioarrayと全く同一の表面処理を施し、これを16個のチャンバーで区切ることで、一度に最大で16検体の処理、解析が可能なCodeLink(商品名) 16-Assay Bioarray(Applied Microarrays社)をベースにした実用化アレイを設計した。上記216遺伝子のプローブの他にグローバルノーマライゼーション用に使用するプローブ(配列番号229~527)やメーカーによる管理用プローブなど追加して、以下のようなアレイを設計した。 3. Designing a practical array CodeLink (trade name) 55K Bioarray is very expensive, and only one sample can be processed and analyzed. In order to put it to practical use, a microarray that can be analyzed at a lower cost is required. Therefore, the same surface treatment as CodeLink 55K Bioarray is applied, and this is divided into 16 chambers, so that CodeLink (trade name) 16-Assay can process and analyze up to 16 samples at a time. A practical array based on Bioarray (Applied Microarrays) was designed. In addition to the 216 gene probes, probes used for global normalization (SEQ ID NOs: 229 to 527) and management probes by manufacturers were added to design the following array.
CodeLink(商品名) 55K Bioarrayは、非常に高価であり、1枚で1検体しか処理、解析ができない。実用化をはかるためには、より低コストで解析が可能なマイクロアレイが必要となる。そこで、CodeLink(商品名) 55K Bioarrayと全く同一の表面処理を施し、これを16個のチャンバーで区切ることで、一度に最大で16検体の処理、解析が可能なCodeLink(商品名) 16-Assay Bioarray(Applied Microarrays社)をベースにした実用化アレイを設計した。上記216遺伝子のプローブの他にグローバルノーマライゼーション用に使用するプローブ(配列番号229~527)やメーカーによる管理用プローブなど追加して、以下のようなアレイを設計した。 3. Designing a practical array CodeLink (trade name) 55K Bioarray is very expensive, and only one sample can be processed and analyzed. In order to put it to practical use, a microarray that can be analyzed at a lower cost is required. Therefore, the same surface treatment as CodeLink 55K Bioarray is applied, and this is divided into 16 chambers, so that CodeLink (trade name) 16-Assay can process and analyze up to 16 samples at a time. A practical array based on Bioarray (Applied Microarrays) was designed. In addition to the 216 gene probes, probes used for global normalization (SEQ ID NOs: 229 to 527) and management probes by manufacturers were added to design the following array.
CodeLink(商品名) 16-Assay Bioarray プローブの内訳
(合計 1714スポット/チャンバー)
・分類予測候補プローブ : 216プローブ × 4重スポット
・ノーマライゼーション用追加プローブ : 299プローブ × 2重スポット
・メーカーによる管理用プローブ : 96プローブ × 各1スポット
・ 規格上の予約プローブ : グリッド (32) , Positive Control (60) , Negative Control (64) CodeLink (Product Name) 16-Assay Bioarray Probe Breakdown
(Total 1714 spots / chamber)
-Classification prediction candidate probe: 216 probes x 4 spots-Additional probe for normalization: 299 probes x 2 spots-Management probe by the manufacturer: 96 probes x 1 spot each- Standard reserved probe: Grid (32), Positive Control (60), Negative Control (64)
4. CodeLink(商品名) 16-Assay Bioarrayによる測定結果を基にした分類予測(ニューラルネットワーク)
未治療統合失調症患者(統合失調症患者 抗精神病薬 未投薬群)60例、双極性障害患者 48例の遺伝子発現情報を基に、分類予測に優れたニューラルネットワークによる分類予測モデルの構築を試みた。 4. CodeLink (trade name) 16-Assay Bioarray classification prediction based on measurement results (neural network)
Based on gene expression information of 60 untreated schizophrenic patients (schizophrenic patients antipsychotic untreated group) and 48 bipolar disorder patients, we tried to construct a classification prediction model by neural network with excellent classification prediction It was.
分類予測モデルを構築するにあたって、未治療統合失調症患者40検体、双極性障害患者32検体を学習例として分類予測モデルの構築に用い、モデルの構築に関与していない、残りの検体を試験例(未治療統合失調症患者20検体、双極性障害患者16検体)としてモデルの評価を行うHold out cross validation法により検証を行った。
When constructing a classification prediction model, 40 untreated schizophrenia patients and 32 bipolar disorder patients were used as learning examples to construct a classification prediction model, and the remaining samples that were not involved in the model were tested. Validation was performed by the Hold out cross validation method, which evaluates the model as 20 untreated schizophrenia patients and 16 bipolar disorder patients.
(1) 遺伝子発現情報の取得
216プローブを含む上記実用化アレイを用いて、未治療統合失調症患者60例、双極性障害患者48例の遺伝子発現情報を取得した。採血、RNAの抽出、cRNAの調製、アレイへのハイブリダイゼーション、蛍光シグナル(蛍光色素Cy5)のスキャニングは、上記と同様に行なった。スキャナーで読み取った1714スポットの画像データは、CodeLink(商標) Expression Analysisソフトウェアを用いて数値化及びグローバルノーマライゼーションによる正規化を行なった。 (1) Acquisition of gene expression information Using the above practical array including 216 probes, gene expression information of 60 untreated schizophrenia patients and 48 bipolar disorder patients was acquired. Blood collection, RNA extraction, cRNA preparation, array hybridization, and fluorescent signal (fluorescent dye Cy5) scanning were performed as described above. The image data of 1714 spots read by the scanner was digitized and normalized by global normalization using CodeLink ™ Expression Analysis software.
216プローブを含む上記実用化アレイを用いて、未治療統合失調症患者60例、双極性障害患者48例の遺伝子発現情報を取得した。採血、RNAの抽出、cRNAの調製、アレイへのハイブリダイゼーション、蛍光シグナル(蛍光色素Cy5)のスキャニングは、上記と同様に行なった。スキャナーで読み取った1714スポットの画像データは、CodeLink(商標) Expression Analysisソフトウェアを用いて数値化及びグローバルノーマライゼーションによる正規化を行なった。 (1) Acquisition of gene expression information Using the above practical array including 216 probes, gene expression information of 60 untreated schizophrenia patients and 48 bipolar disorder patients was acquired. Blood collection, RNA extraction, cRNA preparation, array hybridization, and fluorescent signal (fluorescent dye Cy5) scanning were performed as described above. The image data of 1714 spots read by the scanner was digitized and normalized by global normalization using CodeLink ™ Expression Analysis software.
(2) ニューラルネットワークによる分類予測モデルの構築
市販の解析ソフトArrayAssist(登録商標)(STRATAGENE社)に搭載されているニューラルネットワークを用いて、正規化したデータの解析を行ない、分類予測アルゴリズムの構築を試みた。分類予測アルゴリズムとは、あらかじめ属性が明らかになっているデータセットを入力し「学習、訓練」を行なうことで、最適な解を出力することができるようになる一連のアルゴリズムであり、ニューラルネットワークは、学習効果の高さから高い分類精度のアルゴリズムが構築できるとされている。 (2) Construction of classification prediction model by neural network Analyzes normalized data using neural network installed in commercially available analysis software ArrayAssist (registered trademark) (STRATAGENE) to construct classification prediction algorithm Tried. A classification prediction algorithm is a series of algorithms that can output an optimal solution by inputting a data set whose attributes have been clarified in advance and performing “learning and training”. It is said that an algorithm with high classification accuracy can be constructed from the high learning effect.
市販の解析ソフトArrayAssist(登録商標)(STRATAGENE社)に搭載されているニューラルネットワークを用いて、正規化したデータの解析を行ない、分類予測アルゴリズムの構築を試みた。分類予測アルゴリズムとは、あらかじめ属性が明らかになっているデータセットを入力し「学習、訓練」を行なうことで、最適な解を出力することができるようになる一連のアルゴリズムであり、ニューラルネットワークは、学習効果の高さから高い分類精度のアルゴリズムが構築できるとされている。 (2) Construction of classification prediction model by neural network Analyzes normalized data using neural network installed in commercially available analysis software ArrayAssist (registered trademark) (STRATAGENE) to construct classification prediction algorithm Tried. A classification prediction algorithm is a series of algorithms that can output an optimal solution by inputting a data set whose attributes have been clarified in advance and performing “learning and training”. It is said that an algorithm with high classification accuracy can be constructed from the high learning effect.
正規化されたデータの一部(未治療統合失調症患者40検体、双極性障害患者32検体)を学習例として、ArrayAssistのニューラルネットワークに入力し、アルゴリズムの構築を行なった。Feature Selectionは変数増加法(Forward Selection)により行ない、学習データを3組に分けたcross validation(N-fold cross validation (N=3))により分類予測アルゴリズムを構築した。具体的には、学習例のデータセットを3分割し、データセットを入れ替えながら、216個のプローブのうちで有意差のあったプローブを一つずつ使って分類予測を行ない、最も正しく分類できたプローブを分類予測に用いるプローブとして採用することとし、これを順次繰り返して採用するプローブを追加していった。このようにして、徐々に用いるプローブを増やしていき、正しく分類できた割合(Number of Class Accuracy(%))がプラトーに達したところで学習を終了させた。
A part of the normalized data (40 untreated schizophrenia patients, 32 bipolar disorder patients) was input to the ArrayAssist neural network as a learning example, and an algorithm was constructed. Feature Selection was performed by the variable increment method (Forward Selection), and the classification prediction algorithm was constructed by cross validation (N-fold cross validation (N = 3)) that divided the learning data into three sets. Specifically, the data set of the learning example was divided into three parts, and the prediction was made using one of the 216 probes with significant difference one by one while changing the data set. We decided to adopt the probe as a probe to be used for classification prediction, and added probes that were repeatedly used in this order. In this way, the number of probes used was gradually increased, and when the ratio (Number 分類 of Class Accuracy (%)) that was correctly classified reached a plateau, the learning was terminated.
次いで、このようにして学習させたアルゴリズムを用いて、試験例のデータセットを分析した。Number of Class Accuracyがプラトーに達した点で使用されているプローブセットについての正規化データを上記学習済みアルゴリズムに入力し、試験例についての該アルゴリズムによる分類が臨床診断とどの程度一致するかを検証した。
Next, the data set of the test example was analyzed using the algorithm learned in this way. Enter the normalized data for the probe set used at the point where Number of Class Accuracy reaches the plateau into the learned algorithm above to verify how well the classification of the test example matches the clinical diagnosis did.
ニューラルネットワークの各種パラメーター(学習効率、Momentum、繰り返し数、レイヤー数、ニューロン数)を種々に変化させて多数のアルゴリズムを構築し、それぞれについて上記したcross validationによる学習及び試験例を用いた診断精度の検証を行なった。
Numerous algorithms are constructed by variously changing various parameters of the neural network (learning efficiency, momentum, number of repetitions, number of layers, number of neurons), and learning accuracy by using cross-validation and test examples described above for each. Verification was performed.
その結果、パラメーターを下記の通りに設定したアルゴリズムにおいて、試験例を最も正しく分類することができた。
学習効率:0.45
Momentum:0.3
繰り返し数:150
レイヤー数:1
ニューロン数:3 As a result, it was possible to classify the test examples most correctly in the algorithm in which the parameters were set as follows.
Learning efficiency: 0.45
Momentum: 0.3
Number of repetitions: 150
Number of layers: 1
Number of neurons: 3
学習効率:0.45
Momentum:0.3
繰り返し数:150
レイヤー数:1
ニューロン数:3 As a result, it was possible to classify the test examples most correctly in the algorithm in which the parameters were set as follows.
Learning efficiency: 0.45
Momentum: 0.3
Number of repetitions: 150
Number of layers: 1
Number of neurons: 3
このアルゴリズムによる学習例及び試験例についての予測結果を表4及び表5に示す。また、このアルゴリズムについてのForward Selectionの結果を図1に示す。
Table 4 and Table 5 show the prediction results for learning examples and test examples based on this algorithm. Further, FIG. 1 shows the result of Forward Selection for this algorithm.


図1に示される通り、構築されたアルゴリズムによれば、12個のプローブ(表2、前掲)による発現データを用いて統合失調症と双極性障害とを精度良く分類することができる。
As shown in FIG. 1, according to the constructed algorithm, schizophrenia and bipolar disorder can be classified with high accuracy using expression data from 12 probes (Table 2, supra).
5. CodeLink(商品名) 16-Assay Bioarrayによる測定結果を基にした分類予測(重回帰分析)
上記と同様に、未治療統合失調症患者60例、双極性障害患者48例の遺伝子発現情報を用いて、重回帰分析による分類予測を試みた。上記12個のプローブによる発現データを説明変数として用いて、上記学習例について市販のソフトウェア(SPSS)を用いて重回帰分析を行ない、予測式を構築した。重回帰分析は、統合失調症患者で従属変数が大きくなるように設定して行った。次いで、構築された予測式を用いて、上記試験例について従属変数を計算した。なお、得られた予測式は以下の通りである。
Y=(A1X1+A2X2+A3X3+A4X4+A5X5+A6X6+A7X7+A8X8+A9X9+A10X10+A11X11+A12X12+C)×100
X1は、FLJ21881(GE492524 配列番号18)の遺伝子発現量
X2は、DLGAP3(GE54859 配列番号44)の遺伝子発現量
X3は、FAM20A (GE56606 配列番号61)の遺伝子発現量
X4は、MAX (GE59858 配列番号90)の遺伝子発現量
X5は、ZNF74(GE60153 配列番号97)の遺伝子発現量
X6は、DIAPH2 (GE62680 配列番号120)の遺伝子発現量
X7は、CR1 (GE62914 配列番号125)の遺伝子発現量
X8は、RAD54B (GE79729 配列番号161)の遺伝子発現量
X9は、GPR30 (GE80129 配列番号167)の遺伝子発現量
X10は、SCD5 (GE82995 配列番号195)の遺伝子発現量
X11はIMAGE:5785888 (GE878897 配列番号218)の遺伝子発現量
X12は、INSL3 (GE88024 配列番号220)の遺伝子発現量
をそれぞれ指す。
各遺伝子の発現量に乗ずる係数は、それぞれ、
A1は、-0.166864749248881
A2は、0.578595208826776
A3は、-0.251720387137894
A4は、0.285088434152454
A5は、0.149134281702735
A6は、-0.581754365047968
A7は、0.965099433225613
A8は、-0.237927470298808
A9は、0.724852821407317
A10は、0.467110697687733
A11は、1.55443576023811
A12は、-0.0695649776248728
定数Cは、-1.20827077326351
である。 5. CodeLink (trade name) 16-Assay Bioarray classification prediction based on measurement results (multiple regression analysis)
Similar to the above, classification prediction by multiple regression analysis was attempted using gene expression information of 60 untreated schizophrenia patients and 48 bipolar disorder patients. Using the expression data from the 12 probes as explanatory variables, a multiple regression analysis was performed on the learning example using commercially available software (SPSS) to construct a prediction formula. Multiple regression analysis was performed so that the dependent variable was increased in patients with schizophrenia. Subsequently, the dependent variable was calculated about the said test example using the constructed prediction formula. The obtained prediction formula is as follows.
Y = (A 1 X 1 + A 2 X 2 + A 3 X 3 + A 4 X 4 + A 5 X 5 + A 6 X 6 + A 7 X 7 + A 8 X 8 + A 9 X 9 + A 10 X 10 + A 11 X 11 + A 12 X 12 + C) x 100
X 1 is the gene expression level of FLJ21881 (GE492524 SEQ ID NO: 18)
X 2 is the gene expression level of DLGAP3 (GE54859 SEQ ID NO: 44)
X 3 is the gene expression level of FAM20A (GE56606 SEQ ID NO: 61)
X 4 is the gene expression level of MAX (GE59858 SEQ ID NO: 90)
X 5 is the gene expression level of ZNF74 (GE60153 SEQ ID NO: 97)
X 6 is the gene expression level of DIAPH2 (GE62680 SEQ ID NO: 120)
X 7 is the gene expression level of CR1 (GE62914 SEQ ID NO: 125)
X 8 is the gene expression level of RAD54B (GE79729 SEQ ID NO: 161)
X 9 is the gene expression level of GPR30 (GE80129 SEQ ID NO: 167)
X 10 is the gene expression level of SCD5 (GE82995 SEQ ID NO: 195)
X 11 is the gene expression level of IMAGE: 5785888 (GE878897 SEQ ID NO: 218)
X 12 indicates the gene expression level of INSL3 (GE88024 SEQ ID NO: 220), respectively.
The coefficient multiplied by the expression level of each gene is
A 1 is -0.166864749248881
A 2 is 0.578595208826776
A 3 is -0.251720387137894
A 4 is 0.285088434152454
A 5 is, 0.149134281702735
A 6 is -0.581754365047968
A 7 is 0.965099433225613
A 8 is -0.237927470298808
A 9 is 0.724852821407317
A 10 is 0.467110697687733
A 11 is 1.55443576023811
A 12 is -0.0695649776248728
Constant C is -1.20827077326351
It is.
従属変数50をカットオフ値として集計した結果を表6及び表7に示す。また、学習例及び試験例の各検体について計算された従属変数を図2に示す。
Tables 6 and 7 show the results of tabulating the dependent variable 50 as a cutoff value. Moreover, the dependent variable calculated about each sample of a learning example and a test example is shown in FIG.

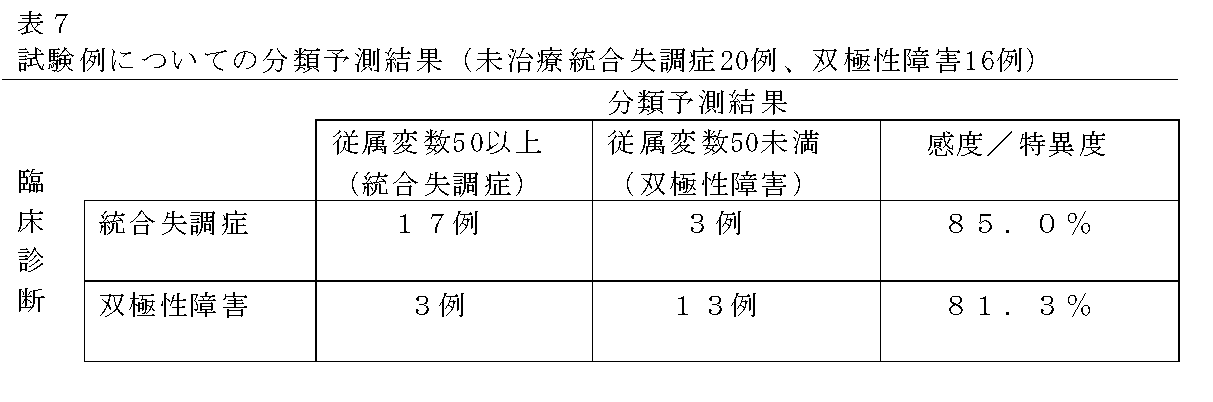
以上の通り、カットオフ値を50とすると、試験例において感度・特異度ともに80%を超える結果となった。重回帰分析によっても、上記12種類の遺伝子発現量を用いて統合失調症と双極性障害とを精度良く分類することができた。
As described above, when the cutoff value is 50, both the sensitivity and specificity in the test example exceeded 80%. Multiple regression analysis was also able to classify schizophrenia and bipolar disorder with high accuracy using the above 12 gene expression levels.
Claims (10)
- 生体から分離された試料における下記(1)~(12)の遺伝子群の発現量を指標とする、双極性障害と統合失調症の判別方法。
(1) FLJ21881(配列番号1)
(2) DLGAP3(配列番号2)
(3) FAM20A(配列番号3)
(4) MAX(配列番号4)
(5) ZNF74(配列番号5)
(6) DIAPH2(配列番号6)
(7) CR1(配列番号7)
(8) RAD54B(配列番号8)
(9) GPR30(配列番号9)
(10) SCD5(配列番号10)
(11) IMAGE:5785888(配列番号11)
(12) INSL3(配列番号12) A method for discriminating between bipolar disorder and schizophrenia, using as an index the expression level of the following gene groups (1) to (12) in a sample isolated from a living body:
(1) FLJ21881 (SEQ ID NO: 1)
(2) DLGAP3 (SEQ ID NO: 2)
(3) FAM20A (SEQ ID NO: 3)
(4) MAX (SEQ ID NO: 4)
(5) ZNF74 (SEQ ID NO: 5)
(6) DIAPH2 (SEQ ID NO: 6)
(7) CR1 (SEQ ID NO: 7)
(8) RAD54B (SEQ ID NO: 8)
(9) GPR30 (SEQ ID NO: 9)
(10) SCD5 (SEQ ID NO: 10)
(11) IMAGE: 5785888 (SEQ ID NO: 11)
(12) INSL3 (SEQ ID NO: 12) - 上記(1)~(12)の遺伝子群の発現量のみを指標とする請求項1記載の方法。 The method according to claim 1, wherein only the expression level of the gene group (1) to (12) is used as an index.
- 前記遺伝子群の発現量は、配列番号18、配列番号44、配列番号61、配列番号90、配列番号97、配列番号120、配列番号125、配列番号161、配列番号167、配列番号195、配列番号218及び配列番号220に示される塩基配列を有するオリゴヌクレオチドプローブにより測定される、請求項1又は2記載の方法。 The expression level of the gene group is SEQ ID NO: 18, SEQ ID NO: 44, SEQ ID NO: 61, SEQ ID NO: 90, SEQ ID NO: 97, SEQ ID NO: 120, SEQ ID NO: 125, SEQ ID NO: 161, SEQ ID NO: 167, SEQ ID NO: 195, SEQ ID NO: The method according to claim 1 or 2, which is measured by an oligonucleotide probe having a base sequence represented by 218 and SEQ ID NO: 220.
- 前記試料における前記遺伝子群の発現量を、あらかじめ測定した、既知の双極性障害患者及び統合失調症患者における前記遺伝子群の発現量と対比する工程を含む、請求項1ないし3ののいずれか1項に記載の方法。 4. The method according to claim 1, further comprising a step of comparing the expression level of the gene group in the sample with the expression level of the gene group in a known bipolar disorder patient and schizophrenic patient. The method according to item.
- 前記対比は、既知の双極性障害患者及び統合失調症患者における前記遺伝子群の発現量を用いて変数増加法により学習させたニューラルネットワークにより行なわれる請求項4記載の方法。 The method according to claim 4, wherein the comparison is performed by a neural network trained by a variable increment method using expression levels of the genes in known bipolar disorder patients and schizophrenia patients.
- 前記対比は、前記遺伝子群の発現量を説明変数として用いた重回帰分析により行なわれる請求項4記載の方法。 The method according to claim 4, wherein the comparison is performed by multiple regression analysis using the expression level of the gene group as an explanatory variable.
- 前記試料について計算された従属変数を、既知の双極性障害患者及び統合失調症患者について計算された従属変数に基づいて定められたカットオフ値と対比することを含む、請求項6記載の方法。 7. The method of claim 6, comprising comparing the dependent variable calculated for the sample with a cutoff value determined based on the dependent variable calculated for known bipolar disorder patients and schizophrenic patients.
- 前記遺伝子群の発現量は、配列番号13~228に示される塩基配列を有するオリゴヌクレオチドプローブがスポットされたアレイにより測定される遺伝子発現量のシグナル強度をグローバルノーマライゼーション法により正規化したものである、請求項3ないし7のいずれか1項に記載の方法。 The expression level of the gene group is obtained by normalizing the signal intensity of the gene expression level measured by an array spotted with oligonucleotide probes having the nucleotide sequences shown in SEQ ID NOs: 13 to 228 by the global normalization method. 8. A method according to any one of claims 3-7.
- 前記アレイは配列番号229~527に示される塩基配列を有するオリゴヌクレオチドプローブをさらに含む、請求項8記載の方法。 The method according to claim 8, wherein the array further comprises oligonucleotide probes having the base sequences shown in SEQ ID NOs: 229 to 527.
- 前記試料は血液である請求項1ないし9のいずれか1項に記載の方法。 10. The method according to any one of claims 1 to 9, wherein the sample is blood.
Applications Claiming Priority (2)
| Application Number | Priority Date | Filing Date | Title |
|---|---|---|---|
| JP2008-226031 | 2008-09-03 | ||
| JP2008226031A JP2010057407A (en) | 2008-09-03 | 2008-09-03 | Method for distinguishing bipolar disorder and schizophrenia |
Publications (1)
| Publication Number | Publication Date |
|---|---|
| WO2010026821A1 true WO2010026821A1 (en) | 2010-03-11 |
Family
ID=41796995
Family Applications (1)
| Application Number | Title | Priority Date | Filing Date |
|---|---|---|---|
| PCT/JP2009/061158 WO2010026821A1 (en) | 2008-09-03 | 2009-06-19 | Method for discrimination between bipolar disorder and schizophrenia |
Country Status (2)
| Country | Link |
|---|---|
| JP (1) | JP2010057407A (en) |
| WO (1) | WO2010026821A1 (en) |
Citations (4)
| Publication number | Priority date | Publication date | Assignee | Title |
|---|---|---|---|---|
| WO2003039490A2 (en) * | 2001-11-09 | 2003-05-15 | Office Of Technology Licensing Stanford University | Compositions and methods for diagnosing and treating mental disorders |
| WO2006105516A2 (en) * | 2005-03-31 | 2006-10-05 | The Board Of Trustees Of The Leland Stanford Junior University | Compositions and methods for diagnosing and treating neuropsychiatric disorders |
| WO2007059064A2 (en) * | 2005-11-12 | 2007-05-24 | The Board Of Trustees Of The Leland Stanford Junior University | Fgf2-related methods for diagnosing and treating depression |
| JP2007528704A (en) * | 2003-06-20 | 2007-10-18 | ジーンニュース,インコーポレイテッド | Method for detecting gene transcripts in blood and use thereof |
-
2008
- 2008-09-03 JP JP2008226031A patent/JP2010057407A/en active Pending
-
2009
- 2009-06-19 WO PCT/JP2009/061158 patent/WO2010026821A1/en active Application Filing
Patent Citations (4)
| Publication number | Priority date | Publication date | Assignee | Title |
|---|---|---|---|---|
| WO2003039490A2 (en) * | 2001-11-09 | 2003-05-15 | Office Of Technology Licensing Stanford University | Compositions and methods for diagnosing and treating mental disorders |
| JP2007528704A (en) * | 2003-06-20 | 2007-10-18 | ジーンニュース,インコーポレイテッド | Method for detecting gene transcripts in blood and use thereof |
| WO2006105516A2 (en) * | 2005-03-31 | 2006-10-05 | The Board Of Trustees Of The Leland Stanford Junior University | Compositions and methods for diagnosing and treating neuropsychiatric disorders |
| WO2007059064A2 (en) * | 2005-11-12 | 2007-05-24 | The Board Of Trustees Of The Leland Stanford Junior University | Fgf2-related methods for diagnosing and treating depression |
Non-Patent Citations (4)
| Title |
|---|
| AKINARI ITOKAWA ET AL.: "Togo Shicchosho - Kibun Shogai to Idenshi", SEISHINKA, vol. 11, no. 3, 2007, pages 187 - 195 * |
| HIROAKI TOMITA: "Kibun Shogai no Morateki Idenshi Hatsugen Kaiseki", IGAKU NO AYUMI, vol. 9, no. 3, 22 April 2009 (2009-04-22), pages 182 - 186 * |
| TADAO ARINAMI: "Togo Shicchosho no Iden Kaiseki", JAPANESE JOURNAL OF CLINICAL PSYCHOPHARMACOLOGY, vol. 10, no. 5, 2007, pages 869 - 883 * |
| TETSURO OMORI ET AL.: "DNA Microarray ni yoru Utsubyo no Atarashii Shindan Marker", PSYCHIATRIA ET NEUROLOGIA JAPONICA, vol. 108, no. 6, 2006, pages 642 - 645 * |
Also Published As
| Publication number | Publication date |
|---|---|
| JP2010057407A (en) | 2010-03-18 |
Similar Documents
| Publication | Publication Date | Title |
|---|---|---|
| CN111961725B (en) | Kit or device for detecting pancreatic cancer and detection method | |
| US11312999B2 (en) | Set of genes for molecular classifying of medulloblastoma and use thereof | |
| CN111662982B (en) | Biomarker for early diagnosis and/or recurrence monitoring of brain glioma and application thereof | |
| CN108676872A (en) | A kind of and the relevant biomarker of asthma and its application | |
| CN107630093B (en) | Reagent, kit, detection method and application for diagnosing liver cancer | |
| CN110229899B (en) | Plasma marker combinations for early diagnosis or prognosis prediction of colorectal cancer | |
| CN108998531B (en) | Long-chain non-coding RNA marker for lung cancer down-regulation and application thereof | |
| TWI571514B (en) | Method for accessing the risk of having colorectal cancer | |
| CN113724862A (en) | Colorectal cancer biomarker and screening method and application thereof | |
| CN111424085B (en) | Application of tRNA source fragment in preparation of breast cancer diagnostic reagent | |
| CN108728525A (en) | The cycle microRNA biomarkers of subarachnoid hemorrhage and its application | |
| JP7084034B2 (en) | Reagents used to evaluate minimal residual disease in neuroblastoma, and methods for analyzing biological samples using them | |
| CN108531569B (en) | Gene marker for screening obsessive-compulsive disorder, schizophrenia and depression and application thereof | |
| CN112501295B (en) | MiRNA combination, kit containing same and application of miRNA combination in lung cancer diagnosis | |
| WO2009157251A1 (en) | Method of diagnosing integration dysfunction syndrome | |
| WO2010026821A1 (en) | Method for discrimination between bipolar disorder and schizophrenia | |
| CN102766573A (en) | Gene group detection structure | |
| WO2021060311A1 (en) | Method for detecting brain tumor | |
| TWI626314B (en) | Method for accessing the risk of having colorectal cancer | |
| CN116287252B (en) | Application of long-chain non-coding RNA APCDD1L-DT in preparation of pancreatic cancer detection products | |
| KR102548873B1 (en) | A method for sorting colorectal cancer and advanced neoplasia and use of the same | |
| WO2020054474A1 (en) | Method for examining rheumatoid arthritis | |
| JP2022025456A (en) | Method for inspecting multiple sclerosis | |
| JP6017448B2 (en) | Diagnosis method of blood diseases | |
| WO2024047914A1 (en) | Analysis method, kit, and detection device for cancer diagnosis by means of microrna expression |
Legal Events
| Date | Code | Title | Description |
|---|---|---|---|
| 121 | Ep: the epo has been informed by wipo that ep was designated in this application |
Ref document number: 09811350 Country of ref document: EP Kind code of ref document: A1 |
|
| NENP | Non-entry into the national phase |
Ref country code: DE |
|
| 122 | Ep: pct application non-entry in european phase |
Ref document number: 09811350 Country of ref document: EP Kind code of ref document: A1 |