WO2010017543A1 - Detection algorithm for pcr assay - Google Patents
Detection algorithm for pcr assay Download PDFInfo
- Publication number
- WO2010017543A1 WO2010017543A1 PCT/US2009/053253 US2009053253W WO2010017543A1 WO 2010017543 A1 WO2010017543 A1 WO 2010017543A1 US 2009053253 W US2009053253 W US 2009053253W WO 2010017543 A1 WO2010017543 A1 WO 2010017543A1
- Authority
- WO
- WIPO (PCT)
- Prior art keywords
- nucleic acid
- target nucleic
- probe
- temperature
- slope
- Prior art date
- Legal status (The legal status is an assumption and is not a legal conclusion. Google has not performed a legal analysis and makes no representation as to the accuracy of the status listed.)
- Ceased
Links
Classifications
-
- C—CHEMISTRY; METALLURGY
- C12—BIOCHEMISTRY; BEER; SPIRITS; WINE; VINEGAR; MICROBIOLOGY; ENZYMOLOGY; MUTATION OR GENETIC ENGINEERING
- C12Q—MEASURING OR TESTING PROCESSES INVOLVING ENZYMES, NUCLEIC ACIDS OR MICROORGANISMS; COMPOSITIONS OR TEST PAPERS THEREFOR; PROCESSES OF PREPARING SUCH COMPOSITIONS; CONDITION-RESPONSIVE CONTROL IN MICROBIOLOGICAL OR ENZYMOLOGICAL PROCESSES
- C12Q1/00—Measuring or testing processes involving enzymes, nucleic acids or microorganisms; Compositions therefor; Processes of preparing such compositions
- C12Q1/68—Measuring or testing processes involving enzymes, nucleic acids or microorganisms; Compositions therefor; Processes of preparing such compositions involving nucleic acids
- C12Q1/6813—Hybridisation assays
-
- C—CHEMISTRY; METALLURGY
- C12—BIOCHEMISTRY; BEER; SPIRITS; WINE; VINEGAR; MICROBIOLOGY; ENZYMOLOGY; MUTATION OR GENETIC ENGINEERING
- C12Q—MEASURING OR TESTING PROCESSES INVOLVING ENZYMES, NUCLEIC ACIDS OR MICROORGANISMS; COMPOSITIONS OR TEST PAPERS THEREFOR; PROCESSES OF PREPARING SUCH COMPOSITIONS; CONDITION-RESPONSIVE CONTROL IN MICROBIOLOGICAL OR ENZYMOLOGICAL PROCESSES
- C12Q1/00—Measuring or testing processes involving enzymes, nucleic acids or microorganisms; Compositions therefor; Processes of preparing such compositions
- C12Q1/68—Measuring or testing processes involving enzymes, nucleic acids or microorganisms; Compositions therefor; Processes of preparing such compositions involving nucleic acids
- C12Q1/6844—Nucleic acid amplification reactions
- C12Q1/6851—Quantitative amplification
-
- C—CHEMISTRY; METALLURGY
- C12—BIOCHEMISTRY; BEER; SPIRITS; WINE; VINEGAR; MICROBIOLOGY; ENZYMOLOGY; MUTATION OR GENETIC ENGINEERING
- C12Q—MEASURING OR TESTING PROCESSES INVOLVING ENZYMES, NUCLEIC ACIDS OR MICROORGANISMS; COMPOSITIONS OR TEST PAPERS THEREFOR; PROCESSES OF PREPARING SUCH COMPOSITIONS; CONDITION-RESPONSIVE CONTROL IN MICROBIOLOGICAL OR ENZYMOLOGICAL PROCESSES
- C12Q1/00—Measuring or testing processes involving enzymes, nucleic acids or microorganisms; Compositions therefor; Processes of preparing such compositions
- C12Q1/68—Measuring or testing processes involving enzymes, nucleic acids or microorganisms; Compositions therefor; Processes of preparing such compositions involving nucleic acids
- C12Q1/6876—Nucleic acid products used in the analysis of nucleic acids, e.g. primers or probes
-
- C—CHEMISTRY; METALLURGY
- C12—BIOCHEMISTRY; BEER; SPIRITS; WINE; VINEGAR; MICROBIOLOGY; ENZYMOLOGY; MUTATION OR GENETIC ENGINEERING
- C12Q—MEASURING OR TESTING PROCESSES INVOLVING ENZYMES, NUCLEIC ACIDS OR MICROORGANISMS; COMPOSITIONS OR TEST PAPERS THEREFOR; PROCESSES OF PREPARING SUCH COMPOSITIONS; CONDITION-RESPONSIVE CONTROL IN MICROBIOLOGICAL OR ENZYMOLOGICAL PROCESSES
- C12Q2527/00—Reactions demanding special reaction conditions
- C12Q2527/107—Temperature of melting, i.e. Tm
Definitions
- the present application relates generally to the field of detection of nucleic acids using polymerase chain reaction (PCR).
- PCR polymerase chain reaction
- the application provides methods for increasing specificity, and therefore sensitivity, of the detection of target nucleic acids using PCR by calculating the effect of temperature on the hybridization of a labeled probe to the target, and by calculating the hybridization rate of the probe to the target as a function of label intensity as a function of time.
- PCR is used to amplify the nucleic acid using thermocycling of a heat stable DNA polymerase, such as Taq polymerase, in a reaction comprising the target nucleic acid, primers for DNA polymerization that are complementary to the target nucleic acid, as well as the necessary nucleosides and buffer reagents, as described, for instance, in U.S. Pat. No. 4,683,202.
- a heat stable DNA polymerase such as Taq polymerase
- PCR has evolved from technique performed only under controlled laboratory conditions to a technique useful for field testing. This evolution has been made possible by the advent of handheld PCR devices. Such devices may be particularly suited for the detection of pathogens, forensic sampling, or even rapid diagnosis of medical conditions without the need for expensive, time consuming and laborious laboratory processing. The use of PCR in the field is particularly important to counter bioterrorism, because rapid and accurate identification of bioweapons is crucial. [0005] Field applications still require a robust and accurate assay, despite the lack of a controlled laboratory environment.
- a method for detecting hybridization of a labeled nucleic acid probe to its complementry nucleic acid target comprising (a) contacting a sample suspected of containing a target nucleic acid with a labeled nucleic acid probe that hybridizes with the target nucleic acid; (b) measuring the label intensity at a first temperature and at a second temperature, wherein the first temperature is lower than the second temperature; (c) calculating the ratio of (i) the label intensity at the first temperature to (i) the label intensity at the second temperature, wherein a ratio of at least 0.8 indicates the presence of the target nucleic acid.
- steps (b) and (c) are repeated at least twice.
- steps (b) and (c) are repeated at the same first and second temperatures.
- the measurement of the first temperature can occur before the measurement of the second temperature or vice versa.
- the method is used as a post PCR detection technique.
- the method further comprises measuring the label intensity at single temperature at 3 or more points in time, for instance 15, 30, and 45 seconds, after the sample is brought to the said temperature.
- the method further comprises measuring the label intensity at different temperatures at three or more points in time, such as at 15, 30, and 45 seconds.
- a ratio of at least 0.9 indicates the presence of the target nucleic acid.
- the first temperature is below the Tm of the labeled nucleic acid probe and the second temperature is above the Tm of the labeled nucleic acid probe.
- the first temperature is about 40° C, about 41° C, about 42° C, about 43° C, about 44° C, about 45° C, about 46° C, about 47° C, about 48° C, about 49° C, about 50 ° C, about 51° C, about 52° C, about 53° C, about 54° C, about 55° C, about 56° C, about 57° C, about 58° C, about 59° C, about 60° C, about 61° C, about 62° C, about 63° C, about 64° C, about 65° C, about 66° C, about 67° C, about 68° C, about 69° C, about 70° C , about 71° C or about 72 °C.
- the second temperature is about 85° C, about 86° C, about 87° C, about 88° C, about 89° C, about 90° C, about 91° C, about 92° C, about 93° C, about 94° C, or about 95 °C.
- the second temperature is about 85° C, about 86° C, about 87° C, about 88° C, about 89° C, about 90° C, about 91° C, about 92° C, about 93° C, about 94° C, or about 95 °C.
- the first temperature is about 50° C and the second temperature is about 95° C.
- the labeled nucleic acid probe comprises a fluorescent label.
- the nucleic acid probe further comprises a quencher molecule that absorbs the emission of the fluorescent label such that when the quencher molecule and fluorescent label are in relatively close proximity, the fluorescent emission of the fluorescent label is undetectable or at least less detectable than when the quencher molecule and fluorescent label are not in close proximity.
- the nucleic acid probe is a molecular beacon or a linear probe.
- the target nucleic acid is DNA or RNA.
- an average ratio is calculated based on repeated measurements.
- the measuring is done following a PCR reaction.
- the PCR reaction comprises i) contacting a sample suspected of containing the target nucleic acid with the labeled nucleic acid probe in a solution comprising suitable primers, enzymes and substrates to form a reaction mixture; and ii) cycling said reaction mixture at denaturing, annealing and extension temperatures suitable for amplification of the target nucleic acid.
- a method for detecting hybridization of a labeled nucleic acid probe to its target nucleic acid comprising (a) contacting a sample suspected of containing a target nucleic acid with a labeled nucleic acid probe that hybridizes with the target nucleic acid; (b) measuring the label intensity at least two different points in time; and (c) calculating the slope of the label intensity as a function of time.
- the measuring at different points in time, as done in step (b) can be done under isothermic conditions or at different temperatures.
- a positive slope indicates the presence of the target nucleic acid when the intensity of the signal generated by the labeled nucleic acid probe increases over time when bound to the target nucleic acid as compared to the intensity of the signal generated by the labeled nucleic acid probe when it is not bound to the target nucleic acid.
- a negative or zero slope indicates the absence of the target nucleic acid
- the nucleic acid probe is a molecular beacon or a linear probe.
- the target nucleic acid is DNA or RNA.
- the measuring is done during isothermal conditions. In a further embodiment, the measuring is done following a PCR reaction. In a further embodiment, the measuring is completed within the time period of about 1 to about 10 minutes following the completion of the PCR reaction. In a further embodiment, the measuring is done at least five different points in time. In a further embodiment, the measuring is done at 15, 30, and 45 seconds following the completion of PCR.
- the PCR reaction comprises (i) contacting a sample suspected of containing the target nucleic acid with the labeled nucleic acid probe in a solution comprising suitable primers, enzymes, substrates and buffer to form a reaction mixture; and (ii) cycling said reaction mixture at denaturing, annealing and extension temperatures suitable for amplification of the target nucleic acid.
- the annealing and extension temperatures are the same.
- the slope is calculated by taking the first derivative of the label intensity as a function of time.
- the label intensity as a function of time is calculated by least squares fitting the label intensity measurements as a function of time.
- the hybridization kinetics of the labeled nucleic acid probe and target nucleic acid based on the slope of label intensity is calculated as a function of time.
- FIG. 1 is a graph showing the ratio of the fluorescent values below the beacon Tm divided by the fluorescence values above the beacon Tm. Positive ratios (+) were found only for samples containing bacillus globigii (BG) template, which is a surrogate organism for studying biological weapons, and negative ratios (-) were found for control samples that lacked BG template. Thus, FIG. 1 shows that the use of ratio values can be used to positively detect even small quantities of target sample while minimizing false positives.
- BG bacillus globigii
- FIG. 2 shows the results of measuring the slope of the fluorescence values over 3-10 minutes of six samples. Only samples containing BG templates, the target sequence, showed positive slopes.
- FIG. 3 shows the results of PCR reactions performed to determine whether label intensity at two temperatures at two different times can be used to accurately detect the presence of a target nucleic acid, a nucleic acid specific for anthrax, while minimizing false positives. The results show that anthrax was reliably detected.
- FIG. 4 shows the results of PCR reactions performed to determine whether label intensity at two temperatures at two different times can be used to accurately detect the presence of a target nucleic acid, a nucleic acid specific for tularemia, while minimizing false positives. The results show that tularemia was reliably detected.
- nucleic acid probe an oligonucleotide which is RNA or DNA that is complementary to the target sequence and thus hybridizes specifically to the target sequence.
- the probe can be any suitable length, and in some embodiments, the probe is from 20 to 1000 bases long.
- the probe is labeled, for example linked to at least one detectable reporter molecule.
- a fluorescent reporter molecule can be used as the reporter molecule.
- the fluorescent reporters may be attached to one end of the oligonucleotide and a fluorescent quencher molecule to the opposite end of the oligonucleotide such that when the reporter is in close proximity to the quencher, the fluorescent emission from the reporter is at least partially absorbed by the quencher, thus decreasing the detectable signal of the reporter.
- These molecules could be also be attached to the internal portion of the oligonucleotide.
- the mechanism of this quenching is known as fluorescent resonance energy transfer (FRET) and results in the probe having a higher label intensity when bound to the target versus when the probe is unbound.
- FRET fluorescent resonance energy transfer
- probes include linking radioisotopes, single fluorophores, DNA intercalating dyes (such as SYBR Green), chemiluminescent molecules, affinity tags, and the like.
- Hybridization of the probe to the target can be calculated using methods and equations known in the art, such at those described in Tsourkas et al. Nuc. Acids Res. (2003) 31 :1319-1330, which is hereby incorporated by reference in its entirety.
- molecular beacon it is meant a probe that has sequence complementary to the target in the middle of the probe, with a heterologous sequence at the 5' and 3' ends, which forms a stem-loop structure when the probe is not bound to the target and is at a temperature below the effective T M of the stem structure.
- the complementary sequence of the molecular probe may be at least 85%, at least 90%, at least 95%, at least 97%, at least 98%, or at least 99% complementary to the target.
- the stem-loop brings the 5' and 3' ends in close proximity, allowing the reporter and quencher molecules to interact, resulting in a reduced label intensity. Upon binding the target, the reporter and quencher molecules become more distant, allowing for an increased label intensity.
- linear probe it is meant a probe that has no particular secondary structure.
- the probe may be 100% complementary to the target or only partially complementary to the target.
- the probe may be at least 85%, at least 90%, at least 95%, at least 97%, at least 98%, or at least 99% complementary to the target.
- probe refers generally to a nucleic acid probe, a molecular beacon, and a linear probe.
- probe encompasses a nucleic acid probe, a molecular beacon, and a linear probe unless otherwise specified.
- target nucleic acid the nucleic acid in a sample to be detected using the complementary PCR primers and probes.
- the target may be DNA, such as genomic DNA, bacterial DNA, viral DNA, episomal DNA, or synthetic DNA.
- the target may be RNA, such as mRNA, rRNA, tRNA, viral RNA, bacterial RNA, or synthetic RNA.
- Samples containing the target nucleic acid may be from any source. Such samples include biological samples, environmental samples, clinical samples, in vitro samples, and tissue samples, for example. For example, the samples can come from a material suspected of being contaminated with a biowarfare agent.
- target nucleic acid examples include, but are not limited to, nucleic acids encoding at least a portion of the anthrax, tularemia, plague, and pan orthopox genomes. Methods for extracting the nucleic acid from such samples for use in PCR reactions are well known in the art and may be used.
- Probes and primers may be multiplexed to detect more than one target in a single reaction.
- different sets of primers will amplify different target nucleic acids, and the probes that detect the targets may have different labels, such as different fluorophores, such that the two targets may be distinguishable in the same reaction.
- different sets of primers will amplify different target nucleic acids, and the probes that detect the targets can have the same labels, such as identical fluorophores.
- the probes can hybridize at different temperatures, which allows each probe to be distinguishable in the same reaction despite the same label.
- multiple reactions can be used to screen for multiple targets, such as a screen for pathogenic organisms in a sample or disease genes. Such reactions may be performed in a multiwell format, for example a 96-well plate.
- label intensity it is meant the amplitude of the signal detected from the probe.
- the particular signal detected will depend on the probe. For example, fluorescence will be detected for a probe labeled with a fluorescent probe.
- label intensity is proportional to the amount of bound probe to the target and, therefore, proportional to the amount of target in the sample.
- a DNA intercalating reporter molecule such as SYBR Green
- fluorescence increases as more reporter is incorporated in the newly-synthesized double stranded DNA. Therefore, the label intensity can be used as a means to determine whether the target nucleic acid is present in the sample, and optionally, the amount of target present in the sample. For instance, the label intensity can be compared to a standard curve generated using known amounts of the target, interpolating the results, and determining the amount of target in the sample. Such methods are well known in the art.
- a proxy unit will be used to record or represent label intensity.
- a device may detect or record the fluorescence from a fluorescent probe as a particular voltage.
- This proxy unit, voltage in this specific example, can be considered the label intensity.
- hybridize it is meant when two single stranded polynucleotides combine to form one strand of double stranded polynucleotide.
- the nucleic acids may be DNA or RNA, and may form DNA-DNA, RNA-RNA, or DNA-RNA double stranded polynucleotides or three standed hybrids.
- Hybridization is sequence specific, and the kinetics of hybridization can be calculated using a second order equation, as described by Tsourkas et al. Nuc. Acids Res. (2003) 31 :1319-1330, for example, which is hereby incorporated by reference.
- the kinetics of hybridization can also be calculated by measuring the fluorescent increase of a molecular beacon over time during its hybridization to a homologous sequence.
- a molecular beacon is labeled on one end with a fluorescent molecule and on the other with a quencher molecule. As the molecular beacon hybridizes to its complementary sequence, the reporter fluor is physically separated from the quencher molecule and the fluorescence increases. The kinetics of hybridization can then be measured as the rate of fluorescent increase using the slope of the label intensity.
- Tm melting temperature
- slope of the label intensity as a function of time it is meant the slope of a line that is a plot of the label intensity or change in label intensity as a function of time.
- the probe hybridizes to its specific complementary template, the label intensity increases. Over a given time period more probe hybridizes to the template, which results in an increase of fluorescence (label intensity) over time.
- the slope may be measured as intensity over time or change in intensity over time.
- m is the slope ofthe line and Xi ⁇ x 2 .
- This equation can be employed any number of ways by one of skill in the field. For example, a line can be fit to data and then the equation can be applied to determine the slope m. Alternatively, the slope m can be calculated for a number of different points and the values averaged to determine a slope. In some embodiments, the slope will be calculated repeatedly using data points sequential in time. [0044] By "about,” it is meant a value that is the indicated value, plus or minus five percent of that value.
- PCR it is meant a repetitive target nucleic acid amplification reaction based on serial cycling of the temperature of a reaction comprising the target, which may be from a sample; a DNA polymerase such as Taq polymerase or other heat stable polymerase; at least one primer complementary to the target; a probe complementary to the amplified portion of the target; deoxynucleoside triphosphates; and a buffer solution comprising divalent cations. Suitable concentrations for the components are well known in the art and may be adjusted according to known optimization parameters. Each cycle typically includes three steps: denaturation at 85-100 0 C, annealing at 37-60 °C, and elongation at 40-75 °C.
- Each step may be 10-300 seconds long, preferably 30-120 seconds.
- the exact temperature of the steps may be varied according to the sequence of the target according to well-known parameters.
- the annealing temperature may be a temperature approximately 5 °C lower than the Tm of the primers, which can be calculated as described above.
- Each cycle can comprise two steps: the first step being denaturation and the second step combining the annealing and elongation steps together.
- An optional initial denaturation step may be included for "hot start" polymerases.
- a final elongation step may also be included to ensure any remaining single stranded DNA molecule is fully extended.
- Specific protocols for performing PCR are well known in the art and may be found, for example, in Current Protocols in Molecular Biology (April 2008, Print ISSN: 1934-3639; Online ISSN: 1934- 3647).
- the PCR reaction cycles can be characterized as being early, late and final stages.
- exponential amplification occurs as near 100% efficiency of doubling the target sequence occurs.
- the reaction enters the late stage and efficiency drops off.
- This stage is sometimes called the linear stage, though the reaction actually has a high degree of variability at this stage, depending on the availability of the reagents and polymerase performance.
- the final stage is a plateau at which no further target sequence accumulates due to exhaustion of the reagents and enzyme.
- Real time PCR also referred to as quantitative or Q-PCR and originally described as the 5' nuclease PCR assay, refers to measuring signals generated by the enzymatic cleavage of a dual labeled probe (label intensity) during the PCR reaction.
- the signal generated by the cleavage of the probe which is bound to the target sequence is proportional to the amount of target sequence in the reaction. By comparing the signal to known standards, the amount of target present in the sample may be determined.
- Endpoint PCR typically refers to measuring the label intensity in the late or final stage of the reaction. Complete exhaustion of the reagents is not required. While the target in the sample may be less precisely quantified using this method as compared to real time PCR, the target has been maximally amplified, allowing for robust detection of its present due to its greater abundance in the final stages of the PCR reaction.
- Assymetric PCR refers to a PCR technique used to preferentially amplify one strand of the target nucleic acid more than the other. Generally, preferential amplification of the target nucleic acid is accomplished by using a large excess of the primer for the preferred nucleic acid. Specifically asymmetric PCT protocols are well known in the art.
- PCR can be performed in any suitable thermocycler and format, such as 96 or 384 well plates.
- the PCR reaction may be performed in a field-suitable device, such as a BIOSEEQTM PLUS device available from Smiths Detection.
- the slope of the label intensity as a function of time can be calculated automatically using computer software or hardware, for example.
- label intensities are detected, and the output of this detection is transmitted to a processor for data manipulation.
- the processor performs the necessary calculations and returns the data in numerical, graphical or other interpretable output to the user.
- the user obtains the signal intensity data and manipulates the data manually.
- the data can be manually manipulated using standard mathematical methods or computer programs, such as Microsoft's EXCEL program, including the 2007 version.
- the hybridization of a labeled nucleic acid probe to its target nucleic acid is detected by measuring the label intensity at at least two different temperatures, hi one embodiment, the method comprises contacting a sample suspected of containing a target nucleic acid with a labeled nucleic acid probe that hybridizes with the target nucleic acid and measuring the label intensity at a first temperature and at a second temperature, wherein the first temperature is less than the second temperature or reversed.
- the ratio is calculated as the label intensity at the lower temperature divided by the label intensity at the higher temperature.
- the specific value of the ratio number depends on a number of factors including the label intensity scale of the instrument being used.
- a ratio of greater than one can be indicative of the presence of the target.
- a ratio of about 0.9, 1.0, 1.1, 1.2, 1.5, 2, 5, 10, 20, or 50 indicates the presence of a target nucleic acid.
- the ratio can also be used to calculate the amount of target present. Such a determination can be made by comparing the ratios to standards, for example.
- Another aspect in determining the ratio indicating the presence of a target nucleic acid is to determine the baseline ratio of reactions which contain no target nucleic acids which could be called the noise of the assay.
- a ratio determining the presence of target nucleic acids could be 5 or more standard deviations above the noise, for example.
- a ratio indicating the presence of target nucleic acids could be 2, 4, 6, 8, 10, or 15 or more standard deviations above the noise.
- the amount may also be calculated directly from the ratio without need for a comparison to standards.
- the temperatures at which the label intensity are measured can vary depending on the particular application, and suitable temperatures can be readily calculated by one of skill in the art. The selection of temperatures will depend on the Tm and sequence of the probe. Specifically, the higher temperature will be greater than Tm of the probe, and the lower temperature will be less than the Tm of the probe. In some embodiments, the higher temperature will be at least about 90 0 C and the lower temperature will be about 5O 0 C or less.
- the higher temperature can be at least 95°C, 100 0 C, 105 0 C, or 110 0 C
- the lower temperature can be 5 0 C, 10 0 C, 15 0 C, 20 0 C, 25 0 C, 30° C, 35 0 C, 40 0 C, or 45°C.
- intensities will be measured at more than two temperatures.
- intensity measurements can be taken at a first, second, and third temperatures, wherein each of the first, second, and third temperatures are different. Similar values at all temperatures are indicative of specific binding. Similar values can mean values that differ by no more than 20%, no more than 15%, no more than 10%, no more than 5%, no more than 3%, or no more than 1%. By increasing the number of temperatures used, the confidence in the results can be increased.
- the ratio can be calculated at one or several points in time. For example, label intensity can be measured following a PCR reaction to determine the presence of a target nucleic acid that is the subject of the PCR reaction. The label intensity can also be measured before a PCR reaction is performed. A ratio indicative of the presence of the target nucleic acid may therefore allow unnecessary PCR to be avoided.
- the ratio can be calculated based on a single reading at each of the higher and lower temperatures.
- multiple readings can be taken at the lower or higher temperature and the values averaged. Such averaging can be used to prevent errors caused by incorrect readings.
- the hybridization of a labeled nucleic acid probe to its target nucleic acid can be detected by measuring the slope of label intensity as a function of time. Because the amount of target in samples containing target increases over time due to PCR, more probe hybridizes to the target over time. Thus, label intensity as a function of time can be used to determine the presence of target in a sample. Moreover, the label intensity as a function of time can be used to determine the hybridization kinetics of the probe/target interaction.
- the method comprises contacting a sample suspected of containing a target nucleic acid with a labeled nucleic acid probe that hybridizes with the target nucleic acid and measuring the label intensity at different points in time.
- the slope of the label intensity of a function of time is indicative of both the presence of the target nucleic acid and the kinetics of the hybridization of the probe to the target nucleic acid.
- a positive slope indicates the presence of the target nucleic acid when the label intensity of the probe increases when hybridized to the target
- a negative or zero slope indicates the absence of target nucleic acid when the label intensity of the probe decreases when there is no target for the probe to hybridize with.
- the slope also can be used to determine the kinetics of hybridization using well-known kinetic equations.
- the slope of the label intensity as a function of time can be calculated in any number of ways readily known to one of skill in the art.
- the slope of the label intensity can be calculated, either analytically or numerically, by finding the first derivative of the line fit to the data. Such mathematical computations are well-known to those of skill in the art.
- the label intensity can be measured under isothermal conditions or at different temperatures. In one embodiment, all label intensity measurements are taken at a single temperature. In another embodiment, the label intensity measurements can be taken at different temperatures. This situation may occur during the cooling or heating of a PCR reaction mixture. In yet another example, the label intensity can be measures at different temperatures. Based on this data, different slopes can be calculated. For example, multiple data points can be taken at the first temperature, Tl, followed by taking multiple data points at the second temperature, T2. Based on this data, two different slopes can be calculated, one corresponding to the Tl data and one corresponding to the T2 data. By varying the temperature at which label intensity is measured, the kinetics of hybridization can be studied.
- the intensity measurements can be taken at any time.
- the measurements can be taken following PCR or taken during PCR. In some embodiments, the measurements are taken in the ten minutes following PCR. The measurements can also be taken in five, four, three, two, or one minutes following PCR. In one embodiment, measurements are taken at about 15 sec, 30 sec, and 45 sec. The time between measurements can vary. For example, the measurements can be separated by at least about 10 sec, about 15 sec, or about 20 sec The measurements can also be taken in rapid succession over some period of time.
- the number of intensity measurements can also vary. Generally, increasing the number of data points can increase the confidence in the slope of the line. But as few as two data points can be used to determine the slope. In some embodiments, two, three, or four data points are used to determine the slope.
- Example 1 Reducing false positives by measuring label intensity at two temperatures.
- PCR reactions were performed to determine whether label intensity at two temperatures can be used to accurately detect the presence of a target nucleic acid while minimizing false positives.
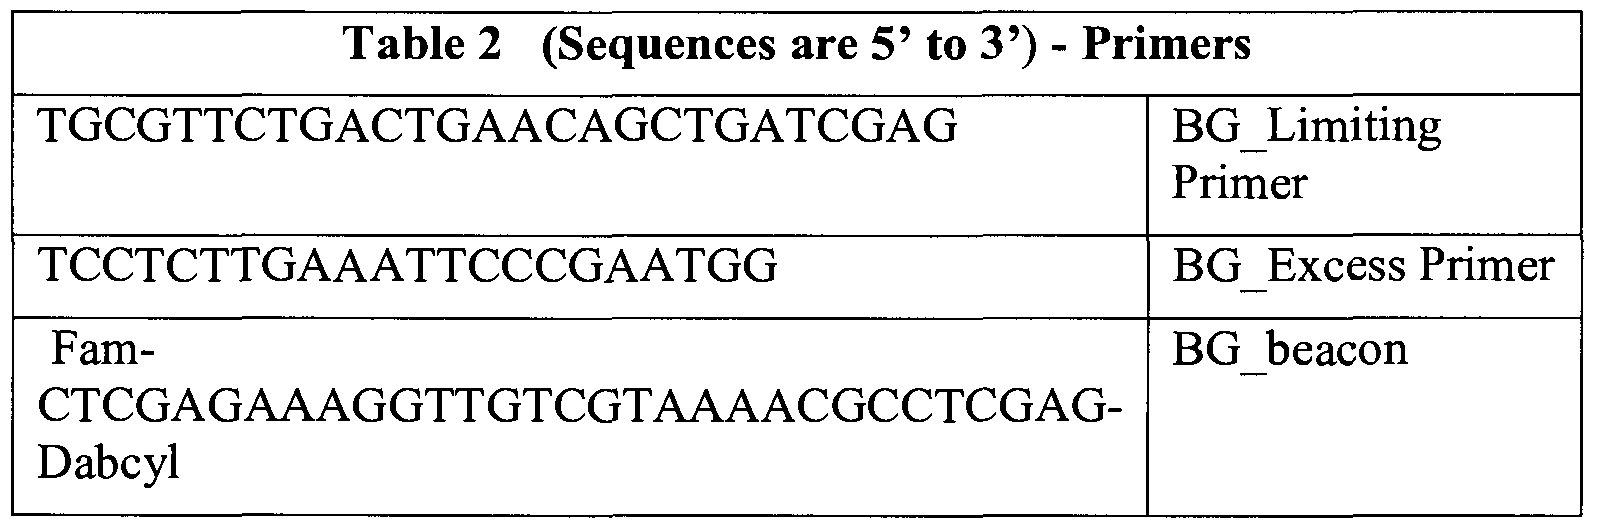
- the PCR reactions which were 25 ⁇ L each, are described below in Table 1, and the primer sequences used are described in Table 2.
- a fluorescent ratio below 1 indicates no target nucleic acid was included in the reaction, while a fluorescent ratio above 1 indicates target nucleic acid was included, as described above.
- the results demonstrate that at least as few as 60 copies of plague can be detected reliably using the ratios described herein.
- Example 2 Reducing false positives by measuring label intensity over time.
- PCR reactions were performed to determine whether the label intensity as a function of time could be used to determine the presence of a target nucleic acid. PCR reactions were performed, as described above in Example 1.
- Label intensity was also measured using powder samples that did or did not contain BG template. Specifically, six white powder samples were run on the Bioseeq PLUS instrument, which is available from Smiths Detection, using Training Assay consumables. One sample received negative powder (sample labeled - in Fig. 2), and the remaining five samples received positive BG powder (samples labeled + in Fig. 2). The samples were cycled 55 times from between 85°C and 95°C to between 50 0 C and 70 0 C. The reaction temperatures were then reduced to below the Tm of the beacons, between 40 0 C and 60 0 C, and fluorescent reads were taken every 15 seconds for 10 minutes. The fluorescent readings taken from minutes 3 to 10 were plotted on a scatter plot and the slope was calculated by fitting the data using linear regression. This slope value is shown in Figure 2.
- Example 3 Reducing false positives by measuring label intensity over time and at different temperatures with the Anthrax pXOl assay.
- PCR reactions were performed to determine whether label intensity at two temperatures at two different times can be used to accurately detect the presence of a target nucleic acid while minimizing false positives.
- the PCR reactions which were 25 ⁇ L each, are described above in Table 1, and the primer sequences used are described below in Table 5.
- Figure 2 shows the results of the measurements. Specifically, the values in the target rate column illustrate the on-rate slope and are examples of the differential seen between a positive (POS) and a negative (NEG) call.
- the three samples that contained no Anthrax template (modules 1,2 and 3) gave NEG calls.
- the three samples that contained ⁇ 60,000 anthrax genome copy equivalents (modules 4, 5, and 6) gave POS calls.
- the NEG calls show a negative slope while the POS calls show a positive slope.
- Example 4 Reducing false positives by measuring label intensity over time and at different temperatures with the tularemia assay.
- PCR reactions were performed to determine whether label intensity at two temperatures at two different times can be used to accurately detect the presence of a target nucleic acid while minimizing false positives.
- the PCR reactions which were 25 ⁇ L each, are described below in Table 1, and the primer sequences used are described in Table 6.
- Figure 3 shows the results of the measurements. Specifically, the values in the target rate column illustrate the on-rate slope and are examples of the differential seen between a positive(POS) and a negative(NEG) call.
- the three samples that contained no Tularemia template (modules 1, 2, and 3) gave NEG calls.
- the three samples that contained -60,000 Tularemia genome copy equivalents (modules 4, 5, and 6) gave POS calls.
- Two of the 3 NEG calls show a negative slope while the third NEG call shows a weak positive slope that is below the threshold used for a POS call, which in this case was 0.002. This is an illustration of the background noise of the assay.
- POS calls show a positive slope.
Landscapes
- Chemical & Material Sciences (AREA)
- Life Sciences & Earth Sciences (AREA)
- Organic Chemistry (AREA)
- Proteomics, Peptides & Aminoacids (AREA)
- Zoology (AREA)
- Health & Medical Sciences (AREA)
- Engineering & Computer Science (AREA)
- Wood Science & Technology (AREA)
- Analytical Chemistry (AREA)
- Microbiology (AREA)
- Bioinformatics & Cheminformatics (AREA)
- Molecular Biology (AREA)
- Immunology (AREA)
- Biotechnology (AREA)
- Biophysics (AREA)
- Biochemistry (AREA)
- Physics & Mathematics (AREA)
- General Engineering & Computer Science (AREA)
- General Health & Medical Sciences (AREA)
- Genetics & Genomics (AREA)
- Chemical Kinetics & Catalysis (AREA)
- Measuring Or Testing Involving Enzymes Or Micro-Organisms (AREA)
- Investigating Or Analysing Materials By The Use Of Chemical Reactions (AREA)
Abstract
Description


Claims
Priority Applications (7)
| Application Number | Priority Date | Filing Date | Title |
|---|---|---|---|
| AU2009279457A AU2009279457A1 (en) | 2008-08-08 | 2009-08-10 | Detection algorithm for PCR assay |
| CN2009801308017A CN102112632A (en) | 2008-08-08 | 2009-08-10 | Detection Algorithms for PCR Analysis |
| EP09791325A EP2315844A1 (en) | 2008-08-08 | 2009-08-10 | Detection algorithm for pcr assay |
| US13/057,735 US20110151461A1 (en) | 2008-08-08 | 2009-08-10 | Detection algorithm for pcr assay |
| JP2011522302A JP2011530296A (en) | 2008-08-08 | 2009-08-10 | Detection algorithms for PCR assays |
| CA2733186A CA2733186A1 (en) | 2008-08-08 | 2009-08-10 | Detection algorithm for pcr assay |
| BRPI0917434A BRPI0917434A2 (en) | 2008-08-08 | 2009-08-10 | detection algorithm for pcr test |
Applications Claiming Priority (2)
| Application Number | Priority Date | Filing Date | Title |
|---|---|---|---|
| US13604008P | 2008-08-08 | 2008-08-08 | |
| US61/136,040 | 2008-08-08 |
Publications (1)
| Publication Number | Publication Date |
|---|---|
| WO2010017543A1 true WO2010017543A1 (en) | 2010-02-11 |
Family
ID=41259286
Family Applications (1)
| Application Number | Title | Priority Date | Filing Date |
|---|---|---|---|
| PCT/US2009/053253 Ceased WO2010017543A1 (en) | 2008-08-08 | 2009-08-10 | Detection algorithm for pcr assay |
Country Status (10)
| Country | Link |
|---|---|
| US (1) | US20110151461A1 (en) |
| EP (1) | EP2315844A1 (en) |
| JP (1) | JP2011530296A (en) |
| KR (1) | KR20110052681A (en) |
| CN (1) | CN102112632A (en) |
| AU (1) | AU2009279457A1 (en) |
| BR (1) | BRPI0917434A2 (en) |
| CA (1) | CA2733186A1 (en) |
| RU (1) | RU2011107993A (en) |
| WO (1) | WO2010017543A1 (en) |
Cited By (6)
| Publication number | Priority date | Publication date | Assignee | Title |
|---|---|---|---|---|
| WO2010068576A1 (en) * | 2008-12-10 | 2010-06-17 | Smiths Detection Inc. | Identification and differentiation of nucleic acid sequence using temperature-dependent hybridization |
| EP2880184A4 (en) * | 2012-08-03 | 2016-03-30 | California Inst Of Techn | MULTIPLEXING AND QUANTIFICATION IN PCR WITH REDUCED REQUIREMENTS AND EQUIPMENT |
| US20170016049A1 (en) * | 2014-03-28 | 2017-01-19 | Seegene, Inc | Detection of a target nucleic acid sequence using two different detection temperatures |
| US10770170B2 (en) | 2012-02-03 | 2020-09-08 | California Institute Of Technology | Signal encoding and decoding in multiplexed biochemical assays |
| US12203129B2 (en) | 2018-07-03 | 2025-01-21 | ChromaCode, Inc. | Formulations and signal encoding and decoding methods for massively multiplexed biochemical assays |
| US12454720B2 (en) | 2018-04-17 | 2025-10-28 | ChromaCode, Inc. | Methods and systems for multiplex analysis |
Families Citing this family (6)
| Publication number | Priority date | Publication date | Assignee | Title |
|---|---|---|---|---|
| US20130203057A1 (en) * | 2012-01-20 | 2013-08-08 | Biohelix Corporation | Step-wise detection of multiple target sequences in isothermal nucleic acid amplification reactions |
| CN107208139B (en) | 2014-12-09 | 2020-11-10 | Seegene株式会社 | Resolution of signals associated with target nucleic acid sequences |
| WO2016093619A1 (en) * | 2014-12-09 | 2016-06-16 | Seegene, Inc. | Detection of target nucleic acid sequences using different detection temperatures and reference values |
| KR102110999B1 (en) * | 2016-01-26 | 2020-05-14 | 주식회사 씨젠 | Method of providing a signal for a target nucleic acid sequence |
| EP3743211A4 (en) * | 2018-01-22 | 2021-11-24 | Luminex Corporation | Methods and compositions for discrete melt analysis |
| WO2023068823A1 (en) * | 2021-10-21 | 2023-04-27 | 주식회사 씨젠 | Device and method for reading positive/negative with respect to target assay substance in sample |
Citations (3)
| Publication number | Priority date | Publication date | Assignee | Title |
|---|---|---|---|---|
| US20040005720A1 (en) * | 2001-10-30 | 2004-01-08 | Cremer Paul S. | Method and apparatus for temperature gradient microfluidics |
| US20050202470A1 (en) * | 2000-11-16 | 2005-09-15 | Caliper Life Sciences, Inc. | Binding assays using molecular melt curves |
| US20070026421A1 (en) * | 2000-11-16 | 2007-02-01 | Caliper Life Sciences, Inc. | Method and apparatus for generating thermal melting curves in a microfluidic device |
Family Cites Families (4)
| Publication number | Priority date | Publication date | Assignee | Title |
|---|---|---|---|---|
| US4683202A (en) * | 1985-03-28 | 1987-07-28 | Cetus Corporation | Process for amplifying nucleic acid sequences |
| US5475098A (en) * | 1994-06-14 | 1995-12-12 | The United States Of America As Represented By The Department Of Health And Human Services | Distinctive DNA sequence of E. coli 0157:H7 and its use for the rapid, sensitive and specific detection of 0157:H7 and other enterohemorrhagic E. coli |
| AU762728B2 (en) * | 1998-07-02 | 2003-07-03 | Gen-Probe Incorporated | Molecular torches |
| EP1955241B1 (en) * | 2005-11-14 | 2011-03-30 | Gen-Probe Incorporated | Parametric calibration method |
-
2009
- 2009-08-10 EP EP09791325A patent/EP2315844A1/en not_active Withdrawn
- 2009-08-10 CA CA2733186A patent/CA2733186A1/en not_active Abandoned
- 2009-08-10 JP JP2011522302A patent/JP2011530296A/en active Pending
- 2009-08-10 AU AU2009279457A patent/AU2009279457A1/en not_active Abandoned
- 2009-08-10 KR KR1020117005036A patent/KR20110052681A/en not_active Withdrawn
- 2009-08-10 RU RU2011107993/10A patent/RU2011107993A/en not_active Application Discontinuation
- 2009-08-10 US US13/057,735 patent/US20110151461A1/en not_active Abandoned
- 2009-08-10 WO PCT/US2009/053253 patent/WO2010017543A1/en not_active Ceased
- 2009-08-10 BR BRPI0917434A patent/BRPI0917434A2/en not_active Application Discontinuation
- 2009-08-10 CN CN2009801308017A patent/CN102112632A/en active Pending
Patent Citations (3)
| Publication number | Priority date | Publication date | Assignee | Title |
|---|---|---|---|---|
| US20050202470A1 (en) * | 2000-11-16 | 2005-09-15 | Caliper Life Sciences, Inc. | Binding assays using molecular melt curves |
| US20070026421A1 (en) * | 2000-11-16 | 2007-02-01 | Caliper Life Sciences, Inc. | Method and apparatus for generating thermal melting curves in a microfluidic device |
| US20040005720A1 (en) * | 2001-10-30 | 2004-01-08 | Cremer Paul S. | Method and apparatus for temperature gradient microfluidics |
Non-Patent Citations (4)
| Title |
|---|
| BULLOCK G.C. ET AL.: "Hepatitis C genotype determination by melting curve analysis with a single set of fluorescence resonance energy transfer probes", CLINICAL CHEMISTRY, AMERICAN ASSOCIATION FOR CLINICAL CHEMISTRY, WASHINGTON, DC, vol. 48, no. 12, 1 December 2002 (2002-12-01), pages 2147 - 2154, XP002414623, ISSN: 0009-9147 * |
| See also references of EP2315844A1 * |
| TSOURKAS A. ET AL.: "Hybridization kinetics and thermodynamics of molecular beacons", NUCLEIC ACIDS RESEARCH, OXFORD UNIVERSITY PRESS, SURREY, GB, vol. 31, no. 4, 15 February 2003 (2003-02-15), pages 1319 - 1330, XP002455592, ISSN: 0305-1048 * |
| WITTWER C.T. ET AL.: "CONTINUOUS FLUORESCENCE MONITORING OF RAPID CYCLE DNA AMPLIFICATION", BIOTECHNIQUES, INFORMA LIFE SCIENCES PUBLISHING, WESTBOROUGH, MA, US, vol. 22, no. 1, 1 January 1997 (1997-01-01), pages 130/131,134 - 138, XP000683698, ISSN: 0736-6205 * |
Cited By (18)
| Publication number | Priority date | Publication date | Assignee | Title |
|---|---|---|---|---|
| WO2010068576A1 (en) * | 2008-12-10 | 2010-06-17 | Smiths Detection Inc. | Identification and differentiation of nucleic acid sequence using temperature-dependent hybridization |
| US11827921B2 (en) | 2012-02-03 | 2023-11-28 | California Institute Of Technology | Signal encoding and decoding in multiplexed biochemical assays |
| US12168797B2 (en) | 2012-02-03 | 2024-12-17 | California Institute Of Technology | Signal encoding and decoding in multiplexed biochemical assays |
| US10770170B2 (en) | 2012-02-03 | 2020-09-08 | California Institute Of Technology | Signal encoding and decoding in multiplexed biochemical assays |
| US11866768B2 (en) | 2012-02-03 | 2024-01-09 | California Institute Of Technology | Signal encoding and decoding in multiplexed biochemical assays |
| EP2880184A4 (en) * | 2012-08-03 | 2016-03-30 | California Inst Of Techn | MULTIPLEXING AND QUANTIFICATION IN PCR WITH REDUCED REQUIREMENTS AND EQUIPMENT |
| US9791372B2 (en) | 2012-08-03 | 2017-10-17 | California Institute Of Technology | Multiplexing and quantification in PCR with reduced hardware and requirements |
| CN108753932A (en) * | 2012-08-03 | 2018-11-06 | 加州理工学院 | There is the multiplex of reduced hardware and requirement in PCR and quantify |
| US11959856B2 (en) | 2012-08-03 | 2024-04-16 | California Institute Of Technology | Multiplexing and quantification in PCR with reduced hardware and requirements |
| EP3901243A1 (en) * | 2012-08-03 | 2021-10-27 | California Institute of Technology | Multiplexing and quantification in pcr with reduced hardware and requirements |
| EP3122897B1 (en) * | 2014-03-28 | 2023-09-06 | Seegene, Inc. | Detection of target nucleic acid sequences using different detection temperatures |
| EP3122896B1 (en) * | 2014-03-28 | 2023-09-06 | Seegene, Inc. | Detection of a target nucleic acid sequence using two different detection temperatures |
| EP4269607A3 (en) * | 2014-03-28 | 2024-03-06 | Seegene, Inc. | Detection of target nucleic acid sequences using different detection temperatures |
| US10752938B2 (en) | 2014-03-28 | 2020-08-25 | Seegene, Inc. | Detection of a target nucleic acid sequence using two different detection temperatures |
| US20170016049A1 (en) * | 2014-03-28 | 2017-01-19 | Seegene, Inc | Detection of a target nucleic acid sequence using two different detection temperatures |
| US12291740B2 (en) | 2014-03-28 | 2025-05-06 | Seegene, Inc. | Detection of target nucleic acid sequences using different detection temperatures |
| US12454720B2 (en) | 2018-04-17 | 2025-10-28 | ChromaCode, Inc. | Methods and systems for multiplex analysis |
| US12203129B2 (en) | 2018-07-03 | 2025-01-21 | ChromaCode, Inc. | Formulations and signal encoding and decoding methods for massively multiplexed biochemical assays |
Also Published As
| Publication number | Publication date |
|---|---|
| AU2009279457A1 (en) | 2010-02-11 |
| CN102112632A (en) | 2011-06-29 |
| US20110151461A1 (en) | 2011-06-23 |
| EP2315844A1 (en) | 2011-05-04 |
| CA2733186A1 (en) | 2010-02-11 |
| BRPI0917434A2 (en) | 2015-12-01 |
| RU2011107993A (en) | 2012-09-20 |
| KR20110052681A (en) | 2011-05-18 |
| JP2011530296A (en) | 2011-12-22 |
Similar Documents
| Publication | Publication Date | Title |
|---|---|---|
| US20110151461A1 (en) | Detection algorithm for pcr assay | |
| EP2598654B1 (en) | Generic sample preparation | |
| CA2802567C (en) | Control nucleic acids for multiple parameters | |
| US20160115529A1 (en) | Control nucleic acids for multiple parameters | |
| US10358675B2 (en) | Oligonucleotides for controlling amplification of nucleic acids | |
| EP2598653B1 (en) | Generic pcr | |
| JP5916740B2 (en) | Quantitative multiple identification of nucleic acid targets | |
| McChlery et al. | The use of hydrolysis and hairpin probes in real-time PCR | |
| US9175332B2 (en) | Generic PCR | |
| US20170283888A1 (en) | Use of rnase h for the selective amplification of viral dna | |
| Exner | Multiplex molecular reactions: design and troubleshooting | |
| CA2932352C (en) | A method for coding of multiple pcr reactions for assay recognition | |
| OKULMUS¹ et al. | PCR AND ITS ROLE IN BIOCHEMISTRY | |
| Kessler | Design and work-up of a new molecular diagnostic assay based on real-time PCR | |
| OKULMUS et al. | PCR AND ITS ROLE IN BİOCHEMİSTRY |
Legal Events
| Date | Code | Title | Description |
|---|---|---|---|
| WWE | Wipo information: entry into national phase |
Ref document number: 200980130801.7 Country of ref document: CN |
|
| 121 | Ep: the epo has been informed by wipo that ep was designated in this application |
Ref document number: 09791325 Country of ref document: EP Kind code of ref document: A1 |
|
| DPE1 | Request for preliminary examination filed after expiration of 19th month from priority date (pct application filed from 20040101) | ||
| ENP | Entry into the national phase |
Ref document number: 2011522302 Country of ref document: JP Kind code of ref document: A |
|
| WWE | Wipo information: entry into national phase |
Ref document number: 2009279457 Country of ref document: AU |
|
| ENP | Entry into the national phase |
Ref document number: 2733186 Country of ref document: CA |
|
| WWE | Wipo information: entry into national phase |
Ref document number: 13057735 Country of ref document: US |
|
| WWE | Wipo information: entry into national phase |
Ref document number: 2009791325 Country of ref document: EP |
|
| NENP | Non-entry into the national phase |
Ref country code: DE |
|
| WWE | Wipo information: entry into national phase |
Ref document number: 1085/CHENP/2011 Country of ref document: IN |
|
| WWE | Wipo information: entry into national phase |
Ref document number: 591228 Country of ref document: NZ |
|
| ENP | Entry into the national phase |
Ref document number: 2009279457 Country of ref document: AU Date of ref document: 20090810 Kind code of ref document: A |
|
| ENP | Entry into the national phase |
Ref document number: 20117005036 Country of ref document: KR Kind code of ref document: A |
|
| WWE | Wipo information: entry into national phase |
Ref document number: 2011107993 Country of ref document: RU |
|
| ENP | Entry into the national phase |
Ref document number: PI0917434 Country of ref document: BR Kind code of ref document: A2 Effective date: 20110208 |