WO2007123772A2 - Genes involved in estrogen metabolism - Google Patents
Genes involved in estrogen metabolism Download PDFInfo
- Publication number
- WO2007123772A2 WO2007123772A2 PCT/US2007/008029 US2007008029W WO2007123772A2 WO 2007123772 A2 WO2007123772 A2 WO 2007123772A2 US 2007008029 W US2007008029 W US 2007008029W WO 2007123772 A2 WO2007123772 A2 WO 2007123772A2
- Authority
- WO
- WIPO (PCT)
- Prior art keywords
- expression
- genes
- cancer
- determining
- gene
- Prior art date
Links
Classifications
-
- C—CHEMISTRY; METALLURGY
- C12—BIOCHEMISTRY; BEER; SPIRITS; WINE; VINEGAR; MICROBIOLOGY; ENZYMOLOGY; MUTATION OR GENETIC ENGINEERING
- C12Q—MEASURING OR TESTING PROCESSES INVOLVING ENZYMES, NUCLEIC ACIDS OR MICROORGANISMS; COMPOSITIONS OR TEST PAPERS THEREFOR; PROCESSES OF PREPARING SUCH COMPOSITIONS; CONDITION-RESPONSIVE CONTROL IN MICROBIOLOGICAL OR ENZYMOLOGICAL PROCESSES
- C12Q1/00—Measuring or testing processes involving enzymes, nucleic acids or microorganisms; Compositions therefor; Processes of preparing such compositions
- C12Q1/68—Measuring or testing processes involving enzymes, nucleic acids or microorganisms; Compositions therefor; Processes of preparing such compositions involving nucleic acids
- C12Q1/6876—Nucleic acid products used in the analysis of nucleic acids, e.g. primers or probes
- C12Q1/6883—Nucleic acid products used in the analysis of nucleic acids, e.g. primers or probes for diseases caused by alterations of genetic material
- C12Q1/6886—Nucleic acid products used in the analysis of nucleic acids, e.g. primers or probes for diseases caused by alterations of genetic material for cancer
-
- C—CHEMISTRY; METALLURGY
- C12—BIOCHEMISTRY; BEER; SPIRITS; WINE; VINEGAR; MICROBIOLOGY; ENZYMOLOGY; MUTATION OR GENETIC ENGINEERING
- C12Q—MEASURING OR TESTING PROCESSES INVOLVING ENZYMES, NUCLEIC ACIDS OR MICROORGANISMS; COMPOSITIONS OR TEST PAPERS THEREFOR; PROCESSES OF PREPARING SUCH COMPOSITIONS; CONDITION-RESPONSIVE CONTROL IN MICROBIOLOGICAL OR ENZYMOLOGICAL PROCESSES
- C12Q2600/00—Oligonucleotides characterized by their use
- C12Q2600/106—Pharmacogenomics, i.e. genetic variability in individual responses to drugs and drug metabolism
-
- C—CHEMISTRY; METALLURGY
- C12—BIOCHEMISTRY; BEER; SPIRITS; WINE; VINEGAR; MICROBIOLOGY; ENZYMOLOGY; MUTATION OR GENETIC ENGINEERING
- C12Q—MEASURING OR TESTING PROCESSES INVOLVING ENZYMES, NUCLEIC ACIDS OR MICROORGANISMS; COMPOSITIONS OR TEST PAPERS THEREFOR; PROCESSES OF PREPARING SUCH COMPOSITIONS; CONDITION-RESPONSIVE CONTROL IN MICROBIOLOGICAL OR ENZYMOLOGICAL PROCESSES
- C12Q2600/00—Oligonucleotides characterized by their use
- C12Q2600/118—Prognosis of disease development
Definitions
- the present invention concerns genes that have been identified as being involved in estrogen metabolism, and are useful as diagnostic, prognostic and/or predictive markers in cancer.
- the present invention concerns genes the tumor expression levels of which are useful in the diagnosis of cancers associated with estrogen metabolism, and/or in the prognosis of clinical outcome and/or prediction of drug response of such cancers.
- standard of care chemotherapeutic drugs
- RNA-based tests while potentially highly quantitative, have not been used because of the perception that RNA is destroyed in tumor specimens as routinely prepared, namely fixed in formalin and embedded in paraffin (FPE), and because it is inconvenient to obtain and store fresh tissue samples from patients for analysis.
- estrogen receptor 1 ESRl
- Estrogen receptor-positive (ESR1+) tumors are generally less aggressive than estrogen receptor negative (ESRl-) tumors, and can often be successfully treated with anti-estrogens such as tamoxifen (TAM).
- ESRl- tumors are typically more aggressive and are resistant to anti-estrogen treatment.
- aggressive chemotherapy is often provided to patients for ESRl- tumors.
- assays for ESRl levels by immunohistochemistry are currently utilized as one parameter for making treatment decisions in breast cancer.
- lymph node negative patients whose tumors are found to be ESRl positive are treated with an anti-estrogen drug, such as tamoxifen (TAM), and patients whose tumors are found to be ESRl negative are treated with chemotherapy.
- TAM tamoxifen
- ESRl positive patients are also prescribed chemotherapy in addition to anti-estrogen therapy, accepting the toxic side effects of chemotherapy in order to modestly decrease the risk of cancer recurrence.
- Toxicities include, neuropathy, nausea and other gastrointestinal symptoms, hair loss and cognitive impairment.
- Recurrence is to be feared because recurrent breast cancer is usually metastatic and poorly responsive to treatment.
- GSTM human GSTM gene family
- GSTM1-GSTM5 GSTM proteins conjugate glutathione to various electrophilic small molecules, facilitating clearance of the electrophiles from cells.
- the activity of one or more GSTM enzymes may limit mutational damage caused by these estrogen metabolites.
- the present invention is based, at least in part, on the recognition that since estrogens may contribute to tumorigenesis and tumor progression via pathways that are ESRl independent, treatment decisions based primarily or solely on the ESRl status of a patient are unsatisfactory.
- One aspect of the invention is directed to a method of predicting clinical outcome for a subject diagnosed with cancer, comprising determining evidence of the expression level of one or more predictive RNA transcripts listed in Table 8, or their expression products, in a biological sample comprising cancer cells obtained from said subject, wherein evidence of increased expression of one or more of the genes listed in Table 8, or the corresponding expression product, indicates a decreased likelihood of a positive clinical outcome.
- the subject is a human patient.
- the expression level is obtained by a method of gene expression profiling.
- the method of gene expression profiling is a PCR-based method.
- the expression levels are normalized relative to the expression levels of one or more reference genes, or their expression products.
- the clinical outcome is expressed in terms of Recurrence-Free Interval (RFI), Overall Survival (OS), Disease-Free Survival (DFS), or Distant Recurrence-Free Interval (DRFI).
- RFI Recurrence-Free Interval
- OS Overall Survival
- DFS Disease-Free Survival
- DRFI Distant Recurrence-Free Interval
- the cancer is selected from the group consisting of breast cancer or ovarian cancer. In one embodiment the cancer is breast cancer.
- the method of predicting clinical outcome for a subject diagnosed with cancer comprises determining evidence of the expression level of at least two of said genes, or their expression products. In another embodiment, the expression levels of at least three of said genes, or their expression products are determined. In yet another embodiment, the expression levels of at least four of said genes, or their expression products are determined. In a further embodiment, the expression levels of at least five of said genes, or their expression products are determined.
- the method may further comprise the step of creating a report summarizing said prediction.
- Another aspect of the invention is a method of predicting the duration of Recurrence-Free Interval (RFI) in a subject diagnosed with breast cancer, comprising determining the expression level of one or more predictive RNA transcripts listed in Table 8 or their expression products, in a biological sample comprising cancer cells obtained from said subject, wherein evidence of increased expression of one or more of the genes listed in Table 8, or the corresponding expression product, indicates that said RFI is predicted to be shorter.
- the subject is a human patient.
- the expression level is obtained by a method of gene expression profiling.
- the method of gene expression profiling is a PCR-based method.
- the expression levels are normalized relative to the expression levels of one or more reference genes, or their expression products.
- the clinical outcome is expressed in terms of Recurrence-Free Interval (RFI), Overall Survival (OS), Disease-Free Survival (DFS), or Distant Recurrence-Free Interval (DRFI).
- RFI Recurrence-Free Interval
- OS Overall Survival
- DFS Disease-Free Survival
- DRFI Distant Recurrence-Free Interval
- the cancer is selected from the group consisting of breast cancer or ovarian cancer. In one embodiment the cancer is breast cancer.
- One aspect of the method of predicting the duration of Recurrence-Free Interval (RFI) for a subject diagnosed with cancer comprises determining evidence of the expression level of at least two of said genes, or their expression products. In one embodiment the expression levels of at least three of said genes, or their expression products are determined. In another embodiment the expression levels of at least four of said genes, or their expression products are determined. . In another embodiment the expression levels of at least five of said genes, or their expression products are determined.
- One aspect of the methods of this invention is that if the RFI is predicted to be shorter, said patient is subjected to further therapy following surgical removal of the cancer.
- the therapy is chemotherapy and/or radiation therapy
- One aspect of the methods of this invention is that the expression level of one or more predictive RNA transcripts or their expression products of one or more genes selected from the group consisting of CAT, CRYZ, CYP4Z1, CYP17A1, GPXl, GPX2, GSTMl, GSTM2, GSTM3, GSTM4, GSTM5, GSTPl, NQOl, PRDX3, and SC5DL is determined.
- One aspect of the methods of this invention is that the expression level of one or more predictive RNA transcripts or their expression products of one or more genes selected from the group consisting of GSTMl, GSTM2, GSTM3, GSTM4, GSTM5 and GSTPl is determined.
- One aspect of the methods of this invention is that the expression level of one or more predictive RNA transcripts or their expression products of one or more genes selected from the group consisting of GSTM2 and GSTM4 is determined.
- One aspect of the methods of this invention is that the expression level of one or more predictive RNA transcripts or their expression products of one or more genes selected from the group consisting of GSTMl and GSTM3 is determined.
- One aspect of the methods of this invention is that the expression level of one or more predictive RNA transcripts or their expression products of one or more genes selected from the group consisting of CAT, PRDX3, GPXl, and GPX2 is determined.
- One aspect of the methods of this invention is that the expression level of one or more predictive RNA transcripts or their expression products of one or more genes selected from the group consisting of PRDX3, GPXl and GPX2 is determined.
- One aspect of the methods of this invention is that the expression level of one or more predictive RNA transcripts or their expression products of one or more genes selected from the group consisting of GPXl and GPX2 is determined.
- One aspect of the methods of this invention is that the expression level of one or more predictive RNA transcripts or their expression products of one or more genes selected from the group consisting of CRYZ and NQOl is determined.
- One aspect of the methods of this invention is that the expression level of one or more predictive RNA transcripts or their expression products of CYP 17Al is determined.
- One aspect of the methods of this invention is that the expression level of one or more predictive RNA transcripts or their expression products of one or more genes selected from the group consisting of SC5DL and CYP4Z1 is determined.
- this invention concerns a method for preparing a personalized genomics profile for a patient comprising the steps of
- Another embodiment of this invention is a method for amplification of a gene listed in Table 8 by polymerase chain reaction (PCR) comprising performing said per by using amplicons listed in Table 7 and a primer-probe set listed in Table 6.
- PCR polymerase chain reaction
- Another embodiment of this invention is a PCR primer-probe set listed in Table 6.
- Another embodiment of this invention is a PCR amplicon listed in Table 7.
- Figure 1 shows the sequence alignment of the GSTMl and GSTM2 amplicons with the corresponding regions of other GSTM family members.
- Figure 2 shows the distribution of RT-PCR signals as CT values (X-axis) across the 125 breast cancer patients (Y-axis) for GSTM 1.1, GSTMl int5.2 and GSTM2int4.2.
- Figure 3 shows the distribution of RT-PCR signals as CT values for 22 human subjects for the different GSTM amplicons.
- Figure 4 shows the similarity and chromosome location of the GSTM genes.
- Figure 5 shows the cellular pathways which are the possible basis for the correlation of GSTM expression with good outcome.
- Figure 6 shows specific pathways for the degradation, modification and clearance of key estrogens, estrone and estradiol.
- Figure 7 shows specific pathways for the synthesis of key estrogens, estrone and estradiol, from cholesterol.
- RT-PCR has been variously used in the art to mean reverse-transcription PCR (which refers to the use of PCR to amplify mRNA by first converting mRNA to double stranded cDNA) or real-time PCR (which refers to ongoing monitoring in 'real-time' of the amount of PCR product in order to quantify the amount of PCR target sequence initially present.
- RT- PCR' means reverse transcription PCR.
- quantitative RT-PCR qRT-PCR
- DRFS distant recurrence-free survival
- microarray refers to an ordered arrangement of hybridizable array elements, preferably polynucleotide probes, on a substrate.
- polynucleotide when used in singular or plural, generally refers to any polyribonucleotide or polydeoxribonucleotide, which may be unmodified RNA or DNA or modified RNA or DNA.
- polynucleotides as defined herein include, without limitation, single- and double- stranded DNA, DNA including single- and double-stranded regions, single- and double-stranded RNA, and RNA including single- and double-stranded regions, hybrid molecules comprising DNA and RNA that may be single-stranded or, more typically, double-stranded or include single- and double-stranded regions.
- polynucleotide refers to triple-stranded regions comprising RNA or DNA or both RNA and DNA. The strands in such regions may be from the same molecule or from different molecules.
- the regions may include all of one or more of the molecules, but more typically involve only a region of some of the molecules.
- One of the molecules of a triple-helical region often is an oligonucleotide.
- polynucleotide specifically includes cDNAs.
- the term includes DNAs (including cDNAs) and RNAs that contain one or more modified bases.
- DNAs or RNAs with backbones modified for stability or for other reasons are “polynucleotides” as that term is intended herein.
- DNAs or RNAs comprising unusual bases, such as inosine, or modified bases, such as tritiated bases are included within the term "polynucleotides” as defined herein.
- polynucleotide embraces all chemically, enzymatically and/or metabolically modified forms of unmodified polynucleotides, as well as the chemical forms of DNA and RNA characteristic of viruses and cells, including simple and complex cells.
- oligonucleotide refers to a relatively short polynucleotide, including, without limitation, single-stranded deoxyribonucleotides, single- or double-stranded ribonucleotides, RNAtDNA hybrids and double-stranded DNAs. Oligonucleotides, such as single-stranded DNA probe oligonucleotides, are often synthesized by chemical methods, for example using automated oligonucleotide synthesizers that are commercially available. However, oligonucleotides can be made by a variety of other methods, including in vitro recombinant DNA-mediated techniques and by expression of DNAs in cells and organisms.
- Gene expression describes the conversion of the DNA gene sequence information into transcribed RNA (the initial unspliced RNA transcript or the mature mRNA) or the encoded protein product. Gene expression can be monitored by measuring the levels of either the entire RNA or protein products of the gene or subsequences.
- the phrase "gene amplification” refers to a process by which multiple copies of a gene or gene fragment are formed in a particular cell or cell line.
- the duplicated region (a stretch of amplified DNA) is often referred to as "amplicon.”
- amplicon a stretch of amplified DNA
- the amount of the messenger RNA (mRNA) produced i.e., the level of gene expression, also increases in the proportion of the number of copies made of the particular gene expressed.
- Prognostic factors are those variables related to the natural history of breast cancer, which influence the recurrence rates and outcome of patients once they have developed breast cancer. Clinical parameters that have been associated with a worse prognosis include, for example, lymph node involvement, increasing tumor size, and high grade tumors. Prognostic factors are frequently used to categorize patients into subgroups with different baseline relapse risks. In contrast, treatment predictive factors are variables related to the likelihood of an individual patient's beneficial response to a treatment, such as anti-estrogen or chemotherapy, independent of prognosis.
- prognosis is used herein to refer to the likelihood of cancer-attributable death or cancer progression, including recurrence and metastatic spread of a neoplastic disease, such as breast cancer, during the natural history of the disease.
- Prognostic factors are those variables related to the natural history of a neoplastic diseases, such as breast cancer, which influence the recurrence rates and disease outcome once the patient developed the neoplastic disease, such as breast cancer.
- naturally outcome means outcome in the absence of further treatment.
- natural outcome means outcome following surgical resection of the tumor, in the absence of further treatment (such as, chemotherapy or radiation treatment).
- Prognostic factors are frequently used to categorize patients into subgroups with different baseline risks, such as baseline relapse risks.
- treatment predictive factors are those variables related to the response of an individual patient to a specific treatment, independent of prognosis.
- the predictive methods of the present invention can be used clinically to make treatment decisions by choosing the most appropriate treatment modalities for any particular patient.
- the predictive methods of the present invention are valuable tools in predicting if a patient is likely to respond favorably to a treatment regimen, such as anti-estrogen therapy, such as TAM treatment alone or in combination with chemotherapy and/or radiation therapy.
- long-term survival is used herein to refer to survival for at least 3 years, more preferably for at least 8 years, most preferably for at least 10 years following surgery or other treatment.
- tumor refers to all neoplastic cell growth and proliferation, whether malignant or benign, and all pre-cancerous and cancerous cells and tissues.
- cancer and “cancerous” refer to or describe the physiological condition in mammals that is typically characterized by unregulated cell growth.
- examples of cancer include, but are not limited to, breast cancer, ovarian cancer, colon cancer, lung cancer, prostate cancer, hepatocellular cancer, gastric cancer, pancreatic cancer, cervical cancer, liver cancer, bladder cancer, cancer of the urinary tract, thyroid cancer, renal cancer, carcinoma, melanoma, and brain cancer.
- the "pathology" of cancer includes all phenomena that compromise the well-being of the patient. This includes, without limitation, abnormal or uncontrollable cell growth, metastasis, interference with the normal functioning of neighboring cells, release of cytokines or other secretory products at abnormal levels, suppression or aggravation of inflammatory or immunological response, neoplasia, premalignancy, malignancy, invasion of surrounding or distant tissues or organs, such as lymph nodes, etc.
- node negative cancer such as “node negative” breast cancer
- splicing and “RNA splicing” are used interchangeably and refer to RNA processing that removes introns and joins exons to produce mature mRNA with continuous coding sequence that moves into the cytoplasm of an eukaryotic cell.
- exon refers to any segment of an interrupted gene that is represented in the mature RNA product (B. Lewin. Genes IV CQW Press, Cambridge Mass. 1990).
- intron refers to any segment of DNA that is transcribed but removed from within the transcript by splicing together the exons on either side of it. Operationally, exon sequences occur in the mRNA sequence of a gene as defined by Ref. SEQ ID numbers. Operationally, intron sequences are the intervening sequences within the genomic DNA of a gene, bracketed by exon sequences and having GT and AG splice consensus sequences at their 5' and 3' boundaries.
- the present invention is based, at least in part, on the recognition that since estrogens may contribute to tumorigenesis and tumor progression via pathways that are ESRl independent, treatment decisions based primarily or solely on the ESRl status of a patient are unsatisfactory.
- the present invention is based on the identification of genes that are believed to be involved in the metabolism and/or clearance of estrogen, and thus in the control of intracellular concentration of electrophilic estrogen metabolites.
- gene specific probe primer sets were designed based on the exon and introns sequences of the genes identified. These probe primer sets may be used in conjuction with a variety of clinical samples to identify particular genes within the estrogen metabolism group which are prognostic of outcome in a particular type of cancer and/or have predictive value in determining patient response to a particular treatment modality.
- Estrogens including the principle active hormones, estrone and estradiol, can be converted to catechol estrogens (CE) via either 2-hydroxylation by cytochrome P4501A1 (CYPlAl) or via 4-hydroxyIation by cytochrome P4501B1 (CYPlBl).
- catechol estrogens (CE) can be further metabolized to CE semiquinones and then to CE quinones, which compounds are electrophiles and are proven or potential mutagens.
- Mitsubishi and Hirvonen Mutation Research, 544: 9-41 (2003); Lieher, Endocrine Reviews, 21:40-54 (2000).
- concomitant with the conversion of estrogen semiquinones to estrogen quinones molecular oxygen is converted to highly reactive superoxide anion, which also can damage DNA.
- Mutagenic catechol estrogen quinones can be converted back to catechol estrogens through the action of a NADPH-dependent quinone reductase (CRYZ) 3 making them re-available for metabolism via COMT.
- CYZ NADPH-dependent quinone reductase
- GST protein family includes GST mu enzymes (GSTMl, GSTM2, GSTM3, GSTM4 and GSTM5),.GST pi enzyme GSTPl and GST theta enzyme GSTTl.
- GST glutathione-S-transferase
- membrane-associated glutathione-S-transferase enzymes that catalyze the conjugation of glutathione to electrophiles, including MGSTl and MGST3, have been identified.
- Membrane-associated glutathione-S-transferase may also catalyze the reduction of lipid hydroperoxides (see below).
- Glutathione required by GST enzymes, is a ⁇ tripeptide synthesized from amino acids in a process the rate-limiting step of which is catalyzed by gamma-glutamylcysteine synthetase, an enzyme composed of a catalytic subunit (GCLC) and a regulatory subunit (GCLM) that are endoded by separate genes.
- GCLC catalytic subunit
- GCLM regulatory subunit
- Various other metabolites arising from the synthesis and degradation of estrogens are further modified by enzymatic sulfation or glucuronidation as a prerequisite for their clearance from the cell. Variation in the levels of the enzymes that carry out these modifications may shift the intracellular concentrations of estrogen and its electrophilic metabolites.
- SULTlEl is a member of the sulfotransferase family that preferentially sulfates estrone at the 3 position in a detoxification and clearance step.
- UGTs UDP-glucuronosyltransferases
- peroxiredoxins 2,3,4 and 6 The various enzymes of the peroxiredoxin family, including peroxiredoxins 2,3,4 and 6 (PRDX2, PRDX3, PRDX4 and PRDX6) also catalyze the i ⁇ activation Of H 2 O 2 as well as the reduction of organic hydroperoxides that may have been generated in the presence of ROS.
- Glutathione peroxidases GPXl and GPX2
- Allelic variants of GPXl have been associated with breast cancer risk (Knight et al., Cancer Epidemiol. Biomarkers Prev. 13: 146-9 (2004).
- Hydrogen peroxide in the presence of certain transition metal ions, gives rise to hydroxide ions, which not only can damage DNA directly but can also initiate lipid peroxidation, giving rise to lipid hydroperoxides.
- lipid hydroperoxides are believed to accelerate the conversion of catechol estrogen to semiquinones and quinones by cytochrome P450 (Cavalieri CMLS), thus amplifying the production of electrophilic estrogen metabolites.
- peroxiredoxins in addition to inactivating H202
- membrane-associated glutathione-S-transferases in addition to conjugating glutathione to electrophilic estrogen metabolites
- estradien is synthesized from cholesterol via a complex series of reactions. Cholesterol is first metabolized in C21 steroid metabolism pathways to pregnenolone. As shown in Figure 7, pregnenolone is then converted to androst- 4-ene-3,17-dione by the action of a 3 ⁇ -hydroxysteroid dehydrogenase and a cytochrome P450 (CYP17A1) in either order.
- Androst-4-ene-3,17-dione then gives rise to the key estrogens, estrone and estradiol through the sequential actions of a 17 ⁇ -hydroxysteroid dehydrogenase (HSD 17Bl, HSD17B2, and HSD17B4) and the cytochrome P450 enzyme, aromatase (CYP19A1) in either order. Both estrone and estradiol are subject to the degradation processes discussed above.
- Entry of estrogen precursors into the estrogen synthesis pathway can be limited by the alternate conversion of pregnenolone to progesterone and then to 20 ⁇ -hydroxyprogesterone by 20 ⁇ -hydroxysteroid dehydrogenase (AKR1C3), reducing the amount of androst-4-ene-3,17-dione available for conversion to estrogens.
- ARR1C3 20 ⁇ -hydroxysteroid dehydrogenase
- the present invention takes the novel approach of measuring the mRNA expression level of numerous genes that can affect the cellular concentration of mutagenic estrogen metabolites at equilibrium, and identifying markers of predisposition and prognosis in cancer the pathogenesis of which involves estrogen metabolism, such as breast cancer.
- diagnostic, prognostic and/or predictive indicators may include the expression of other genes or gene groups and may also include clinical variables including tumor size, stage and grade.
- Other diagnostic, prognostic or predictive indicators specifically include, individually or in any combination, the genes and genes sets disclosed in any of the following PCT Publications: WO 2003/078,662; WO 2004/071,572; WO 2004/074,518; WO 2004/065,583; WO 2004/111,273; WO 2004/111,603; WO 2005/008,213; WO 2005/040,396; WO 2005/039,382; WO 2005/064,019.
- the genes and gene groups of the present invention can be used to calculate Recurrence Score, an aggregate indication, based on multiple prognostic indicators, of the likelihood of a particular clinical outcome and/or drug responsiveness.
- Recurrence Score an aggregate indication, based on multiple prognostic indicators, of the likelihood of a particular clinical outcome and/or drug responsiveness.
- This information can be utilized by the patient and treating physicians to make treatment decisions, in particular decisions regarding whether or not to treat the patient with drugs that lead to appreciable adverse events.
- the expression level of each gene may be determined in relation to various features of the expression products of the gene including exons, introns, protein epitopes and protein activity.
- the expression level of a gene may be inferred from analysis of the structure of the gene, for example from the analysis of the methylation pattern of gene's promoter(s).
- methods of gene expression profiling can be divided into two large groups: methods based on hybridization analysis of polynucleotides, and methods based on sequencing of polynucleotides.
- the most commonly used methods known in the art for the quantification of mRNA expression in a sample include northern blotting and in situ hybridization (Parker & Barnes, Methods in Molecular Biology 106:247-283 (1999)); RNAse protection assays (Hod, Biotechniques 13:852-854 (1992)); and reverse transcription polymerase chain reaction (RT-PCR) (Weis et al, Trends in Genetics 8:263-264 (1992)).
- antibodies may be employed that can recognize specific duplexes, including DNA duplexes, RNA duplexes, and DNA-RNA hybrid duplexes or DNA-protein duplexes.
- Representative methods for sequencing- based gene expression analysis include Serial Analysis of Gene Expression (SAGE), and gene expression analysis by massively parallel signature sequencing (MPSS).
- SAGE Serial Analysis of Gene Expression
- MPSS massively parallel signature sequencing
- TtT-PCR Reverse Transcriptase PCR
- RT-PCR which can be used to compare mRNA levels in different sample populations, in normal and tumor tissues, with or without drug treatment, to characterize patterns of gene expression, to discriminate between closely related mRNAs, and to analyze RNA structure.
- the first step is the isolation of mRNA from a target sample.
- the starting material is typically total RNA isolated from human tumors or tumor cell lines, and corresponding normal tissues or cell lines, respectively.
- RNA can be isolated from a variety of primary tumors, including breast, lung, colon, prostate, brain, liver, kidney, pancreas, spleen, thymus, testis, ovary, uterus, etc., tumor, or tumor cell lines, with pooled DNA from healthy donors.
- mRNA can be extracted, for example, from frozen or archived paraffin-embedded and fixed (e.g. formalin-fixed) tissue samples.
- RNA isolation can be performed using purification kit, buffer set and protease from commercial manufacturers, such as Qiagen, according to the manufacturer's instructions. For example, total RNA from cells in culture can be isolated using Qiagen RNeasy mini-columns.
- RNA isolation kits include MasterPureTM Complete DNA and RNA Purification Kit (EPICENTRE®, Madison, WI), and Paraffin Block RNA Isolation Kit (Ambion, Inc.). Total RNA from tissue samples can be isolated using RNA Stat-60 (Tel-Test). RNA prepared from tumor can be isolated, for example, by cesium chloride density gradient centrifugation.
- RNA cannot serve as a template for PCR
- the first step in gene expression profiling by RT-PCR is the reverse transcription of the RNA template into cDNA, followed by its exponential amplification in a PCR reaction.
- the two most commonly used reverse transcriptases are avilo myeloblastosis virus reverse transcriptase (AMV-RT) and Moloney murine leukemia virus reverse transcriptase (MMLV-RT).
- AMV-RT avilo myeloblastosis virus reverse transcriptase
- MMLV-RT Moloney murine leukemia virus reverse transcriptase
- the reverse transcription step is typically primed using specific primers, random hexamers, or oligo-dT primers, depending on the circumstances and the goal of expression profiling.
- extracted RNA can be reverse-transcribed using a GeneAmp RNA PCR kit (Perkin Elmer, CA, USA), following the manufacturer's instructions.
- the derived cDNA can then be used as a template in
- the PCR step can use a variety of thermostable DNA-dependent DNA polymerases, it typically employs the Taq DNA polymerase, which has a 5'-3' nuclease activity but lacks a 3'-5' proofreading endonuclease activity.
- TaqMan® PCR typically utilizes the 5'-nuclease activity of Taq or Tth polymerase to hydrolyze a hybridization probe bound to its target amplicon, but any enzyme with equivalent 5' nuclease activity can be used.
- Two oligonucleotide primers are used to generate an amplicon typical of a PCR reaction.
- a third oligonucleotide, or probe is designed to detect nucleotide sequence located between the two PCR primers.
- the probe is non-extendible by Taq DNA polymerase enzyme, and is labeled with a reporter fluorescent dye and a quencher fluorescent dye. Any laser-induced emission from the reporter dye is quenched by the quenching dye when the two dyes are located close together as they are on the probe.
- the Taq DNA polymerase enzyme cleaves the probe in a template-dependent manner.
- the resultant probe fragments disassociate in solution, and signal from the released reporter dye is free from the quenching effect of the second fluorophore.
- One molecule of reporter dye is liberated for each new molecule synthesized, and detection of the unquenched reporter dye provides the basis for quantitative interpretation of the data.
- TaqMan® RT-PCR can be performed using commercially available equipment, such as, for example, ABI PRISM 7700TM Sequence Detection SystemTM (Perkin-Elmer-Applied Biosystems, Foster City, CA, USA) 5 or Lightcycler (Roche Molecular Biochemicals, Mannheim, Germany).
- the 5' nuclease procedure is run on a real-time quantitative PCR device such as the ABI PRISM 7700TM Sequence Detection SystemTM.
- the system consists of a thermocycler, laser, charge-coupled device (CCD), camera and computer.
- the system amplifies samples in a 96-well format on a thermocycler. During amplification, laser-induced fluorescent signal is detected at the CCD.
- the system includes software for running the instrument and for analyzing the data.
- 5'-Nuclease assay data are initially expressed as C ⁇ , or the threshold cycle.
- C T The point when the fluorescent signal is first recorded as statistically significant is the threshold cycle (C T ).
- RT-PCR is usually performed using one or more reference genes as internal standards.
- the ideal internal standard is expressed at a constant level among different tissues, and is unaffected by the experimental treatment.
- RNAs most frequently used to normalize patterns of gene expression are mRNAs for the housekeeping genes glyceraIdehyde-3-phosphate-dehydrogenase (GAPD) and ⁇ - actin (ACTB).
- GPD glyceraIdehyde-3-phosphate-dehydrogenase
- ACTB ⁇ - actin
- RT-PCR real time quantitative RT-PCR
- q RT-PCR measures PCR product accumulation through a dual-labeled fluorigenic probe (i.e., TaqMan® probe).
- Real time PCR is compatible both with quantitative competitive PCR, where internal competitor for each target sequence is used for normalization, and with quantitative comparative PCR using a normalization gene contained within the sample, or a housekeeping gene for RT-PCR.
- quantitative competitive PCR where internal competitor for each target sequence is used for normalization
- quantitative comparative PCR using a normalization gene contained within the sample, or a housekeeping gene for RT-PCR.
- RNA isolation, purification, primer extension and amplification are given in various published journal articles ⁇ for example: T.E. Godfrey et al. J. Molec. Diagnostics 2: 84-91 (2000); K. Sp ⁇ cht et al., Am. J. Pathol. 158: 419-29 (2001); Cronin et al., Am J Pathol 164:35-42 (2004) ⁇ . Briefly, a representative process starts with cutting about 10 ⁇ m thick sections of paraffin-embedded tumor tissue samples. The RNA is then extracted, and protein and DNA are removed. After analysis of the RNA concentration, RNA repair and/or amplification steps may be included, if necessary, and RNA is reverse transcribed using gene specific promoters followed by RT-PCR. b. Microarrays
- PCR amplified inserts of cDNA clones are applied to a substrate in a dense array.
- Preferably at least 10,000 nucleotide sequences are applied to the substrate.
- the microarrayed genes, immobilized on the microchip at 10,000 elements each, are suitable for hybridization under stringent conditions.
- Fluorescently labeled cDNA probes may be generated through incorporation of fluorescent nucleotides by reverse transcription of RNA extracted from tissues of interest. Labeled cDNA probes applied to the chip hybridize with specificity to each spot of DNA on the array.
- the chip After stringent washing to remove non-specifically bound probes, the chip is scanned by confocal laser microscopy or by another detection method, such as a CCD camera. Quantitation of hybridization of each arrayed element allows for assessment of corresponding mRNA abundance. With dual color fluorescence, _ . . . .,
- cDNA probes generated from two sources of RNA are hybridized pairwise to the array.
- the relative abundance of the transcripts from the two sources corresponding to each specified gene is thus determined simultaneously.
- the miniaturized scale of the hybridization affords a convenient and rapid evaluation of the expression pattern for large numbers of genes.
- Such methods have been shown to have the sensitivity required to detect rare transcripts, which are expressed at a few copies per cell, and to reproducibly detect at least approximately two-fold differences in the expression levels (Schena et al, Proc. Natl. Acad. ScL USA 93(2):106-149 (1996)).
- Microarray analysis can be performed by commercially available equipment, following manufacturer's protocols, such as by using the Affymetrix GenChip technology, or Incyte's microarray technology.
- Serial analysis of gene expression is a method that allows the simultaneous and quantitative analysis of a large number of gene transcripts, without the need of providing an individual hybridization probe for each transcript.
- a short sequence tag (about 10-14 bp) is generated that contains sufficient information to uniquely identify a transcript, provided that the tag is obtained from a unique position within each transcript.
- many transcripts are linked together to form long serial molecules, that can be sequenced, revealing the identity of the multiple tags simultaneously.
- the expression pattern of any population of transcripts can be quantitatively evaluated by determining the abundance of individual tags, and identifying the gene corresponding to each tag. For more details see, e.g. Velculescu et ah, Science 270:484-487 (1995); and Velculescu et al, Cell 88:243-51 (1997).
- MPSS Massively Parallel Si ⁇ nature Sequencing
- This method is a sequencing approach that combines non- gel-based signature sequencing with in vitro cloning of millions of templates on Ii
- a microbead library of DNA templates is constructed by in vitro cloning. This is followed by the assembly of a planar array of the template-containing microbeads in a flow cell at a high density (typically greater than 3 x 10 s microbeads/cm 2 ). The free ends of the cloned templates on each microbead are analyzed simultaneously, using a fluorescence- based signature sequencing method that does not require DNA fragment separation. This method has been shown to simultaneously and accurately provide, in a single operation, hundreds of thousands of gene signature sequences from a yeast cDNA library. e. General Description of the mRNA Isolation, Purification and Amplification
- RNA isolation, purification, primer extension and amplification are provided in various published journal articles (for example: T.E. Godfrey et til,. J. Molec. Diagnostics 2: 84-91 [2000]; K. Specht et al, Am. J. Pathol. 158: 419-29 [2001]).
- a representative process starts with cutting about 10 ⁇ m thick sections of paraffin-embedded tumor tissue samples. The RNA is then extracted, and protein and DNA are removed.
- RNA repair and/or amplification steps may be included, if necessary, and RNA is reverse transcribed using gene specific promoters followed by RT-PCR. Finally, the data are analyzed to identify the best treatment option(s) available to the patient on the basis of the characteristic gene expression pattern identified in the tumor sample examined, dependent on the predicted likelihood of cancer recurrence. f. Reference Gene Set
- An important aspect of the present invention is to use the measured expression of certain genes by breast cancer tissue to provide prognostic or predictive information. For this purpose it is necessary to correct for (normalize away) both differences in the amount of RNA assayed and variability in the quality of the RNA used.
- Well known housekeeping genes such as ⁇ -actin, GAPD, GUS, RPLO, and TFRC can be used as reference genes for normalization. Reference genes can also be chosen based on the relative invariability of their expression in the study samples and their lack of correlation with clinical outcome. Alternatively, normalization can be based on the mean or median signal (C T ) of all of the assayed genes or a large subset thereof (global normalization approach).
- C T mean or median signal
- PCR primers and probes are designed based upon intron sequences present in the gene to be amplified. Accordingly, the first step in the primer/probe design is the delineation of intron sequences within the genes. This can be done by publicly available software, such as the DNA BLAT software developed by Kent, W.J., Genome Res. 12(4):656-64 (2002), or by the BLAST software including its variations. Subsequent steps follow well established methods of PCR primer and probe design.
- PCR primer design The most important factors considered in PCR primer design include primer length, melting temperature (Tm), and G/C content, specificity, complementary primer sequences, and 3'-end sequence.
- optimal PCR primers are generally 17-30 bases in length, and contain about 20-80%, such as, for example, about 50-60% G+C bases. Tm's between 50 and 80 0 C, e.g. about 50 to 70 0 C are typically preferred.
- Treatment of cancer often involves resection of the tumor to the extent possible without severely compromising the biological function of the patient.
- tumor tissue is typically available for analysis following initial treatment of the tumor, and this resected tumor has most often been the sample used in expression analysis studies.
- Expression analysis can also be carried out on tumor tissue obtained through other means such as core, fine needle, or other types of biopsy.
- tumor tissue is appropriately obtained from biological fluids using methods such as fine needle aspiration, bronchial lavage, or transbronchial biopsy.
- CTC circulating tumor cells
- RNA and protein derived from tumor cells have been found in biological fluids of cancer patients, including blood and urine. Circulating nucleic acids and proteins may result from tumor cell lysis and may be subjected to expression analysis.
- C T threshold cycle
- mRNA amounts are expressed in C T (threshold cycle) units (Held et al., Genome Research 6:986-994 (1996)).
- the averaged sum of C ⁇ s for the reference mRNAs is arbitrarily set (e.g. to zero), and each measured test mRNA C T is given relative to this fixed reference. For example, if, for a particular patient tumor specimen the average of CTS of the reference genes found to be 31 and CT of test gene X is found to be 35, the reported value for gene X is -4 (i.e. 31-35).
- the normalized data can be used to analyze correlation between the expression level of particular mRNAs and clinical outcome.
- Standard statistical methods can be applied to identify those genes, for which the correlation between expression and outcome, in a univariate analysis, is statistically significant. These genes are markers of outcome, given the existing clinical status.
- Multivariate analysis can be applied to identify sets of genes, the expression levels of which, when used in combination, are better markers of outcome than the individual genes that constitute the sets.
- a gene can be assigned to a particular group based either on its known or suspected role in a particular aspect of the molecular biology of cancer or based on its co-expression with another gene already assigned to a particular group.
- Co- pending U.S. Patent Application 60/561,035 defines several such groups and further shows that the definition of such groups (also termed axis or subset) is useful in that it supports particular methods of data analysis and the elaboration of mathematical algorithms, which in turn yields a more powerful predictors of outcome than can be formulated if these groups are not defined.
- steroid metabolism including synthesis and degradation of steroids and clearance of intermediates is an aspect of the molecular pathology of cancer the importance of which has not been adequately appreciated.
- Genes involved in steroid metabolism form a "Steroid Metabolism Group" the definition of which supports particular methods of data analysis and will support the elaboration of mathematical algorithms useful in the prediction of outcome in various forms of cancer.
- the precise definition of the genes in the "Steroid Metabolism Group may vary depending on the identity of the steroid relevant in a particular cancer but will be defined to include a) genes, the expression products of which are known or suspected to be involved in synthesis and degradation of the particular steroid and clearance of intermediates, and b) genes that are co-expressed with such genes.
- the methods of this invention could be performed as a self- contained test for cancer.
- Individual markers of the invention identified by univariate analysis or sets of markers of the inventions e.g. identified by
- markers are useful predictors of clinical outcome.
- the markers can be applied as predictive elements of a test that could include other predictive indicators including a) other genes and/or gene groups, or b) other clinical indicators such as tumor stage and grade).
- kits or components thereof comprising agents, which may include gene-specific or gene-selective probes and/or primers, for quantitating the expression of the disclosed genes for predicting prognostic outcome or response to treatment.
- agents which may include gene-specific or gene-selective probes and/or primers, for quantitating the expression of the disclosed genes for predicting prognostic outcome or response to treatment.
- kits may optionally contain reagents for the extraction of RNA from tumor samples, in particular fixed paraffin-embedded tissue samples and/or reagents for RNA amplification.
- kits may optionally comprise the reagent(s) with an identifying description or label or instructions relating to their use in the methods of the present invention.
- the kits may comprise containers (including microtiter plates suitable for use in an automated implementation of the method), each with one or more of the various reagents (typically in concentrated form) utilized in the methods, including, for example, pre-fabricated microarrays, buffers, the appropriate nucleotide triphosphates (e.g., dATP, dCTP, dGTP and dTTP; or rATP, rCTP, rGTP and UTP), reverse transcriptase, DNA polymerase, RNA polymerase, and one or more probes and primers of the present invention (e.g., appropriate length poly(T) or random primers linked to a promoter reactive with the RNA polymerase).
- Mathematical algorithms used to estimate or quantify prognostic or predictive information are also properly potential components of kits.
- the methods provided by the present invention may also be automated in whole or in part.
- AU aspects of the present invention may also be practiced such that a limited number of additional genes that are co-expressed with the disclosed genes, for example as evidenced by high Pearson correlation coefficients, are included in a prognostic or predictive test in addition to and/or in place of disclosed genes.
- Genomic DNA was supplied by Dr. Maureen Cronin. The samples were collected with informed consent for genotyping under an IRB approved protocol.
- RNA extraction and preparation RNA was extracted from three 10 ⁇ m FPE sections per patient specimen according to Cronin et al. [AmJ.Pathol. 164, 35-42 (2004)].
- RNA amplification The FPE RNA used in this study was amplified prior to RT-PCR assay in order to preserve the RNA for later studies. Fifty ng of each FPE RNA sample was amplified using the SenseAmp kit from Genisphere (Hatf ⁇ eld, PA). The amplified RNA products were purified using the mirVana miRNA isolation kit from Ambion.
- TaqMan primer/probe design Exon-based assays: mRNA reference sequence accession numbers for genes of interest were identified and used to access the sequences through the NCBI Entrez Nucleotide database. ⁇ W ⁇ immm ⁇ mmmmm PCT/US20 (
- Intron-based assays Intron sequences were delineated by aligning appropriate mRNA reference sequences with their corresponding genes by using the DNA BLAT software [Kent, WJ., Genome Res. 12,,656-664(2002)]. Repetitive sequences within the introns were identified and masked using the Repeat Masker program (Institute for Systems Biology). Primers and probes were designed using Primer Express 2.0 (Applied Biosystems, Foster City, CA), or Primer 3 [Rozen,R.&Skaletsky,H.J. In Krawetz,S,Misener,S (eds) Bioinformatics Methods and Protocols: Methods in Molecular Biology. Humana Press, Totowa,NJ,365- 386(2000)].
- Standard chemistry oligonucleotides were supplied by Biosearch Technologies Inc. (Novato, CA), Integrated DNA Technologies (Coralville, IA), and Eurogentech (San Diego, CA); MGB probes were supplied by Applied Biosystems. AmpHcon sizes were typically 60-85 bases in length. Fluorogenic probes were dual-labeled with 5'-FAM and 3'-BHQ-2.
- Reference gene-based normalization was used to correct for differences in RNA quality and total quantity of RNA assayed.
- a set of five reference genes were selected from a series of candidates based on their low variance in expression across all the FPE breast cancer tissues and absence of a relationship (p>0.25) with disease free survival.
- a reference CT for each tested tissue was defined as the average measured CT of the five reference genes.
- the normalized mRNA level of a test gene within a tissue specimen was defined by the difference between the average CT of the test gene (from triplicate measurements) minus the reference CT.
- GSTM (GST ⁇ ) gene family consists of five different closely related isotypes named GSTM1-GSTM5.
- GSTM expression was examined by qRT-PCR in FPET primary breast cancer tissues.
- GSTMl was detected with the GSTMl.1 assay, which recognizes several GSTM isotypes.
- the estimate of relative risk in studies 1-4 was based on the hazard ratio (HR) from analysis of the time to breast cancer recurrence using univariate Cox proportional hazards regression.
- the estimate of relative risk in study 5 was based on the odds ratio (OR) from analysis of breast cancer death in a matched case-control study using conditional logistic regression.
- the GSTMl intron-based assay displays a biphasic expression pattern within 125 breast cancer specimens.
- Figure 2 shows the number of patients (Y-axis) and corresponding Ct values (x-axis) were plotted for GSTMl .1, GSTMlint5.2 and GSTM2int4.2 assays. Expression levels were determined by TaqMan RT-PCR. "int” indicates that the assay was derived from intron sequence.
- a GSTMl.1 signal was detected in all specimens (C ⁇ 40).
- GSTM2int4.2 an intron-based design, designated GSTM2int4.2.
- This 73 base amplicon differs from the other GSTM isotypes by 14 or more bases within the corresponding primer/probe regions ( Figure 2).
- Expression of this sequence in the 125 patient specimens distributes across 6 C T units, from 34-40 ( Figure 2).
- Genotyping with GSTM2int4.2 gave uniform positive signals for all 22 tested DNA specimens ( Figure 3) indicating that GSTM2 is not deleted.
- GSTM1-5 expression predict favorable outcome in the 125 breast cancer specimen study. Multivariate analysis suggests that GSTM2 and GSTM3 carry independent biomarker information. Univariate and multivariate Cox PH regression analysis. Assays are ordered by p-value, with p-values ⁇ 0.05 considered significant. Data in bold are assays that are specific, "int” indicates that the assay was derived from intron sequence. (Tables 3 and 4) .
- the primary objective of this study was to determine the relationship between the expression of genes involved in estrogen metabolism (including members of the GST gene family) and clinical outcome, in particular distant recurrence-free survival (DRFS), in breast cancer carcinoma.
- DRFS distant recurrence-free survival
- the expression level of each of 82 amplicons was quantitatively assessed using qRT-PCR and the correlation between gene expression and distant recurrence-free survival (DRFS) for each of the test genes was evaluated.
- Distant recurrence-free survival is the time from surgery until the first diagnosis of distant recurrence. Contralateral disease, other second primary cancers, and deaths prior to distant recurrence will be considered censoring events.
- ipsilateral breast recurrence, local chest wall recurrence and regional recurrence is ignored, i.e., not considered either as an event or a censoring event.
- a panel of genes potentially involved in metabolism or clearance of estrogen or in other aspects of cancer pathophysiology was compiled based on published literature. Analysis of 82 genes selected from this panel or potentially useful as reference genes and listed in Table 5 was carried out using quantitative RT-PCR. For certain of the genes, multiple probe primer sets targeted to distinct gene sequences were utilized. Gene names and primer and probe sequences used to quantify transcript expression are listed in Table 6.
- RNA extracted from a FPET sample was amplified using commercially available RNA amplification kits and protocols (Genisphere).
- Expression levels of test and reference genes listed in Table 5 were reported as (C T ) values from the qRT-PCR assay (TaqMan®). Based on the relative invariability of their measured expression in study samples and on the lack of observed correlation between their measured expression and clinical outcome, CDHl, TBP, EPHXl 5 SERPINEl and CD68 were chosen as reference genes.
- Test gene expression values were normalized relative to the mean of these reference genes. Reference-normalized expression measurements typically range from 0 to 15, where a one unit increase generally reflects a 2-fold increase in RNA quantity.
- GPX2 also encodes a selenium-dependent glutathione peroxidase and is one of two isoenzymes responsible for the majority of the glutathione-dependent hydrogen peroxide- reducing activity in the epithelium of the gastrointestinal tract. Studies in knockout mice indicate that mRNA expression levels respond to luminal microflora, suggesting a role of GPX2 in preventing inflammation in the GI tract.
- PRDX3 peroxiredoxin 3
- PRDX3 is a member of a gene family that is responsible for regulation of cellular proliferation, differentiation, and antioxidant functions.
- CRYZ encodes the major detoxifying enzyme quinone reductase (QR) [NAD(P)H:quinone oxidoreductase].
- QR quinone reductase
- CRYZ is transcriptionally activated by anti-estrogen liganded ER ⁇ .
- Up-regulation of QR either by overexpression or induction by tamoxifen, can protect breast cells against oxidative DNA damage caused by estrogen metabolites, ' representing a possible novel mechanism of tamoxifen prevention against breast cancer.
- Assays are ordered by p-value, with p-values ⁇ 0.05 considered significant. Specimens from 125 breast cancer patients were assayed.
- cytochrome P450 proteins are monooxygenases which catalyze many reactions involved in drug metabolism and synthesis of cholesterol, steroids and other lipids. Two of the five cytochrome P450 superfamily members tested were also significant indicators of positive prognosis.
- NATl a xenobiotic-metabolizing enzyme
Abstract
The invention concerns genes that have been identified as being involved in estrogen metabolism, and are useful as diagnostic, prognostic and/or predictive markers in cancer. In particular, the invention concerns genes the tumor expression levels of which are useful in the diagnosis of cancers associated with estrogen metabolism, and/or in the prognosis of clinical outcome and/or prediction of drug response of such cancers.
Description
GENES INVOLVED IN ESTROGEN METABOLISM
Field of the Invention
[0001] The present invention concerns genes that have been identified as being involved in estrogen metabolism, and are useful as diagnostic, prognostic and/or predictive markers in cancer. In particular, the present invention concerns genes the tumor expression levels of which are useful in the diagnosis of cancers associated with estrogen metabolism, and/or in the prognosis of clinical outcome and/or prediction of drug response of such cancers.
Description of the Related Art Gene expression studies
[0002] Oncologists regularly confront treatment decisions regarding whether a cancer patient should receive treatment and, if so, what treatment to choose. These oncologists typically have a number of treatment options available to them, including different combinations of chemotherapeutic drugs that are characterized as "standard of care." Because these "standard of care" chemotherapeutic drugs such as cyclophosphamide, methotrexate, 5-fluorouraciI, anthracyclines, taxanes, have limited efficacy and a spectrum of often severe side effects, it is important to identify those patients having the highest likelihood of a positive clinical outcome without chemotherapy (patients with good prognosis) in order to minimize unnecessary exposure of these patients to the toxic side effects of the chemotherapeutic agents.
[0003] For those patients with a poor prognosis it is then important to predict the likelihood of beneficial response in individual patients to particular chemotherapeutic drug regimens. Identification of those patients most likely to benefit from each available treatment will enhance the utility of "standard of care" treatments, and facilitate the development of further, more personalized treatment options, including the use of already approved drugs that had previously not been recommended for the treatment of a particular cancer. The identification of patients who are more likely or less likely to need and respond to available drugs thus could increase the net benefit these drugs have to offer and decrease net morbidity and toxicity, via more intelligent patient selection.
[0004] Most diagnostic tests currently used in clinical practice are single analyte, and therefore do not capture the potential value of knowing relationships between dozens of different markers. Moreover, diagnostic tests are often based on immunohistochemistry, which is not quantitative. Immunohistochemistry often yields different results in different laboratories, in part because the reagents are not standardized, and in part because the interpretations are subjective. RNA-based tests, while potentially highly quantitative, have not been used because of the perception that RNA is destroyed in tumor specimens as routinely prepared, namely fixed in formalin and embedded in paraffin (FPE), and because it is inconvenient to obtain and store fresh tissue samples from patients for analysis.
[0005] Over the last two decades molecular biology and biochemistry have revealed hundreds of genes whose activities influence the behavior of tumor cells, their state of differentiation, and their sensitivity or resistance to certain therapeutic drugs. However, with a few exceptions, the status of these genes has not been exploited for the purpose of routinely making clinical decisions about drug treatments. In the last few years, several groups have published studies concerning the classification of various cancer types by microarray gene expression analysis of thousands of genes (see, e.g. Golub et al., Science 286:531- 537 (1999); Bhattacharjae et al., Proc. Natl Acad. ScL USA 98:13790-13795 (2001); Chen-Hsiang et al., Bioinformatics 17 (Suppl. 1):S316-S322 (2001); Ramaswamy et al., Proc. Natl. Acad. ScL USA 98:15149-15154 (2001); Martin et al., Cancer Res. 60:2232-2238 (2000); West et al., Proc. Natl Acad. ScL USA 98:11462-114 (2001); Sorlie et al., Proc. Natl. Acad. ScL USA 98:10869-10874 (2001); Yan et al., Cancer Res. 61 :8375-8380 (2001)). However, these studies have not yet yielded tests routinely used in clinical practice, in large part because mϊcroarrays require fresh or frozen tissue RNA and such specimens are not present in sufficient quantity to permit clinical validation of identified molecular signatures.
[0006] In the past three years, it has become possible to profile gene expression of hundreds of genes in formalin-fixed paraffin-embedded (FPE) tissue using RT-PCR technology. Methods have been described that are highly sensitive, precise, and reproducible (Cronin et al., Am. J. Pathol 164:35-42 (2004); PCT Publication No. WO 2003/078,662; WO 2004/071,572; WO 2004/074,518; WO 2004/065,583; WO 2004/111,273; WO 2004/111,603; WO
2005/008,213; WO 2005/040,396; WO 2005/039,382; WO 2005/064,019. the entire disclosures of which are hereby expressly " incorporated by reference). Because thousands of archived FPE clinical tissue specimens exist with associated clinical records, such as survival, drug treatment history, etc., the ability to now quantitatively assay gene expression in this type of tissue enables rapid clinical studies relating expression of certain genes to patient prognosis and likelihood of response to treatments. Using data generated by past clinical studies allows for rapid results because the clinical events are historical. In contrast, for example, if one wished to carry out a survival study on newly recruited cancer patients one would generally need to wait for many years for statistically sufficient numbers of deaths to have occurred.
Breast cancer prognosis and prediction
[0007] Breast cancer is the most common type of cancer among women in the United States, and is the leading cause of cancer deaths among women between the ages of 40 and 59.
[0008] Because current tests for prognosis and for prediction of chemotherapy response are inadequate, breast cancer treatment strategies vary between oncologists (Schott and Hayes, J. Clin. Oncol. PMID 15505274 (2004); Hayes, Breast 12:543-9 (2003)). The etiology of certain types of human breast cancer involves certain steroid hormones, called estrogens. Estrogens are believed to cause proliferation of breast epithelial cells primarily via binding of hormones to estrogen receptors, resulting in modification of the cellular transcription program. For these reasons, one of the most commonly used markers in selecting a treatment option for breast cancer patients is the estrogen receptor 1 (ESRl). Estrogen receptor-positive (ESR1+) tumors are generally less aggressive than estrogen receptor negative (ESRl-) tumors, and can often be successfully treated with anti-estrogens such as tamoxifen (TAM). Conversely, ESRl- tumors are typically more aggressive and are resistant to anti-estrogen treatment. Thus, aggressive chemotherapy is often provided to patients for ESRl- tumors. Based on this simple understanding, assays for ESRl levels by immunohistochemistry are currently utilized as one parameter for making treatment decisions in breast cancer. Generally, lymph node negative patients whose tumors are found to be ESRl positive are treated with an anti-estrogen drug, such as tamoxifen (TAM), and patients whose tumors are found to be ESRl
negative are treated with chemotherapy. However, often because of the uncertainty in the currently used diagnostic procedures, ESRl positive patients are also prescribed chemotherapy in addition to anti-estrogen therapy, accepting the toxic side effects of chemotherapy in order to modestly decrease the risk of cancer recurrence. Toxicities include, neuropathy, nausea and other gastrointestinal symptoms, hair loss and cognitive impairment. Recurrence is to be feared because recurrent breast cancer is usually metastatic and poorly responsive to treatment.
[0009] The human GSTM (GSTμ) gene family consists of five different closely related isotypes, GSTM1-GSTM5. GSTM proteins conjugate glutathione to various electrophilic small molecules, facilitating clearance of the electrophiles from cells. Evidence exists that several metabolites of estrogen, including estrogen semi-quinones and estrogen quinones (catechol estrogens), are toxic and mutagenic (Cavalieri et al.Proc Natl Acad Sd 94:10937-42,1997). The activity of one or more GSTM enzymes may limit mutational damage caused by these estrogen metabolites.
[0010] We have reported five independent clinical studies in which GSTM gene expression was examined by quantitative RT-PCR in formalin-fixed, paraffin embedded primary breast cancer tissues. GSTM expression correlated strongly with favorable clinical outcome in each of these studies (Esteban et al., Prog. Proc Am Soc. Clin. Oncol 22:850 abstract, 2003; Cobleigh et al, Clin Cancer Res (in press); Paik et al., Breast Cancer Res. Treat. 82.-A16 abstract, 2003; Habel et al, Breast Cancer Res. Treat. 88:3019 abstract, 2004: Paik et al, N EnglJ Med 35V.2U7-26, 2004).
[0011] In these studies the probe used could not discriminate between GSTMl and several other GSTM family members as a result of the strong sequence similarity of the GSTM genes, amplicon size limitations and the stringent sequence criteria for probe-primer design, leaving the possibility that several of the GSTM genes may be favorable markers.
[0012] Clearly, a need exists to identify those patients who are at substantial risk of cancer recurrence (i.e., to provide prognostic information) and/or likely to respond to chemotherapy (i.e., to provide predictive information). Likewise, a need exists to identify those patients who do not have a significant
risk of recurrence, and/or who are unlikely to respond to chemotherapy, as these patients should be spared needless exposure to these toxic drugs.
Summary of the Invention
[0013] The present invention is based, at least in part, on the recognition that since estrogens may contribute to tumorigenesis and tumor progression via pathways that are ESRl independent, treatment decisions based primarily or solely on the ESRl status of a patient are unsatisfactory.
[0014] One aspect of the invention is directed to a method of predicting clinical outcome for a subject diagnosed with cancer, comprising determining evidence of the expression level of one or more predictive RNA transcripts listed in Table 8, or their expression products, in a biological sample comprising cancer cells obtained from said subject, wherein evidence of increased expression of one or more of the genes listed in Table 8, or the corresponding expression product, indicates a decreased likelihood of a positive clinical outcome. In one embodiment the subject is a human patient. In one embodiment the expression level is obtained by a method of gene expression profiling. In one embodiment the method of gene expression profiling is a PCR-based method. In one embodiment the expression levels are normalized relative to the expression levels of one or more reference genes, or their expression products. In one embodiment the clinical outcome is expressed in terms of Recurrence-Free Interval (RFI), Overall Survival (OS), Disease-Free Survival (DFS), or Distant Recurrence-Free Interval (DRFI). In one embodiment the cancer is selected from the group consisting of breast cancer or ovarian cancer. In one embodiment the cancer is breast cancer.
[0015] In one embodiment, the method of predicting clinical outcome for a subject diagnosed with cancer comprises determining evidence of the expression level of at least two of said genes, or their expression products. In another embodiment, the expression levels of at least three of said genes, or their expression products are determined. In yet another embodiment, the expression levels of at least four of said genes, or their expression products are determined. In a further embodiment, the expression levels of at least five of said genes, or their expression products are determined.
[0016] The method may further comprise the step of creating a report summarizing said prediction.
[0017] Another aspect of the invention is a method of predicting the duration of Recurrence-Free Interval (RFI) in a subject diagnosed with breast cancer, comprising determining the expression level of one or more predictive RNA transcripts listed in Table 8 or their expression products, in a biological sample comprising cancer cells obtained from said subject, wherein evidence of increased expression of one or more of the genes listed in Table 8, or the corresponding expression product, indicates that said RFI is predicted to be shorter. In one embodiment the subject is a human patient. In another aspect the expression level is obtained by a method of gene expression profiling. In one embodiment the method of gene expression profiling is a PCR-based method. In one embodiment the expression levels are normalized relative to the expression levels of one or more reference genes, or their expression products. In one embodiment the clinical outcome is expressed in terms of Recurrence-Free Interval (RFI), Overall Survival (OS), Disease-Free Survival (DFS), or Distant Recurrence-Free Interval (DRFI). In one embodiment the cancer is selected from the group consisting of breast cancer or ovarian cancer. In one embodiment the cancer is breast cancer.
[0018] One aspect of the method of predicting the duration of Recurrence-Free Interval (RFI) for a subject diagnosed with cancer, comprises determining evidence of the expression level of at least two of said genes, or their expression products. In one embodiment the expression levels of at least three of said genes, or their expression products are determined. In another embodiment the expression levels of at least four of said genes, or their expression products are determined. . In another embodiment the expression levels of at least five of said genes, or their expression products are determined.
[0019] One aspect of the methods of this invention is that if the RFI is predicted to be shorter, said patient is subjected to further therapy following surgical removal of the cancer. In one aspect, the therapy is chemotherapy and/or radiation therapy,
[0020] One aspect of the methods of this invention is that the expression level of one or more predictive RNA transcripts or their expression products of one or more genes selected from the group consisting of CAT, CRYZ, CYP4Z1, CYP17A1, GPXl, GPX2, GSTMl, GSTM2, GSTM3, GSTM4, GSTM5, GSTPl, NQOl, PRDX3, and SC5DL is determined.
[0021] One aspect of the methods of this invention is that the expression level of one or more predictive RNA transcripts or their expression products of one or more genes selected from the group consisting of GSTMl, GSTM2, GSTM3, GSTM4, GSTM5 and GSTPl is determined.
[0022] One aspect of the methods of this invention is that the expression level of one or more predictive RNA transcripts or their expression products of one or more genes selected from the group consisting of GSTM2 and GSTM4 is determined.
[0023] One aspect of the methods of this invention is that the expression level of one or more predictive RNA transcripts or their expression products of one or more genes selected from the group consisting of GSTMl and GSTM3 is determined.
[0024] One aspect of the methods of this invention is that the expression level of one or more predictive RNA transcripts or their expression products of one or more genes selected from the group consisting of CAT, PRDX3, GPXl, and GPX2 is determined.
[0025] One aspect of the methods of this invention is that the expression level of one or more predictive RNA transcripts or their expression products of one or more genes selected from the group consisting of PRDX3, GPXl and GPX2 is determined.
[0026] One aspect of the methods of this invention is that the expression level of one or more predictive RNA transcripts or their expression products of one or more genes selected from the group consisting of GPXl and GPX2 is determined.
[0027] One aspect of the methods of this invention is that the expression level of one or more predictive RNA transcripts or their expression products of one or more genes selected from the group consisting of CRYZ and NQOl is determined.
[0028] One aspect of the methods of this invention is that the expression level of one or more predictive RNA transcripts or their expression products of CYP 17Al is determined.
[0029] One aspect of the methods of this invention is that the expression level of one or more predictive RNA transcripts or their expression
products of one or more genes selected from the group consisting of SC5DL and CYP4Z1 is determined.
[0030] In another aspect, this invention concerns a method for preparing a personalized genomics profile for a patient comprising the steps of
(a) subjecting RNA extracted from a tissue obtained from the patient to gene expression analysis;
(b) determining the expression level in the tissue of one or more genes selected from the gene set listed in Table 8 , wherein the expression level is normalized against a control gene or genes and optionally is compared to the amount found in a cancer reference set and
(c) creating a report summarizing the data obtained by said gene expression analysis.
[0031] Another embodiment of this invention is a method for amplification of a gene listed in Table 8 by polymerase chain reaction (PCR) comprising performing said per by using amplicons listed in Table 7 and a primer-probe set listed in Table 6.
[0032] Another embodiment of this invention is a PCR primer-probe set listed in Table 6.
[0033] Another embodiment of this invention is a PCR amplicon listed in Table 7.
Brief Description of the Figures and Tables
[0034] Figure 1 shows the sequence alignment of the GSTMl and GSTM2 amplicons with the corresponding regions of other GSTM family members.
[0035] Figure 2 shows the distribution of RT-PCR signals as CT values (X-axis) across the 125 breast cancer patients (Y-axis) for GSTM 1.1, GSTMl int5.2 and GSTM2int4.2.
[0036] Figure 3 shows the distribution of RT-PCR signals as CT values for 22 human subjects for the different GSTM amplicons.
[0037] Figure 4 shows the similarity and chromosome location of the GSTM genes.
[0038] Figure 5 shows the cellular pathways which are the possible basis for the correlation of GSTM expression with good outcome.
[0039] Figure 6 shows specific pathways for the degradation, modification and clearance of key estrogens, estrone and estradiol.
[0040] Figure 7 shows specific pathways for the synthesis of key estrogens, estrone and estradiol, from cholesterol.
Detailed Description of the Preferred Embodiment A. Definitions
[0041] Unless defined otherwise, technical and scientific terms used herein have the same meaning as commonly understood by one of ordinary skill in the art to which this invention belongs. Singleton et al., Dictionary of Microbiology and Molecular Biology 2nd ed., J. Wiley & Sons (New York, NY 1994); and Webster's New World™ Medical Dictionary, 2nd Edition, Wiley Publishing Inc., 2003, provide one skilled in the art with a general guide to many of the terms used in the present application. For purposes of the present invention, the following terms are defined below.
[0042] The term RT-PCR has been variously used in the art to mean reverse-transcription PCR (which refers to the use of PCR to amplify mRNA by first converting mRNA to double stranded cDNA) or real-time PCR (which refers to ongoing monitoring in 'real-time' of the amount of PCR product in order to quantify the amount of PCR target sequence initially present. The term "RT- PCR' means reverse transcription PCR. The term quantitative RT-PCR (qRT- PCR) means real-time PCR applied to determine the amount of mRNA initially present in a sample.
[0043] The term "clinical outcome" means any measure of patient status including those measures ordinarily used in the art, such as disease recurrence, tumor metastasis, overall survival, progression-free survival, recurrence-free survival, and distant recurrence-free survival. Distant recurrence- free survival (DRFS) refers to the time (in years) from surgery to the first distant recurrence.
[0044] The term "microarray" refers to an ordered arrangement of hybridizable array elements, preferably polynucleotide probes, on a substrate.
[0045] The term "polynucleotide," when used in singular or plural, generally refers to any polyribonucleotide or polydeoxribonucleotide, which may be unmodified RNA or DNA or modified RNA or DNA. Thus, for instance, polynucleotides as defined herein include, without limitation, single- and double- stranded DNA, DNA including single- and double-stranded regions, single- and double-stranded RNA, and RNA including single- and double-stranded regions, hybrid molecules comprising DNA and RNA that may be single-stranded or, more typically, double-stranded or include single- and double-stranded regions. In addition, the term "polynucleotide" as used herein refers to triple-stranded regions comprising RNA or DNA or both RNA and DNA. The strands in such regions may be from the same molecule or from different molecules. The regions may include all of one or more of the molecules, but more typically involve only a region of some of the molecules. One of the molecules of a triple-helical region often is an oligonucleotide. The term "polynucleotide" specifically includes cDNAs. The term includes DNAs (including cDNAs) and RNAs that contain one or more modified bases. Thus, DNAs or RNAs with backbones modified for stability or for other reasons are "polynucleotides" as that term is intended herein. Moreover, DNAs or RNAs comprising unusual bases, such as inosine, or modified bases, such as tritiated bases, are included within the term "polynucleotides" as defined herein. In general, the term "polynucleotide" embraces all chemically, enzymatically and/or metabolically modified forms of unmodified polynucleotides, as well as the chemical forms of DNA and RNA characteristic of viruses and cells, including simple and complex cells.
[0046] The term "oligonucleotide" refers to a relatively short polynucleotide, including, without limitation, single-stranded deoxyribonucleotides, single- or double-stranded ribonucleotides, RNAtDNA hybrids and double-stranded DNAs. Oligonucleotides, such as single-stranded DNA probe oligonucleotides, are often synthesized by chemical methods, for example using automated oligonucleotide synthesizers that are commercially available. However, oligonucleotides can be made by a variety of other methods, including in vitro recombinant DNA-mediated techniques and by expression of DNAs in cells and organisms.
[0047] The term "gene expression" describes the conversion of the DNA gene sequence information into transcribed RNA (the initial unspliced RNA transcript or the mature mRNA) or the encoded protein product. Gene expression
can be monitored by measuring the levels of either the entire RNA or protein products of the gene or subsequences.
[0048] The phrase "gene amplification" refers to a process by which multiple copies of a gene or gene fragment are formed in a particular cell or cell line. The duplicated region (a stretch of amplified DNA) is often referred to as "amplicon." Often, the amount of the messenger RNA (mRNA) produced, i.e., the level of gene expression, also increases in the proportion of the number of copies made of the particular gene expressed.
[0049] Prognostic factors are those variables related to the natural history of breast cancer, which influence the recurrence rates and outcome of patients once they have developed breast cancer. Clinical parameters that have been associated with a worse prognosis include, for example, lymph node involvement, increasing tumor size, and high grade tumors. Prognostic factors are frequently used to categorize patients into subgroups with different baseline relapse risks. In contrast, treatment predictive factors are variables related to the likelihood of an individual patient's beneficial response to a treatment, such as anti-estrogen or chemotherapy, independent of prognosis.
[0050] The term "prognosis" is used herein to refer to the likelihood of cancer-attributable death or cancer progression, including recurrence and metastatic spread of a neoplastic disease, such as breast cancer, during the natural history of the disease. Prognostic factors are those variables related to the natural history of a neoplastic diseases, such as breast cancer, which influence the recurrence rates and disease outcome once the patient developed the neoplastic disease, such as breast cancer. In this context, "natural outcome" means outcome in the absence of further treatment. For example, in the case of breast cancer, "natural outcome" means outcome following surgical resection of the tumor, in the absence of further treatment (such as, chemotherapy or radiation treatment). Prognostic factors are frequently used to categorize patients into subgroups with different baseline risks, such as baseline relapse risks.
[0051] The term "prediction" is used herein to refer to the likelihood that a patient will respond either favorably or unfavorably to a drug or set of drugs, and also the extent of those responses. Thus, treatment predictive factors are those variables related to the response of an individual patient to a specific treatment, independent of prognosis. The predictive methods of the present
invention can be used clinically to make treatment decisions by choosing the most appropriate treatment modalities for any particular patient. The predictive methods of the present invention are valuable tools in predicting if a patient is likely to respond favorably to a treatment regimen, such as anti-estrogen therapy, such as TAM treatment alone or in combination with chemotherapy and/or radiation therapy.
[0052] The term "long-term" survival is used herein to refer to survival for at least 3 years, more preferably for at least 8 years, most preferably for at least 10 years following surgery or other treatment.
[0053] The term "tumor," as used herein, refers to all neoplastic cell growth and proliferation, whether malignant or benign, and all pre-cancerous and cancerous cells and tissues.
[0054] The terms "cancer" and "cancerous" refer to or describe the physiological condition in mammals that is typically characterized by unregulated cell growth. Examples of cancer include, but are not limited to, breast cancer, ovarian cancer, colon cancer, lung cancer, prostate cancer, hepatocellular cancer, gastric cancer, pancreatic cancer, cervical cancer, liver cancer, bladder cancer, cancer of the urinary tract, thyroid cancer, renal cancer, carcinoma, melanoma, and brain cancer.
[0055] The "pathology" of cancer includes all phenomena that compromise the well-being of the patient. This includes, without limitation, abnormal or uncontrollable cell growth, metastasis, interference with the normal functioning of neighboring cells, release of cytokines or other secretory products at abnormal levels, suppression or aggravation of inflammatory or immunological response, neoplasia, premalignancy, malignancy, invasion of surrounding or distant tissues or organs, such as lymph nodes, etc.
[0056] In the context of the present invention, reference to "at least one," "at least two," "at least three," "at least four," "at least five," etc. of the genes listed in any particular gene set means any one or any and all combinations of the genes listed.
[0057] The term "node negative" cancer, such as "node negative" breast cancer, is used herein to refer to cancer that has not spread to the lymph nodes.
[0058] The terms "splicing" and "RNA splicing" are used interchangeably and refer to RNA processing that removes introns and joins exons to produce mature mRNA with continuous coding sequence that moves into the cytoplasm of an eukaryotic cell.
[0059] In theory, the term "exon" refers to any segment of an interrupted gene that is represented in the mature RNA product (B. Lewin. Genes IV CQW Press, Cambridge Mass. 1990). In theory the term "intron" refers to any segment of DNA that is transcribed but removed from within the transcript by splicing together the exons on either side of it. Operationally, exon sequences occur in the mRNA sequence of a gene as defined by Ref. SEQ ID numbers. Operationally, intron sequences are the intervening sequences within the genomic DNA of a gene, bracketed by exon sequences and having GT and AG splice consensus sequences at their 5' and 3' boundaries.
B. Detailed Description
[0060] The practice of the present invention will employ, unless otherwise indicated, conventional techniques of molecular biology (including recombinant techniques), microbiology, cell biology, and biochemistry, which are within the skill of the art. Such techniques are explained fully in the literature, such as, "Molecular Cloning: A Laboratory Manual", 2nd edition (Sambrook et al., 1989); "Oligonucleotide Synthesis" (M.J. Gait, ed., 1984); "Animal Cell Culture" (R.I. Freshney, ed., 1987); "Methods in Enzymology" (Academic Press, Inc.); "Handbook of Experimental Immunology", 4th edition (D.M. Weir & CC. Blackwell, eds., Blackwell Science Inc., 1987); "Gene Transfer Vectors for Mammalian Cells" (J.M. Miller & M.P. Calos, eds., 1987); "Current Protocols in Molecular Biology" (F.M. Ausubel et al., eds., 1987); and "PCR: The Polymerase Chain Reaction", (MuIHs et al., eds., 1994). The practice of the present invention will also employ, unless otherwise indicated, conventional techniques of statistical analyis such as the Cox Proportional Hazards model (see, e.g. Cox, D. R., and Oakes, D. (1984), Analysis of Survival Data, Chapman and Hall, London, New York). Such techniques are explained fully in the literature.
B.I. General Description of the Invention
[0061] As discussed before, the present invention is based, at least in part, on the recognition that since estrogens may contribute to tumorigenesis and
tumor progression via pathways that are ESRl independent, treatment decisions based primarily or solely on the ESRl status of a patient are unsatisfactory.
Estrogen Metabolism
[0062] It is known that certain pathways of estrogen degradation involve the production of electrophilic estrogen metabolites as well as reactive oxygen species (ROS), both of which have the potential to damage cellular DNA and thus contribute to carcinogenesis (Cavalieri et al., Cell. MoI. Life Sci. 59: 665- 81 (2002); Thompson and Ambrosone, J.Natl.Cancer Inst. 27: 125-34 (2000)).
[0063] The present invention is based on the identification of genes that are believed to be involved in the metabolism and/or clearance of estrogen, and thus in the control of intracellular concentration of electrophilic estrogen metabolites. In a specific embodiment, gene specific probe primer sets were designed based on the exon and introns sequences of the genes identified. These probe primer sets may be used in conjuction with a variety of clinical samples to identify particular genes within the estrogen metabolism group which are prognostic of outcome in a particular type of cancer and/or have predictive value in determining patient response to a particular treatment modality.
[0064] Estrogens, including the principle active hormones, estrone and estradiol, can be converted to catechol estrogens (CE) via either 2-hydroxylation by cytochrome P4501A1 (CYPlAl) or via 4-hydroxyIation by cytochrome P4501B1 (CYPlBl). These catechol estrogens (CE) can be further metabolized to CE semiquinones and then to CE quinones, which compounds are electrophiles and are proven or potential mutagens. (Mitrunen and Hirvonen, Mutation Research, 544: 9-41 (2003); Lieher, Endocrine Reviews, 21:40-54 (2000)). Furthermore, concomitant with the conversion of estrogen semiquinones to estrogen quinones, molecular oxygen is converted to highly reactive superoxide anion, which also can damage DNA.
[0065] The presence of electrophilic estrogen metabolites and reactive oxygen species could cause mutations in normal cells over time, resulting in tumorigenesis and could further cause new mutations in existing tumor cells that may be already compromised in their ability to repair damage to their DNA. The resulting increased burden of mutations could result in emergence of more aggressive clones in the tumor, more tumor aneuploidy and heterogeneity, with negative consequences for the health of the patient. Cellular metabolic strategies

that would minimize the formation of mutagenic estrogen metabolites or increase the efficiency of their removal via conversion or clearance would then minimize mutagenic effects and result in more favorable prognosis.
[0066] Although a number of studies have been carried out to determine the effect on breast cancer predisposition risk of allelic variation in estrogen metabolizing genes, little has been done regarding the potential effect on cancer predisposition or prognosis, of expression levels of the various genes that affect cellular levels of mutatgenic estrogen metabolites.
[0067] One alternative to the cateechol/quinone pathway discussed above is the conversion, by the enzyme cathecol-O-methyl transferase (COMT), of estrogen catechols to 2-methoxy and 4-methoxy estrogens, compounds that are much less reactive than the quinones and more readily cleared from the cell.
[0068] Mutagenic catechol estrogen quinones can be converted back to catechol estrogens through the action of a NADPH-dependent quinone reductase (CRYZ)3 making them re-available for metabolism via COMT.
[0069] Direct clearance of both CE semiquinones and CE quinones can be initiated by conjugation of the metabolites with glutathione catalyzed by glutathione-S-transferase (GST) enzymes. The GST protein family includes GST mu enzymes (GSTMl, GSTM2, GSTM3, GSTM4 and GSTM5),.GST pi enzyme GSTPl and GST theta enzyme GSTTl. In addition to the above enzymes, membrane-associated glutathione-S-transferase enzymes that catalyze the conjugation of glutathione to electrophiles, including MGSTl and MGST3, have been identified. Membrane-associated glutathione-S-transferase may also catalyze the reduction of lipid hydroperoxides (see below).
[0070] Glutathione, required by GST enzymes, is a ^tripeptide synthesized from amino acids in a process the rate-limiting step of which is catalyzed by gamma-glutamylcysteine synthetase, an enzyme composed of a catalytic subunit (GCLC) and a regulatory subunit (GCLM) that are endoded by separate genes.
[0071] Various other metabolites arising from the synthesis and degradation of estrogens are further modified by enzymatic sulfation or glucuronidation as a prerequisite for their clearance from the cell. Variation in the levels of the enzymes that carry out these modifications may shift the intracellular concentrations of estrogen and its electrophilic metabolites. For example,
SULTlEl is a member of the sulfotransferase family that preferentially sulfates estrone at the 3 position in a detoxification and clearance step. Another family of proteins, the UDP-glucuronosyltransferases (UGTs), participates in the clearance of a wide variety of compounds, and includes UGTl A3 and UGT2b7, the substrates of which include estrone and 2-hydroxyestrone.
[0072] The forward and reverse conversion between catechol estrogens and catechol estrogen quinones establishes the possibility of redox cycling, which results in continuous generation of superoxide anion (O2 ") Cells have established strategies for detoxification of O2" produced by estrogen metabolism and other cellular processes. O2 " is initially converted to molecular oxygen (O2) + hygrogen peroxide (H2O2), another ROS5 by a superoxide dismutase (SOD), which occur in cytoplamic (SODl), mitochondrial (SOD2), and extracellular (SOD3) forms. The H202 produced by superoxide dismutase is further metabolized to H2O2 and molecular oxygen by catalase (CAT). The various enzymes of the peroxiredoxin family, including peroxiredoxins 2,3,4 and 6 (PRDX2, PRDX3, PRDX4 and PRDX6) also catalyze the iπactivation Of H2O2 as well as the reduction of organic hydroperoxides that may have been generated in the presence of ROS. Glutathione peroxidases (GPXl and GPX2) are also involved in the detoxification of H2O2. Allelic variants of GPXl have been associated with breast cancer risk (Knight et al., Cancer Epidemiol. Biomarkers Prev. 13: 146-9 (2004).
[0073] Hydrogen peroxide, in the presence of certain transition metal ions, gives rise to hydroxide ions, which not only can damage DNA directly but can also initiate lipid peroxidation, giving rise to lipid hydroperoxides. These lipid hydroperoxides are believed to accelerate the conversion of catechol estrogen to semiquinones and quinones by cytochrome P450 (Cavalieri CMLS), thus amplifying the production of electrophilic estrogen metabolites. Both peroxiredoxins (in addition to inactivating H202) and membrane-associated glutathione-S-transferases (in addition to conjugating glutathione to electrophilic estrogen metabolites) can catalyze the reduction of organic hydroperoxides by the action of ROS and therefore slow the procution of CE semiquinones and CE quinines.
[0074] The concentration of estrogen metabolites is affected by the rate estrogen synthesis as well as the routes and rates of degradation and
clearance. Estrogen is synthesized from cholesterol via a complex series of reactions. Cholesterol is first metabolized in C21 steroid metabolism pathways to pregnenolone. As shown in Figure 7, pregnenolone is then converted to androst- 4-ene-3,17-dione by the action of a 3β-hydroxysteroid dehydrogenase and a cytochrome P450 (CYP17A1) in either order. Androst-4-ene-3,17-dione then gives rise to the key estrogens, estrone and estradiol through the sequential actions of a 17β -hydroxysteroid dehydrogenase (HSD 17Bl, HSD17B2, and HSD17B4) and the cytochrome P450 enzyme, aromatase (CYP19A1) in either order. Both estrone and estradiol are subject to the degradation processes discussed above.
[0075] Entry of estrogen precursors into the estrogen synthesis pathway can be limited by the alternate conversion of pregnenolone to progesterone and then to 20α-hydroxyprogesterone by 20α-hydroxysteroid dehydrogenase (AKR1C3), reducing the amount of androst-4-ene-3,17-dione available for conversion to estrogens.
The Invention
[0076] The present invention takes the novel approach of measuring the mRNA expression level of numerous genes that can affect the cellular concentration of mutagenic estrogen metabolites at equilibrium, and identifying markers of predisposition and prognosis in cancer the pathogenesis of which involves estrogen metabolism, such as breast cancer.
[0077] In particular, quantitative gene expression analysis performed in accordance with the present invention resulted in the identification of molecular indicators of prognosis in cancer. Based on analysis of the relationship between gene expression in the sample set and DRPS, a set of genes has been identified, the expression levels of which are indicative of outcome after tumor resection and any accompanying therapy with tamoxifen and/or adjuvant chemotherapy. Outcome may be manifest in various measurements including survival, recurrence-free survival and distant recurrence-free survival (DRPS), all of which are within the scope of the invention.
[0078] The genes identified in accordance with the present invention, or any gene group formed by particular combination of such genes can be used
PC17US20<
alone, or can be used together with one or more further diagnostic, prognostic and/or predictive indicators. Other diagnostic, prognostic and predictive indicators may include the expression of other genes or gene groups and may also include clinical variables including tumor size, stage and grade. Other diagnostic, prognostic or predictive indicators specifically include, individually or in any combination, the genes and genes sets disclosed in any of the following PCT Publications: WO 2003/078,662; WO 2004/071,572; WO 2004/074,518; WO 2004/065,583; WO 2004/111,273; WO 2004/111,603; WO 2005/008,213; WO 2005/040,396; WO 2005/039,382; WO 2005/064,019.
[0079] Alone or in combination with other cancer markers, such as diagnostic, prognostic and/or predictive indicators, the genes and gene groups of the present invention can be used to calculate Recurrence Score, an aggregate indication, based on multiple prognostic indicators, of the likelihood of a particular clinical outcome and/or drug responsiveness. Thus, for example, for an individual patient it is possible to provide a quantitative estimate of likelihood of outcome. This information can be utilized by the patient and treating physicians to make treatment decisions, in particular decisions regarding whether or not to treat the patient with drugs that lead to appreciable adverse events.
[0080] In various embodiments of the inventions, various technological approaches are available for determination of expression levels of the disclosed genes, including, without limitation, RT-PCR, microarrays, serial analysis of gene expression (SAGE) and Gene Expression Analysis by Massively Parallel Signature Sequencing (MPSS), which will be discussed in detail below. In particular embodiments, the expression level of each gene may be determined in relation to various features of the expression products of the gene including exons, introns, protein epitopes and protein activity. In other embodiments, the expression level of a gene may be inferred from analysis of the structure of the gene, for example from the analysis of the methylation pattern of gene's promoter(s).
B.2 Gene Expression Profiling
[0081] In general, methods of gene expression profiling can be divided into two large groups: methods based on hybridization analysis of polynucleotides, and methods based on sequencing of polynucleotides. The most commonly used methods known in the art for the quantification of mRNA
expression in a sample include northern blotting and in situ hybridization (Parker & Barnes, Methods in Molecular Biology 106:247-283 (1999)); RNAse protection assays (Hod, Biotechniques 13:852-854 (1992)); and reverse transcription polymerase chain reaction (RT-PCR) (Weis et al, Trends in Genetics 8:263-264 (1992)). Alternatively, antibodies may be employed that can recognize specific duplexes, including DNA duplexes, RNA duplexes, and DNA-RNA hybrid duplexes or DNA-protein duplexes. Representative methods for sequencing- based gene expression analysis include Serial Analysis of Gene Expression (SAGE), and gene expression analysis by massively parallel signature sequencing (MPSS). a. Reverse Transcriptase PCR (TtT-PCR)
[0082] Of the techniques listed above, the most sensitive and most flexible quantitative method is RT-PCR, which can be used to compare mRNA levels in different sample populations, in normal and tumor tissues, with or without drug treatment, to characterize patterns of gene expression, to discriminate between closely related mRNAs, and to analyze RNA structure.
[0083] The first step is the isolation of mRNA from a target sample. The starting material is typically total RNA isolated from human tumors or tumor cell lines, and corresponding normal tissues or cell lines, respectively. Thus RNA can be isolated from a variety of primary tumors, including breast, lung, colon, prostate, brain, liver, kidney, pancreas, spleen, thymus, testis, ovary, uterus, etc., tumor, or tumor cell lines, with pooled DNA from healthy donors. If the source of mRNA is a primary tumor, mRNA can be extracted, for example, from frozen or archived paraffin-embedded and fixed (e.g. formalin-fixed) tissue samples.
[0084] General methods for mRNA extraction are well known in the art and are disclosed in standard textbooks of molecular biology, including Ausubel et al., Current Protocols of Molecular Biology. John Wiley and Sons (1997). Methods for RNA extraction from paraffin embedded tissues are disclosed, for example, in Rupp and Locker, Lab Invest. 56: A (1987), and De Andres et al., BioTechniques 18:42044 (1995). In particular, RNA isolation can be performed using purification kit, buffer set and protease from commercial manufacturers, such as Qiagen, according to the manufacturer's instructions. For example, total RNA from cells in culture can be isolated using Qiagen RNeasy mini-columns. Other commercially available RNA isolation kits include
MasterPure™ Complete DNA and RNA Purification Kit (EPICENTRE®, Madison, WI), and Paraffin Block RNA Isolation Kit (Ambion, Inc.). Total RNA from tissue samples can be isolated using RNA Stat-60 (Tel-Test). RNA prepared from tumor can be isolated, for example, by cesium chloride density gradient centrifugation.
[0085] As RNA cannot serve as a template for PCR, the first step in gene expression profiling by RT-PCR is the reverse transcription of the RNA template into cDNA, followed by its exponential amplification in a PCR reaction. The two most commonly used reverse transcriptases are avilo myeloblastosis virus reverse transcriptase (AMV-RT) and Moloney murine leukemia virus reverse transcriptase (MMLV-RT). The reverse transcription step is typically primed using specific primers, random hexamers, or oligo-dT primers, depending on the circumstances and the goal of expression profiling. For example, extracted RNA can be reverse-transcribed using a GeneAmp RNA PCR kit (Perkin Elmer, CA, USA), following the manufacturer's instructions. The derived cDNA can then be used as a template in the subsequent PCR reaction.
[0086] Although the PCR step can use a variety of thermostable DNA- dependent DNA polymerases, it typically employs the Taq DNA polymerase, which has a 5'-3' nuclease activity but lacks a 3'-5' proofreading endonuclease activity. Thus, TaqMan® PCR typically utilizes the 5'-nuclease activity of Taq or Tth polymerase to hydrolyze a hybridization probe bound to its target amplicon, but any enzyme with equivalent 5' nuclease activity can be used. Two oligonucleotide primers are used to generate an amplicon typical of a PCR reaction. A third oligonucleotide, or probe, is designed to detect nucleotide sequence located between the two PCR primers. The probe is non-extendible by Taq DNA polymerase enzyme, and is labeled with a reporter fluorescent dye and a quencher fluorescent dye. Any laser-induced emission from the reporter dye is quenched by the quenching dye when the two dyes are located close together as they are on the probe. During the amplification reaction, the Taq DNA polymerase enzyme cleaves the probe in a template-dependent manner. The resultant probe fragments disassociate in solution, and signal from the released reporter dye is free from the quenching effect of the second fluorophore. One molecule of reporter dye is liberated for each new molecule synthesized, and detection of the unquenched reporter dye provides the basis for quantitative interpretation of the data.
pcπus2θθ|
[0087] TaqMan® RT-PCR can be performed using commercially available equipment, such as, for example, ABI PRISM 7700™ Sequence Detection System™ (Perkin-Elmer-Applied Biosystems, Foster City, CA, USA)5 or Lightcycler (Roche Molecular Biochemicals, Mannheim, Germany). In a preferred embodiment, the 5' nuclease procedure is run on a real-time quantitative PCR device such as the ABI PRISM 7700™ Sequence Detection System™. The system consists of a thermocycler, laser, charge-coupled device (CCD), camera and computer. The system amplifies samples in a 96-well format on a thermocycler. During amplification, laser-induced fluorescent signal is detected at the CCD. The system includes software for running the instrument and for analyzing the data.
[0088] 5'-Nuclease assay data are initially expressed as Cτ, or the threshold cycle. As discussed above, fluorescence values are recorded during every cycle and represent the amount of product amplified to that point in the amplification reaction. The point when the fluorescent signal is first recorded as statistically significant is the threshold cycle (CT).
[0089] To minimize errors and the effect of sample-to-sample variation, RT-PCR is usually performed using one or more reference genes as internal standards. The ideal internal standard is expressed at a constant level among different tissues, and is unaffected by the experimental treatment. RNAs most frequently used to normalize patterns of gene expression are mRNAs for the housekeeping genes glyceraIdehyde-3-phosphate-dehydrogenase (GAPD) and β- actin (ACTB).
[0090] A more recent variation of the RT-PCR technique is real time quantitative RT-PCR (q RT-PCR), which measures PCR product accumulation through a dual-labeled fluorigenic probe (i.e., TaqMan® probe). Real time PCR is compatible both with quantitative competitive PCR, where internal competitor for each target sequence is used for normalization, and with quantitative comparative PCR using a normalization gene contained within the sample, or a housekeeping gene for RT-PCR. For further details see. e.g. Held et al, Genome Research 6:986-994 (1996).
[0091] The steps of a representative protocol for profiling gene expression using fixed, paraffin-embedded tissues as the RNA source, including mRNA isolation, purification, primer extension and amplification are given in
various published journal articles {for example: T.E. Godfrey et al. J. Molec. Diagnostics 2: 84-91 (2000); K. Spβcht et al., Am. J. Pathol. 158: 419-29 (2001); Cronin et al., Am J Pathol 164:35-42 (2004)}. Briefly, a representative process starts with cutting about 10 μm thick sections of paraffin-embedded tumor tissue samples. The RNA is then extracted, and protein and DNA are removed. After analysis of the RNA concentration, RNA repair and/or amplification steps may be included, if necessary, and RNA is reverse transcribed using gene specific promoters followed by RT-PCR. b. Microarrays
[0092] Differential gene expression can also be identified, or confirmed using the microarray technique. Thus, the expression profile of breast cancer-associated genes can be measured in either fresh or paraffin-embedded tumor tissue, using microarray technology. In this method, polynucleotide sequences of interest (including cDNAs and oligonucleotides) are plated, or arrayed, on a microchip substrate. The arrayed sequences are then hybridized with specific DNA probes from cells or tissues of interest. Just as in the RT-PCR method, the source of mRNA typically is total RNA isolated from human tumors or tumor cell lines, and corresponding normal tissues or cell lines. Thus RNA can be isolated from a variety of primary tumors or tumor cell lines. If the source of mRNA is a primary tumor, mRNA can be extracted, for example, from frozen or archived paraffin-embedded and fixed (e.g. formalin-fixed) tissue samples, which are routinely prepared and preserved in everyday clinical practice.
[0093] In a specific embodiment of the microarray technique, PCR amplified inserts of cDNA clones are applied to a substrate in a dense array. Preferably at least 10,000 nucleotide sequences are applied to the substrate. The microarrayed genes, immobilized on the microchip at 10,000 elements each, are suitable for hybridization under stringent conditions. Fluorescently labeled cDNA probes may be generated through incorporation of fluorescent nucleotides by reverse transcription of RNA extracted from tissues of interest. Labeled cDNA probes applied to the chip hybridize with specificity to each spot of DNA on the array. After stringent washing to remove non-specifically bound probes, the chip is scanned by confocal laser microscopy or by another detection method, such as a CCD camera. Quantitation of hybridization of each arrayed element allows for assessment of corresponding mRNA abundance. With dual color fluorescence,
_ . . . .,
PCT/US20QI mm iVϊά
separately labeled cDNA probes generated from two sources of RNA are hybridized pairwise to the array. The relative abundance of the transcripts from the two sources corresponding to each specified gene is thus determined simultaneously. The miniaturized scale of the hybridization affords a convenient and rapid evaluation of the expression pattern for large numbers of genes. Such methods have been shown to have the sensitivity required to detect rare transcripts, which are expressed at a few copies per cell, and to reproducibly detect at least approximately two-fold differences in the expression levels (Schena et al, Proc. Natl. Acad. ScL USA 93(2):106-149 (1996)). Microarray analysis can be performed by commercially available equipment, following manufacturer's protocols, such as by using the Affymetrix GenChip technology, or Incyte's microarray technology.
[0094] The development of microarray methods for large-scale analysis of gene expression makes it possible to search systematically for molecular markers of cancer classification and outcome prediction in a variety of tumor types. c. Serial Analysis of Gene Expression CSAGE)
[0095] Serial analysis of gene expression (SAGE) is a method that allows the simultaneous and quantitative analysis of a large number of gene transcripts, without the need of providing an individual hybridization probe for each transcript. First, a short sequence tag (about 10-14 bp) is generated that contains sufficient information to uniquely identify a transcript, provided that the tag is obtained from a unique position within each transcript. Then, many transcripts are linked together to form long serial molecules, that can be sequenced, revealing the identity of the multiple tags simultaneously. The expression pattern of any population of transcripts can be quantitatively evaluated by determining the abundance of individual tags, and identifying the gene corresponding to each tag. For more details see, e.g. Velculescu et ah, Science 270:484-487 (1995); and Velculescu et al, Cell 88:243-51 (1997). d. Gene Expression Analysis by Massively Parallel Siεnature Sequencing (MPSS)
[0096] This method, described by Brenner et al, Nature Biotechnology 18:630-634 (2000), is a sequencing approach that combines non- gel-based signature sequencing with in vitro cloning of millions of templates on
Ii
separate 5 μm diameter microbeads. First, a microbead library of DNA templates is constructed by in vitro cloning. This is followed by the assembly of a planar array of the template-containing microbeads in a flow cell at a high density (typically greater than 3 x 10s microbeads/cm2). The free ends of the cloned templates on each microbead are analyzed simultaneously, using a fluorescence- based signature sequencing method that does not require DNA fragment separation. This method has been shown to simultaneously and accurately provide, in a single operation, hundreds of thousands of gene signature sequences from a yeast cDNA library. e. General Description of the mRNA Isolation, Purification and Amplification
[0097] The steps of a representative protocol for profiling gene expression using fixed, paraffin-embedded tissues as the RNA source, including mRNA isolation, purification, primer extension and amplification are provided in various published journal articles (for example: T.E. Godfrey et til,. J. Molec. Diagnostics 2: 84-91 [2000]; K. Specht et al, Am. J. Pathol. 158: 419-29 [2001]). Briefly, a representative process starts with cutting about 10 μm thick sections of paraffin-embedded tumor tissue samples. The RNA is then extracted, and protein and DNA are removed. After analysis of the RNA concentration, RNA repair and/or amplification steps may be included, if necessary, and RNA is reverse transcribed using gene specific promoters followed by RT-PCR. Finally, the data are analyzed to identify the best treatment option(s) available to the patient on the basis of the characteristic gene expression pattern identified in the tumor sample examined, dependent on the predicted likelihood of cancer recurrence. f. Reference Gene Set
[0098] An important aspect of the present invention is to use the measured expression of certain genes by breast cancer tissue to provide prognostic or predictive information. For this purpose it is necessary to correct for (normalize away) both differences in the amount of RNA assayed and variability in the quality of the RNA used. Well known housekeeping genes such as β-actin, GAPD, GUS, RPLO, and TFRC can be used as reference genes for normalization. Reference genes can also be chosen based on the relative invariability of their expression in the study samples and their lack of correlation with clinical outcome. Alternatively, normalization can be based on the mean or
median signal (CT) of all of the assayed genes or a large subset thereof (global normalization approach). Below, unless noted otherwise, gene expression means normalized expression.
g. Primer and Probe Design
[0099] According to one aspect of the present invention, PCR primers and probes are designed based upon intron sequences present in the gene to be amplified. Accordingly, the first step in the primer/probe design is the delineation of intron sequences within the genes. This can be done by publicly available software, such as the DNA BLAT software developed by Kent, W.J., Genome Res. 12(4):656-64 (2002), or by the BLAST software including its variations. Subsequent steps follow well established methods of PCR primer and probe design.
[0100] In order to avoid non-specific signals, it is important to mask repetitive sequences within the introns when designing the primers and probes. This can be easily accomplished by using the Repeat Masker program available on-line through the Baylor College of Medicine, which screens DNA sequences against a library of repetitive elements and returns a query sequence in which the repetitive elements are masked. The masked intron sequences can then be used to design primer and probe sequences using any commercially or otherwise publicly available primer/probe design packages, such as Primer Express (Applied Biosystems); MGB assay-by-design (Applied Biosystems); Primer3 (Steve Rozen and Helen J. Skaletsky (2000) Primer3 on the WWW for general users and for biologist programmers. In: Krawetz S, Misener S (eds) Bioinformatics Methods and Protocols: Methods in Molecular Biology. Humana Press, Totowa, NJ, pp 365-386).
[0101] The most important factors considered in PCR primer design include primer length, melting temperature (Tm), and G/C content, specificity, complementary primer sequences, and 3'-end sequence. In general, optimal PCR primers are generally 17-30 bases in length, and contain about 20-80%, such as, for example, about 50-60% G+C bases. Tm's between 50 and 80 0C, e.g. about 50 to 70 0C are typically preferred.
[0102] For further guidelines for PCR primer and probe design see, e.g. Dieffenbach, CW. et al, "General Concepts for PCR Primer Design" in:
. . ,
PCT/US20(
PCR Primer, A Laboratory Manual, Cold Spring Harbor Laboratory Press, New York, 1995, pp. 133-155; Innis and Gelfand, "Optimization of PCRs" in: PCR Protocols, A Guide to Methods and Applications, CRC Press, London, 1994, pp. 5-11 ; and Plasterer, T.N. Primerselect: Primer and probe design. Methods MoL Biol. 70:520-527 (1997), the entire disclosures of which are hereby expressly incorporated by reference.
B.3 Sources of Biological Material
[0103] Treatment of cancer often involves resection of the tumor to the extent possible without severely compromising the biological function of the patient. As a result, tumor tissue is typically available for analysis following initial treatment of the tumor, and this resected tumor has most often been the sample used in expression analysis studies.
[0104] Expression analysis can also be carried out on tumor tissue obtained through other means such as core, fine needle, or other types of biopsy.
[0105] For particular tumor types, tumor tissue is appropriately obtained from biological fluids using methods such as fine needle aspiration, bronchial lavage, or transbronchial biopsy.
[0106] Particularly in relatively advanced tumors, circulating tumor cells (CTC) are sometimes found in the blood of cancer patients. CTC recovered from blood can also be used as a source of material for expression analysis.
[0107] Cellular constituents, including RNA and protein, derived from tumor cells have been found in biological fluids of cancer patients, including blood and urine. Circulating nucleic acids and proteins may result from tumor cell lysis and may be subjected to expression analysis.
B.3 Algorithms and Statistical Methods
[0108] When quantitative RT-PCR (qRT-PCR) is used to measure mRNA levels, mRNA amounts are expressed in CT (threshold cycle) units (Held et al., Genome Research 6:986-994 (1996)). The averaged sum of Cτs for the reference mRNAs is arbitrarily set (e.g. to zero), and each measured test mRNA CT is given relative to this fixed reference. For example, if, for a particular patient tumor specimen the average of CTS of the reference genes found to be 31 and CT of test gene X is found to be 35, the reported value for gene X is -4 (i.e. 31-35).
[0109] The normalized data can be used to analyze correlation between the expression level of particular mRNAs and clinical outcome. Standard statistical methods can be applied to identify those genes, for which the correlation between expression and outcome, in a univariate analysis, is statistically significant. These genes are markers of outcome, given the existing clinical status. Multivariate analysis can be applied to identify sets of genes, the expression levels of which, when used in combination, are better markers of outcome than the individual genes that constitute the sets.
[0110] Further, it is possible to define groups of genes known or suspected to be associated with particular aspects of the molecular pathology of cancer.' A gene can be assigned to a particular group based either on its known or suspected role in a particular aspect of the molecular biology of cancer or based on its co-expression with another gene already assigned to a particular group. Co- pending U.S. Patent Application 60/561,035 defines several such groups and further shows that the definition of such groups (also termed axis or subset) is useful in that it supports particular methods of data analysis and the elaboration of mathematical algorithms, which in turn yields a more powerful predictors of outcome than can be formulated if these groups are not defined.
[0111] In breast cancer, steroid metabolism, including synthesis and degradation of steroids and clearance of intermediates is an aspect of the molecular pathology of cancer the importance of which has not been adequately appreciated. Genes involved in steroid metabolism form a "Steroid Metabolism Group" the definition of which supports particular methods of data analysis and will support the elaboration of mathematical algorithms useful in the prediction of outcome in various forms of cancer. The precise definition of the genes in the "Steroid Metabolism Group may vary depending on the identity of the steroid relevant in a particular cancer but will be defined to include a) genes, the expression products of which are known or suspected to be involved in synthesis and degradation of the particular steroid and clearance of intermediates, and b) genes that are co-expressed with such genes.
B.5 Clinical Application of Data
[0112] The methods of this invention could be performed as a self- contained test for cancer. Individual markers of the invention identified by univariate analysis or sets of markers of the inventions (e.g. identified by

multivariate analysis) are useful predictors of clinical outcome. Alternatively the markers can be applied as predictive elements of a test that could include other predictive indicators including a) other genes and/or gene groups, or b) other clinical indicators such as tumor stage and grade).
B.6 Kits of the Invention
[0113] The methods of this invention, when practiced for commercial diagnostic purposes would typically be performed in a CLIA-approved clinical diagnostic laboratory. The materials for use in the methods of the present invention are suited for preparation of kits produced in accordance with well known procedures. The invention thus provides kits or components thereof, such kits comprising agents, which may include gene-specific or gene-selective probes and/or primers, for quantitating the expression of the disclosed genes for predicting prognostic outcome or response to treatment. Such kits may optionally contain reagents for the extraction of RNA from tumor samples, in particular fixed paraffin-embedded tissue samples and/or reagents for RNA amplification. In addition, the kits may optionally comprise the reagent(s) with an identifying description or label or instructions relating to their use in the methods of the present invention. The kits may comprise containers (including microtiter plates suitable for use in an automated implementation of the method), each with one or more of the various reagents (typically in concentrated form) utilized in the methods, including, for example, pre-fabricated microarrays, buffers, the appropriate nucleotide triphosphates (e.g., dATP, dCTP, dGTP and dTTP; or rATP, rCTP, rGTP and UTP), reverse transcriptase, DNA polymerase, RNA polymerase, and one or more probes and primers of the present invention (e.g., appropriate length poly(T) or random primers linked to a promoter reactive with the RNA polymerase). Mathematical algorithms used to estimate or quantify prognostic or predictive information are also properly potential components of kits.
[0114] The methods provided by the present invention may also be automated in whole or in part.
[0115] AU aspects of the present invention may also be practiced such that a limited number of additional genes that are co-expressed with the disclosed genes, for example as evidenced by high Pearson correlation coefficients, are
included in a prognostic or predictive test in addition to and/or in place of disclosed genes.
[0116] Having described the invention, the same will be more readily understood through reference to the following Example, which is provided by way of illustration, and is not intended to limit the invention in any way.
EXAMPLES
Example 1 Multiple GSTMl Gene Family Members as Recurrance Risk Markers
[0117] Breast Tumor FPE Specimens. Archival breast tumor FPE blocks, from patients diagnosed between 1990 and 1997, were provided by Providence St. Joseph Medical Center, Burbank CA. and were a subset of specimens examined in a previously reported observational study [Esteban, J. et al. Prog. Proc Am Soc. Clin. Oncol. 22, 850 abstract (2003)].The tumor tissue specimens all came from female breast cancer patients with primary disease (90% stage I or II) and relatively little nodal involvement (80% node negative). The protocol for use of these specimens was approved by the IRlΞi of that medical center.
[0118] Human genomic DNA samples. Genomic DNA was supplied by Dr. Maureen Cronin. The samples were collected with informed consent for genotyping under an IRB approved protocol.
[0119] RNA extraction and preparation. RNA was extracted from three 10 μm FPE sections per patient specimen according to Cronin et al. [AmJ.Pathol. 164, 35-42 (2004)].
[0120] RNA amplification. The FPE RNA used in this study was amplified prior to RT-PCR assay in order to preserve the RNA for later studies. Fifty ng of each FPE RNA sample was amplified using the SenseAmp kit from Genisphere (Hatfϊeld, PA). The amplified RNA products were purified using the mirVana miRNA isolation kit from Ambion.
[0121] TaqMan primer/probe design. Exon-based assays: mRNA reference sequence accession numbers for genes of interest were identified and used to access the sequences through the NCBI Entrez Nucleotide database.
\WΦψΛimmmιmmmmm PCT/US20(
Intron-based assays: Intron sequences were delineated by aligning appropriate mRNA reference sequences with their corresponding genes by using the DNA BLAT software [Kent, WJ., Genome Res. 12,,656-664(2002)]. Repetitive sequences within the introns were identified and masked using the Repeat Masker program (Institute for Systems Biology). Primers and probes were designed using Primer Express 2.0 (Applied Biosystems, Foster City, CA), or Primer 3 [Rozen,R.&Skaletsky,H.J. In Krawetz,S,Misener,S (eds) Bioinformatics Methods and Protocols: Methods in Molecular Biology. Humana Press, Totowa,NJ,365- 386(2000)]. Standard chemistry oligonucleotides were supplied by Biosearch Technologies Inc. (Novato, CA), Integrated DNA Technologies (Coralville, IA), and Eurogentech (San Diego, CA); MGB probes were supplied by Applied Biosystems. AmpHcon sizes were typically 60-85 bases in length. Fluorogenic probes were dual-labeled with 5'-FAM and 3'-BHQ-2.
[0122] Reverse Transcription and TaqMan gene expression profiling RT-PCR was carried out as previously described [Cronin et al. Am. J.Pathol. 164, 35-42 (2004)].
[0123] Normalization and data analysis. Reference gene-based normalization was used to correct for differences in RNA quality and total quantity of RNA assayed. A set of five reference genes were selected from a series of candidates based on their low variance in expression across all the FPE breast cancer tissues and absence of a relationship (p>0.25) with disease free survival. A reference CT for each tested tissue was defined as the average measured CT of the five reference genes. The normalized mRNA level of a test gene within a tissue specimen was defined by the difference between the average CT of the test gene (from triplicate measurements) minus the reference CT.
[0124] Statistical analysis. Least squares linear regression was used to model the relationship between the levels of pairs of assays. Pearson's correlation coefficient was used to summarize the strength of the linear relationship. Cox Proportional Hazards regression was used to model the relationship between gene expression levels and disease-free survival, which was defined as the time from surgical removal of the breast tumor until the recurrence of breast cancer or death from breast cancer or an unknown cause.
[0125] The GSTM (GSTμ) gene family consists of five different closely related isotypes named GSTM1-GSTM5. We have reported four
„
PCT/US20QI
independent clinical studies in which GSTM gene expression strongly correlates with good outcome in primary breast cancer, based on measurements made using an RT-PCR probe-primer set (designated GSTM 1.1) that was designed to recognize GSTMl [8, Esteban, J. et al. Tumor gene expression and prognosis in breast cancer:multigene RT-PCR assay of paraffin-embedded tissue. Prog. Proc Am Soc. Clin. Oncol. 22, 850 abstract (2003), Cobleigh, M.A. et al. Tumor gene expression predicts distant disease-free survival (DDFS) in breast cancer patients with 10 or more positive nodes: high throughput RT-PCR assay of paraffin- embedded tumor tissues. Prog. Proc Am Soc. Clin. Oncol. 22, 850 abstract (2003), Paik, S. et al. Multi-gene RT-PCR assay for predicting recurrence in node negative breast cancer patients-NSABP studies B-20 and B-14. Breast Cancer Res. Treαf.82:A16.abstract (2003)].
[0126] GSTM expression was examined by qRT-PCR in FPET primary breast cancer tissues. GSTMl was detected with the GSTMl.1 assay, which recognizes several GSTM isotypes. The estimate of relative risk in studies 1-4 was based on the hazard ratio (HR) from analysis of the time to breast cancer recurrence using univariate Cox proportional hazards regression. The estimate of relative risk in study 5 was based on the odds ratio (OR) from analysis of breast cancer death in a matched case-control study using conditional logistic regression.
[0127] Study 1, Esteban et al., Prog. Proc Am Soc. Clin. Oncol. 22:850 abstract, 2003; Study 2, Cobleigh et al., Clin Cancer Res 11 :8623- 31,2005; Study 3, Paik et al, Breast Cancer Res. Treat. 82-.A16 abstract, 2003; Study 4, Paik et al, N Engl J Med 351 :2817-26, 2004; Study 5, Habel et al, Breast Cancer Res. Treat. 88:3019 abstract, 2004. The results are shown in Table L* Patients in studies 3-5 were tamoxifen treated, LN-,ER+. GSTM expression was a consistent predictor of favorable outcome in five independent breast cancer recurrence studies.
[0128]
TABLE 1

[0129] Sequence alignments of GSTMl and GSTM2 amplicons with corresponding regions of other GSTM family members (Figure 1). Sequences were aligned by Clustal W (family member denoted in left column). Arrows mark forward (left) and reverse RT-PCR primer (right) regions. Sequences beneath horizontal line indicates probe region. Gray boxes highlight mismatches with primers/probes in the first column. The vertical line in GSTMl .1 indicates a spliced exon-exon junction. The vertical line in GSTM2int4.2 indicates an unspliced intron-exon junction. In fact, alignment of the targeted GSTMl amplicon probe-primer set with homologous regions in GSTM2, GSTM4 and GSTM5 indicates only I5 3 and 3 base mismatches, respectively, indicating that GSTMl.1 may also amplify those sequences (Figure 1).
[0130] Consistent with the fact that 50% of the U.S. population is homozygous GSTMl-null, the GSTMl intron-based assay displays a biphasic expression pattern within 125 breast cancer specimens. Figure 2 shows the number of patients (Y-axis) and corresponding Ct values (x-axis) were plotted for GSTMl .1, GSTMlint5.2 and GSTM2int4.2 assays. Expression levels were determined by TaqMan RT-PCR. "int" indicates that the assay was derived from intron sequence.
[0131] It is noteworthy that a GSTMl.1 signal was detected in all specimens (Cτ<40). This result is strong evidence that GSTMl.1 is not specific for GSTMl, because it is well-established that approximately 50% of the Caucasian and Asian populations are homozygous null for the GSTMl gene. Figure 2 shows that in the case of GSTMl int5.2, RT-PCR signals distribute in a bimodal pattern, with no signal detected in ~50% of the specimens, consistent with specificity for GSTMl . GSTMl int3.1 showed a similar bimodal pattern as GSTMl int5. Furthermore, as shown in Figure 3, genotyping of 22 independent human genomic DNA samples using GSTMlint5.2 identified -50% as GSTMl null, (CT — 40). CT values were —31-32 for the remaining samples. Again, GSTMl.1 failed to discriminate between the two GSTMl genotypes, yielding Cτ~31 -32 in all cases.
[0132] We also explored the expression of another GSTM isotype, GSTM2, using an intron-based design, designated GSTM2int4.2. This 73 base amplicon differs from the other GSTM isotypes by 14 or more bases within the corresponding primer/probe regions (Figure 2). Expression of this sequence in the 125 patient specimens distributes across 6 CT units, from 34-40 (Figure 2). Genotyping with GSTM2int4.2 gave uniform positive signals for all 22 tested DNA specimens (Figure 3) indicating that GSTM2 is not deleted.
[0133] Pearson (R") correlation between GSTM family members. Table 2 shows the Pearson (r) correlation for the various GStM gene family members as determined by various probe-primer sets. Bold font denotes R values between assay sets that we found to be specific for the designated genes, "int" indicates that the assay was derived from intron sequence. In general, the GSTM family members show positive correlations of expression. However, there is a wide range of correlations that vary not only between genes but also between probe-primer sets within the same gene. Among the probe-primer sets thought to be gene specific (bold font), correlations range from 0.15 to 0.91. GSTMlint3.1 and GSTMl int5.2 showed the highest degree of co-expression (R=0.91). Interestingly, GSTM3.5 and GSTM3.6 show a more modest correlation (R= 0.68) suggesting perhaps that they monitor alternate GSTM3 transcripts that are differentially regulated. GSTM4.1 vs. GSTM5.2 and GSTM4.1 vs.GSTMlint5.2 show the lowest levels of coordinated expression ( R= 0.15-0.22) which was not unexpected since they are detecting transcripts from different genes.
0(
GSTM2int4.2 and GSTM3.6, the two genes that both contribute to positive prognosis in the multivariate analysis, show a modest positive correlation (0.42).
[0134] In summary, the positive effects of the GSTM family members are most likely due to a combination of protein function and co-expression. (Table 2).
TABLE 2

[0135] GSTM1-5 expression predict favorable outcome in the 125 breast cancer specimen study. Multivariate analysis suggests that GSTM2 and GSTM3 carry independent biomarker information. Univariate and multivariate Cox PH regression analysis. Assays are ordered by p-value, with p-values <0.05 considered significant. Data in bold are assays that are specific, "int" indicates that the assay was derived from intron sequence. (Tables 3 and 4) .

[0136] The tables indicate that all 5 GSTM genes are indicators of positive prognosis. The order of predictive strength from strongest to weakest is: GSTM3 >GSTM2 > GSTM4 > GSTM5 > GSTMl.
TABLE 3

[0137] A multivariate stepwise Cox PH analysis indicated that GSTM3 and GSTM2 contributed independently to the positive prognosis (Table 4). Because there was an independent contribution to survival by both GSTM2 and GSTM3, it would suggest that each gene (product) has a biological effect.
TABLE 4

[0138] The results indicate that all five GSTM genes are correlated with the likelihood of breast cancer recurrence and suggest that certain GSTM family members contribute independent prognostic information.
Example 2
A Study Qf The Prognostic Value Of GSTM Family Members And Estrogen Metabolizing Genes in Invasive Breast Cancer
[0139J The primary objective of this study was to determine the relationship between the expression of genes involved in estrogen metabolism (including members of the GST gene family) and clinical outcome, in particular distant recurrence-free survival (DRFS), in breast cancer carcinoma.
Study Design
Inclusion Criteria
[0140] Samples were initially obtained from patients meeting the following criteria.
[0141] Surgery performed with diagnosis of invasive ductal carcinoma of the breast, ductal carcinoma in situ (DCIS), lobular carcinoma of the breast, or lobular carcinoma in situ (LCIS).
[0142] Histopathologic assessment indicating adequate amounts of tumor tissue and homogeneous pathology for inclusion in this research study.

[0143] For each patient sample included in the study, the expression level of each of 82 amplicons (shown in Table 5) was quantitatively assessed using qRT-PCR and the correlation between gene expression and distant recurrence-free survival (DRFS) for each of the test genes was evaluated. Distant recurrence-free survival is the time from surgery until the first diagnosis of distant recurrence. Contralateral disease, other second primary cancers, and deaths prior to distant recurrence will be considered censoring events. For the primary analysis, ipsilateral breast recurrence, local chest wall recurrence and regional recurrence is ignored, i.e., not considered either as an event or a censoring event.
[0144] For this study, one hundred twenty five (125) tumor samples were chosen from the patients. AU recurring patients were included in the study, as well as a randomly selected subset of patients who were censored (J. Esteban et al., ASCO Meeting Proceedings 22:850 (2003) (Abstract 3416)).
Gene Panel
[0145] A panel of genes potentially involved in metabolism or clearance of estrogen or in other aspects of cancer pathophysiology was compiled based on published literature. Analysis of 82 genes selected from this panel or potentially useful as reference genes and listed in Table 5 was carried out using quantitative RT-PCR. For certain of the genes, multiple probe primer sets targeted to distinct gene sequences were utilized. Gene names and primer and probe sequences used to quantify transcript expression are listed in Table 6.
Table 5


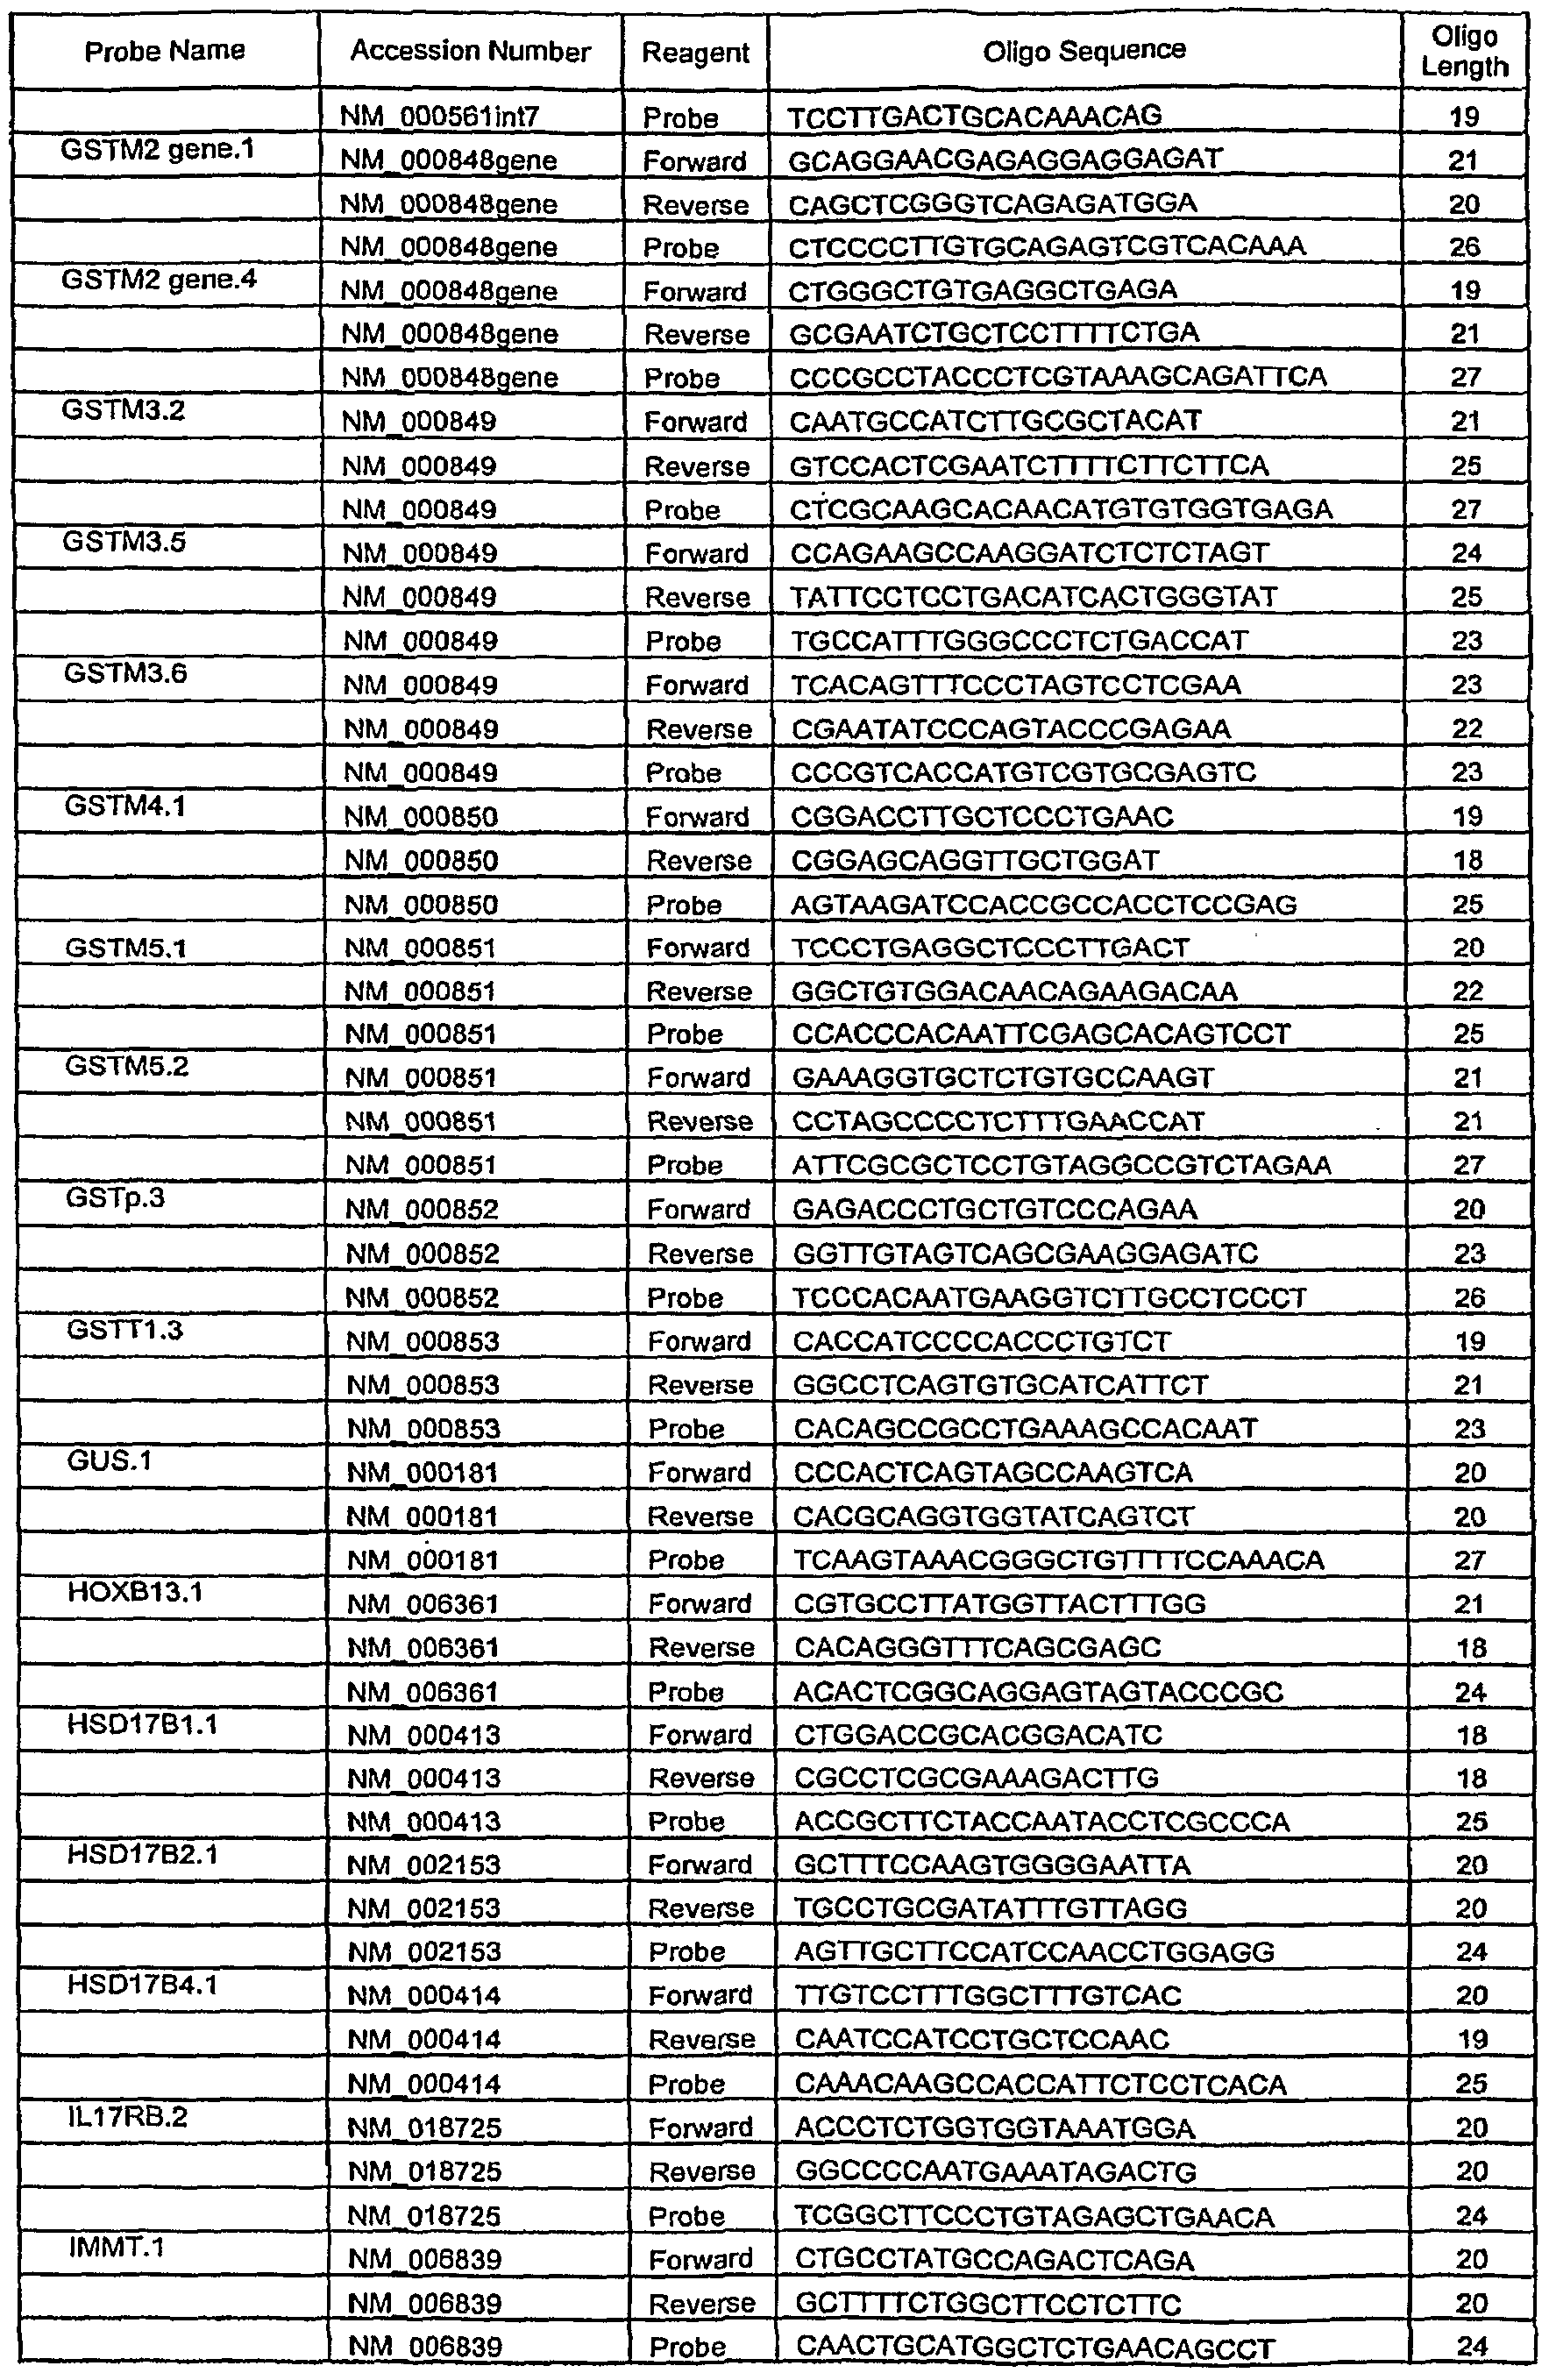
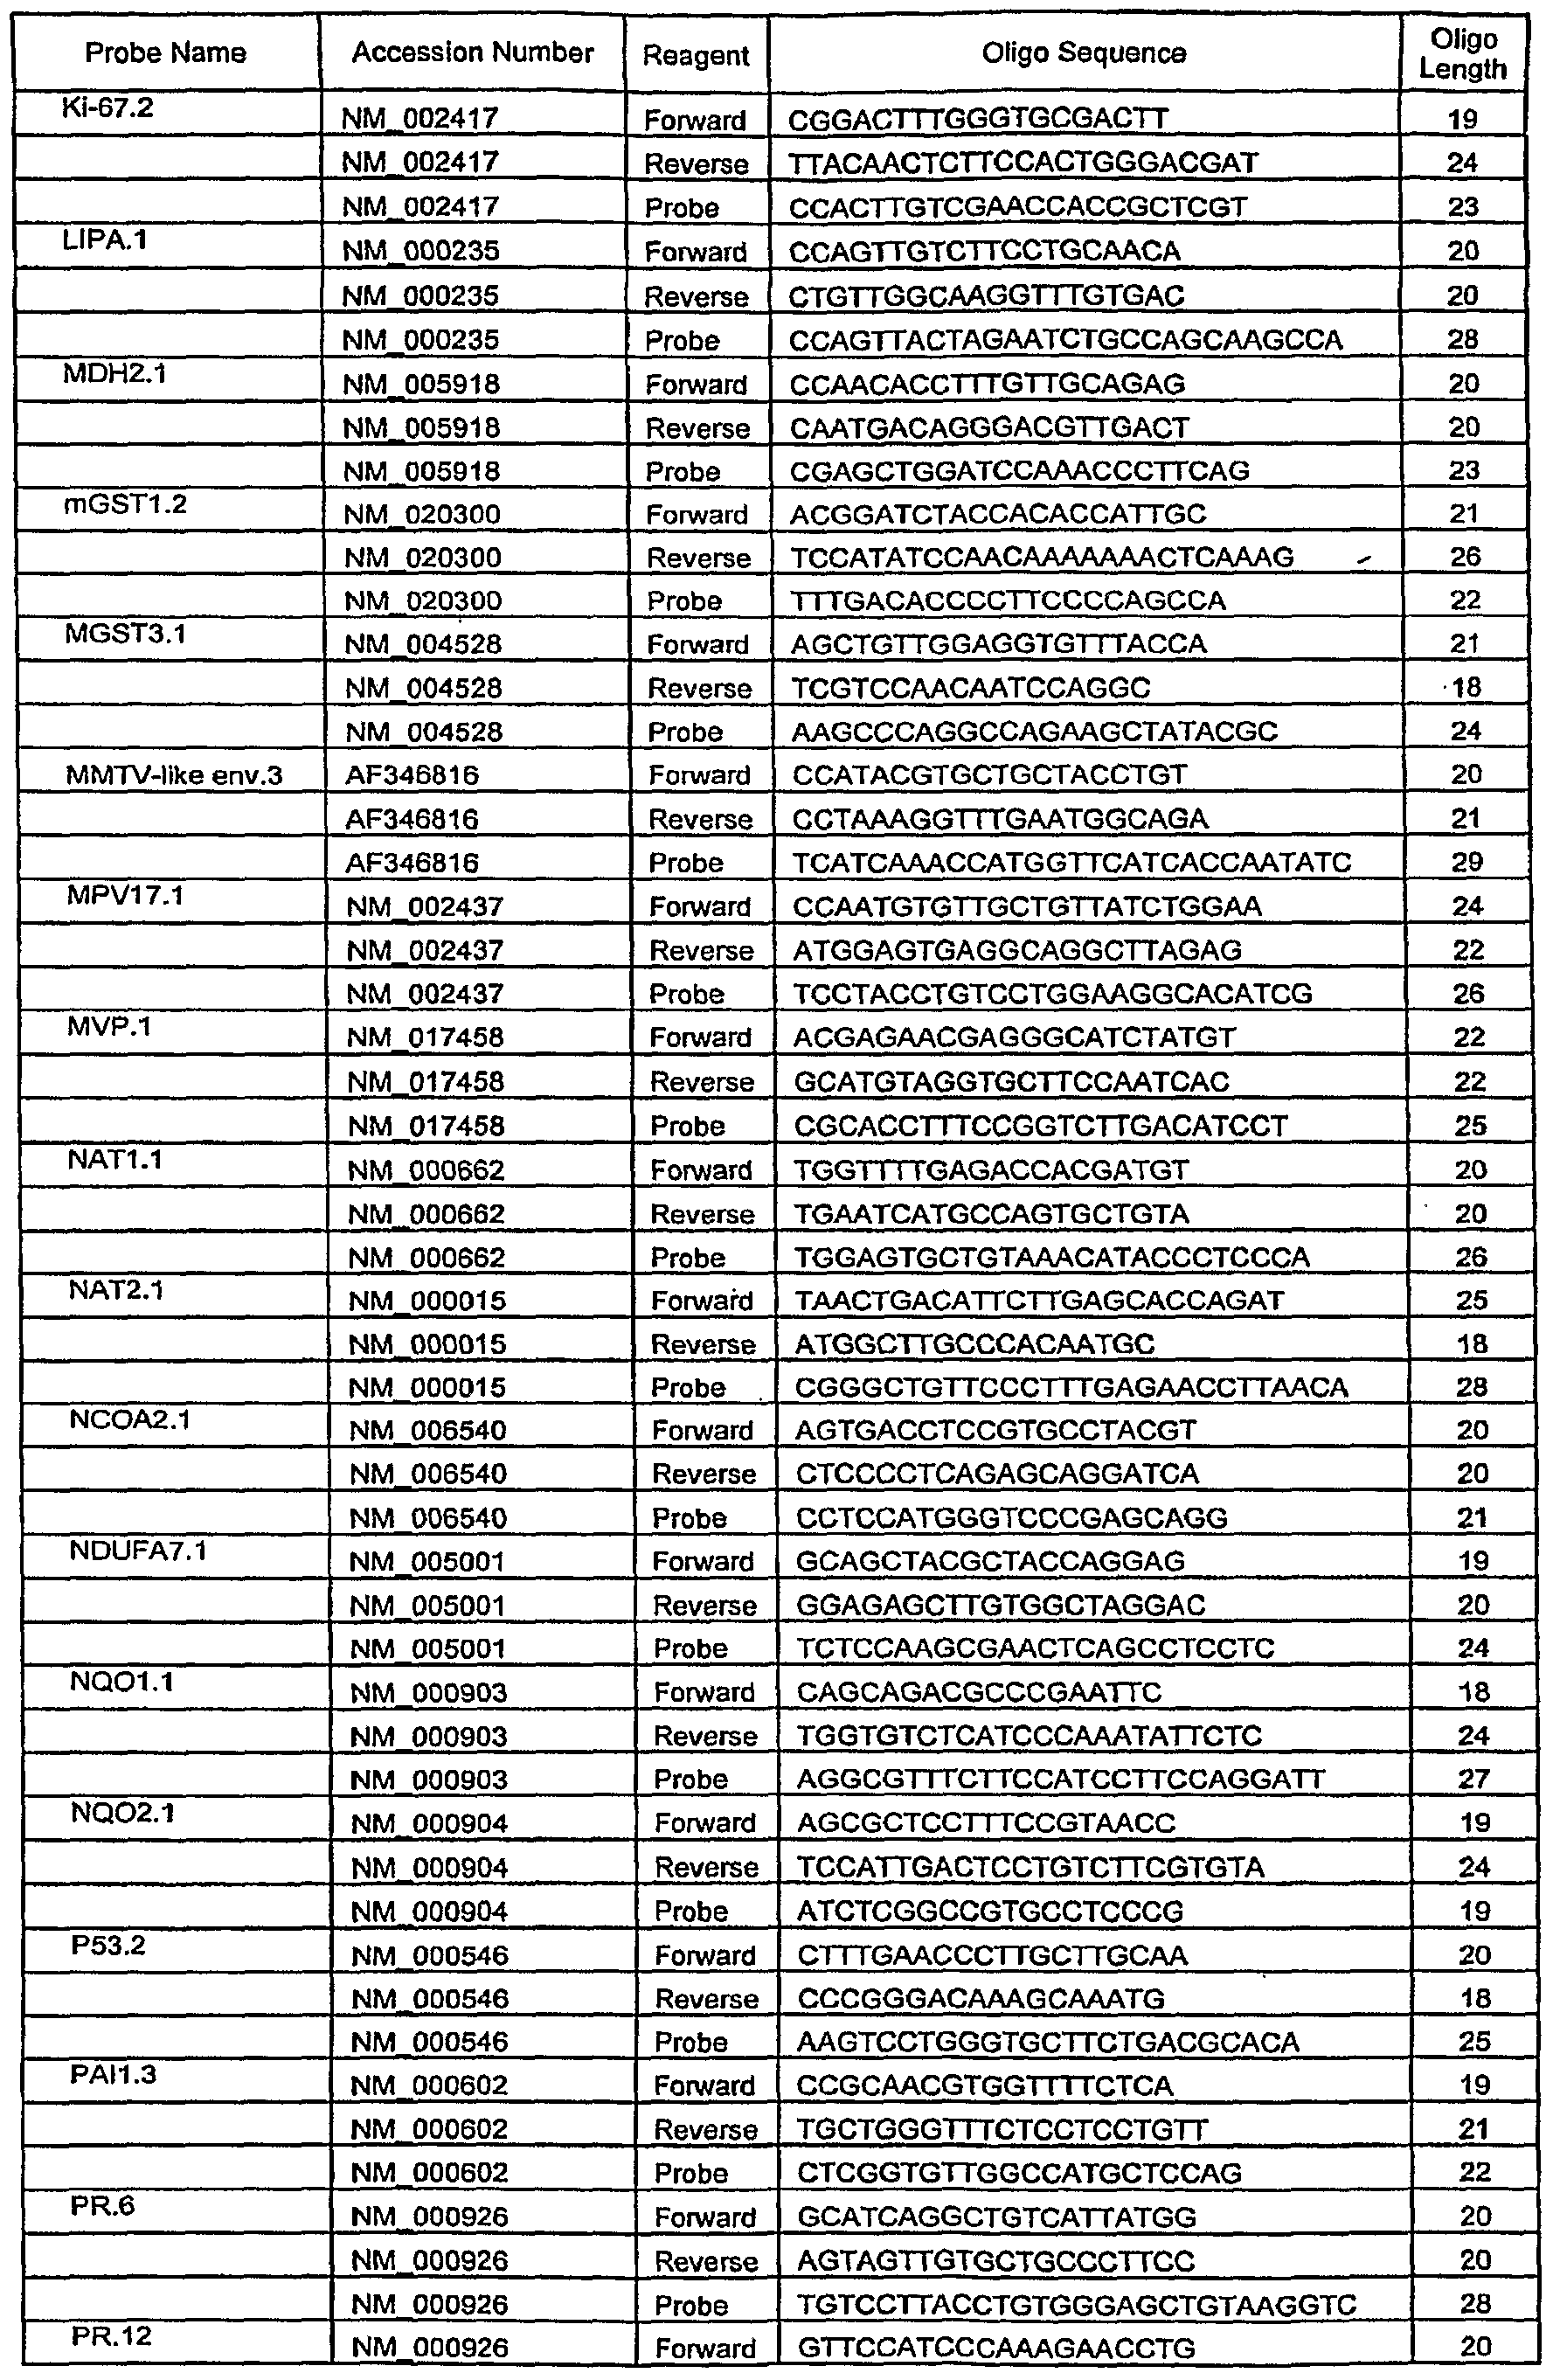


Table 7

-N
 l
l


A
Study Methods
Gene Expression
[0146] For each patient sample included in the study, 50 ng of RNA extracted from a FPET sample was amplified using commercially available RNA amplification kits and protocols (Genisphere). Expression levels of test and reference genes listed in Table 5 were reported as (CT) values from the qRT-PCR assay (TaqMan®). Based on the relative invariability of their measured expression in study samples and on the lack of observed correlation between their measured expression and clinical outcome, CDHl, TBP, EPHXl5 SERPINEl and CD68 were chosen as reference genes. Test gene expression values were normalized relative to the mean of these reference genes. Reference-normalized expression measurements typically range from 0 to 15, where a one unit increase generally reflects a 2-fold increase in RNA quantity.
[0147] Main effect Cox proportional hazard models (D. R. Cox (1972) Regression Models and Life-Tables (with discussion). J Royal Statistical Soc. B, 34:187-220) were utilized to compare the additional contribution of gene expression beyond standard clinical prognostics variables, including age, clinical tumor size, and tumor grade. A test for comparing the reduced model, excluding the gene expression variable, versus the competing full model including the gene variable of interest, called the likelihood ratio test (Ronald Fisher (1922) "On the Mathematical Foundations of Theoretical Statistics", Phil. Trans. Royal Soc, series A, 222:326, 1922; Leonard Savage (1962), The Foundations of Statistical Inference (1962)) was utilized to identify statistically significant prognostic genes.

Study Results
[0148] Using the methods described above, 34 genes were identified, for which the expression level was found to be significantly correlated with DRFS (p<0.1). The genes are shown in Table 8 together with Hazard Ratio and p- values. Results utilizing two. distinct probe primer sets designed to measure distinct expression products of the PGR gene are shown. The PR.12 probe primer set is targeted specifically toward PGR-B mRNA, which gives rise to a longer translation product than does PGR-A mRNA. PR.6 recognizes both PGR-A and PGR-B. Measurement using PR.12 resulted in a lower Hazard Ratio than did PR.6, indicating that PGR-B may be the more powerful predictor of clinical oucome.
Table 8

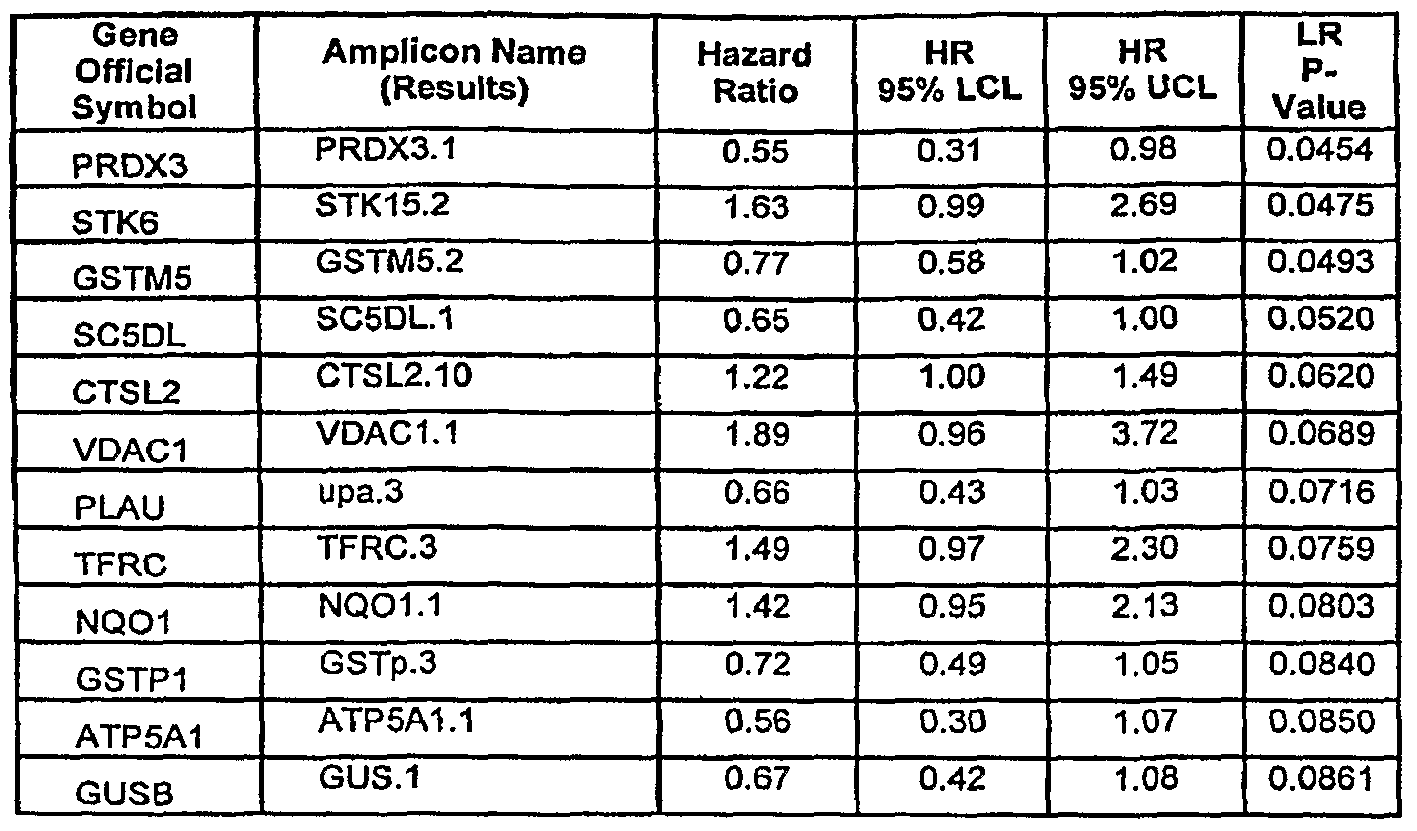
[0149] Two genes from the glutathione peroxidase family.GPXl and GPX2, were positive prognosticators. GPXl gave a very strong positive Cox value (H.R.=0.41, p= 0.0263) and GPX2 was also strongly positive (H.R.=0.68, p= 0.0419). GPXl encodes a selenium-dependent glutathione peroxidase that functions in the detoxification of hydrogen peroxide, and is one of the most important antioxidant enzymes in humans. GPXl overexpression delays cell growth and protects from GSH and H2O2 toxicity. Interestingly, these biological activities are similar to BCL2, another strong positive prognostic indicator in breast. GPX2 also encodes a selenium-dependent glutathione peroxidase and is one of two isoenzymes responsible for the majority of the glutathione-dependent hydrogen peroxide- reducing activity in the epithelium of the gastrointestinal tract. Studies in knockout mice indicate that mRNA expression levels respond to luminal microflora, suggesting a role of GPX2 in preventing inflammation in the GI tract.
[0150] Another strong positive Cox value was found with peroxiredoxin 3, (PRDX3; H.R.=0.55, p= 0.0454). This gene encodes a protein with antioxidant function and is localized in the mitochondrion. PRDX3 is a member of a gene family that is responsible for regulation of cellular proliferation, differentiation, and antioxidant functions.

[0151] The strong positive prognostic effect of CRYZ (H.R.=0.60, p= 0.0263) is also consistent with its function as an antioxidant. CRYZ encodes the major detoxifying enzyme quinone reductase (QR) [NAD(P)H:quinone oxidoreductase].. It is hypothesized that QR inhibits estrogen-induced DNA damage by detoxification of reactive catecholestrogens. CRYZ is transcriptionally activated by anti-estrogen liganded ERβ. Up-regulation of QR, either by overexpression or induction by tamoxifen, can protect breast cells against oxidative DNA damage caused by estrogen metabolites,' representing a possible novel mechanism of tamoxifen prevention against breast cancer. (See Table 9 Univariate Cox PH regression analysis. Assays are ordered by p-value, with p-values < 0.05 considered significant. Specimens from 125 breast cancer patients were assayed.)
Table 9

[0152] The cytochrome P450 proteins are monooxygenases which catalyze many reactions involved in drug metabolism and synthesis of cholesterol, steroids and other lipids. Two of the five cytochrome P450 superfamily members tested were also significant indicators of positive prognosis. CYPl 7Al (H.R.=0.69, p= 0.0323) localizes to the endoplasmic reticulum. It has both 17alpha-hydroxylase
and 17,20-lyase activities and is a key enzyme in the steroidogenic pathway that produces progestins, mineralocorticoids, glucocorticoids, androgens, and estrogens. The recently discovered CYP4Z1 (H.R.=0.86, p=0.0416), also an endoplasmic reticulum integral membrane protein, is restricted to expression in breast and showed a clear over-expression in 52% of breast cancer samples in one study.
[0153] The antioxidant protein catalase (CAT) is located at the peroxisome and scavenges H2O2. Consistent with its function was the finding that CAT expression correlated with positive prognosis (H.R.=0.63, p= 0.040).
[0154] The sterol-C5-desaturase like gene (SC5DL) encodes an enzyme that is involved in cholesterol biosynthesis. Expression of SC5DL is downregulated in human ovarian carcinomas in vivo during Taxol(R) (paclitaxel) treatment. In our study, increased expression of SC5DL was a positive prognostic indicator (H.R =0.65, p= 0.052).
[0155] NATl, a xenobiotic-metabolizing enzyme, is an ERa -responsive gene in human breast cancer and has been suggested as a candidate molecular predictor of antiestrogen responsiveness. In a 97 ERalpha-positive breast tumor study, relapse-free survival was longer among patients with NATl-overexpressing tumors (P = 0.000052), and retained prognostic significance in Cox multivariate regression analysis (P = 0.0013). In our current study, we show that NATl maintains a positive prognostic significance in a univariate Cox model (H.R.=0.85, p= 0.0161) NATl also shows a strong expression correlation with ER (R=O.67), consistent with it being an ERa responsive gene. • ■
[0156] The glutathione S-transferase pi gene (GSTPl) is a polymorphic gene encoding active, functionally different GSTPl variant proteins that are thought to function in xenobiotic metabolism and play a role in' susceptibility to cancer. GSTp was a positive prognostic indicator in our study (H.R.=0.72, ρ= 0.084).
[0157] One skilled in the art will recognize numerous methods and materials similar or equivalent to those described herein, which could be used in the practice of the present invention. Indeed, the present invention is in no way limited to the methods and materials described. While the present invention has been
described with reference to what are considered to be the specific embodiments, it is to be understood that the invention is not limited to such embodiments. To the contrary, the invention is intended to cover various modifications and equivalents included within the spirit and scope of the appended claims. For example, while the disclosure is illustrated by identifying genes and groups of genes useful in determining prognosis for patients diagnosed with invasive breast cancer, similar methods in determining prognosis for patients diagnosed with cancer of other cell types, including prostate and ovarian cancer.
Claims
1. A method of predicting clinical outcome for a subject diagnosed with cancer, comprising determining evidence of the expression level of one or more predictive RNA transcripts listed in Table 8, or their expression products, in a biological sample comprising cancer cells obtained from said subject, wherein evidence of increased expression of one or more of the genes listed in Table 8, or the corresponding expression product, indicates a decreased likelihood of a positive clinical outcome.
2. The method of claim 1 wherein said subject is a human patient.
3. The method of claim 1 wherein evidence of said expression level is obtained by a method of gene expression profiling.
4. The method of claim 3 wherein said method is a PCR-based method.
5. The method of claim 4 wherein said expression levels are normalized relative to. the expression levels of one or more reference genes, or their expression products.
6. The method of claim 2 wherein.said clinical outcome is expressed in terms of Recurrence-Free Interval (RFI), Overall Survival (OS), Disease-Free Survival (DFS), or Distant Recurrence-Free Interval (DRFI).
7. The. method of claim 2 wherein said cancer is selected from the group consisting of breast cancer or ovarian cancer.
8. The method of claim 7 wherein said cancer is breast cancer.
9. The method of claim 2 comprising determining evidence of the expression levels of at least two of said genes, or their expression products. • • Il
10. The method of claim 2 comprising determining evidence of the expression levels of at least three of said genes, or their expression products.
11. The method of claim 2 comprising determining evidence of the expression levels of at least four of said genes, or their expression products.
12. The method of claim 2 comprising determining evidence of the expression levels of at least five of said genes, or their expression products.
13. The method of claim 2 further comprising the step of creating a report summarizing said prediction.
14. A method of predicting the duration of Recurrence-Free Interval (RFI) in a subject diagnosed with breast cancer, comprising determining the expression level of one or more predictive RNA transcripts listed in Table 8 or their expression products, in a biological sample comprising cancer cells obtained from said subject, wherein evidence of increased expression of one or more of the genes listed in Table 8, or the corresponding expression product, indicates that said RFI is predicted to be shorter.
15. The method of claim 14 wherein said subject is a human patient.
16. The method of claim 14 wherein evidence of said expression level is obtained by a method of gene expression profiling.
17. The method of claim 16 wherein said method is a PCR-based method.
18. The method of claim 17 wherein, if said RFI is predicted to be shorter, said patient is subjected to further therapy following surgical removal of the cancer.
19. The method of claim 18 wherein said further therapy is chemotherapy and/or radiation therapy. ■
20. The method of claim 15 further comprising the step of creating a report summarizing said prediction.
21. The method of claim 15 comprising determining evidence of the expression levels of at least two of said genes, or their expression products.
22. The method of claim 15 comprising determining evidence of the expression levels of at least three of said genes, or their expression products.
23. The method of claim 15 comprising determining evidence of the expression levels of at least four of said genes, or their expression products.
24. The method of claim 15 comprising determining evidence of the expression levels of at least five of said genes, or their expression products.
25. A method of predicting clinical outcome for a subject diagnosed with cancer, comprising determining evidence of the expression level of one or more predictive RNA transcripts of one or more genes selected from the group consisting of CAT, CRYZ, CYP4Z1, CYP17A1. GPX1, GPX2, GSTMl, GSTM2, GSTM3, GSTM4, GSTM5, GSTPl, NQOl, PRDX3, and SC5DL or their expression products, in a biological sample comprising cancer cells obtained from said subject, wherein evidence of increased expression of one or more of the genes, or the corresponding expression product, indicates a decreased likelihood of a positive clinical outcome.
26. The method of claim 25 comprising determining the expression level of one or more predictive RNA transcripts or their expression products of one or more genes selected from the group consisting of GSTMl, GSTM2, GSTM3, GSTM4, GSTM5 and GSTPl.
27. The method of claim 25 comprising determining the expression level of one or more predictive RNA transcripts or their expression products of one or more genes selected from the group consisting of GSTM2 and GSTM4. .
28. The method of claim 25 comprising determining the expression level of one or more predictive RNA transcripts or their expression products of one or more genes selected from the group consisting of GSTMl and GSTM3.
29. The method of claim 25 comprising determining the expression level of one or more predictive RNA transcripts or their expression products of one or more genes selected from the group consisting of CAT, PRDX3, GPXl, and GPX2.
30. The method of claim 29 comprising determining the expression level of one or more predictive RNA transcripts or their expression products of one or more genes selected from the group consisting of PRDX3, GPXl and GPX2.
31. The method of claim 30 comprising determining the expression level of one or more predictive RNA transcripts or their expression products of one or more genes selected from the group consisting of GPXl and GPX2.
.
32. . The method of claim 25 comprising determining the expression level of one or more predictive RNA transcripts or their expression products of one or more genes selected from the group consisting of CRYZ and NQO 1.
33. The method of claim 25 comprising determining the expression level of one or more predictive RNA transcripts or their expression products of CYP 17Al.
34. The method of claim 25 comprising determining the expression level of one or more predictive RNA transcripts or their expression products of one or more genes selected from the group consisting of SC5DL and CYP4Z1.
35. A method for preparing a personalized genomics profile for a patient comprising the steps of
(a) subjecting RNA extracted from a tissue obtained from the patient to gene expression analysis;
(b) determining the expression level in the tissue of one or more genes selected from the gene set listed in Table 8 , wherein the expression lever is normalized against a control gene or genes and optionally is compared to the amount found in a cancer reference set and
(c) creating a report summarizing the data obtained by said gene expression analysis. .
36. A method for amplification of a gene listed in Table 8 by polymerase chain reaction (PCR) comprising performing said per by using amplicons listed in Table 7 and a primer-probe set. listed in Table 6.
37. A PCR primer-probe set listed in Table 6.
38. A PCR amplicon listed in Table 7.
Applications Claiming Priority (4)
| Application Number | Priority Date | Filing Date | Title |
|---|---|---|---|
| US78792606P | 2006-03-31 | 2006-03-31 | |
| US60/787,926 | 2006-03-31 | ||
| US78918706P | 2006-04-03 | 2006-04-03 | |
| US60/789,187 | 2006-04-03 |
Publications (2)
| Publication Number | Publication Date |
|---|---|
| WO2007123772A2 true WO2007123772A2 (en) | 2007-11-01 |
| WO2007123772A3 WO2007123772A3 (en) | 2008-01-03 |
Family
ID=38354195
Family Applications (1)
| Application Number | Title | Priority Date | Filing Date |
|---|---|---|---|
| PCT/US2007/008029 WO2007123772A2 (en) | 2006-03-31 | 2007-03-30 | Genes involved in estrogen metabolism |
Country Status (2)
| Country | Link |
|---|---|
| US (3) | US7888019B2 (en) |
| WO (1) | WO2007123772A2 (en) |
Cited By (3)
| Publication number | Priority date | Publication date | Assignee | Title |
|---|---|---|---|---|
| WO2012130165A1 (en) * | 2011-03-31 | 2012-10-04 | 中国科学院上海生命科学研究院 | Liver cancer diagnosis marker and use thereof |
| WO2015066068A1 (en) * | 2013-10-29 | 2015-05-07 | Genomic Health, Inc. | Methods of incorporation of transcript chromosomal locus information for identification of biomarkers of disease recurrence risk |
| US9605318B2 (en) | 2004-04-09 | 2017-03-28 | Genomic Health, Inc. | Gene expression markers for predicting response to chemotherapy |
Families Citing this family (21)
| Publication number | Priority date | Publication date | Assignee | Title |
|---|---|---|---|---|
| EP2799555B1 (en) * | 2002-03-13 | 2017-02-22 | Genomic Health, Inc. | Gene expression profiling in biopsied tumor tissues |
| US20040231909A1 (en) | 2003-01-15 | 2004-11-25 | Tai-Yang Luh | Motorized vehicle having forward and backward differential structure |
| US7930104B2 (en) * | 2004-11-05 | 2011-04-19 | Genomic Health, Inc. | Predicting response to chemotherapy using gene expression markers |
| US20120164730A1 (en) * | 2005-10-11 | 2012-06-28 | Ben-Gurion University Of The Negev Research And Development Authority Ltd. | Compositions for silencing the expression of vdac1 and uses thereof |
| US10359425B2 (en) * | 2008-09-09 | 2019-07-23 | Somalogic, Inc. | Lung cancer biomarkers and uses thereof |
| US20100221752A2 (en) * | 2008-10-06 | 2010-09-02 | Somalogic, Inc. | Ovarian Cancer Biomarkers and Uses Thereof |
| WO2010125117A2 (en) * | 2009-04-29 | 2010-11-04 | Ralph Wirtz | A method to assess prognosis and to predict therapeutic success in cancer by determining hormone receptor expression levels |
| US20130116150A1 (en) | 2010-07-09 | 2013-05-09 | Somalogic, Inc. | Lung Cancer Biomarkers and Uses Thereof |
| SG10201912361VA (en) | 2010-07-27 | 2020-02-27 | Genomic Health Inc | Method for using gene expression to determine prognosis of prostate cancer |
| MX350533B (en) | 2010-08-13 | 2017-09-08 | Somalogic Inc | Pancreatic cancer biomarkers and uses thereof. |
| US20130217594A1 (en) * | 2010-10-29 | 2013-08-22 | Institute for Cancer Research d/b/a The Research Center of Fox Chase Cancer (Fox Chase Cancer | Methods for screening compounds for capability to inhibit premalignant squamous epithelial cell progression to a malignant state |
| GB201114919D0 (en) * | 2011-08-30 | 2011-10-12 | Glaxosmithkline Biolog Sa | Method |
| SG10201605210PA (en) | 2012-01-31 | 2016-08-30 | Genomic Health Inc | Gene expression profile algorithm and test for determining prognosis of prostate cancer |
| JP6415712B2 (en) | 2014-10-24 | 2018-10-31 | コーニンクレッカ フィリップス エヌ ヴェKoninklijke Philips N.V. | Assessment of TGF-β cell signaling pathway activity using mathematical modeling of target gene expression |
| CN108064380A (en) | 2014-10-24 | 2018-05-22 | 皇家飞利浦有限公司 | Use the prediction of the medical prognosis and therapeutic response of various kinds of cell signal transduction path activity |
| CN108064311B (en) | 2014-10-24 | 2022-10-28 | 皇家飞利浦有限公司 | Medical prognosis and prediction of treatment response using multiple cell signaling pathway activities |
| ES2861400T3 (en) | 2015-08-14 | 2021-10-06 | Koninklijke Philips Nv | Evaluation of the activity of the NFkB cell signaling pathway using mathematical models of target gene expression |
| WO2017081686A1 (en) | 2015-11-10 | 2017-05-18 | B. G. Negev Technologies And Applications Ltd., At Ben-Gurion University | Means and methods for reducing tumorigenicity of cancer stem cells |
| EP3461915A1 (en) | 2017-10-02 | 2019-04-03 | Koninklijke Philips N.V. | Assessment of jak-stat1/2 cellular signaling pathway activity using mathematical modelling of target gene expression |
| EP3502279A1 (en) | 2017-12-20 | 2019-06-26 | Koninklijke Philips N.V. | Assessment of mapk-ap 1 cellular signaling pathway activity using mathematical modelling of target gene expression |
| KR102211972B1 (en) * | 2018-08-02 | 2021-02-04 | 엑소젠 피티이. 엘티디 | Method for early diagnosis of breast cancer and monitoring after treatment using liquid biopsy multi-cancer gene biomarkers |
Citations (5)
| Publication number | Priority date | Publication date | Assignee | Title |
|---|---|---|---|---|
| WO2003078662A1 (en) * | 2002-03-13 | 2003-09-25 | Genomic Health | Gene expression profiling in biopsied tumor tissues |
| WO2004065583A2 (en) * | 2003-01-15 | 2004-08-05 | Genomic Health, Inc. | Gene expression markers for breast cancer prognosis |
| US20040191817A1 (en) * | 2003-02-20 | 2004-09-30 | Randy Scott | Use of intronic RNA to measure gene expression |
| WO2005008213A2 (en) * | 2003-07-10 | 2005-01-27 | Genomic Health, Inc. | Expression profile algorithm and test for cancer prognosis |
| US20050221398A1 (en) * | 2004-01-16 | 2005-10-06 | Ipsogen, Sas, A Corporation Of France | Protein expression profiling and breast cancer prognosis |
Family Cites Families (16)
| Publication number | Priority date | Publication date | Assignee | Title |
|---|---|---|---|---|
| AU4158799A (en) | 1998-06-06 | 1999-12-30 | Genostic Pharma Limited | Probes used for genetic filing |
| AU766544B2 (en) | 1998-06-06 | 2003-10-16 | Genostic Pharma Limited | Probes used for genetic profiling |
| EP1115737A4 (en) | 1998-09-23 | 2004-11-24 | Cleveland Clinic Foundation | Novel interferon stimulated and repressed genes |
| US6960439B2 (en) | 1999-06-28 | 2005-11-01 | Source Precision Medicine, Inc. | Identification, monitoring and treatment of disease and characterization of biological condition using gene expression profiles |
| US6692916B2 (en) | 1999-06-28 | 2004-02-17 | Source Precision Medicine, Inc. | Systems and methods for characterizing a biological condition or agent using precision gene expression profiles |
| US7171311B2 (en) | 2001-06-18 | 2007-01-30 | Rosetta Inpharmatics Llc | Methods of assigning treatment to breast cancer patients |
| AU2002316251A1 (en) | 2001-06-18 | 2003-01-02 | Rosetta Inpharmatics, Inc. | Diagnosis and prognosis of breast cancer patients |
| KR20040064275A (en) | 2001-11-09 | 2004-07-16 | 소스 프리시전 메디슨, 인코포레이티드 | Identification, monitoring and treatment of disease and characterization of biological condition using gene expression profiles |
| WO2005076005A2 (en) | 2004-01-30 | 2005-08-18 | Medizinische Universität Wien | A method for classifying a tumor cell sample based upon differential expression of at least two genes |
| EP1759009A1 (en) | 2004-05-28 | 2007-03-07 | Board Of Regents, The University Of Texas System | Multigene predictors of response to chemotherapy |
| WO2006010150A2 (en) | 2004-07-15 | 2006-01-26 | University Of Utah Research Foundation | Housekeeping genes and methods for identifying the same |
| EP1907858A4 (en) | 2005-06-13 | 2009-04-08 | Univ Michigan | Compositions and methods for treating and diagnosing cancer |
| US20070099209A1 (en) | 2005-06-13 | 2007-05-03 | The Regents Of The University Of Michigan | Compositions and methods for treating and diagnosing cancer |
| IL177006A0 (en) * | 2005-08-02 | 2006-12-10 | Veridex Llc | Predicting bone relapse of breast cancer |
| CA2630974A1 (en) | 2005-11-23 | 2007-05-31 | University Of Utah Research Foundation | Methods and compositions involving intrinsic genes |
| EP3556867A1 (en) | 2009-11-23 | 2019-10-23 | Genomic Health, Inc. | Methods to predict clinical outcome of cancer |
-
2007
- 2007-03-30 WO PCT/US2007/008029 patent/WO2007123772A2/en active Application Filing
- 2007-03-30 US US11/731,196 patent/US7888019B2/en active Active
-
2010
- 2010-12-17 US US12/971,874 patent/US8906625B2/en active Active
- 2010-12-17 US US12/972,148 patent/US8808994B2/en active Active
Patent Citations (5)
| Publication number | Priority date | Publication date | Assignee | Title |
|---|---|---|---|---|
| WO2003078662A1 (en) * | 2002-03-13 | 2003-09-25 | Genomic Health | Gene expression profiling in biopsied tumor tissues |
| WO2004065583A2 (en) * | 2003-01-15 | 2004-08-05 | Genomic Health, Inc. | Gene expression markers for breast cancer prognosis |
| US20040191817A1 (en) * | 2003-02-20 | 2004-09-30 | Randy Scott | Use of intronic RNA to measure gene expression |
| WO2005008213A2 (en) * | 2003-07-10 | 2005-01-27 | Genomic Health, Inc. | Expression profile algorithm and test for cancer prognosis |
| US20050221398A1 (en) * | 2004-01-16 | 2005-10-06 | Ipsogen, Sas, A Corporation Of France | Protein expression profiling and breast cancer prognosis |
Non-Patent Citations (3)
| Title |
|---|
| DATABASE Geneseq [Online] 26 June 2001 (2001-06-26), "Human cDNA sequence SEQ ID NO:16774." XP002447836 retrieved from EBI accession no. GSN:AAH17354 Database accession no. AAH17354 * |
| LINKE STEVEN P ET AL: "A multimarker model to predict outcome in tamoxifen-treated breast cancer patients." CLINICAL CANCER RESEARCH : AN OFFICIAL JOURNAL OF THE AMERICAN ASSOCIATION FOR CANCER RESEARCH 15 FEB 2006, vol. 12, no. 4, 15 February 2006 (2006-02-15), pages 1175-1183, XP002447636 ISSN: 1078-0432 * |
| PAIK S ET AL: "A MULTIGENE ASSAY TO PREDICT RECURRENCE OF TAMOXIFEN-TREATED, NODE-NEGATIVE BREAST CANCER" NEW ENGLAND JOURNAL OF MEDICINE, MASSACHUSETTS MEDICAL SOCIETY, BOSTON, MA, US, vol. 351, no. 27, 30 December 2004 (2004-12-30), pages 2817-2826, XP008043033 ISSN: 1533-4406 cited in the application * |
Cited By (4)
| Publication number | Priority date | Publication date | Assignee | Title |
|---|---|---|---|---|
| US9605318B2 (en) | 2004-04-09 | 2017-03-28 | Genomic Health, Inc. | Gene expression markers for predicting response to chemotherapy |
| WO2012130165A1 (en) * | 2011-03-31 | 2012-10-04 | 中国科学院上海生命科学研究院 | Liver cancer diagnosis marker and use thereof |
| CN102732608A (en) * | 2011-03-31 | 2012-10-17 | 中国科学院上海生命科学研究院 | Marker for diagnosing liver cancer and application thereof |
| WO2015066068A1 (en) * | 2013-10-29 | 2015-05-07 | Genomic Health, Inc. | Methods of incorporation of transcript chromosomal locus information for identification of biomarkers of disease recurrence risk |
Also Published As
| Publication number | Publication date |
|---|---|
| WO2007123772A3 (en) | 2008-01-03 |
| US20110275083A1 (en) | 2011-11-10 |
| US20110275082A1 (en) | 2011-11-10 |
| US20070275398A1 (en) | 2007-11-29 |
| US8808994B2 (en) | 2014-08-19 |
| US7888019B2 (en) | 2011-02-15 |
| US8906625B2 (en) | 2014-12-09 |
Similar Documents
| Publication | Publication Date | Title |
|---|---|---|
| US8906625B2 (en) | Genes involved in estrogen metabolism | |
| EP1836629B1 (en) | Predicting response to chemotherapy using gene expression markers | |
| AU2005304878B2 (en) | Molecular indicators of breast cancer prognosis and prediction of treatment response | |
| DK1641810T4 (en) | Predicting the likelihood of cancer recurrence | |
| DK2598659T3 (en) | PROCEDURE FOR USING GENEPRESSION FOR DETERMINING PROSTATE CANCER FORECAST | |
| US20070128636A1 (en) | Predictors Of Patient Response To Treatment With EGFR Inhibitors | |
| EP2140020A2 (en) | Gene expression markers for prediction of patient response to chemotherapy | |
| EP3556867A1 (en) | Methods to predict clinical outcome of cancer | |
| EP1974058A2 (en) | Gene expression markers for colorectal cancer prognosis | |
| JP2006516897A (en) | Gene expression markers for breast cancer prognosis | |
| EP2191020A2 (en) | Gene expression markers of recurrence risk in cancer patients after chemotherapy | |
| AU2017268510A1 (en) | Method for using gene expression to determine prognosis of prostate cancer | |
| KR102376220B1 (en) | Algorithms and Methods for Evaluating Late Clinical Endpoints in Prostate Cancer |
Legal Events
| Date | Code | Title | Description |
|---|---|---|---|
| 121 | Ep: the epo has been informed by wipo that ep was designated in this application |
Ref document number: 07754539 Country of ref document: EP Kind code of ref document: A2 |
|
| NENP | Non-entry into the national phase in: |
Ref country code: DE |
|
| 122 | Ep: pct application non-entry in european phase |
Ref document number: 07754539 Country of ref document: EP Kind code of ref document: A2 |