WO2007100859A2 - Gene predictors of response to metastatic colorectal chemotherapy - Google Patents
Gene predictors of response to metastatic colorectal chemotherapy Download PDFInfo
- Publication number
- WO2007100859A2 WO2007100859A2 PCT/US2007/005176 US2007005176W WO2007100859A2 WO 2007100859 A2 WO2007100859 A2 WO 2007100859A2 US 2007005176 W US2007005176 W US 2007005176W WO 2007100859 A2 WO2007100859 A2 WO 2007100859A2
- Authority
- WO
- WIPO (PCT)
- Prior art keywords
- genes
- expression
- patient
- chemotherapy
- gene
- Prior art date
Links
- 108090000623 proteins and genes Proteins 0.000 title claims abstract description 191
- 238000002512 chemotherapy Methods 0.000 title claims description 99
- 230000004044 response Effects 0.000 title claims description 95
- 206010061289 metastatic neoplasm Diseases 0.000 title description 5
- 230000001394 metastastic effect Effects 0.000 title description 4
- 230000014509 gene expression Effects 0.000 claims abstract description 155
- 206010028980 Neoplasm Diseases 0.000 claims abstract description 81
- 238000000034 method Methods 0.000 claims description 122
- 101000617728 Homo sapiens Pregnancy-specific beta-1-glycoprotein 9 Proteins 0.000 claims description 53
- 102100021983 Pregnancy-specific beta-1-glycoprotein 9 Human genes 0.000 claims description 53
- 101000760270 Homo sapiens Zinc finger protein 583 Proteins 0.000 claims description 46
- 102100024713 Zinc finger protein 583 Human genes 0.000 claims description 46
- 102100029813 D(1B) dopamine receptor Human genes 0.000 claims description 45
- 101000865210 Homo sapiens D(1B) dopamine receptor Proteins 0.000 claims description 45
- 101000762425 Homo sapiens Protein boule-like Proteins 0.000 claims description 45
- 101000760284 Homo sapiens Zinc finger protein 32 Proteins 0.000 claims description 45
- 102100024493 Protein boule-like Human genes 0.000 claims description 45
- 102100024703 Zinc finger protein 32 Human genes 0.000 claims description 45
- 102100034125 Golgin subfamily A member 8A Human genes 0.000 claims description 44
- 101001070493 Homo sapiens Golgin subfamily A member 8A Proteins 0.000 claims description 44
- 206010052358 Colorectal cancer metastatic Diseases 0.000 claims description 42
- -1 PRYM Proteins 0.000 claims description 41
- 102100027126 Echinoderm microtubule-associated protein-like 2 Human genes 0.000 claims description 38
- 101001057942 Homo sapiens Echinoderm microtubule-associated protein-like 2 Proteins 0.000 claims description 38
- 101000658084 Homo sapiens U2 small nuclear ribonucleoprotein auxiliary factor 35 kDa subunit-related protein 2 Proteins 0.000 claims description 35
- 102100035036 U2 small nuclear ribonucleoprotein auxiliary factor 35 kDa subunit-related protein 2 Human genes 0.000 claims description 35
- 102100025672 Angiopoietin-related protein 2 Human genes 0.000 claims description 34
- 101000693081 Homo sapiens Angiopoietin-related protein 2 Proteins 0.000 claims description 34
- 238000011282 treatment Methods 0.000 claims description 34
- 101001127485 Arabidopsis thaliana Probable peroxidase 26 Proteins 0.000 claims description 33
- 101000608769 Homo sapiens Galectin-8 Proteins 0.000 claims description 30
- 102100033299 Glia-derived nexin Human genes 0.000 claims description 29
- 101000997803 Homo sapiens Glia-derived nexin Proteins 0.000 claims description 28
- 206010009944 Colon cancer Diseases 0.000 claims description 23
- 208000001333 Colorectal Neoplasms Diseases 0.000 claims description 22
- 102100039554 Galectin-8 Human genes 0.000 claims description 22
- GHASVSINZRGABV-UHFFFAOYSA-N Fluorouracil Chemical compound FC1=CNC(=O)NC1=O GHASVSINZRGABV-UHFFFAOYSA-N 0.000 claims description 20
- 108020004999 messenger RNA Proteins 0.000 claims description 20
- 229960002949 fluorouracil Drugs 0.000 claims description 19
- VVIAGPKUTFNRDU-UHFFFAOYSA-N 6S-folinic acid Natural products C1NC=2NC(N)=NC(=O)C=2N(C=O)C1CNC1=CC=C(C(=O)NC(CCC(O)=O)C(O)=O)C=C1 VVIAGPKUTFNRDU-UHFFFAOYSA-N 0.000 claims description 15
- VVIAGPKUTFNRDU-ABLWVSNPSA-N folinic acid Chemical compound C1NC=2NC(N)=NC(=O)C=2N(C=O)C1CNC1=CC=C(C(=O)N[C@@H](CCC(O)=O)C(O)=O)C=C1 VVIAGPKUTFNRDU-ABLWVSNPSA-N 0.000 claims description 15
- 235000008191 folinic acid Nutrition 0.000 claims description 15
- 239000011672 folinic acid Substances 0.000 claims description 15
- 229960001691 leucovorin Drugs 0.000 claims description 15
- 238000002493 microarray Methods 0.000 claims description 13
- 229960004768 irinotecan Drugs 0.000 claims description 12
- UWKQSNNFCGGAFS-XIFFEERXSA-N irinotecan Chemical compound C1=C2C(CC)=C3CN(C(C4=C([C@@](C(=O)OC4)(O)CC)C=4)=O)C=4C3=NC2=CC=C1OC(=O)N(CC1)CCC1N1CCCCC1 UWKQSNNFCGGAFS-XIFFEERXSA-N 0.000 claims description 12
- 102000004169 proteins and genes Human genes 0.000 claims description 11
- 229960001756 oxaliplatin Drugs 0.000 claims description 10
- DWAFYCQODLXJNR-BNTLRKBRSA-L oxaliplatin Chemical compound O1C(=O)C(=O)O[Pt]11N[C@@H]2CCCC[C@H]2N1 DWAFYCQODLXJNR-BNTLRKBRSA-L 0.000 claims description 10
- 101000808799 Homo sapiens Splicing factor U2AF 35 kDa subunit Proteins 0.000 claims description 8
- 102100038501 Splicing factor U2AF 35 kDa subunit Human genes 0.000 claims description 8
- 238000001262 western blot Methods 0.000 claims description 4
- 102100034124 Golgin subfamily A member 8B Human genes 0.000 claims description 2
- 108010078806 golgin-67 Proteins 0.000 claims description 2
- 230000001173 tumoral effect Effects 0.000 claims description 2
- 238000009104 chemotherapy regimen Methods 0.000 claims 1
- 230000004043 responsiveness Effects 0.000 abstract description 18
- 230000001225 therapeutic effect Effects 0.000 abstract description 11
- 239000000523 sample Substances 0.000 description 112
- 150000007523 nucleic acids Chemical class 0.000 description 61
- 108020004707 nucleic acids Proteins 0.000 description 59
- 102000039446 nucleic acids Human genes 0.000 description 59
- 238000009396 hybridization Methods 0.000 description 46
- 210000001519 tissue Anatomy 0.000 description 43
- 201000011510 cancer Diseases 0.000 description 26
- 239000003814 drug Substances 0.000 description 26
- 108091032973 (ribonucleotides)n+m Proteins 0.000 description 23
- 210000004027 cell Anatomy 0.000 description 15
- 239000003184 complementary RNA Substances 0.000 description 15
- 229940124597 therapeutic agent Drugs 0.000 description 15
- 108020004394 Complementary RNA Proteins 0.000 description 14
- 238000001514 detection method Methods 0.000 description 13
- 239000003795 chemical substances by application Substances 0.000 description 12
- JYEFSHLLTQIXIO-SMNQTINBSA-N folfiri regimen Chemical compound FC1=CNC(=O)NC1=O.C1NC=2NC(N)=NC(=O)C=2N(C=O)C1CNC1=CC=C(C(=O)N[C@@H](CCC(O)=O)C(O)=O)C=C1.C1=C2C(CC)=C3CN(C(C4=C([C@@](C(=O)OC4)(O)CC)C=4)=O)C=4C3=NC2=CC=C1OC(=O)N(CC1)CCC1N1CCCCC1 JYEFSHLLTQIXIO-SMNQTINBSA-N 0.000 description 12
- 238000002560 therapeutic procedure Methods 0.000 description 11
- 108020004414 DNA Proteins 0.000 description 10
- 238000004458 analytical method Methods 0.000 description 10
- 239000003153 chemical reaction reagent Substances 0.000 description 10
- 230000000295 complement effect Effects 0.000 description 10
- 229940079593 drug Drugs 0.000 description 10
- 238000010606 normalization Methods 0.000 description 10
- 239000000758 substrate Substances 0.000 description 10
- 230000003321 amplification Effects 0.000 description 9
- 239000002299 complementary DNA Substances 0.000 description 9
- 239000000203 mixture Substances 0.000 description 9
- 238000003199 nucleic acid amplification method Methods 0.000 description 9
- 238000003491 array Methods 0.000 description 8
- 239000003550 marker Substances 0.000 description 8
- 238000013518 transcription Methods 0.000 description 8
- 230000035897 transcription Effects 0.000 description 8
- 238000004422 calculation algorithm Methods 0.000 description 7
- 208000029742 colonic neoplasm Diseases 0.000 description 7
- 238000002372 labelling Methods 0.000 description 7
- 239000007787 solid Substances 0.000 description 7
- 238000012360 testing method Methods 0.000 description 7
- 238000012549 training Methods 0.000 description 7
- 210000004881 tumor cell Anatomy 0.000 description 7
- YBJHBAHKTGYVGT-ZKWXMUAHSA-N (+)-Biotin Chemical compound N1C(=O)N[C@@H]2[C@H](CCCCC(=O)O)SC[C@@H]21 YBJHBAHKTGYVGT-ZKWXMUAHSA-N 0.000 description 6
- 230000008901 benefit Effects 0.000 description 6
- 238000006243 chemical reaction Methods 0.000 description 6
- 201000010099 disease Diseases 0.000 description 6
- 208000037265 diseases, disorders, signs and symptoms Diseases 0.000 description 6
- 238000010195 expression analysis Methods 0.000 description 6
- 230000036961 partial effect Effects 0.000 description 6
- 238000002360 preparation method Methods 0.000 description 6
- 238000013459 approach Methods 0.000 description 5
- 239000000872 buffer Substances 0.000 description 5
- 230000006870 function Effects 0.000 description 5
- 230000012010 growth Effects 0.000 description 5
- 230000035945 sensitivity Effects 0.000 description 5
- 238000012706 support-vector machine Methods 0.000 description 5
- 238000010200 validation analysis Methods 0.000 description 5
- 102000004190 Enzymes Human genes 0.000 description 4
- 108090000790 Enzymes Proteins 0.000 description 4
- ZHNUHDYFZUAESO-UHFFFAOYSA-N Formamide Chemical compound NC=O ZHNUHDYFZUAESO-UHFFFAOYSA-N 0.000 description 4
- 102000044445 Galectin-8 Human genes 0.000 description 4
- 108020005187 Oligonucleotide Probes Proteins 0.000 description 4
- JLCPHMBAVCMARE-UHFFFAOYSA-N [3-[[3-[[3-[[3-[[3-[[3-[[3-[[3-[[3-[[3-[[3-[[5-(2-amino-6-oxo-1H-purin-9-yl)-3-[[3-[[3-[[3-[[3-[[3-[[5-(2-amino-6-oxo-1H-purin-9-yl)-3-[[5-(2-amino-6-oxo-1H-purin-9-yl)-3-hydroxyoxolan-2-yl]methoxy-hydroxyphosphoryl]oxyoxolan-2-yl]methoxy-hydroxyphosphoryl]oxy-5-(5-methyl-2,4-dioxopyrimidin-1-yl)oxolan-2-yl]methoxy-hydroxyphosphoryl]oxy-5-(6-aminopurin-9-yl)oxolan-2-yl]methoxy-hydroxyphosphoryl]oxy-5-(6-aminopurin-9-yl)oxolan-2-yl]methoxy-hydroxyphosphoryl]oxy-5-(6-aminopurin-9-yl)oxolan-2-yl]methoxy-hydroxyphosphoryl]oxy-5-(6-aminopurin-9-yl)oxolan-2-yl]methoxy-hydroxyphosphoryl]oxyoxolan-2-yl]methoxy-hydroxyphosphoryl]oxy-5-(5-methyl-2,4-dioxopyrimidin-1-yl)oxolan-2-yl]methoxy-hydroxyphosphoryl]oxy-5-(4-amino-2-oxopyrimidin-1-yl)oxolan-2-yl]methoxy-hydroxyphosphoryl]oxy-5-(5-methyl-2,4-dioxopyrimidin-1-yl)oxolan-2-yl]methoxy-hydroxyphosphoryl]oxy-5-(5-methyl-2,4-dioxopyrimidin-1-yl)oxolan-2-yl]methoxy-hydroxyphosphoryl]oxy-5-(6-aminopurin-9-yl)oxolan-2-yl]methoxy-hydroxyphosphoryl]oxy-5-(6-aminopurin-9-yl)oxolan-2-yl]methoxy-hydroxyphosphoryl]oxy-5-(4-amino-2-oxopyrimidin-1-yl)oxolan-2-yl]methoxy-hydroxyphosphoryl]oxy-5-(4-amino-2-oxopyrimidin-1-yl)oxolan-2-yl]methoxy-hydroxyphosphoryl]oxy-5-(4-amino-2-oxopyrimidin-1-yl)oxolan-2-yl]methoxy-hydroxyphosphoryl]oxy-5-(6-aminopurin-9-yl)oxolan-2-yl]methoxy-hydroxyphosphoryl]oxy-5-(4-amino-2-oxopyrimidin-1-yl)oxolan-2-yl]methyl [5-(6-aminopurin-9-yl)-2-(hydroxymethyl)oxolan-3-yl] hydrogen phosphate Polymers Cc1cn(C2CC(OP(O)(=O)OCC3OC(CC3OP(O)(=O)OCC3OC(CC3O)n3cnc4c3nc(N)[nH]c4=O)n3cnc4c3nc(N)[nH]c4=O)C(COP(O)(=O)OC3CC(OC3COP(O)(=O)OC3CC(OC3COP(O)(=O)OC3CC(OC3COP(O)(=O)OC3CC(OC3COP(O)(=O)OC3CC(OC3COP(O)(=O)OC3CC(OC3COP(O)(=O)OC3CC(OC3COP(O)(=O)OC3CC(OC3COP(O)(=O)OC3CC(OC3COP(O)(=O)OC3CC(OC3COP(O)(=O)OC3CC(OC3COP(O)(=O)OC3CC(OC3COP(O)(=O)OC3CC(OC3COP(O)(=O)OC3CC(OC3COP(O)(=O)OC3CC(OC3COP(O)(=O)OC3CC(OC3COP(O)(=O)OC3CC(OC3CO)n3cnc4c(N)ncnc34)n3ccc(N)nc3=O)n3cnc4c(N)ncnc34)n3ccc(N)nc3=O)n3ccc(N)nc3=O)n3ccc(N)nc3=O)n3cnc4c(N)ncnc34)n3cnc4c(N)ncnc34)n3cc(C)c(=O)[nH]c3=O)n3cc(C)c(=O)[nH]c3=O)n3ccc(N)nc3=O)n3cc(C)c(=O)[nH]c3=O)n3cnc4c3nc(N)[nH]c4=O)n3cnc4c(N)ncnc34)n3cnc4c(N)ncnc34)n3cnc4c(N)ncnc34)n3cnc4c(N)ncnc34)O2)c(=O)[nH]c1=O JLCPHMBAVCMARE-UHFFFAOYSA-N 0.000 description 4
- 230000000875 corresponding effect Effects 0.000 description 4
- 238000002651 drug therapy Methods 0.000 description 4
- 238000000338 in vitro Methods 0.000 description 4
- 230000000670 limiting effect Effects 0.000 description 4
- 238000005259 measurement Methods 0.000 description 4
- 239000012528 membrane Substances 0.000 description 4
- 238000010208 microarray analysis Methods 0.000 description 4
- 239000002751 oligonucleotide probe Substances 0.000 description 4
- 238000003752 polymerase chain reaction Methods 0.000 description 4
- 238000000513 principal component analysis Methods 0.000 description 4
- 230000008569 process Effects 0.000 description 4
- 239000000047 product Substances 0.000 description 4
- 230000002441 reversible effect Effects 0.000 description 4
- 150000003839 salts Chemical class 0.000 description 4
- 102000053602 DNA Human genes 0.000 description 3
- 102100034343 Integrase Human genes 0.000 description 3
- 206010027476 Metastases Diseases 0.000 description 3
- 108091034117 Oligonucleotide Proteins 0.000 description 3
- 239000004793 Polystyrene Substances 0.000 description 3
- 239000013614 RNA sample Substances 0.000 description 3
- 108020004682 Single-Stranded DNA Proteins 0.000 description 3
- 239000007801 affinity label Substances 0.000 description 3
- 230000000692 anti-sense effect Effects 0.000 description 3
- 238000003556 assay Methods 0.000 description 3
- 239000012472 biological sample Substances 0.000 description 3
- 238000001574 biopsy Methods 0.000 description 3
- 229960002685 biotin Drugs 0.000 description 3
- 239000011616 biotin Substances 0.000 description 3
- 235000020958 biotin Nutrition 0.000 description 3
- 230000003247 decreasing effect Effects 0.000 description 3
- 238000005516 engineering process Methods 0.000 description 3
- 238000000605 extraction Methods 0.000 description 3
- 239000011521 glass Substances 0.000 description 3
- 238000002955 isolation Methods 0.000 description 3
- 230000003902 lesion Effects 0.000 description 3
- 239000000463 material Substances 0.000 description 3
- 238000012544 monitoring process Methods 0.000 description 3
- 238000007899 nucleic acid hybridization Methods 0.000 description 3
- 230000001575 pathological effect Effects 0.000 description 3
- 229920001184 polypeptide Polymers 0.000 description 3
- 229920002223 polystyrene Polymers 0.000 description 3
- 239000000843 powder Substances 0.000 description 3
- 108090000765 processed proteins & peptides Proteins 0.000 description 3
- 102000004196 processed proteins & peptides Human genes 0.000 description 3
- 230000000717 retained effect Effects 0.000 description 3
- 239000002904 solvent Substances 0.000 description 3
- VGIRNWJSIRVFRT-UHFFFAOYSA-N 2',7'-difluorofluorescein Chemical compound OC(=O)C1=CC=CC=C1C1=C2C=C(F)C(=O)C=C2OC2=CC(O)=C(F)C=C21 VGIRNWJSIRVFRT-UHFFFAOYSA-N 0.000 description 2
- IJGRMHOSHXDMSA-UHFFFAOYSA-N Atomic nitrogen Chemical compound N#N IJGRMHOSHXDMSA-UHFFFAOYSA-N 0.000 description 2
- 206010006187 Breast cancer Diseases 0.000 description 2
- 208000026310 Breast neoplasm Diseases 0.000 description 2
- HEDRZPFGACZZDS-UHFFFAOYSA-N Chloroform Chemical compound ClC(Cl)Cl HEDRZPFGACZZDS-UHFFFAOYSA-N 0.000 description 2
- 102100035186 DNA excision repair protein ERCC-1 Human genes 0.000 description 2
- 102000016928 DNA-directed DNA polymerase Human genes 0.000 description 2
- 108010014303 DNA-directed DNA polymerase Proteins 0.000 description 2
- 102000016911 Deoxyribonucleases Human genes 0.000 description 2
- 108010053770 Deoxyribonucleases Proteins 0.000 description 2
- 108700039887 Essential Genes Proteins 0.000 description 2
- WSFSSNUMVMOOMR-UHFFFAOYSA-N Formaldehyde Chemical compound O=C WSFSSNUMVMOOMR-UHFFFAOYSA-N 0.000 description 2
- 101000876529 Homo sapiens DNA excision repair protein ERCC-1 Proteins 0.000 description 2
- 101710203526 Integrase Proteins 0.000 description 2
- KDXKERNSBIXSRK-YFKPBYRVSA-N L-lysine Chemical compound NCCCC[C@H](N)C(O)=O KDXKERNSBIXSRK-YFKPBYRVSA-N 0.000 description 2
- 239000000020 Nitrocellulose Substances 0.000 description 2
- 101710163270 Nuclease Proteins 0.000 description 2
- 208000007913 Pituitary Neoplasms Diseases 0.000 description 2
- 238000002123 RNA extraction Methods 0.000 description 2
- 108010022394 Threonine synthase Proteins 0.000 description 2
- 102000005497 Thymidylate Synthase Human genes 0.000 description 2
- 239000002246 antineoplastic agent Substances 0.000 description 2
- 239000007864 aqueous solution Substances 0.000 description 2
- 238000010804 cDNA synthesis Methods 0.000 description 2
- 230000021164 cell adhesion Effects 0.000 description 2
- 230000030833 cell death Effects 0.000 description 2
- 230000024245 cell differentiation Effects 0.000 description 2
- 210000003169 central nervous system Anatomy 0.000 description 2
- 210000001072 colon Anatomy 0.000 description 2
- 150000001875 compounds Chemical class 0.000 description 2
- 238000002405 diagnostic procedure Methods 0.000 description 2
- 230000002255 enzymatic effect Effects 0.000 description 2
- 230000008029 eradication Effects 0.000 description 2
- 238000011156 evaluation Methods 0.000 description 2
- 230000001747 exhibiting effect Effects 0.000 description 2
- 230000002496 gastric effect Effects 0.000 description 2
- 238000011223 gene expression profiling Methods 0.000 description 2
- 208000014829 head and neck neoplasm Diseases 0.000 description 2
- 206010020718 hyperplasia Diseases 0.000 description 2
- 238000003364 immunohistochemistry Methods 0.000 description 2
- 238000007901 in situ hybridization Methods 0.000 description 2
- 239000006193 liquid solution Substances 0.000 description 2
- 239000012139 lysis buffer Substances 0.000 description 2
- 230000003211 malignant effect Effects 0.000 description 2
- 230000001404 mediated effect Effects 0.000 description 2
- 229920001220 nitrocellulos Polymers 0.000 description 2
- 108091033319 polynucleotide Proteins 0.000 description 2
- 102000040430 polynucleotide Human genes 0.000 description 2
- 239000002157 polynucleotide Substances 0.000 description 2
- 229920002981 polyvinylidene fluoride Polymers 0.000 description 2
- 238000012545 processing Methods 0.000 description 2
- 238000004393 prognosis Methods 0.000 description 2
- 238000002271 resection Methods 0.000 description 2
- PYWVYCXTNDRMGF-UHFFFAOYSA-N rhodamine B Chemical compound [Cl-].C=12C=CC(=[N+](CC)CC)C=C2OC2=CC(N(CC)CC)=CC=C2C=1C1=CC=CC=C1C(O)=O PYWVYCXTNDRMGF-UHFFFAOYSA-N 0.000 description 2
- 239000002336 ribonucleotide Substances 0.000 description 2
- 238000012216 screening Methods 0.000 description 2
- 239000003001 serine protease inhibitor Substances 0.000 description 2
- 239000007790 solid phase Substances 0.000 description 2
- 238000007619 statistical method Methods 0.000 description 2
- ABZLKHKQJHEPAX-UHFFFAOYSA-N tetramethylrhodamine Chemical compound C=12C=CC(N(C)C)=CC2=[O+]C2=CC(N(C)C)=CC=C2C=1C1=CC=CC=C1C([O-])=O ABZLKHKQJHEPAX-UHFFFAOYSA-N 0.000 description 2
- 230000004797 therapeutic response Effects 0.000 description 2
- 101150090724 3 gene Proteins 0.000 description 1
- IDLISIVVYLGCKO-UHFFFAOYSA-N 6-carboxy-4',5'-dichloro-2',7'-dimethoxyfluorescein Chemical compound O1C(=O)C2=CC=C(C(O)=O)C=C2C21C1=CC(OC)=C(O)C(Cl)=C1OC1=C2C=C(OC)C(O)=C1Cl IDLISIVVYLGCKO-UHFFFAOYSA-N 0.000 description 1
- BZTDTCNHAFUJOG-UHFFFAOYSA-N 6-carboxyfluorescein Chemical compound C12=CC=C(O)C=C2OC2=CC(O)=CC=C2C11OC(=O)C2=CC=C(C(=O)O)C=C21 BZTDTCNHAFUJOG-UHFFFAOYSA-N 0.000 description 1
- 102100021870 ATP synthase subunit O, mitochondrial Human genes 0.000 description 1
- 206010000830 Acute leukaemia Diseases 0.000 description 1
- 208000006468 Adrenal Cortex Neoplasms Diseases 0.000 description 1
- 108020004774 Alkaline Phosphatase Proteins 0.000 description 1
- 102000002260 Alkaline Phosphatase Human genes 0.000 description 1
- 108020005544 Antisense RNA Proteins 0.000 description 1
- 206010003571 Astrocytoma Diseases 0.000 description 1
- 108090001008 Avidin Proteins 0.000 description 1
- 108050001427 Avidin/streptavidin Proteins 0.000 description 1
- 208000032791 BCR-ABL1 positive chronic myelogenous leukemia Diseases 0.000 description 1
- 206010005949 Bone cancer Diseases 0.000 description 1
- 208000018084 Bone neoplasm Diseases 0.000 description 1
- 208000003174 Brain Neoplasms Diseases 0.000 description 1
- 206010006143 Brain stem glioma Diseases 0.000 description 1
- OYPRJOBELJOOCE-UHFFFAOYSA-N Calcium Chemical compound [Ca] OYPRJOBELJOOCE-UHFFFAOYSA-N 0.000 description 1
- CURLTUGMZLYLDI-UHFFFAOYSA-N Carbon dioxide Chemical compound O=C=O CURLTUGMZLYLDI-UHFFFAOYSA-N 0.000 description 1
- 208000017897 Carcinoma of esophagus Diseases 0.000 description 1
- 206010007953 Central nervous system lymphoma Diseases 0.000 description 1
- 208000010833 Chronic myeloid leukaemia Diseases 0.000 description 1
- 102100026735 Coagulation factor VIII Human genes 0.000 description 1
- 102000012410 DNA Ligases Human genes 0.000 description 1
- 108010061982 DNA Ligases Proteins 0.000 description 1
- 102000003915 DNA Topoisomerases Human genes 0.000 description 1
- 108090000323 DNA Topoisomerases Proteins 0.000 description 1
- 238000007399 DNA isolation Methods 0.000 description 1
- 239000003298 DNA probe Substances 0.000 description 1
- 229940123780 DNA topoisomerase I inhibitor Drugs 0.000 description 1
- 102100022334 Dihydropyrimidine dehydrogenase [NADP(+)] Human genes 0.000 description 1
- 108010066455 Dihydrouracil Dehydrogenase (NADP) Proteins 0.000 description 1
- 101100156281 Drosophila melanogaster viaf gene Proteins 0.000 description 1
- 102000001301 EGF receptor Human genes 0.000 description 1
- 108060006698 EGF receptor Proteins 0.000 description 1
- 208000001976 Endocrine Gland Neoplasms Diseases 0.000 description 1
- 241000701867 Enterobacteria phage T7 Species 0.000 description 1
- 208000000461 Esophageal Neoplasms Diseases 0.000 description 1
- 102000010834 Extracellular Matrix Proteins Human genes 0.000 description 1
- 108010037362 Extracellular Matrix Proteins Proteins 0.000 description 1
- 108010054218 Factor VIII Proteins 0.000 description 1
- 102000001690 Factor VIII Human genes 0.000 description 1
- 201000008808 Fibrosarcoma Diseases 0.000 description 1
- 238000000729 Fisher's exact test Methods 0.000 description 1
- 208000022072 Gallbladder Neoplasms Diseases 0.000 description 1
- 101710183811 Glia-derived nexin Proteins 0.000 description 1
- 206010018404 Glucagonoma Diseases 0.000 description 1
- 102100021181 Golgi phosphoprotein 3 Human genes 0.000 description 1
- 208000001258 Hemangiosarcoma Diseases 0.000 description 1
- 206010073073 Hepatobiliary cancer Diseases 0.000 description 1
- 208000017604 Hodgkin disease Diseases 0.000 description 1
- 208000010747 Hodgkins lymphoma Diseases 0.000 description 1
- 101000970995 Homo sapiens ATP synthase subunit O, mitochondrial Proteins 0.000 description 1
- 101000911390 Homo sapiens Coagulation factor VIII Proteins 0.000 description 1
- 101001040734 Homo sapiens Golgi phosphoprotein 3 Proteins 0.000 description 1
- 101000760271 Homo sapiens Zinc finger protein 582 Proteins 0.000 description 1
- 102000008394 Immunoglobulin Fragments Human genes 0.000 description 1
- 108010021625 Immunoglobulin Fragments Proteins 0.000 description 1
- 206010061252 Intraocular melanoma Diseases 0.000 description 1
- 208000009164 Islet Cell Adenoma Diseases 0.000 description 1
- 208000008839 Kidney Neoplasms Diseases 0.000 description 1
- 206010058467 Lung neoplasm malignant Diseases 0.000 description 1
- 208000031422 Lymphocytic Chronic B-Cell Leukemia Diseases 0.000 description 1
- 208000000172 Medulloblastoma Diseases 0.000 description 1
- 206010027406 Mesothelioma Diseases 0.000 description 1
- 206010027457 Metastases to liver Diseases 0.000 description 1
- 208000032818 Microsatellite Instability Diseases 0.000 description 1
- 208000034578 Multiple myelomas Diseases 0.000 description 1
- 208000033761 Myelogenous Chronic BCR-ABL Positive Leukemia Diseases 0.000 description 1
- OKIZCWYLBDKLSU-UHFFFAOYSA-M N,N,N-Trimethylmethanaminium chloride Chemical compound [Cl-].C[N+](C)(C)C OKIZCWYLBDKLSU-UHFFFAOYSA-M 0.000 description 1
- 206010029260 Neuroblastoma Diseases 0.000 description 1
- 208000015914 Non-Hodgkin lymphomas Diseases 0.000 description 1
- 238000000636 Northern blotting Methods 0.000 description 1
- 108020004711 Nucleic Acid Probes Proteins 0.000 description 1
- 239000004677 Nylon Substances 0.000 description 1
- AWZJFZMWSUBJAJ-UHFFFAOYSA-N OG-514 dye Chemical compound OC(=O)CSC1=C(F)C(F)=C(C(O)=O)C(C2=C3C=C(F)C(=O)C=C3OC3=CC(O)=C(F)C=C32)=C1F AWZJFZMWSUBJAJ-UHFFFAOYSA-N 0.000 description 1
- 108700020796 Oncogene Proteins 0.000 description 1
- 206010033128 Ovarian cancer Diseases 0.000 description 1
- 206010061535 Ovarian neoplasm Diseases 0.000 description 1
- 206010061902 Pancreatic neoplasm Diseases 0.000 description 1
- 208000000821 Parathyroid Neoplasms Diseases 0.000 description 1
- 208000002471 Penile Neoplasms Diseases 0.000 description 1
- 102000003992 Peroxidases Human genes 0.000 description 1
- ISWSIDIOOBJBQZ-UHFFFAOYSA-N Phenol Chemical compound OC1=CC=CC=C1 ISWSIDIOOBJBQZ-UHFFFAOYSA-N 0.000 description 1
- 108010004729 Phycoerythrin Proteins 0.000 description 1
- 201000005746 Pituitary adenoma Diseases 0.000 description 1
- 206010061538 Pituitary tumour benign Diseases 0.000 description 1
- 206010035226 Plasma cell myeloma Diseases 0.000 description 1
- 206010060862 Prostate cancer Diseases 0.000 description 1
- 208000000236 Prostatic Neoplasms Diseases 0.000 description 1
- 101710132082 Pyrimidine/purine nucleoside phosphorylase Proteins 0.000 description 1
- 108020005093 RNA Precursors Proteins 0.000 description 1
- 108010092799 RNA-directed DNA polymerase Proteins 0.000 description 1
- 208000015634 Rectal Neoplasms Diseases 0.000 description 1
- 206010038019 Rectal adenocarcinoma Diseases 0.000 description 1
- 208000006265 Renal cell carcinoma Diseases 0.000 description 1
- 201000000582 Retinoblastoma Diseases 0.000 description 1
- 102000006382 Ribonucleases Human genes 0.000 description 1
- 108010083644 Ribonucleases Proteins 0.000 description 1
- 108091028664 Ribonucleotide Proteins 0.000 description 1
- 101710187074 Serine proteinase inhibitor Proteins 0.000 description 1
- 108050000761 Serpin Proteins 0.000 description 1
- 102000008847 Serpin Human genes 0.000 description 1
- 208000000453 Skin Neoplasms Diseases 0.000 description 1
- 206010041067 Small cell lung cancer Diseases 0.000 description 1
- 208000021712 Soft tissue sarcoma Diseases 0.000 description 1
- 208000005718 Stomach Neoplasms Diseases 0.000 description 1
- 108010090804 Streptavidin Proteins 0.000 description 1
- 238000000692 Student's t-test Methods 0.000 description 1
- 101710137500 T7 RNA polymerase Proteins 0.000 description 1
- 208000024313 Testicular Neoplasms Diseases 0.000 description 1
- 206010057644 Testis cancer Diseases 0.000 description 1
- 102000013537 Thymidine Phosphorylase Human genes 0.000 description 1
- 208000024770 Thyroid neoplasm Diseases 0.000 description 1
- 239000000365 Topoisomerase I Inhibitor Substances 0.000 description 1
- GYDJEQRTZSCIOI-UHFFFAOYSA-N Tranexamic acid Chemical compound NCC1CCC(C(O)=O)CC1 GYDJEQRTZSCIOI-UHFFFAOYSA-N 0.000 description 1
- 108010046334 Urease Proteins 0.000 description 1
- 208000023915 Ureteral Neoplasms Diseases 0.000 description 1
- 206010046458 Urethral neoplasms Diseases 0.000 description 1
- 208000007097 Urinary Bladder Neoplasms Diseases 0.000 description 1
- 208000002495 Uterine Neoplasms Diseases 0.000 description 1
- 201000005969 Uveal melanoma Diseases 0.000 description 1
- 201000003761 Vaginal carcinoma Diseases 0.000 description 1
- 108010073929 Vascular Endothelial Growth Factor A Proteins 0.000 description 1
- 102000005789 Vascular Endothelial Growth Factors Human genes 0.000 description 1
- 108010019530 Vascular Endothelial Growth Factors Proteins 0.000 description 1
- 108010003205 Vasoactive Intestinal Peptide Proteins 0.000 description 1
- 102400000015 Vasoactive intestinal peptide Human genes 0.000 description 1
- 238000001793 Wilcoxon signed-rank test Methods 0.000 description 1
- 102100024716 Zinc finger protein 582 Human genes 0.000 description 1
- 230000009471 action Effects 0.000 description 1
- 239000000853 adhesive Substances 0.000 description 1
- 230000001070 adhesive effect Effects 0.000 description 1
- 239000002671 adjuvant Substances 0.000 description 1
- 238000011226 adjuvant chemotherapy Methods 0.000 description 1
- 208000024447 adrenal gland neoplasm Diseases 0.000 description 1
- 230000004075 alteration Effects 0.000 description 1
- 230000033115 angiogenesis Effects 0.000 description 1
- 229940041181 antineoplastic drug Drugs 0.000 description 1
- 239000012736 aqueous medium Substances 0.000 description 1
- 210000003567 ascitic fluid Anatomy 0.000 description 1
- 229940120638 avastin Drugs 0.000 description 1
- 229960000397 bevacizumab Drugs 0.000 description 1
- 230000008827 biological function Effects 0.000 description 1
- 230000031018 biological processes and functions Effects 0.000 description 1
- 230000015572 biosynthetic process Effects 0.000 description 1
- 210000004369 blood Anatomy 0.000 description 1
- 239000008280 blood Substances 0.000 description 1
- 210000000601 blood cell Anatomy 0.000 description 1
- 210000004204 blood vessel Anatomy 0.000 description 1
- 238000004364 calculation method Methods 0.000 description 1
- 230000005773 cancer-related death Effects 0.000 description 1
- 208000001969 capillary hemangioma Diseases 0.000 description 1
- 235000011089 carbon dioxide Nutrition 0.000 description 1
- 231100000504 carcinogenesis Toxicity 0.000 description 1
- 208000002458 carcinoid tumor Diseases 0.000 description 1
- 230000022131 cell cycle Effects 0.000 description 1
- 230000001413 cellular effect Effects 0.000 description 1
- 230000036755 cellular response Effects 0.000 description 1
- 208000025997 central nervous system neoplasm Diseases 0.000 description 1
- 208000019065 cervical carcinoma Diseases 0.000 description 1
- 229960005395 cetuximab Drugs 0.000 description 1
- 230000008859 change Effects 0.000 description 1
- 239000007795 chemical reaction product Substances 0.000 description 1
- 230000005929 chemotherapeutic response Effects 0.000 description 1
- 230000001684 chronic effect Effects 0.000 description 1
- 208000024207 chronic leukemia Diseases 0.000 description 1
- 238000011281 clinical therapy Methods 0.000 description 1
- 239000003283 colorimetric indicator Substances 0.000 description 1
- 210000002808 connective tissue Anatomy 0.000 description 1
- 230000002596 correlated effect Effects 0.000 description 1
- 239000003431 cross linking reagent Substances 0.000 description 1
- 238000002790 cross-validation Methods 0.000 description 1
- 208000030381 cutaneous melanoma Diseases 0.000 description 1
- 231100000433 cytotoxic Toxicity 0.000 description 1
- 229940127089 cytotoxic agent Drugs 0.000 description 1
- 230000001472 cytotoxic effect Effects 0.000 description 1
- 238000007405 data analysis Methods 0.000 description 1
- 230000034994 death Effects 0.000 description 1
- 231100000517 death Toxicity 0.000 description 1
- 238000001739 density measurement Methods 0.000 description 1
- 238000011161 development Methods 0.000 description 1
- 230000018109 developmental process Effects 0.000 description 1
- 238000010586 diagram Methods 0.000 description 1
- 230000029087 digestion Effects 0.000 description 1
- 239000000890 drug combination Substances 0.000 description 1
- 230000002183 duodenal effect Effects 0.000 description 1
- 230000000694 effects Effects 0.000 description 1
- 238000005401 electroluminescence Methods 0.000 description 1
- 201000011523 endocrine gland cancer Diseases 0.000 description 1
- 210000000750 endocrine system Anatomy 0.000 description 1
- 201000003914 endometrial carcinoma Diseases 0.000 description 1
- 229940082789 erbitux Drugs 0.000 description 1
- 210000002744 extracellular matrix Anatomy 0.000 description 1
- 229960000301 factor viii Drugs 0.000 description 1
- 201000001343 fallopian tube carcinoma Diseases 0.000 description 1
- 238000011354 first-line chemotherapy Methods 0.000 description 1
- 239000012530 fluid Substances 0.000 description 1
- 239000012634 fragment Substances 0.000 description 1
- 201000010175 gallbladder cancer Diseases 0.000 description 1
- 206010017758 gastric cancer Diseases 0.000 description 1
- 201000011243 gastrointestinal stromal tumor Diseases 0.000 description 1
- 238000003500 gene array Methods 0.000 description 1
- 230000004547 gene signature Effects 0.000 description 1
- PCHJSUWPFVWCPO-UHFFFAOYSA-N gold Chemical compound [Au] PCHJSUWPFVWCPO-UHFFFAOYSA-N 0.000 description 1
- 201000002222 hemangioblastoma Diseases 0.000 description 1
- 201000011066 hemangioma Diseases 0.000 description 1
- 230000002440 hepatic effect Effects 0.000 description 1
- 238000007417 hierarchical cluster analysis Methods 0.000 description 1
- 238000000265 homogenisation Methods 0.000 description 1
- 229940088597 hormone Drugs 0.000 description 1
- 239000005556 hormone Substances 0.000 description 1
- 230000002390 hyperplastic effect Effects 0.000 description 1
- 230000002055 immunohistochemical effect Effects 0.000 description 1
- 238000011532 immunohistochemical staining Methods 0.000 description 1
- 238000001727 in vivo Methods 0.000 description 1
- 230000000977 initiatory effect Effects 0.000 description 1
- 238000002347 injection Methods 0.000 description 1
- 239000007924 injection Substances 0.000 description 1
- 206010022498 insulinoma Diseases 0.000 description 1
- 102000006495 integrins Human genes 0.000 description 1
- 108010044426 integrins Proteins 0.000 description 1
- 230000003993 interaction Effects 0.000 description 1
- 230000002601 intratumoral effect Effects 0.000 description 1
- VBUWHHLIZKOSMS-RIWXPGAOSA-N invicorp Chemical compound C([C@@H](C(=O)N[C@@H](CC(C)C)C(=O)N[C@@H](CC(N)=O)C(=O)N[C@@H](CO)C(=O)N[C@@H]([C@@H](C)CC)C(=O)N[C@@H](CC(C)C)C(=O)N[C@@H](CC(N)=O)C(O)=O)NC(=O)[C@H](CCCCN)NC(=O)[C@H](CCCCN)NC(=O)[C@@H](NC(=O)[C@H](C)NC(=O)[C@H](CCSC)NC(=O)[C@H](CCC(N)=O)NC(=O)[C@H](CCCCN)NC(=O)[C@H](CCCNC(N)=N)NC(=O)[C@H](CC(C)C)NC(=O)[C@H](CCCNC(N)=N)NC(=O)[C@@H](NC(=O)[C@H](CC=1C=CC(O)=CC=1)NC(=O)[C@H](CC(N)=O)NC(=O)[C@H](CC(O)=O)NC(=O)[C@@H](NC(=O)[C@H](CC=1C=CC=CC=1)NC(=O)[C@@H](NC(=O)[C@H](C)NC(=O)[C@H](CC(O)=O)NC(=O)[C@H](CO)NC(=O)[C@@H](N)CC=1NC=NC=1)C(C)C)[C@@H](C)O)[C@@H](C)O)C(C)C)C1=CC=C(O)C=C1 VBUWHHLIZKOSMS-RIWXPGAOSA-N 0.000 description 1
- 230000037427 ion transport Effects 0.000 description 1
- 201000002529 islet cell tumor Diseases 0.000 description 1
- 239000007788 liquid Substances 0.000 description 1
- 238000001459 lithography Methods 0.000 description 1
- 201000007270 liver cancer Diseases 0.000 description 1
- 208000014018 liver neoplasm Diseases 0.000 description 1
- 201000005202 lung cancer Diseases 0.000 description 1
- 208000020816 lung neoplasm Diseases 0.000 description 1
- 210000001165 lymph node Anatomy 0.000 description 1
- 239000006166 lysate Substances 0.000 description 1
- 208000015486 malignant pancreatic neoplasm Diseases 0.000 description 1
- 208000026037 malignant tumor of neck Diseases 0.000 description 1
- 239000011159 matrix material Substances 0.000 description 1
- 206010027191 meningioma Diseases 0.000 description 1
- 238000012775 microarray technology Methods 0.000 description 1
- 210000004088 microvessel Anatomy 0.000 description 1
- 238000012986 modification Methods 0.000 description 1
- 230000004048 modification Effects 0.000 description 1
- 239000002991 molded plastic Substances 0.000 description 1
- 238000010369 molecular cloning Methods 0.000 description 1
- 239000013642 negative control Substances 0.000 description 1
- 230000009826 neoplastic cell growth Effects 0.000 description 1
- 230000001613 neoplastic effect Effects 0.000 description 1
- 229910052757 nitrogen Inorganic materials 0.000 description 1
- 208000002154 non-small cell lung carcinoma Diseases 0.000 description 1
- 239000002853 nucleic acid probe Substances 0.000 description 1
- 239000002773 nucleotide Substances 0.000 description 1
- 125000003729 nucleotide group Chemical class 0.000 description 1
- 229920001778 nylon Polymers 0.000 description 1
- 201000002575 ocular melanoma Diseases 0.000 description 1
- 238000002966 oligonucleotide array Methods 0.000 description 1
- 238000011275 oncology therapy Methods 0.000 description 1
- 238000005457 optimization Methods 0.000 description 1
- VYNDHICBIRRPFP-UHFFFAOYSA-N pacific blue Chemical compound FC1=C(O)C(F)=C2OC(=O)C(C(=O)O)=CC2=C1 VYNDHICBIRRPFP-UHFFFAOYSA-N 0.000 description 1
- 201000002528 pancreatic cancer Diseases 0.000 description 1
- 208000008443 pancreatic carcinoma Diseases 0.000 description 1
- 230000009996 pancreatic endocrine effect Effects 0.000 description 1
- 208000021255 pancreatic insulinoma Diseases 0.000 description 1
- 208000022102 pancreatic neuroendocrine neoplasm Diseases 0.000 description 1
- 210000002990 parathyroid gland Anatomy 0.000 description 1
- 230000007170 pathology Effects 0.000 description 1
- 108040007629 peroxidase activity proteins Proteins 0.000 description 1
- 230000002974 pharmacogenomic effect Effects 0.000 description 1
- 208000028591 pheochromocytoma Diseases 0.000 description 1
- 208000021310 pituitary gland adenoma Diseases 0.000 description 1
- 210000004910 pleural fluid Anatomy 0.000 description 1
- 229920000435 poly(dimethylsiloxane) Polymers 0.000 description 1
- 229920003229 poly(methyl methacrylate) Polymers 0.000 description 1
- 229920002401 polyacrylamide Polymers 0.000 description 1
- 229920000642 polymer Polymers 0.000 description 1
- 239000004926 polymethyl methacrylate Substances 0.000 description 1
- 239000004800 polyvinyl chloride Substances 0.000 description 1
- 229920000915 polyvinyl chloride Polymers 0.000 description 1
- 239000013641 positive control Substances 0.000 description 1
- 238000011248 postoperative chemotherapy Methods 0.000 description 1
- 230000002980 postoperative effect Effects 0.000 description 1
- 238000011249 preoperative chemoradiotherapy Methods 0.000 description 1
- 208000016800 primary central nervous system lymphoma Diseases 0.000 description 1
- 238000002331 protein detection Methods 0.000 description 1
- 238000000746 purification Methods 0.000 description 1
- 238000011002 quantification Methods 0.000 description 1
- 238000004445 quantitative analysis Methods 0.000 description 1
- 239000010453 quartz Substances 0.000 description 1
- 238000003753 real-time PCR Methods 0.000 description 1
- 102000005962 receptors Human genes 0.000 description 1
- 108020003175 receptors Proteins 0.000 description 1
- 206010038038 rectal cancer Diseases 0.000 description 1
- 201000001281 rectum adenocarcinoma Diseases 0.000 description 1
- 201000001275 rectum cancer Diseases 0.000 description 1
- 230000009467 reduction Effects 0.000 description 1
- 230000002829 reductive effect Effects 0.000 description 1
- 230000037425 regulation of transcription Effects 0.000 description 1
- 201000007444 renal pelvis carcinoma Diseases 0.000 description 1
- 230000010076 replication Effects 0.000 description 1
- 238000011160 research Methods 0.000 description 1
- 238000003757 reverse transcription PCR Methods 0.000 description 1
- 238000012552 review Methods 0.000 description 1
- 238000000926 separation method Methods 0.000 description 1
- 230000019491 signal transduction Effects 0.000 description 1
- VYPSYNLAJGMNEJ-UHFFFAOYSA-N silicon dioxide Inorganic materials O=[Si]=O VYPSYNLAJGMNEJ-UHFFFAOYSA-N 0.000 description 1
- 238000005549 size reduction Methods 0.000 description 1
- 201000000849 skin cancer Diseases 0.000 description 1
- 201000003708 skin melanoma Diseases 0.000 description 1
- 210000000813 small intestine Anatomy 0.000 description 1
- 239000000243 solution Substances 0.000 description 1
- 241000894007 species Species 0.000 description 1
- 238000011255 standard chemotherapy Methods 0.000 description 1
- 238000011272 standard treatment Methods 0.000 description 1
- 238000000528 statistical test Methods 0.000 description 1
- 201000011549 stomach cancer Diseases 0.000 description 1
- 238000001356 surgical procedure Methods 0.000 description 1
- 230000002459 sustained effect Effects 0.000 description 1
- 230000001360 synchronised effect Effects 0.000 description 1
- 238000003786 synthesis reaction Methods 0.000 description 1
- 238000012353 t test Methods 0.000 description 1
- 230000008685 targeting Effects 0.000 description 1
- 201000003120 testicular cancer Diseases 0.000 description 1
- MPLHNVLQVRSVEE-UHFFFAOYSA-N texas red Chemical compound [O-]S(=O)(=O)C1=CC(S(Cl)(=O)=O)=CC=C1C(C1=CC=2CCCN3CCCC(C=23)=C1O1)=C2C1=C(CCC1)C3=[N+]1CCCC3=C2 MPLHNVLQVRSVEE-UHFFFAOYSA-N 0.000 description 1
- 238000011285 therapeutic regimen Methods 0.000 description 1
- 210000001685 thyroid gland Anatomy 0.000 description 1
- 229960000303 topotecan Drugs 0.000 description 1
- UCFGDBYHRUNTLO-QHCPKHFHSA-N topotecan Chemical compound C1=C(O)C(CN(C)C)=C2C=C(CN3C4=CC5=C(C3=O)COC(=O)[C@]5(O)CC)C4=NC2=C1 UCFGDBYHRUNTLO-QHCPKHFHSA-N 0.000 description 1
- 230000002103 transcriptional effect Effects 0.000 description 1
- 238000012546 transfer Methods 0.000 description 1
- 238000011269 treatment regimen Methods 0.000 description 1
- 238000000870 ultraviolet spectroscopy Methods 0.000 description 1
- 210000000626 ureter Anatomy 0.000 description 1
- 210000002700 urine Anatomy 0.000 description 1
- 206010046766 uterine cancer Diseases 0.000 description 1
- 210000003556 vascular endothelial cell Anatomy 0.000 description 1
- 230000016776 visual perception Effects 0.000 description 1
- 208000013013 vulvar carcinoma Diseases 0.000 description 1
Classifications
-
- C—CHEMISTRY; METALLURGY
- C12—BIOCHEMISTRY; BEER; SPIRITS; WINE; VINEGAR; MICROBIOLOGY; ENZYMOLOGY; MUTATION OR GENETIC ENGINEERING
- C12Q—MEASURING OR TESTING PROCESSES INVOLVING ENZYMES, NUCLEIC ACIDS OR MICROORGANISMS; COMPOSITIONS OR TEST PAPERS THEREFOR; PROCESSES OF PREPARING SUCH COMPOSITIONS; CONDITION-RESPONSIVE CONTROL IN MICROBIOLOGICAL OR ENZYMOLOGICAL PROCESSES
- C12Q1/00—Measuring or testing processes involving enzymes, nucleic acids or microorganisms; Compositions therefor; Processes of preparing such compositions
- C12Q1/68—Measuring or testing processes involving enzymes, nucleic acids or microorganisms; Compositions therefor; Processes of preparing such compositions involving nucleic acids
- C12Q1/6876—Nucleic acid products used in the analysis of nucleic acids, e.g. primers or probes
- C12Q1/6883—Nucleic acid products used in the analysis of nucleic acids, e.g. primers or probes for diseases caused by alterations of genetic material
- C12Q1/6886—Nucleic acid products used in the analysis of nucleic acids, e.g. primers or probes for diseases caused by alterations of genetic material for cancer
-
- A—HUMAN NECESSITIES
- A61—MEDICAL OR VETERINARY SCIENCE; HYGIENE
- A61P—SPECIFIC THERAPEUTIC ACTIVITY OF CHEMICAL COMPOUNDS OR MEDICINAL PREPARATIONS
- A61P35/00—Antineoplastic agents
-
- C—CHEMISTRY; METALLURGY
- C12—BIOCHEMISTRY; BEER; SPIRITS; WINE; VINEGAR; MICROBIOLOGY; ENZYMOLOGY; MUTATION OR GENETIC ENGINEERING
- C12Q—MEASURING OR TESTING PROCESSES INVOLVING ENZYMES, NUCLEIC ACIDS OR MICROORGANISMS; COMPOSITIONS OR TEST PAPERS THEREFOR; PROCESSES OF PREPARING SUCH COMPOSITIONS; CONDITION-RESPONSIVE CONTROL IN MICROBIOLOGICAL OR ENZYMOLOGICAL PROCESSES
- C12Q2600/00—Oligonucleotides characterized by their use
- C12Q2600/106—Pharmacogenomics, i.e. genetic variability in individual responses to drugs and drug metabolism
Definitions
- the present invention relates generally to the field of cancer biology. More particularly, it concerns gene expression profiles that are indicative of the responsiveness of a patient having cancer to drug therapy.
- CRC Colorectal cancer
- the combinations commonly used e.g., irinotecan, fluorouracil, and Jeucovorin (FOLFIRI) and oxaliplatin, fluorouracil, and leucovorin (FOLFOX) can reach an objective response rate of about 50% (DouiJlard JY, et al., 2000, Lancet 355 (9209):1041-7; Goldberg RM, et al., 2004, J Clin. Oncol. 22(1):23-30).
- these new combinations remain inactive in one half of the patients and, in addition, resistance to treatment appear in almost all patients who were initially responders.
- microsatellite-instability status could be an independent predictor of fluorouracil-based adjuvant chemotherapy (Ribic CM, et al., 2003, N. Engl. J. Med.349(3):247-57).
- Topoisomerase I expression has been investigated as predictive factor for irinotecan response (Paradiso A, et al., 2004, Int. J. ⁇ Cancer 111 (2):252-8).
- complementation group 1 includes overlapping antisense sequence
- TS thymidylate synthase
- the present invention relates generally to the fields of molecular genetics, pharmacogenetics, and cancer therapy.
- the present invention is directed to methods for detecting gene expression and correlating the presence or absence of certain genes with responsiveness to chemotherapy.
- Embodiments of the invention include methods for assessing the responsiveness of a tumor to therapy.
- the methods comprise obtaining a sample of a tumor from a patient; evaluating the sample for expression of one or more markers identified in Table 3; and assessing the responsiveness of the tumor to therapy based on the evaluation of marker expression in the sample.
- Marker herein refers to a gene or gene product (RNA or polypeptide) whose expression is related to response of a cancer to a therapy, either a positive (complete pathological response) or a negative response (residual disease). Expression of a marker may be assessed by detecting polynucleotides or polypeptides derived therefrom. More specifically, the present invention is directed to methods for determining the expression of one or more of the genes listed in Table 3 in a patient with colorectal cancer, and correlating the expression with responsiveness to chemotherapy regimes. The intensity of gene expression detected can be indicative of whether a patient will be a responder or non-responder to a chemotherapy regime.
- the present invention identifies gene expression profiles associated with colorectal cancer patients who respond to certain pharmaceutical regimes by examining gene expression in tissue from malignant colorectal tissue (primary tumor) of said patients who respond to treatment and those who do not.
- the present invention also identifies expression profiles which serve as useful diagnostic markers to treatment response and drug efficacy.
- the present invention also preferably provides a method to assess the responsiveness of a patient with metastatic colorectal cancer to drug therapy.
- the tumor comprises colorectal cancer.
- the tumor is sampled by aspiration, biopsy, or surgical resection.
- Embodiments of the invention include assessing the expression of the one or more markers by detecting a mRNA derived from one or more markers.
- detection comprises microarray analysis, and more preferably the microarray is an Affymetrix Gene Chip.
- detection comprises nucleic acid amplification, preferably PCR.
- detection is by in situ hybridization.
- assessing the expression of one or more markers is by detecting a protein derived from a gene identified as a marker. A protein may be detected by immunohistochemistry, western blotting, or other known protein detection means.
- a further embodiment includes methods of monitoring a cancer patient receiving chemotherapy.
- Methods of monitoring a cancer patient comprise obtaining a tumor sample from the.patient during chemotherapy; evaluating expression of one or more markers of Table 3 in the tumor sample; and assessing the cancer patient's responsiveness to chemotherapy.
- a tumor sample may be obtained, evaluated and assessed repeatedly at various time points during chemotherapy (e.g. before, during, and after drug treatment).
- the present invention includes a method of predicting response of a human patient with metastatic colorectal cancer to chemotherapy, comprising detecting the expression of one or more genes selected from the following group LGALS8, SERPINE2, ANGPTL2, ATP50, PRYM, EML2, F8, U2AF1L2, DRD5, GOLGIN-67, ZNF32, PSG9, BOLL, and ZNF583 from a tissue sample from the patient wherein said gene expression is indicative of response to chemotherapy.
- Another aspect of the invention includes a method of predicting response of a human patient with metastatic colorectal cancer to chemotherapy, comprising detecting the expression of two or more genes selected from the group LGALS8, SERPINE2, ANGPTL2, ATP50, PRYM.
- a method of predicting response of a human patient with metastatic colorectal cancer to chemotherapy comprising detecting the expression of three or more genes selected from the group LGALS8, SERPINE ⁇ 2.
- ZNF32, PSG9, BOLL, and 2NF583 from a tissue sample from the patient wherein said gene expression is indicative of response to chemotherapy is included.
- a further aspect of the invention includes a method of predicting response of a human patient with metastatic colorectal cancer to chemotherapy, comprising detecting the expression of four or more genes selected from the group LGALS8, SERPINK, ANGPTL2, ATP50, PRYM, EML2, F8, U2AF1L2, DRD5, GOLGIN-67, 2NF32, PSG9, BOLL, and ZNF583 from a tissue sample from the patient wherein said gene expression is indicative of response to chemotherapy.
- This invention also includes a method of predicting response of a human patient with metastatic colorectal cancer to chemotherapy, comprising detecting the expression of five or more genes selected from the group LGALS8, SERPINE2, ANGPTL2, ATP50, PRYM, EML2, F8, U2AF1L2, DRD5, GOLGIN-67, 2NF32, PSG9, BOLL, and 2NF583 from a tissue sample from the patient wherein said gene expression is indicative of response to chemotherapy.
- Another aspect of the invention includes a method of predicting response of a human patient with metastatic colorectal cancer to chemotherapy, comprising detecting the expression of six or more genes selected from the group LGALS8, SERPfNE2, ANGPTL2, ATP50, PRYM, EML2, F8, U2AF1L2, DRD5, GOLGIN-67, ZNF32, PSG9, BOLL, and ZNF583 from a tissue sample from the patient wherein said gene expression is indicative of response to chemotherapy.
- the invention also includes a method of predicting response of a human patient with metastatic colorectal cancer to chemotherapy, comprising detecting the expression of seven or more genes selected from the group LGALS8, SERPINE2, ANGPTL2, ATP50, PRYM, EML2, F8. U2AF1 L2, DRD5, GOLGIN-67, ZNF32, PSG9, BOLL, and ZNF583 from a tissue sample from the patient wherein said gene expression is indicative of response to chemotherapy.
- Another aspect of the invention includes a method of predicting response of a human patient with metastatic colorectal cancer to chemotherapy, comprising detecting the
- the invention includes a method of predicting response of a human patient with metastatic colorectal cancer to chemotherapy, comprising detecting the expression of nine or more genes selected from the group LGALS8, SERPINE2, ANGPTL2, ATP50, PRYM, EML2, F8, U2AF1L2. DRD5, GOLGIN-67, ZNF32, PSG9, BOLL, and ZNF583 from a tissue sample from the patient wherein said gene expression is indicative of response 0 to chemotherapy.
- One embodiment of the invention includes a method of predicting response of a human patient with metastatic colorectal cancer to chemotherapy, comprising detecting the expression of ten or more genes selected from the group LGALS8, SERPINE2, ANGPTL2, ATP50, PRYM, EML2, F8, U2AF1L2, DRD5, GOLGIN-67, ZNF32, PSG9, BOLL, andZNF583 from a tissue sample from the patient wherein said gene expression is indicative of response to chemotherapy.
- Jn another embodiment of the invention a method of predicting response of a human patient with metastatic colorectal cancer to chemotherapy, comprising detecting the expression of eleven or more genes selected from the group LGALS8, SERPINE2, ANGPTL2, ATP50, PRYM, EML2, F8, U2AF1 L2, DRD5, GOLGIN-67, ZNF32, PSG9, BOLL, and ZNF583 from a tissue sample from the patient wherein said gene expression is indicative of response to chemotherapy in included.
- a further embodiment of the invention includes a method of predicting response of a human patient with metastatic colorectal cancer to chemotherapy, comprising detecting the expression of twelve or more genes selected from the group LGALS8, SERPINE2, ANGPTL2, ATP50, PRYM, EML2, F8, U2AF1L2, DRD5, GOLGIN-67, ZNF32, PSG9, BOLL, and ZNF583 from a tissue sample from the patient wherein said gene expression is indicative of response to chemotherapy.
- Yet another aspect of the invention includes a method of predicting response of a human patient with metastatic colorectal cancer to chemotherapy, comprising detecting the expression of thirteen or more genes selected from the group LGALS8, SERPINE2, . ANGPTL2, ATP50, PRYM, EML2, F8. U2AF1L2. DRD5. GOLGIN-67, ZNF32, PSG9. BOLL, and ZNF583 from a tissue sample from the patient wherein said gene expression is indicative of response to chemotherapy.
- Another aspect of the invention includes a method of predicting response of a human patient with metastatic colorectal cancer to chemotherapy, comprising detecting the expression of fourteen or more genes selected from the group LGALS8, SERPIN E ⁇ 2, ANGPTL2, ATP50, PRYM, EML2, F8. U2AF1L2, DRD5, GOLGIN-67, ZNF32, PSG9, BOLL, and ZNF583 from a tissue sample from the patient wherein said gene expression is indicative of response to chemotherapy.
- This invention also includes a method of predicting response of a human patient with metastatic colorectal cancer to chemotherapy, comprising detecting the expression of a gene selected from the group SERPINE2, ANGPTL2, ATP50, PRYM, EML2, F8, U2AF1L2, DRD5, GOLGIN-67, ZNF32, PSG9, BOLL, and ZNF583 from a tissue sample from the patient wherein said gene expression is indicative of response to chemotherapy.
- a gene selected from the group SERPINE2, ANGPTL2, ATP50, PRYM, EML2, F8, U2AF1L2, DRD5, GOLGIN-67, ZNF32, PSG9, BOLL, and ZNF583
- the method can be used to predict response of a human patient with metastatic colorectal cancer to chemotherapy, comprising detecting the expression of a gene selected from the group ANGPTL2, ATP50, PRYM, EML2, F8, U2AF1 L2, DRD5, GOLGIN-67, ZNF32, PSG9, BOLL, and ZNF583 from a tissue sample from the patient wherein said gene expression is indicative of response to chemotherapy.
- Another embodiment of the invention includes a method of predicting the response of a human patient with metastatic colorectal cancer to chemotherapy, comprising detecting the expression of a gene selected from the group ATP50, PRYM, EML2, F8, U2AF1L2, DRD5, GOLGIN-67, ZNF32, PSG9, BOLL, and ZNF583 from a tissue sample from the patient wherein said gene expression is indicative of response to chemotherapy.
- a further embodiment of the invention includes a method of predicting response of a human patient with metastatic colorectal cancer to chemotherapy, comprising detecting the expression of a gene selected from the group PRYM, EML2, F8, U2AF1L2, DRD5, GOLGIN- 67, ZNF32, PSG9, BOLL, and ZNF583 from a tissue sample from the patient wherein said gene expression is indicative of response to chemotherapy
- Another aspect of the invention includes a method of predicting response of a human patient with metastatic colorectal cancer to chemotherapy, comprising detecting the expression of a gene selected from the group EML2, F8, U2AF1 L2, DRD5, GOLGIN-67, ZNF32, PSG9, BOLL, and ZNF583 from a tissue sample from the patient wherein said gene expression is indicative of response to chemotherapy
- Yet another embodiment of the invention includes a method of predicting response of a human patient with metastatic colorectal cancer to chemotherapy, comprising detecting the expression of a gene selected from the group F8, U2AF1L2, DRD5, GOLGIN-67, ZNF32,
- Another aspect of the invention includes a method of predicting response of a human patient with metastatic colorectal cancer to chemotherapy, comprising detecting the expression of a gene selected from the group U2AF1 L2, DRD5, GOLGIN-67, ZNF32, PSG9, BOLL, and ZNF583 from a tissue sample from the patient wherein said gene expression is indicative of response to chemotherapy
- a further aspect of the invention includes a method of predicting response of a human patient with metastatic colorectal cancer to chemotherapy, comprising detecting the expression of a gene selected from the group DRD5, GOLGIN-67, ZNF32, PSG9, BOLL, and ZNF583 from a tissue sample from the patient wherein said gene expression is indicative of response to chemotherapy
- Another embodiment of the invention includes a method of predicting response of a human patient with metastatic colorectal cancer to chemotherapy, comprising detecting the expression of a gene selected from the group GOLGIN-67, ZNF32, PSG9, BOLL, and ZNF583 from a tissue sample from the patient wherein said gene expression is indicative of response to chemotherapy
- Another embodiment of the invention includes a method of predicting response of a human patient with metastatic colorectal cancer to chemotherapy, comprising detecting the expression of a gene selected from the group ZNF32, PSG9, BOLL, and ZNF583 from a tissue sample from the patient wherein said gene expression is indicative of response to chemotherapy
- This invention also includes a method of predicting response of a human patient with metastatic colorectal cancer to chemotherapy, comprising detecting the expression of a gene selected from the group PSG9, BOLL, and ZNF583 from a tissue sample from the patient wherein said gene expression is indicative of response to chemotherapy
- Another aspect of the invention includes a method of predicting response of a human patient with metastatic colorectal cancer to chemotherapy, comprising detecting the expression of a gene selected from the group BOLL, and ZNF583 from a tissue sample from the patient wherein said gene expression is indicative of response to chemotherapy
- a further aspect of the invention includes methods of predicting response of a human patient with metastatic colorectal cancer to chemotherapy that comprises administering a pharmaceutical regimen of irinotecan, fluorouracil, and leucovorin to the patient.
- the methods can also be used to predict response of a human patient with metastatic colorectal cancer to
- chemotherapy that comprises administering a pharmaceutical regimen of oxaliplatin, fluorouracil, and leucovorin to the patient.
- This invention also provides for methods of assessing the expression of the one or more of the genes in Table 3 by detecting a protein derived from a gene identified as a marker derived from a sample from said human.
- the present invention provides a method of determining a chemotherapy regime for a human patient with metastatic colorectal cancer, comprising detecting the expression of the genes selected from LGALS8, SERPINE2, ANGPTL2, ATP50, PRYM, EML2, F8, U2AF1L2, DRD5, GOLGIN-67, ZNF32, PSG9, BOLL, and ZNF583 from a colon tumor tissue sample from the patient wherein said gene expression is indicative of response to chemotherapy; and administering a pharmaceutical regimen comprising irinotecan, fluorouracil, and leucovorin to said patient if the predictor classifier (previously determined using the SVM-learning algorithm) applied to the expression of the fourteen genes from Table 3 from a tumor tissue sample from the patient classifies the patient as responder patient.
- the predictor classifier previously determined using the SVM-learning algorithm
- the Support Vector Machines are a new type of learning algorithm initiated by Vapnik (1995) and then applied to the microarray data analysis (Ben-Dor et al., 2000, Journal of the Computational Biology, 7, 559-583; Brown et al., 2000, Proc. Natl. Acad. Sci USA 97:262-267).
- the aim of the algorithm is to search the best hyperplane that separates the data into two classes. This hyperplane is optimal in the sense that it maximises the distance between the nearest learning points also called support vector.
- the classification for a new observation is determined by its position with regard to the hyperplane. The nature of statistical learning theory. Springer edition.
- the SVM algorithm When used for classification, the SVM algorithm creates a hyperplane that separates the data into two classes (responders and non responders).
- This invention provides a method of determining a chemotherapy regime for a human patient with metastatic colorectal cancer, comprising detecting the expression of the genes selected from LGALS8, SERPINE2, ANGPTL2, ATP50, PRYM, EML2, F8, U2AF1L2, DRD5, GOLGIN-67, ZNF32, PSG9, BOLL, and ZNF583 from a tumor tissue sample from the patient wherein said gene expression is indicative of response to chemotherapy; and administering a pharmaceutical regimen comprising oxaliplatin, fluorouracil, and leucovorin to said patient if the predictor classifier (previously determined using SVM-learning algorithm) applied to the expression of the fourteen genes from Table 3 from a tumoral tissue sample from the patient classifies the patient as non-responder patient.
- the predictor classifier previously determined using SVM-learning algorithm
- This invention further provides methods of monitoring response of a human patient with metastatic colorectal cancer to chemotherapy, comprising administering a pharmaceutical regimen to the patient; detecting the expression of one or more of the genes selected from LGALS8, SERPINE2, ANGPTL2, ATP50, PRYM, EML2, F8, U2AF1L2, DRD5, GOLGIN-67, 2NF32, PSG9, BOLL, and ZNF583 from a tumor tissue sample from the patient; and comparing the patient's gene expression detected to the gene expression from a cell population comprising colorectal tumor cells.
- One such pharmaceutical regime can comprise administering irinotecan, fluorouracil, and leucovorin.
- Another such pharmaceutical regime can comprise administering oxaliplatin, fluorouracil, and leucovorin.
- the present invention provides a method of modifying a chemotherapy treatment for a human patient with metastatic colorectal cancer, comprising administering a pharmaceutical regimen to the patient; detecting the expression of one or more of the genes selected from LGALS8, SERPINE2, ANGPTL2, ATP50, PRYM, EML2, F8, U2AF1L2, DRD5, GOLGIN-67, ZNF32, PSG9, BOLL, and ZNF583 from a colon tumor tissue sample from the patient; and administering FOLFIRI when one or more genes identified are expressed or administering FOLFOX when one or more genes identified are not expressed.
- the present invention also contemplates methods for detecting a response of a human patient with metastatic colorectal cancer to chemotherapy.
- kits useful for the practice of one or more of the methods of the invention may contain one or more solid supports having attached thereto one or more oligonucleotides.
- the solid support may be a high-density oligonucleotide array.
- Kits may further comprise one or more reagents for use with the arrays, one or more signal detection and/or array-processing instruments, one or more gene expression databases and one or more analysis and database management software packages.
- the present invention also provides for a kit for use to select the optimal chemotherapy from several alternative treatment options for a human patient with metastatic colorectal cancer, the kit comprising: a. a microarray for detecting a mRNA derived from a sample from said human to assess the expression of the one or more of the following genes LGALS8, SERPINE2,
- kits wherein the microarray is an Affymetrix® Gene Chip.
- the invention also contemplates detection by in situ hybridization and detection by nucleic acid amplification.
- kits for use to select the optimal chemotherapy regime from several alternative treatment options for a human patient with metastatic colorectal cancer comprising: a. a microarray for detecting a protein derived from a sample from said human to assess the expression of the one or more of the following genes LGALSB, SERPINE2, ANGPTL2, ATP50, PRYM 1 EML2, F8, U2AF1L2, DRD5, GOLGIN-67, ZNF32. PSG9, BOLL, and ZNF583; and b. instructions describing a method of using said microarray.
- kits wherein the proteins are detected by western blotting or by immunohistochemistry.
- the present invention also provides for a kit for use to select the optimal chemotherapy from several alternative treatment options for a human patient with metastatic colorectal cancer.
- Each column represents a tumor sample and each row represents a gene. Red and green indicate relative high and low expression, respectively;
- PCA Principal component analysis
- Figure 2 Proportion of misclassification in validation sets as a function of corresponding training-set size
- the ability to choose an appropriate treatment at the outset can make the difference between cure and recurrence of a cancer, such as colorectal cancer (e.g. metastatic colorectal cancer).
- a cancer such as colorectal cancer (e.g. metastatic colorectal cancer).
- the present invention provides for the identification of patients who are the most likely to benefit from a therapy, such as FOLFIRI chemotherapy, by assessing the differential expression of one or more of the responsiveness genes in a tumor sample from a patient.
- a "predictive value” as used herein is the percentage of patients predicted to have a certain therapeutic outcome that do actually have the predicted therapeutic outcome.
- a therapeutic outcome may range from cure to no benefit and may include the slowing of tumor
- the rate of expected objective responses in the population treated with FOLFIRI is 50%.
- the gene signature obtained by the present invention permits the classification of 100% of the responder (R) and about 92% of the non-responder (NR) patients with a precision of about 80% to 95% as illustrated in Example 5.
- R responder
- NR non-responder
- the predictive test contemplated by the present invention can be used to select patients for this treatment regimen either as pre- or postoperative treatment.
- These genes alone or in combination can also be used as therapeutic targets to develop novel drugs against colorectal cancer or to modulate and increase the activity of existing therapeutic agents.
- the expression level of a set or subset of identified responsiveness gene(s), or the proteins encoded by the responsive genes can be used to: 1) determine if a tumor can be or is likely to be successfully treated by an agent or combination of agents; 2) determine if a tumor is responding to treatment with an agent or combination of agents; 3) select an appropriate agent or combination of agents for treating a tumor; 4) monitor the effectiveness of an ongoing treatment; and 5) identify new treatments (either single agent or combination of agents).
- the identified responsiveness genes can be utilized as markers (surrogate and/or direct) to determine appropriate therapy, to monitor clinical therapy and human trials of a drug being tested for efficacy, and to develop new agents and therapeutic combinations.
- methods and compositions include genes (markers) that are expressed in cancer cells responsive to a given therapeutic agent and whose expression (either increased expression or decreased expression) correlates with responsiveness to a therapeutic agent, see Table 3.
- a "responsiveness gene” or “gene marker” as used herein is a gene whose increased expression or decreased expression is correlated with a cell's response to a particular therapy. A response may be either a therapeutic response (sensitivity) or a lack of therapeutic response (residual disease, which may indicate resistance). Accordingly, one or more of the genes of the present invention can be used as markers (or surrogate markers) to identify tumors and tumor cells that are likely to be successfully treated
- the markers of the present invention can be used to identify cancers that have become or are at risk of becoming refractory to a treatment. Aspects of the invention include marker sets that can identify patients that are likely to respond or not to respond to a therapy.
- gene expression is assessed by (1) providing a pool of target nucleic acids derived from one or more target genes; (2) hybridizing the nucleic acid sample to an array of probes (including control probes); and (3) detecting nucleic acid hybridization and assessing a relative expression (transcription) level.
- the present invention provides methods wherein nucleic acid probes are immobilized on a solid support in an organized array. Oligonucleotides can be bound to a support by a variety of processes, including lithography. It is common in the art to refer to such an array as a "chip.”
- cancer cells including tumor cells, are "responsive" to a therapeutic agent if its rate of growth is inhibited or the tumor cells die as a result of contact with the therapeutic agent, compared to its growth in the absence of contact with the therapeutic agent.
- the quality of being responsive to a therapeutic agent is a variable one, with different tumors exhibiting different levels of "responsiveness" to a given therapeutic agent, under different conditions.
- tumors may be predisposed to responsiveness to an agent if one or more of the corresponding responsiveness markers are expressed.
- Cancer including tumor cells, are "non-responsive" to a therapeutic agent if its rate of growth is not inhibited (or inhibited to a very low degree) or cell death is not induced as a result of contact wfth the therapeutic agent, compared to its growth in the absence of contact with the therapeutic agent.
- Trie quality of being non-responsive to a therapeutic agent is a highly variable one, with different tumors exhibiting different levels of "non-responsiveness" to a given therapeutic agent, under different conditions.
- cancers including tumor cells, refer to neoplastic or hyperplastic cells.
- Cancers include, but are not limited to, mesothelioma, hepatobiliary cancers (hepatic and billiary duct), a primary or secondary CNS tumor, a primary or secondary brain tumor (including pituitary tumors, astrocytomas, meningiomas and medulloblastomas), lung cancer (NSCLC and SCLC), bone cancer, pancreatic cancer, skin cancer, cancer of the head or neck, cutaneous or intraocular melanoma, ovarian cancer, colon cancer, rectal cancer, liver cancer, cancer of the anal region, stomach cancer, gastrointestinal (gastric, colorectal, and duodenal), breast cancer, uterine cancer, carcinoma of the fallopian tubes, carcinoma of the endometrium, carcinoma of the cervix, carcinoma of the vagina, carcinoma of the vulva,
- Hodgkin's Disease cancer of the esophagus, cancer of the small intestine, cancer of the endocrine system, cancer of the thyroid gland, cancer of the parathyroid gland, cancer of the adrenal gland, sarcoma of soft tissue, gastrointestinal stromal tumor (GIST), pancreatic endocrine tumors (such as pheochromocytoma, insulinoma, vasoactive intestinal peptide tumor, islet cell tumor and glucagonoma), carcinoid tumors, cancer of the urethra, cancer of the penis, prostate cancer, testicular cancer, chronic or acute leukemia, chronic myeloid leukemia, lymphocytic lymphomas, cancer of the bladder, cancer of the kidney or ureter, renal cell carcinoma, carcinoma of the renal pelvis, neoplasms of the central nervous system (CNS), primary CNS lymphoma, non-Hodgkins's lymphoma, spinal axis tumors, brain stem glioma, pitu
- the present invention provides methods for determining whether a cancer is likely to be sensitive or resistant to a particular therapy or regimen.
- microarray analysis determines the expression levels of thousands of genes in a sample, only a subset of these genes are significantly differentially expressed between cells having different outcomes to therapy. Identifying which of these differentially expressed genes can be used to predict a clinical outcome requires additional analysis.
- the genes described in the present invention are genes whose expression varies by a predetermined amount between tumors that are sensitive to a chemotherapy, e.g., FOLFIRI, versus those that are not responsive or less responsive to a chemotherapy.
- the genes identified may be used in a variety of nucleic acid detection assays to detect or quantitate the expression a gene or multiple genes in a given sample.
- the following provides detailed descriptions of the genes of interest in the present invention. It is noted that homologs and polymorphic variants of the genes are also contemplated. As described herein, the relative expression of these genes may be measured through nucleic acid hybridization, e.g.,
- probes for the following genes can be designed using any appropriate fragment of the full lengths of the nucleic acids sequences of the genes set forth in Table 3.
- Gene expression data may be gathered in any way that is available to one of skill in the art. Typically, gene expression data is obtained by employing an array of probes that hybridize to several, and even thousands or more different transcripts. Such arrays are often classified as microarrays or macroarrays depending on the size of each position on the array. RNA preparation and assessment of RNA quality
- a nucleic acid sample derived from the mRNA transcript(s) refers to a nucleic acid for whose synthesis the mRNA transcript or a subsequence thereof has ultimately served as a template.
- a cDNA reverse transcribed from an mRNA, an RNA transcribed from the cDNA, a DNA amplified from the cDNA, an RNA transcribed from the amplified DNA, and the like are all derived from the mRNA transcript.
- suitable samples include, but are not limited to, mRNA transcripts of the gene or genes, cDNA reverse transcribed from the mRNA, cRNA transcribed from the cDNA, and the like.
- the concentration of the mRNA transcrlpt(s) of the gene or genes is proportional to the transcription level of that gene.
- the hybridization signal intensity be proportional to the amount of hybridized nucleic acid.
- the nucleic acid may be isolated from the sample according to any of a number of methods well known to those of skill in the art.
- RNA RNA
- Methods of isolating total mRNA are well known to those of skill in the art. For example, methods of isolation and purification of nucleic acids are described in Sambrook et A!., (1989) Molecular Cloning - A Laboratory Manual, Cold Spring Harbor Laboratory Press which is
- Filter based methods for the isolation of mRNA are also known in the art. Examples of commercially available filter-based RNA isolation systems include RNAqueous® (Ambion) and RN ⁇ asy (Qiagen). One of skill in the art would appreciate that it is desirable to inhibit or destroy RNase present in homogenates before homogenates can be used.
- PCR polymerase chain reaction
- LCR ligas ⁇ chain reaction
- a nucleic acid sample is the total mRNA isolated from a biological sample.
- biological sample refers to a sample obtained from an organism or from components (e.g., cells) of an organism, including diseased tissue such as a tumor, a neoplasia or a hyperplasia.
- the sample may be of any biological tissue or fluid or cells from any organism as well as cells raised in vitro, such as cell lines and tissue culture cells. Frequently the sample will be a "clinical sample,” which is a sample derived from a patient.
- Such samples include, but are not limited to, blood, blood cells (e.g., white cells), tissue biopsy or fine needle aspiration biopsy samples, urine, peritoneal fluid, and pleural fluid, or cells therefrom.
- Biological samples may also include sections of tissues such as frozen sections or formalin fixed sections taken for histological purposes.
- the sample mRNA is reverse transcribed with a reverse transcriptase, such as Superscript Il (Invitrogen), and a primer consisting of an oligo-dT and a sequence encoding the phage T7 promoter to generate first-strand cDNA.
- a reverse transcriptase such as Superscript Il (Invitrogen)
- a primer consisting of an oligo-dT and a sequence encoding the phage T7 promoter to generate first-strand cDNA.
- a second-strand DNA is polymerized in the presence of a DNA polymerase, DNA ligase, and RNase H.
- the resulting double- stranded cDNA may be blunt-ended using T4 DNA polymerase and purified by phenol/chloroform extraction.
- the double-stranded cDNA is then transcribed into cRNA.
- a label may be incorporated into the cRNA when it is transcribed.
- Those of skill in the art are familiar with methods for labeling nucleic acids.
- the cRNA may be transcribed in the presence of biotin-ribonucleotides.
- Transcript Labeling Kit (Enzo Diagnostics) is a commercially available kit for biotinylating cRNA.
- the direct transcription method described above provides an antisense (aRNA) pool.
- aRNA antisense
- the oligonucleotide probes provided in the array are chosen to be complementary to subsequences of the antisense nucleic acids.
- the target nucleic acid pool is a pool of sense nucleic acids
- the oligonucleotide probes are selected to be complementary to subsequences of the sense nucleic acids.
- the probes may be of either sense, as the target nucleic acids include both sense and antisense strands.
- nucleic acids In combination with an appropriate detection means.
- Recognition moieties incorporated into primers, incorporated into the amplified product during amplification, or attached to probes are useful in the identification of nucleic acid molecules.
- a number of different labels may be used for this purpose including, but not limited to, fluorophores, chromophores, radiophores, enzymatic tags, antibodies, chemiluminescence, electroluminescence, and affinity labels.
- fluorophores fluorophores, chromophores, radiophores, enzymatic tags, antibodies, chemiluminescence, electroluminescence, and affinity labels.
- affinity labels include, but are not limited to the following: an antibody, an antibody fragment, a receptor protein, a hormone, biotin, Dinitrophenyl (DNP), or any polypeptide/protein molecule that binds to an affinity label.
- DNP Dinitrophenyl
- enzyme tags include enzymes such as urease, alkaline phosphatase or peroxidase to mention a few.
- Colorimetric indicator substrates can be employed to provide a detection means visible to the human eye or spectrophotometrically, to identify specific hybridization with complementary nucleic acid-containing samples.
- fluorophores examples include, but are not limited to, Alexa 350, Alexa 430, AMCA, BODIPY 630/650, BODIPY 650/665, BODIPY-FL, BODIPY- R6G, BODIPY-TMR, BODIPY- TRX, Cascade Blue, Cy2, Cy3, Cy5, 6-FAM, Fluoroscein, HEX, 6-JOE, Oregon Green 488,
- a label may be incorporated into nucleic acid, e.g., cRNA, when it is transcribed.
- the cRNA may be transcribed in the presence of biotin- ribonucleotides.
- the BioArray High Yield RNA Transcript Labeling Kit (Enzo Diagnostics) is a commercially available kit for biotinylating cRNA.
- radiolabels may be detected using photographic film or scintillation counters.
- fluorescent markers may be detected using a photodetector to detect emitted light.
- enzymatic labels are detected by providing the enzyme with a substrate and detecting the reaction product produced by the action of the enzyme on the substrate, and colorimetric labels are detected by simply visualizing the colored label.
- direct labels are detectable labels that are directly attached to or incorporated into the target (sample) nucleic acid prior to hybridization.
- indirect labels are joined to the hybrid duplex after hybridization.
- the indirect label is attached to a binding moiety that has been attached to the target nucleic acid prior to the hybridization.
- the target nucleic acid may be biotinylated before the hybridization.
- an avidin-conjugated fluorophore will bind the biotin-bearing hybrid duplexes providing a label that is easily detected.
- Nucleic acid hybridization simply involves contacting a probe and target nucleic acid under conditions where the probe and its complementary target can form stable hybrid duplexes through complementary base pairing (see Lockhart et al., 1999, WO 99/32660, for example). The nucleic acids that do not form hybrid duplexes are then washed away leaving the hybridized nucleic acids to be detected, typically through detection of an attached detectable label. It is generally recognized that nucleic acids are denatured by increasing the temperature or decreasing the salt concentration of the buffer containing the nucleic acids. Under low stringency conditions (e.g., low temperature and/or high salt) hybrid duplexes (e.g., DNA-DNA, RNA-RNA or RNA-DNA) will form even where the annealed sequences are not perfectly complementary.
- low stringency conditions e.g., low temperature and/or high salt
- hybridization conditions may be selected to provide any degree of stringency. Stringency can also be increased by addition of agents such as formamide.
- Hybridization specificity may be evaluated by comparison of hybridization to the test probes with hybridization to the various controls that can be present (e.g., expression level control, normalization control, mismatch controls, etc.).
- the wash is performed at the highest stringency that produces consistent results and that provides a signal intensity greater than approximately 10% of the background intensity.
- the hybridized array may be washed at. successively higher stringency solutions and read between each wash. Analysis of the data sets thus produced will reveal a wash stringency above which the hybridization pattern is not appreciably altered and which provides adequate signal for the particular oligonucleotide probes of interest.
- hybridization As used herein, “hybridization,” “hybridizes,” or “capable of hybridizing” is understood to mean the forming of a double or triple stranded molecule or a molecule with partial double or triple stranded nature.
- anneal as used herein is synonymous with “hybridize.”
- hybridize ⁇
- hybridization “hybridizes,” or “capable of hybridizing” are related to the term “stringent conditions” or “high stringency” and the terms “low stringency* or “low stringency conditions.
- stringent conditions or “high stringency” are those conditions that allow hybridization between or within one or more nucleic acid strands containing complementary sequences, but precludes hybridization of random sequences. Stringent conditions tolerate little, if any, mismatch between a nucleic acid and a target strand. Such conditions are well known to those of ordinary skill in the art, and are preferred for applications requiring high selectivity. Non-limiting applications include isolating a nucleic acid, such as an mRNA or a nucleic acid segment thereof, or detecting at least one specific mRNA transcript or a nucleic acid segment thereof.
- Stringent conditions may comprise low salt and/or high temperature conditions, such as provided by about 0.02 M to about 0.15 M NaCI at temperatures of about 50° C. to about 70° C. It is understood that the temperature and ionic strength of a desired stringency are determined in part by the length of the particular nucleic acids, the length and nucleobase content of the target sequences, the charge composition of the nucleic acids, and the presence or concentration of formamide, tetramethylammonium chloride or other solvents in a hybridization mixture.
- the hybridized nucleic acids are typically detected by detecting one or more labels attached to the sample nucleic acids.
- the labels may be incorporated by any of a number of means well known to those of skill in the art (for example, see Affymetrix GeneChip® Expression Analysis Technical Manual.)
- DNA arrays and gene chip technology provide a means of rapidly screening a large number of nucleic acid samples for their ability to hybridize to a variety of single stranded DNA probes immobilized on a solid substrate. These techniques involve quantitative methods for analyzing large numbers of genes rapidly and accurately.
- the technology capitalizes on the complementary binding properties of single stranded DNA to screen nucleic acid samples by hybridization (Pease et al. , 1994; Fodor et at., 1991).
- a DNA array or gene chip consists of a solid substrate upon which an array of single stranded DNA molecules have been attached.
- the chip or array is contacted with a single stranded nucleic acid sample (e.g., cRNA), which Is allowed to hybridize under stringent conditions.
- cRNA single stranded nucleic acid sample
- the chip or array is then scanned to determine which probes have hybridized.
- Exemplary methods include: the immobilization of biotinylated nucleic acid molecules to avidin/streptavidin coated supports (Holmstrom, 1993), the direct covalent attachment of short, 5 1 - phosphorytated primers to chemically modified polystyrene plates (Rasmussen et al., 1991), or the precoating of the polystyrene or glass solid phases with poly-L-Lys or poly L-Lys, Phe, followed by the covalent attachment of either amino- or sulfhydryl-modified oligonucleotides using bi-functional crosslinking reagents (Running et al., 1990; Newton et al., 1993). When immobilized onto a substrate, the probes are stabilized and therefore may be used repeatedly.
- hybridization is performed on an immobilized nucleic acid target or a probe molecule that is attached to a solid surface such as nitrocellulose, nylon membrane or glass.
- a solid surface such as nitrocellulose, nylon membrane or glass.
- Numerous other matrix materials may be used, including reinforced nitrocellulose membrane, activated quartz, activated glass, polyvinylidene difluoride (PVDF) membrane, polystyrene substrates, polyacrylamide-based substrate, other polymers such as polyvinyl chloride), poly(methyl methacrylate), poly(dimethyl siloxane), photopolymers (which contain photoreactive species such as nitrenes, carbenes and ketyl radicals capable of forming covalent links with target molecules).
- the Affymetrix GeneChip system may be used for hybridization and scanning of the probe arrays.
- the Affymetrix U133A array is used in conjunction with Microarray Suite 5.0 for data acquisition and preliminary analysis. Normalization Controls
- Normalization controls are oligonucleotide probes that are complementary to labeled reference oligonucleotides that are added to the nucleic acid sample.
- the signals obtained from the normalization controls after hybridization provide a control for variations in hybridization conditions, label intensity, "reading" efficiency and other factors that may cause the hybridization signal to vary between arrays. For example, signals read from all other probes in the array can be divided by the signal from the control probes thereby normalizing the measurements.
- any probe may serve as a normalization control. However, it is recognized that hybridization efficiency varies with base composition and probe length. Preferred normalization probes are selected to reflect the average length of the other probes present in the array, however, they can be selected to cover a range of lengths. The normalization
- control(s) can also be selected to reflect the (average) base composition of the other probes in the array, however in a preferred embodiment, only one or a few normalization probes are used and they are selected such that they hybridize well (i.e. no secondary structure) and do not match any target-specific probes. Normalization probes can be localized at any position in the array or at multiple positions throughout the array to control for spatial variation in hybridization efficiently.
- a standard probe cocktail supplied by Affymetrix is added to the hybridization to control for hybridization efficiency when using Affymetrix Gene Chip arrays.
- Expression level controls are probes that hybridize specifically with constitutively expressed genes in the sample.
- the expression level controls can be used to evaluate the efficiency of cRNA preparation.
- Virtually any constitutively expressed gene provides a suitable target for expression level controls.
- expression level control probes have sequences complementary to subsequences of constitutively expressed "housekeeping genes.”
- the ratio of the signal obtained for a 3' expression level control probe and a 5' expression level control probe that specifically hybridize to a particular housekeeping gene is used as an indicator of the efficiency of cRNA preparation.
- a ratio of 1- 3 indicates an acceptable preparation.
- Any appropriate computer platform may be used to perform the necessary comparisons between sequence information, gene expression information and any other information in a database or provided as an input.
- a large number of computer workstations and programs are available from a variety of manufacturers, such has those available from Affymetrix.
- SAM identifies genes with statistically significant changes in expression by assimilating a set of gene-specific t-tests. Each gene is assigned a score on the basis of its change in gene expression relative to the standard deviation of repeated measurements for that gene. Genes with scores greater than a threshold are deemed potentially significant. The percentage of such genes identified by chance is the false discovery rate (FDR). To estimate the FDR, nonsense genes are identified by analyzing permutations of the measurements. The threshold can be adjusted to identify smaller or larger sets of genes, and FDRs are calculated for each set. Kits Any of the compositions described herein may be comprised in a kit.
- reagents for determining the genotype of one or more of the fourteen genes listed in Table 3 are included in a kit.
- the kit may further include individual nucleic acids that can be amplify and/or detect particular nucleic acid sequences of one or more of the fourteen genes listed in Table 3 gene. It may also include one or more buffers, such as a DNA isolation buffers, an amplification buffer or a hybridi-ration buffer.
- the kit may also contain compounds and reagents to prepare DNA templates and isolate DNA from a sample.
- the kit may also include various labeling reagents and compounds.
- kits may be packaged either in aqueous media or in lyophilized form.
- the container means of the kits will generally include at least one viaf, test tube, flask, bottle, syringe or other container means, into which a component may be placed, and preferably, suitably aliquoted. Where there are more than one component in the kit (labeling reagent and label may be packaged together), the kit also will generally contain a second, third or other additional container into which the additional components may be separately placed. However, various combinations of components may be comprised in a vial.
- the kits of the present invention also will typically include a means for containing the nucleic acids, and any other reagent containers in close confinement for commercial sale. Such containers may include injection or blow-molded plastic containers into which the desired vials are retained.
- the liquid solution is an aqueous solution, with a sterile aqueous solution being particularly preferred.
- the components of the kit may be provided as dried powder(s).
- the powder can be reconstituted by the addition of a suitable solvent. It is envisioned that the solvent may also be provided in another container means.
- kits will also include instructions for employing the kit components as well the use of any other reagent not included in the kit. Instructions may include variations that can be implemented.
- kits of the invention are embodiments of kits of the invention. Such kits, however, are not limited to the particular items identified above and may include any reagent used directly or indirectly in the detection of all fourteen genes listed in Table 3.
- RNA sample patients were excluded from the study if they: were previously treated with a topoisomerase I inhibitor (irinotecan, topotecan) had previous lines of chemotherapy for treatment of metastases had no clinical and histopathological data available had no frozen tumor material or RNA sample available, had inadequate RNA quality or quantity upon isloation. Inclusion procedure
- CR complete response
- PR partial response (decrease > 50%
- SD stable disease (neither PR or PD criteria met)
- PD progression disease (increase >25% or appearance of new lesions);
- R responder;
- NR non-responder
- responder and non-responder patients were defined based upon anatomic indicators (tumor lesions) according to WHO criteria. We have considered the best response to first-line chemotherapy. Of these 21 patients, 9 (43%) were
- tissue samples were maintained at -180°c (liquid nitrogen) or at -80°c until RNA extraction and were weighed before homogenization. Then tissue samples were disrupted directly into a lysis buffer using Mixer Mill® MM 300 (Qiagen, Valencia, CA). The denaturing agents present into the lysis buffer inactivate cellular nucleases during cells or tissus disruption while maintaining RNA integrity. Total RNA was isolated from tissue lysates using RNeasy® mini Kit (Qiagen), and additional DNAse digestion was performed on all samples during the extraction process (RNase-Free DNase SetTM Protocol for DNase treatment on RNeasy® Mini spin columns, Qiagen). After each extraction, a small fraction of the total RNA preparation was taken to determine the quality of the sample and the yield of total RNA.
- Controls were performed by UV spectroscopy and analysis of total RNA profile using Agilent RNA 6000 Nano LabChip® kit with Agilent 2100 Blo analysesr (Agilent Technologies, Palo Alto. CA) to determine RNA purity, quantity, and integrity.
- ITT in vitro transcription
- the IVT reaction was carried out in the presence of T7 RNA Polymerase and a biotinylated nucleotide analog/ribonucleotid ⁇ mix, for complementary RNA (cRNA) amplification and biotin labeling.
- cRNA complementary RNA
- the biotinylated cRNA targets were then cleaned up, fragmented, and hybridized to GeneChip® expression arrays.
- the labeled probes were then hybridized onto the Affymetrix Human Genome U133 Set (HG-U133; Affymetrix Inc., Santa Clara, CA) 1 which contains 44,298 probe sets representing more than 39,000 transcripts derived from approximately 33,000 well- substantiated human genes.
- Hybridization was performed using an Affymetrix GeneChip® Station and the conditions were as recommended in the Affymetrix GeneChip® Expression Analysis Technical Manual. After hybridization, the chips were stained with streptavidin phycoerythrin conjugate and scanned by the GeneChip® Scanner 3000 or the GeneArray® Scanner, where the amount of light emitted at 570 nm is proportional to the bound target at each location on the probe array. Inter-array normalization was performed using a set of standard genes with low variability common to the arrays, provided by Affymetrix, and applying a scaling factor for each array. The final data set file was complied using Affymetrix GeneChip® software, which, for each probe set, assigned an intensity corresponding to transcript abundance.
- Expression profiling was conducted using Affymetrix U133 A and B chips comprised of 44298 probes set. For statistical analysis genes present in at least 50% of patients from one group were considered for further analysis resulting in a list of 19365 genes.
- the differentially expressed genes between responders and non-responders were determined using SAM. Based on a relevant FDR of 20%, about 5000 discriminatory genes were selected and ranked according their statistical significance. For each gene, using a non- parametric procedure, the total area (AUC) was estimated and the partial area (pAUC) under the receiver operating characteristic (ROC) curve was determined. The estimation of the pAUC has been restricted only to the region where the specificity is at least 90%. Genes were then ranked according to AUC and pAUC values and for each indicator we retained the top 40 genes. This process was repeated twenty one times with a training set of 20 samples (each time, a sample was held out).
- TP tr ⁇ e positives
- FP felse positives
- FN fa/se negatives
- ⁇ TN true negatives
- Sensitivity is defined as TP/(TP+FN); which is referred to as the true positive rate".
- the sensitivity (Se) corresponds to the proportion to the proportion of positive results among the NR patients.
- TN/(TN+FP) which is referred to as the "true negative rate”.
- the specificity (Sp) corresponds to the proportion of negative results among the R patients.
- the positive predictive value (PPV) of a diagnostic test corresponds to the probability of a NR status if the signature gives a positive result. It is calculated by: Sexpvr
- Se x pvr + (1 - Sp)(I - pvr) status estimated by the proportion of NR patients in the population.
- the negative predictive value (NPV) of a diagnostic test corresponds to the probability of a R status if the signature gives a negative result. It is calculated by
- This method consists in dividing the dataset into training sets of different size (from 5 to 19 samples) with at least one patient of each outcome.
- the remaining samples were considered as validation set (size from 16 to 2).
- 500 random training set were associated with each sample size.
- a classifier was built by SVM using th ⁇ 14 selected genes and tested in a designated validation test. As shown in figure 2, even with the smallest training size, the misclassification rate was only 25.6% (95 Cl 19% - 33.8%) and from a training set size > 13, the misclassification rate did not exceed 7.5%.
- the selected genes as a result of the SAM method was then ranked by computing the empirical area under the Receiver Operating Characteristic (ROC) curve (AUC) and the
- pAUC empirical partial AUC restricted to a clinically relevant pertinent range of false-positive rates 29.
- the pAUC is an index of discrimination and the interval of chosen false positive rates allows considering a high specificity in order to particularly well detect the responder population.
- the classification rule was defined with Support Vector Machines algorithm 30. Two parameters were required, the kernel function (RBF) and the magnitude of the penalty for violating the soft margin.
- RBF kernel function
- LOOCV leave-one-out cross validation
- RNA splicing U2AF1 L2
- ZNF32 and ZNF582 regulation of transcription
- F8 Galectin-8, PSG9
- SERPINE2, BOLL cell differentiation
- ATP5O ion transport
- D5O signal transduction
- ANGPTL2 ANGPTL2
- EML2 visual perception
- Galectin-8 is a matricellular protein that positively or negatively regulates cell adhesion, depending on the extracellular context 35.
- the quantitative determination of the immunohistochemical expression of galectin-8 in the series of colon cancer specimens clearly showed that the extensively invasive colon cancers exhibited significantly less galectin-8 than locally invasive ones 36.
- PSG9 which is ectopically upregulated in vivo by colon cancer cells, 37 has an RGD motif in a conserved region in the N- terminal domain which suggests that these genes may function as adhesion recognition signals for integrins and are involved in adhesion/recognition processes 38.
- the serine proteinase inhibitor SERPINE2 could participate in maintaining the integrity of connective tissue matrices. SERPINE2 has been shown to inhibit tumour cell-mediated extracellular matrix destruction39. Two other genes, FVIII and ANGPTL2, could reflect the tumour vascularization. Indeed, intratumoral angiogenesis is commonly quantified by microvessel density measurement using immunohistochemical staining with monoclonal antibodies against factor VIII 40.
- ANGPTL2 protein induces sprouting in vascular endothelial cells 41 and
Abstract
The present invention provides for the identification of genes that are expressed in tumors that are responsive to a given therapeutic regime and whose expression correlates with responsiveness to that therapeutic regime. One or more of the genes of the present invention can be used as markers to identify patients that are likely to be successfully treated by a therapeutic regime.
Description
GENE PREDICTORS OF RESPONSE TO METASTATIC COLORECTAL CHEMOTHERAPY
BACKGROUNP OFTHE INVENTION FIELD OFTHE INVENTION
The present invention relates generally to the field of cancer biology. More particularly, it concerns gene expression profiles that are indicative of the responsiveness of a patient having cancer to drug therapy.
DESCRIPTION OF RELATED ART Colorectal cancer (CRC) is one of the most common malignant diseases with 945,000 new cases worldwide every year and is the fourth cause of cancer-related deaths worldwide (492,000 deaths/year) (Weitz J, et al., 2005, Lancet 365(9454):153-65). When localized, CRC is often curable by surgery but the prognosis for patients with metastatic disease remains poor. Curative-intent resections can be performed on only 10 to 15% of liver metastases. In the majority of metastatic patients, the standard treatment remains palliative chemotherapy. Fluorouracil-based therapy has been the main treatment for metastatic colorectal cancer for the last 40 years. Major progress has been made by the introduction of regimens containing new cytotoxic drugs, such as irinotecan (Vanhoefer U, etaf., 2001, J Clin. Oncol.19(5):1501- 18) or oxaliplatin (Pelley RJ, 2001, Curr. Oncol. Rep. 3(2):147-55). The combinations commonly used, e.g., irinotecan, fluorouracil, and Jeucovorin (FOLFIRI) and oxaliplatin, fluorouracil, and leucovorin (FOLFOX) can reach an objective response rate of about 50% (DouiJlard JY, et al., 2000, Lancet 355 (9209):1041-7; Goldberg RM, et al., 2004, J Clin. Oncol. 22(1):23-30). However, these new combinations remain inactive in one half of the patients and, in addition, resistance to treatment appear in almost all patients who were initially responders. More recently, two monoclonal antibodies targeting vascular endothelial growth factor Avastin® (bevacizumab) (Genentech Inc., South San Francisco CA) and epidermal growth factor receptor Erbitux® (cetuximab) (Imclone Inc. New York City) have been approved for treatment of metastatic colorectal cancer but are always used in combination with standard chemotherapy regimens (Cunningham D, et al., 2004. N. Engl. J. Med. 351(4):337-45; Hurwitz H. et al., 2004, N. Engl. J. Med. 350(23):2335-42).
A major clinical challenge is to identify the subset of patients who will benefit from chemotherapy, both in metastatic and adjuvant settings. The number of anti-cancer drugs and multi-drug combinations has increased substantially in the past decade, however, treatments continue to be applied empirically using a trial-and-error approach. Clinical experience shows
that some tumors are sensitive to several different types of chemotherapeutic agents, while other cancers of the same histology show selective sensitivity to certain drugs but resistance ' to others. There have been many attempts to determine predictive factors of response to drug therapy. Alterations in gene expression, protein expression and polymorphic variants in genes encoding thymidylate synthase, dihydropyrimidine dehydrogenase, and thymidine phosphorylase would be expected to predict a response to fluorouracil (lacopetta B, et al., 2001, Br. J. Cancer 85(6):827-30; Salonga D, et al., 2000, Clin. Cancer Res. 6(4):1322-7; Kornmann M, et al., 2003, Clin. Cancer Res. 9(11):4116-24). As well, microsatellite-instability status could be an independent predictor of fluorouracil-based adjuvant chemotherapy (Ribic CM, et al., 2003, N. Engl. J. Med.349(3):247-57). Topoisomerase I expression has been investigated as predictive factor for irinotecan response (Paradiso A, et al., 2004, Int. J. ■ Cancer 111 (2):252-8). High mRNA expression of excision repair cross-complementing rodent repair deficiency, complementation group 1 (includes overlapping antisense sequence) ("ERCC1") and thymidylate synthase (TS") are predictive of poor response to treatment of advanced disease with oxaliplatin plus fluorouracil (Shirota Y, et al., 2001 , J. Clin. Oncol.
19(23):4298-304). However, although predictive factor testing is an exciting field of research, it has not yet been routinely applied to clinical practice (Adlard JW, et al., 2002, Lancet Oncol. 3(2): 75-82; Ahmed FE., 2005; Expert Rev. MoI. Diagn. 5(3):353-75). Furthermore, an in vitro study on prediction of response of colon cells demonstrated that the measurement of multiple, rather than single marker gene resulted in a more accurate of drug response (Mariadason JM, et al., 2003, Cancer Res.63(24):8791 -812). A test that could assist physicians to select the optimal chemotherapy for a patient from several alternative treatment options would be an important clinical advance.
The application of microarray technology to the cancer field has made possible to obtain large-scale expression profiles in clinical samples. Gene expression profiling has become a strategy to predict clinical outcome or to classify molecular subtype of tumors. Several studies have already been published, showing the feasibility of identifying genes involved in the progression and the prognosis of colorectal cancer (Bertucci F, et al., 2004 Oncogene 23(7): 1377-91; Birkenkamp-Demtroder K, et al., 2002, Cancer Res. 62(15):4352- 63; Wang Y, et al., 2004, J. Clin. Oncol.22(9):1564-71; Notterman DA, et al., 2001, Cancer Res. 61 (7):3124-30; Eschrich S, et al., 2005, J. Clin. Oncol. 23(15):3526-35) or for predicting drug-response in other cancer types, notably in breast cancer (Chang JC, et al., 2003, Lancet 362(9381 ):362-9; Iwao-Koizumi K, et al., 2005, J. Clin. Oncol.23(3):422-31 ; Jansen MP, et al., 2005, J. Clin. Onco.23(4):732-40). However, no indication on the possible value of this
approach for predicting drug response in colon cancer is presently available (Mariadason JM, et al., 2004, Drug Resist. Updat. 7(3):209-18). Only a recent study showed that gene expression profiling might contribute to the response prediction of rectal adenocarcinomas to preoperative chemoradiotherapy (Ghadimi BM, et al., 2005, J. Clin. Oncol. 23(9):1826-38). The ability to choose an appropriate treatment at the outset may make the difference between cure and recurrence of a cancer, such as colorectal cancer. The present invention provides for the identification of patients who are the most likely to benefit from drug therapy by assessing the differential expression of one or more of the responsiveness genes in a tumor sample from a patient. SUMMARY OF THE INVENTION
The present invention relates generally to the fields of molecular genetics, pharmacogenetics, and cancer therapy. In particular, the present invention is directed to methods for detecting gene expression and correlating the presence or absence of certain genes with responsiveness to chemotherapy. Embodiments of the invention include methods for assessing the responsiveness of a tumor to therapy. In certain embodiments the methods comprise obtaining a sample of a tumor from a patient; evaluating the sample for expression of one or more markers identified in Table 3; and assessing the responsiveness of the tumor to therapy based on the evaluation of marker expression in the sample. Marker herein refers to a gene or gene product (RNA or polypeptide) whose expression is related to response of a cancer to a therapy, either a positive (complete pathological response) or a negative response (residual disease). Expression of a marker may be assessed by detecting polynucleotides or polypeptides derived therefrom. More specifically, the present invention is directed to methods for determining the expression of one or more of the genes listed in Table 3 in a patient with colorectal cancer, and correlating the expression with responsiveness to chemotherapy regimes. The intensity of gene expression detected can be indicative of whether a patient will be a responder or non-responder to a chemotherapy regime. The present invention identifies gene expression profiles associated with colorectal cancer patients who respond to certain pharmaceutical regimes by examining gene expression in tissue from malignant colorectal tissue (primary tumor) of said patients who respond to treatment and those who do not. The present invention also identifies expression profiles which serve as useful diagnostic markers to treatment response and drug efficacy. The present invention also preferably provides a method to assess the responsiveness of a patient with metastatic colorectal cancer to drug therapy.
In certain aspects of the invention, the tumor comprises colorectal cancer. In still other aspects the tumor is sampled by aspiration, biopsy, or surgical resection. Embodiments of the invention include assessing the expression of the one or more markers by detecting a mRNA derived from one or more markers. In a preferred embodiment, detection comprises microarray analysis, and more preferably the microarray is an Affymetrix Gene Chip. In other aspects of the invention, detection comprises nucleic acid amplification, preferably PCR. In still further aspects, detection is by in situ hybridization. In further embodiments, assessing the expression of one or more markers is by detecting a protein derived from a gene identified as a marker. A protein may be detected by immunohistochemistry, western blotting, or other known protein detection means.
A further embodiment includes methods of monitoring a cancer patient receiving chemotherapy. Methods of monitoring a cancer patient comprise obtaining a tumor sample from the.patient during chemotherapy; evaluating expression of one or more markers of Table 3 in the tumor sample; and assessing the cancer patient's responsiveness to chemotherapy. A tumor sample may be obtained, evaluated and assessed repeatedly at various time points during chemotherapy (e.g. before, during, and after drug treatment).
Accordingly, in certain aspects it would be useful to identify genes and/or gene products that represent prognostic genes with respect to the response to a given therapeutic agent or class of therapeutic agents. It then may be possible to determine which patients will benefit from a particular therapeutic regimen and, importantly, determine when, if ever, the therapeutic regime begins to lose its effectiveness for a given patient. The ability to make such predictions would make it possible to discontinue a therapeutic regime that has lost its effectiveness well before its loss of effectiveness becomes apparent by conventional measures. The present invention includes a method of predicting response of a human patient with metastatic colorectal cancer to chemotherapy, comprising detecting the expression of one or more genes selected from the following group LGALS8, SERPINE2, ANGPTL2, ATP50, PRYM, EML2, F8, U2AF1L2, DRD5, GOLGIN-67, ZNF32, PSG9, BOLL, and ZNF583 from a tissue sample from the patient wherein said gene expression is indicative of response to chemotherapy.
Another aspect of the invention includes a method of predicting response of a human patient with metastatic colorectal cancer to chemotherapy, comprising detecting the expression of two or more genes selected from the group LGALS8, SERPINE2, ANGPTL2, ATP50, PRYM. EML2, F8, U2AF1L2, DRD5, GOLGIN-67, ZNF32, PSG9, BOLL, andZNF583
from a tissue sample from the patient wherein said gene expression is indicative of response to chemotherapy. The term "two or more," "three or more," etc means that one can select two or more, or three or more genes from those listed in Table 3 in any order or combination.
In another aspect of the invention a method of predicting response of a human patient with metastatic colorectal cancer to chemotherapy, comprising detecting the expression of three or more genes selected from the group LGALS8, SERPINEΞ2. ANGPTL2, ATP50, PRYM, EML2, F8, U2AF1L2, DRD5, GOLGIN-67. ZNF32, PSG9, BOLL, and 2NF583 from a tissue sample from the patient wherein said gene expression is indicative of response to chemotherapy is included. A further aspect of the invention includes a method of predicting response of a human patient with metastatic colorectal cancer to chemotherapy, comprising detecting the expression of four or more genes selected from the group LGALS8, SERPINK, ANGPTL2, ATP50, PRYM, EML2, F8, U2AF1L2, DRD5, GOLGIN-67, 2NF32, PSG9, BOLL, and ZNF583 from a tissue sample from the patient wherein said gene expression is indicative of response to chemotherapy.
This invention also includes a method of predicting response of a human patient with metastatic colorectal cancer to chemotherapy, comprising detecting the expression of five or more genes selected from the group LGALS8, SERPINE2, ANGPTL2, ATP50, PRYM, EML2, F8, U2AF1L2, DRD5, GOLGIN-67, 2NF32, PSG9, BOLL, and 2NF583 from a tissue sample from the patient wherein said gene expression is indicative of response to chemotherapy.
Another aspect of the invention includes a method of predicting response of a human patient with metastatic colorectal cancer to chemotherapy, comprising detecting the expression of six or more genes selected from the group LGALS8, SERPfNE2, ANGPTL2, ATP50, PRYM, EML2, F8, U2AF1L2, DRD5, GOLGIN-67, ZNF32, PSG9, BOLL, and ZNF583 from a tissue sample from the patient wherein said gene expression is indicative of response to chemotherapy.
The invention also includes a method of predicting response of a human patient with metastatic colorectal cancer to chemotherapy, comprising detecting the expression of seven or more genes selected from the group LGALS8, SERPINE2, ANGPTL2, ATP50, PRYM, EML2, F8. U2AF1 L2, DRD5, GOLGIN-67, ZNF32, PSG9, BOLL, and ZNF583 from a tissue sample from the patient wherein said gene expression is indicative of response to chemotherapy.
Another aspect of the invention includes a method of predicting response of a human patient with metastatic colorectal cancer to chemotherapy, comprising detecting the
expression of eight or more genes selected from the group LGALS8, SERPINE2, ANGPTL2, ATP50, PRYM, EML2, F8, U2AF1L2, DRD5, GOLGIN-67.2NF32. PSG9, BOLL, and ZNF583 from a tissue sample from the patient wherein said gene expression is indicative of response to chemotherapy.
S In another aspect, the invention includes a method of predicting response of a human patient with metastatic colorectal cancer to chemotherapy, comprising detecting the expression of nine or more genes selected from the group LGALS8, SERPINE2, ANGPTL2, ATP50, PRYM, EML2, F8, U2AF1L2. DRD5, GOLGIN-67, ZNF32, PSG9, BOLL, and ZNF583 from a tissue sample from the patient wherein said gene expression is indicative of response 0 to chemotherapy.
One embodiment of the invention includes a method of predicting response of a human patient with metastatic colorectal cancer to chemotherapy, comprising detecting the expression of ten or more genes selected from the group LGALS8, SERPINE2, ANGPTL2, ATP50, PRYM, EML2, F8, U2AF1L2, DRD5, GOLGIN-67, ZNF32, PSG9, BOLL, andZNF583 from a tissue sample from the patient wherein said gene expression is indicative of response to chemotherapy.
Jn another embodiment of the invention, a method of predicting response of a human patient with metastatic colorectal cancer to chemotherapy, comprising detecting the expression of eleven or more genes selected from the group LGALS8, SERPINE2, ANGPTL2, ATP50, PRYM, EML2, F8, U2AF1 L2, DRD5, GOLGIN-67, ZNF32, PSG9, BOLL, and ZNF583 from a tissue sample from the patient wherein said gene expression is indicative of response to chemotherapy in included.
A further embodiment of the invention includes a method of predicting response of a human patient with metastatic colorectal cancer to chemotherapy, comprising detecting the expression of twelve or more genes selected from the group LGALS8, SERPINE2, ANGPTL2, ATP50, PRYM, EML2, F8, U2AF1L2, DRD5, GOLGIN-67, ZNF32, PSG9, BOLL, and ZNF583 from a tissue sample from the patient wherein said gene expression is indicative of response to chemotherapy.
Yet another aspect of the invention includes a method of predicting response of a human patient with metastatic colorectal cancer to chemotherapy, comprising detecting the expression of thirteen or more genes selected from the group LGALS8, SERPINE2, . ANGPTL2, ATP50, PRYM, EML2, F8. U2AF1L2. DRD5. GOLGIN-67, ZNF32, PSG9. BOLL, and ZNF583 from a tissue sample from the patient wherein said gene expression is indicative of response to chemotherapy.
Another aspect of the invention includes a method of predicting response of a human patient with metastatic colorectal cancer to chemotherapy, comprising detecting the expression of fourteen or more genes selected from the group LGALS8, SERPIN EΞ2, ANGPTL2, ATP50, PRYM, EML2, F8. U2AF1L2, DRD5, GOLGIN-67, ZNF32, PSG9, BOLL, and ZNF583 from a tissue sample from the patient wherein said gene expression is indicative of response to chemotherapy.
This invention also includes a method of predicting response of a human patient with metastatic colorectal cancer to chemotherapy, comprising detecting the expression of a gene selected from the group SERPINE2, ANGPTL2, ATP50, PRYM, EML2, F8, U2AF1L2, DRD5, GOLGIN-67, ZNF32, PSG9, BOLL, and ZNF583 from a tissue sample from the patient wherein said gene expression is indicative of response to chemotherapy.
In another embodiment of the invention, the method can be used to predict response of a human patient with metastatic colorectal cancer to chemotherapy, comprising detecting the expression of a gene selected from the group ANGPTL2, ATP50, PRYM, EML2, F8, U2AF1 L2, DRD5, GOLGIN-67, ZNF32, PSG9, BOLL, and ZNF583 from a tissue sample from the patient wherein said gene expression is indicative of response to chemotherapy.
Another embodiment of the invention includes a method of predicting the response of a human patient with metastatic colorectal cancer to chemotherapy, comprising detecting the expression of a gene selected from the group ATP50, PRYM, EML2, F8, U2AF1L2, DRD5, GOLGIN-67, ZNF32, PSG9, BOLL, and ZNF583 from a tissue sample from the patient wherein said gene expression is indicative of response to chemotherapy.
A further embodiment of the invention includes a method of predicting response of a human patient with metastatic colorectal cancer to chemotherapy, comprising detecting the expression of a gene selected from the group PRYM, EML2, F8, U2AF1L2, DRD5, GOLGIN- 67, ZNF32, PSG9, BOLL, and ZNF583 from a tissue sample from the patient wherein said gene expression is indicative of response to chemotherapy
Another aspect of the invention includes a method of predicting response of a human patient with metastatic colorectal cancer to chemotherapy, comprising detecting the expression of a gene selected from the group EML2, F8, U2AF1 L2, DRD5, GOLGIN-67, ZNF32, PSG9, BOLL, and ZNF583 from a tissue sample from the patient wherein said gene expression is indicative of response to chemotherapy
Yet another embodiment of the invention includes a method of predicting response of a human patient with metastatic colorectal cancer to chemotherapy, comprising detecting the expression of a gene selected from the group F8, U2AF1L2, DRD5, GOLGIN-67, ZNF32,
PSG9, BOLL, and ZNF583 from a tissue sample from the patient wherein said gene expression is indicative of response to chemotherapy
Another aspect of the invention includes a method of predicting response of a human patient with metastatic colorectal cancer to chemotherapy, comprising detecting the expression of a gene selected from the group U2AF1 L2, DRD5, GOLGIN-67, ZNF32, PSG9, BOLL, and ZNF583 from a tissue sample from the patient wherein said gene expression is indicative of response to chemotherapy
A further aspect of the invention includes a method of predicting response of a human patient with metastatic colorectal cancer to chemotherapy, comprising detecting the expression of a gene selected from the group DRD5, GOLGIN-67, ZNF32, PSG9, BOLL, and ZNF583 from a tissue sample from the patient wherein said gene expression is indicative of response to chemotherapy
Another embodiment of the invention includes a method of predicting response of a human patient with metastatic colorectal cancer to chemotherapy, comprising detecting the expression of a gene selected from the group GOLGIN-67, ZNF32, PSG9, BOLL, and ZNF583 from a tissue sample from the patient wherein said gene expression is indicative of response to chemotherapy
Another embodiment of the invention includes a method of predicting response of a human patient with metastatic colorectal cancer to chemotherapy, comprising detecting the expression of a gene selected from the group ZNF32, PSG9, BOLL, and ZNF583 from a tissue sample from the patient wherein said gene expression is indicative of response to chemotherapy
This invention also includes a method of predicting response of a human patient with metastatic colorectal cancer to chemotherapy, comprising detecting the expression of a gene selected from the group PSG9, BOLL, and ZNF583 from a tissue sample from the patient wherein said gene expression is indicative of response to chemotherapy
Another aspect of the invention includes a method of predicting response of a human patient with metastatic colorectal cancer to chemotherapy, comprising detecting the expression of a gene selected from the group BOLL, and ZNF583 from a tissue sample from the patient wherein said gene expression is indicative of response to chemotherapy
A further aspect of the invention includes methods of predicting response of a human patient with metastatic colorectal cancer to chemotherapy that comprises administering a pharmaceutical regimen of irinotecan, fluorouracil, and leucovorin to the patient. The methods can also be used to predict response of a human patient with metastatic colorectal cancer to
chemotherapy that comprises administering a pharmaceutical regimen of oxaliplatin, fluorouracil, and leucovorin to the patient.
This invention also provides for methods of assessing the expression of the one or more of the genes in Table 3 by detecting a protein derived from a gene identified as a marker derived from a sample from said human.
In some aspects, the present invention provides a method of determining a chemotherapy regime for a human patient with metastatic colorectal cancer, comprising detecting the expression of the genes selected from LGALS8, SERPINE2, ANGPTL2, ATP50, PRYM, EML2, F8, U2AF1L2, DRD5, GOLGIN-67, ZNF32, PSG9, BOLL, and ZNF583 from a colon tumor tissue sample from the patient wherein said gene expression is indicative of response to chemotherapy; and administering a pharmaceutical regimen comprising irinotecan, fluorouracil, and leucovorin to said patient if the predictor classifier (previously determined using the SVM-learning algorithm) applied to the expression of the fourteen genes from Table 3 from a tumor tissue sample from the patient classifies the patient as responder patient.
The Support Vector Machines (SVM) are a new type of learning algorithm initiated by Vapnik (1995) and then applied to the microarray data analysis (Ben-Dor et al., 2000, Journal of the Computational Biology, 7, 559-583; Brown et al., 2000, Proc. Natl. Acad. Sci USA 97:262-267). At first, the aim of the algorithm is to search the best hyperplane that separates the data into two classes. This hyperplane is optimal in the sense that it maximises the distance between the nearest learning points also called support vector. The classification for a new observation is determined by its position with regard to the hyperplane. The nature of statistical learning theory. Springer edition.
When used for classification, the SVM algorithm creates a hyperplane that separates the data into two classes (responders and non responders).
This invention provides a method of determining a chemotherapy regime for a human patient with metastatic colorectal cancer, comprising detecting the expression of the genes selected from LGALS8, SERPINE2, ANGPTL2, ATP50, PRYM, EML2, F8, U2AF1L2, DRD5, GOLGIN-67, ZNF32, PSG9, BOLL, and ZNF583 from a tumor tissue sample from the patient wherein said gene expression is indicative of response to chemotherapy; and administering a pharmaceutical regimen comprising oxaliplatin, fluorouracil, and leucovorin to said patient if the predictor classifier (previously determined using SVM-learning algorithm) applied to the expression of the fourteen genes from Table 3 from a tumoral tissue sample from the patient classifies the patient as non-responder patient.
This invention further provides methods of monitoring response of a human patient with metastatic colorectal cancer to chemotherapy, comprising administering a pharmaceutical regimen to the patient; detecting the expression of one or more of the genes selected from LGALS8, SERPINE2, ANGPTL2, ATP50, PRYM, EML2, F8, U2AF1L2, DRD5, GOLGIN-67, 2NF32, PSG9, BOLL, and ZNF583 from a tumor tissue sample from the patient; and comparing the patient's gene expression detected to the gene expression from a cell population comprising colorectal tumor cells. One such pharmaceutical regime can comprise administering irinotecan, fluorouracil, and leucovorin. Another such pharmaceutical regime can comprise administering oxaliplatin, fluorouracil, and leucovorin. In another aspect, the present invention provides a method of modifying a chemotherapy treatment for a human patient with metastatic colorectal cancer, comprising administering a pharmaceutical regimen to the patient; detecting the expression of one or more of the genes selected from LGALS8, SERPINE2, ANGPTL2, ATP50, PRYM, EML2, F8, U2AF1L2, DRD5, GOLGIN-67, ZNF32, PSG9, BOLL, and ZNF583 from a colon tumor tissue sample from the patient; and administering FOLFIRI when one or more genes identified are expressed or administering FOLFOX when one or more genes identified are not expressed.
The present invention, also contemplates methods for detecting a response of a human patient with metastatic colorectal cancer to chemotherapy.
The invention further comprises kits useful for the practice of one or more of the methods of the invention. In some preferred embodiments, a kit may contain one or more solid supports having attached thereto one or more oligonucleotides. The solid support may be a high-density oligonucleotide array. Kits may further comprise one or more reagents for use with the arrays, one or more signal detection and/or array-processing instruments, one or more gene expression databases and one or more analysis and database management software packages.
The present invention also provides for a kit for use to select the optimal chemotherapy from several alternative treatment options for a human patient with metastatic colorectal cancer, the kit comprising: a. a microarray for detecting a mRNA derived from a sample from said human to assess the expression of the one or more of the following genes LGALS8, SERPINE2,
ANGPTL2, ATP50, PRYM, EML2, F8, U2AF1L2, DRD5, GOLGIN-67, ZNF32, PSG9, BOLL, and 2NF583; and b. instructions describing a method of using said microarray.
Other embodiments of the invention entail kits wherein the microarray is an Affymetrix® Gene Chip. The invention also contemplates detection by in situ hybridization and detection by nucleic acid amplification.
Another embodiment contemplated by the present invention is a kit for use to select the optimal chemotherapy regime from several alternative treatment options for a human patient with metastatic colorectal cancer, the kit comprising: a. a microarray for detecting a protein derived from a sample from said human to assess the expression of the one or more of the following genes LGALSB, SERPINE2, ANGPTL2, ATP50, PRYM1 EML2, F8, U2AF1L2, DRD5, GOLGIN-67, ZNF32. PSG9, BOLL, and ZNF583; and b. instructions describing a method of using said microarray.
Other embodiments of the invention include a kit wherein the proteins are detected by western blotting or by immunohistochemistry.
The present invention also provides for a kit for use to select the optimal chemotherapy from several alternative treatment options for a human patient with metastatic colorectal cancer.
It is contemplated that any method or composition described herein can be implemented with respect to any other method or compositfon described herein.
The use of the term "or" in the claims is used to mean "and/or" unless explicitly indicated to refer to alternatives only or the alternatives are mutually exclusive, although the disclosure supports a definition that refers to only alternatives and "and/or."
Throughout this application, the term "about" is used to indicate that a value includes the standard deviation of error for the device or method being employed to determine the value. Other objects, features and advantages of the present invention will become apparent from the following detailed description. It should be understood, however, that the detailed description and the specific examples, while indicating specific embodiments of the invention, are given by way of illustration only, since various changes and modifications within the spirit and scope of the invention will become apparent to those skilled in the art from this detailed description.
BRIEF DESCRIPTION OF THE DRAWINGS
The file of this patent contains at least one drawing executed in color. Copies of this patent with color drawing(s) will be provided by the Patent and Trademark Office upon request and payment of the necessary fee. Figure 1 : Analysis of gene expression signature by (A) unsupervised clustering and
(B) principal Component Analysis
(A): Each column represents a tumor sample and each row represents a gene. Red and green indicate relative high and low expression, respectively;
(B): Principal component analysis (PCA) involves a mathematical procedure that represents the maximum of the data information in reducing the space dimension. This diagram provides 80 % of information with only 3 principal components.
Figure 2: Proportion of misclassification in validation sets as a function of corresponding training-set size
DETAILED DESCRIPTION OF THE INVENTION Currently, there are at least four commonly used pre-or post- operative chemotherapy regimens for stage I— 111 colorectal cancers..Prior to the present invention, there were few tests to select the best regimen for an individual prior to the start of chemotherapy. Typically, treatments were evaluated empirically using a trial-and-error approach. Complete pathologic eradication of colorectal cancer from the colon (and regional lymph nodes) predicts cure with high accuracy. However, this endpoint is only available after completion of the empirically selected chemotherapy. In the case of FOLFIRI chemotherapy, the course of treatment lasts 3 to 6 months, and only between 45-55 % of the patients show an objective response (Complete response + Partial response). Douillard JY, Cunningham D, Roth AD, et al., Lancet 355:1041- 1047, 2000; Tournigand C, Andre T, Achilla E, et al., J Clin Oncol 22:229-237, 2004. The ability to choose an appropriate treatment at the outset can make the difference between cure and recurrence of a cancer, such as colorectal cancer (e.g. metastatic colorectal cancer). The present invention provides for the identification of patients who are the most likely to benefit from a therapy, such as FOLFIRI chemotherapy, by assessing the differential expression of one or more of the responsiveness genes in a tumor sample from a patient. In one example, it is estimated that an individual will experience complete pathological response to FOLFIRJ therapy with an estimated 100% positive predictive value and 90% negative predictive value. A "predictive value" as used herein is the percentage of patients predicted to have a certain therapeutic outcome that do actually have the predicted therapeutic outcome. A therapeutic outcome may range from cure to no benefit and may include the slowing of tumor
growth, a reduction in tumor burden, eradication of the tumor as determined by pathology, and other therapeutic outcomes. This represents a doubling of the chance of achieving complete or partial response (and likely cure) from FOLFIRI chemotherapy from 45-55% in untested patients to 80% in patients who would be selected to receive FOLFIRI chemotherapy on the basis of the inventive methods of the present invention.
The rate of expected objective responses in the population treated with FOLFIRI is 50%. The gene signature obtained by the present invention permits the classification of 100% of the responder (R) and about 92% of the non-responder (NR) patients with a precision of about 80% to 95% as illustrated in Example 5. For many patients a FOLFIRI regimen represents the best chance of cure over the unselected use of treatments. The predictive test contemplated by the present invention can be used to select patients for this treatment regimen either as pre- or postoperative treatment. These genes alone or in combination can also be used as therapeutic targets to develop novel drugs against colorectal cancer or to modulate and increase the activity of existing therapeutic agents.
The expression level of a set or subset of identified responsiveness gene(s), or the proteins encoded by the responsive genes, can be used to: 1) determine if a tumor can be or is likely to be successfully treated by an agent or combination of agents; 2) determine if a tumor is responding to treatment with an agent or combination of agents; 3) select an appropriate agent or combination of agents for treating a tumor; 4) monitor the effectiveness of an ongoing treatment; and 5) identify new treatments (either single agent or combination of agents). In particular, the identified responsiveness genes can be utilized as markers (surrogate and/or direct) to determine appropriate therapy, to monitor clinical therapy and human trials of a drug being tested for efficacy, and to develop new agents and therapeutic combinations.
In certain embodiments, methods and compositions include genes (markers) that are expressed in cancer cells responsive to a given therapeutic agent and whose expression (either increased expression or decreased expression) correlates with responsiveness to a therapeutic agent, see Table 3. A "responsiveness gene" or "gene marker" as used herein is a gene whose increased expression or decreased expression is correlated with a cell's response to a particular therapy. A response may be either a therapeutic response (sensitivity) or a lack of therapeutic response (residual disease, which may indicate resistance). Accordingly, one or more of the genes of the present invention can be used as markers (or surrogate markers) to identify tumors and tumor cells that are likely to be successfully treated
by a therapeutic agent(s). In addition, the markers of the present invention can be used to identify cancers that have become or are at risk of becoming refractory to a treatment. Aspects of the invention include marker sets that can identify patients that are likely to respond or not to respond to a therapy. In one embodiment, gene expression is assessed by (1) providing a pool of target nucleic acids derived from one or more target genes; (2) hybridizing the nucleic acid sample to an array of probes (including control probes); and (3) detecting nucleic acid hybridization and assessing a relative expression (transcription) level. The present invention provides methods wherein nucleic acid probes are immobilized on a solid support in an organized array. Oligonucleotides can be bound to a support by a variety of processes, including lithography. It is common in the art to refer to such an array as a "chip."
As used herein, cancer cells, including tumor cells, are "responsive" to a therapeutic agent if its rate of growth is inhibited or the tumor cells die as a result of contact with the therapeutic agent, compared to its growth in the absence of contact with the therapeutic agent. The quality of being responsive to a therapeutic agent is a variable one, with different tumors exhibiting different levels of "responsiveness" to a given therapeutic agent, under different conditions. In one embodiment of the invention, tumors may be predisposed to responsiveness to an agent if one or more of the corresponding responsiveness markers are expressed. Cancer, including tumor cells, are "non-responsive" to a therapeutic agent if its rate of growth is not inhibited (or inhibited to a very low degree) or cell death is not induced as a result of contact wfth the therapeutic agent, compared to its growth in the absence of contact with the therapeutic agent. Trie quality of being non-responsive to a therapeutic agent is a highly variable one, with different tumors exhibiting different levels of "non-responsiveness" to a given therapeutic agent, under different conditions.
As used herein, cancers, including tumor cells, refer to neoplastic or hyperplastic cells. Cancers include, but are not limited to, mesothelioma, hepatobiliary cancers (hepatic and billiary duct), a primary or secondary CNS tumor, a primary or secondary brain tumor (including pituitary tumors, astrocytomas, meningiomas and medulloblastomas), lung cancer (NSCLC and SCLC), bone cancer, pancreatic cancer, skin cancer, cancer of the head or neck, cutaneous or intraocular melanoma, ovarian cancer, colon cancer, rectal cancer, liver cancer, cancer of the anal region, stomach cancer, gastrointestinal (gastric, colorectal, and duodenal), breast cancer, uterine cancer, carcinoma of the fallopian tubes, carcinoma of the endometrium, carcinoma of the cervix, carcinoma of the vagina, carcinoma of the vulva,
Hodgkin's Disease, cancer of the esophagus, cancer of the small intestine, cancer of the endocrine system, cancer of the thyroid gland, cancer of the parathyroid gland, cancer of the adrenal gland, sarcoma of soft tissue, gastrointestinal stromal tumor (GIST), pancreatic endocrine tumors (such as pheochromocytoma, insulinoma, vasoactive intestinal peptide tumor, islet cell tumor and glucagonoma), carcinoid tumors, cancer of the urethra, cancer of the penis, prostate cancer, testicular cancer, chronic or acute leukemia, chronic myeloid leukemia, lymphocytic lymphomas, cancer of the bladder, cancer of the kidney or ureter, renal cell carcinoma, carcinoma of the renal pelvis, neoplasms of the central nervous system (CNS), primary CNS lymphoma, non-Hodgkins's lymphoma, spinal axis tumors, brain stem glioma, pituitary adenoma, adrenocortical cancer, gall bladder cancer, multiple myeloma, cholangiocarciπoma, fibrosarcoma, neuroblastoma, retinoblastoma, tumors of the blood vessels (including benign and malignant tumors such as hemangiomas, hemangiosarcomas, hemangioblastomas and lobular capillary hemangiomas) or a combination of one or more of the foregoing cancers. Many biological functions are accomplished by altering the expression of various genes through transcriptional (e.g., through control of initiation, provision of RNA precursors, RNA processing, etc.) and/or translational control. For example, fundamental biological processes such as cell cycle, cell differentiation and cell death, are often characterized by the- variations in the expression levels of groups of genes. Assay Methods
The present invention provides methods for determining whether a cancer is likely to be sensitive or resistant to a particular therapy or regimen. Although microarray analysis determines the expression levels of thousands of genes in a sample, only a subset of these genes are significantly differentially expressed between cells having different outcomes to therapy. Identifying which of these differentially expressed genes can be used to predict a clinical outcome requires additional analysis.
The genes described in the present invention are genes whose expression varies by a predetermined amount between tumors that are sensitive to a chemotherapy, e.g., FOLFIRI, versus those that are not responsive or less responsive to a chemotherapy. The genes identified may be used in a variety of nucleic acid detection assays to detect or quantitate the expression a gene or multiple genes in a given sample. The following provides detailed descriptions of the genes of interest in the present invention. It is noted that homologs and polymorphic variants of the genes are also contemplated. As described herein, the relative expression of these genes may be measured through nucleic acid hybridization, e.g.,
microarray analysis. However, other methods of determining expression of the genes are also contemplated. For example, traditional Northern blotting, nuclease protection, RT-PCR and differential display methods can be used for detecting gene expression levels. Those methods are useful for some embodiments of the invention. It is also noted that probes for the following genes can be designed using any appropriate fragment of the full lengths of the nucleic acids sequences of the genes set forth in Table 3.
Gene expression data may be gathered in any way that is available to one of skill in the art. Typically, gene expression data is obtained by employing an array of probes that hybridize to several, and even thousands or more different transcripts. Such arrays are often classified as microarrays or macroarrays depending on the size of each position on the array. RNA preparation and assessment of RNA quality
One of skill in the art will appreciate that in order to assess the transcription level (and thereby the expression level) of a gene or genes, it is desirable to provide a nucleic acid sample derived from the mRNA transcript(s). As used herein, a nucleic acid derived from a mRNA transcript refers to a nucleic acid for whose synthesis the mRNA transcript or a subsequence thereof has ultimately served as a template. Thus, a cDNA reverse transcribed from an mRNA, an RNA transcribed from the cDNA, a DNA amplified from the cDNA, an RNA transcribed from the amplified DNA, and the like, are all derived from the mRNA transcript. Detection Of such derived products is indicative of the presence and abundance of the original transcript in a sample. Thus, suitable samples include, but are not limited to, mRNA transcripts of the gene or genes, cDNA reverse transcribed from the mRNA, cRNA transcribed from the cDNA, and the like.
Where it is desired to quantify the transcription level of one or more genes in a sample, the concentration of the mRNA transcrlpt(s) of the gene or genes is proportional to the transcription level of that gene. Similarly, it is preferred that the hybridization signal intensity be proportional to the amount of hybridized nucleic acid. As described herein, controls can be run to correct for variations introduced in sample preparation and hybridization.
The nucleic acid may be isolated from the sample according to any of a number of methods well known to those of skill in the art. One of skill in the art will appreciate that where expression levels of a gene or genes are to be detected, preferably RNA (mRNA) is isolated. Methods of isolating total mRNA are well known to those of skill in the art. For example, methods of isolation and purification of nucleic acids are described in Sambrook et A!., (1989) Molecular Cloning - A Laboratory Manual, Cold Spring Harbor Laboratory Press which is
incorporated herein by reference. Filter based methods for the isolation of mRNA are also known in the art. Examples of commercially available filter-based RNA isolation systems include RNAqueous® (Ambion) and RNβasy (Qiagen). One of skill in the art would appreciate that it is desirable to inhibit or destroy RNase present in homogenates before homogenates can be used.
Frequently, it is desirable to amplify the nucleic acid sample prior to hybridization. One of skill in the art will appreciate that whatever amplification method is used, if a quantitative result is desired, care must be taken to use a method that maintains or controls for the relative frequencies of the amplified nucleic acids. Methods of "quantitative" amplification are well known to those of skill in the art. For example, quantitative PCR involves simultaneously co-amplifying a known quantity of a control sequence. This provides an internal standard that may be used to calibrate the PCR reaction. The array may then include probes specific to the internal standard for quantification of the amplified nucleic acid. Other suitable amplification methods include, but are not limited to polymerase chain reaction (PCR) (Innis, et al., 1990), ligasβ chain reaction (LCR) (see Wu and Wallace, 1989); Landegren, et al., 1988; Barringer, et al., 1990, transcription amplification (Kwoh, et al., 1989), and self- sustained sequence replication (Guatelli, et al., 1990).
In one embodiment, a nucleic acid sample is the total mRNA isolated from a biological sample. The term "biological sample," as used herein, refers to a sample obtained from an organism or from components (e.g., cells) of an organism, including diseased tissue such as a tumor, a neoplasia or a hyperplasia. The sample may be of any biological tissue or fluid or cells from any organism as well as cells raised in vitro, such as cell lines and tissue culture cells. Frequently the sample will be a "clinical sample," which is a sample derived from a patient. Such samples Include, but are not limited to, blood, blood cells (e.g., white cells), tissue biopsy or fine needle aspiration biopsy samples, urine, peritoneal fluid, and pleural fluid, or cells therefrom. Biological samples may also include sections of tissues such as frozen sections or formalin fixed sections taken for histological purposes.
Ih a particular embodiment, the sample mRNA is reverse transcribed with a reverse transcriptase, such as Superscript Il (Invitrogen), and a primer consisting of an oligo-dT and a sequence encoding the phage T7 promoter to generate first-strand cDNA. A second-strand DNA is polymerized in the presence of a DNA polymerase, DNA ligase, and RNase H. The resulting double- stranded cDNA may be blunt-ended using T4 DNA polymerase and purified by phenol/chloroform extraction. The double-stranded cDNA is then transcribed into cRNA.
Methods for the in vitro transcription of RNA are known in the art and describe in, for example, Van Gelder, et al. (1990) and U.S. Pat. Nos. 5,545, 522; 5,716, 785; and 5,891,636, all of which are incorporated herein by reference.
If desired, a label may be incorporated into the cRNA when it is transcribed. Those of skill in the art are familiar with methods for labeling nucleic acids. For example, the cRNA may be transcribed in the presence of biotin-ribonucleotides. The BioArray High Yield RNA
Transcript Labeling Kit (Enzo Diagnostics) is a commercially available kit for biotinylating cRNA.
It will be appreciated by one of skill in the art that the direct transcription method described above provides an antisense (aRNA) pool. Where antisense RNA is used as the target nucleic acid, the oligonucleotide probes provided in the array are chosen to be complementary to subsequences of the antisense nucleic acids. Conversely, where the target nucleic acid pool is a pool of sense nucleic acids, the oligonucleotide probes are selected to be complementary to subsequences of the sense nucleic acids. Finally, where the nucleic acid pool is double stranded, the probes may be of either sense, as the target nucleic acids include both sense and antisense strands.
To detect hybridization, it is advantageous to employ nucleic acids in combination with an appropriate detection means. Recognition moieties incorporated into primers, incorporated into the amplified product during amplification, or attached to probes are useful in the identification of nucleic acid molecules. A number of different labels may be used for this purpose including, but not limited to, fluorophores, chromophores, radiophores, enzymatic tags, antibodies, chemiluminescence, electroluminescence, and affinity labels. One of skill in the art will recognize that these and other labels can be used with success in this invention.
Examples of affinity labels include, but are not limited to the following: an antibody, an antibody fragment, a receptor protein, a hormone, biotin, Dinitrophenyl (DNP), or any polypeptide/protein molecule that binds to an affinity label.
Examples of enzyme tags include enzymes such as urease, alkaline phosphatase or peroxidase to mention a few. Colorimetric indicator substrates can be employed to provide a detection means visible to the human eye or spectrophotometrically, to identify specific hybridization with complementary nucleic acid-containing samples.
Examples of fluorophores include, but are not limited to, Alexa 350, Alexa 430, AMCA, BODIPY 630/650, BODIPY 650/665, BODIPY-FL, BODIPY- R6G, BODIPY-TMR, BODIPY- TRX, Cascade Blue, Cy2, Cy3, Cy5, 6-FAM, Fluoroscein, HEX, 6-JOE, Oregon Green 488,
Oregon Green 500, Oregon Green 514, Pacific Blue, REG, Rhodamine Green, Rhodamine Red, ROX, TAMRA, TCT. Tetramethylrhodamine. and Texas Red.
As mentioned above, a label may be incorporated into nucleic acid, e.g., cRNA, when it is transcribed. For example, the cRNA may be transcribed in the presence of biotin- ribonucleotides. The BioArray High Yield RNA Transcript Labeling Kit (Enzo Diagnostics) is a commercially available kit for biotinylating cRNA.
Means of detecting such labels are well known to those of skill in the art. For example, radiolabels may be detected using photographic film or scintillation counters. In other examples, fluorescent markers may be detected using a photodetector to detect emitted light. In still further examples, enzymatic labels are detected by providing the enzyme with a substrate and detecting the reaction product produced by the action of the enzyme on the substrate, and colorimetric labels are detected by simply visualizing the colored label.
So called "direct labels" are detectable labels that are directly attached to or incorporated into the target (sample) nucleic acid prior to hybridization. In contrast, so called "indirect labels" are joined to the hybrid duplex after hybridization. Often, the indirect label is attached to a binding moiety that has been attached to the target nucleic acid prior to the hybridization. Thus, for example, the target nucleic acid may be biotinylated before the hybridization. After hybridization, an avidin-conjugated fluorophore will bind the biotin-bearing hybrid duplexes providing a label that is easily detected. For a detailed review of methods of labeling nucleic acids and detecting labeled hybridized nucleic acids see Laboratory
Techniques in Biochemistry and Molecular Biology (1993).
Hybridization
Nucleic acid hybridization simply involves contacting a probe and target nucleic acid under conditions where the probe and its complementary target can form stable hybrid duplexes through complementary base pairing (see Lockhart et al., 1999, WO 99/32660, for example). The nucleic acids that do not form hybrid duplexes are then washed away leaving the hybridized nucleic acids to be detected, typically through detection of an attached detectable label. It is generally recognized that nucleic acids are denatured by increasing the temperature or decreasing the salt concentration of the buffer containing the nucleic acids. Under low stringency conditions (e.g., low temperature and/or high salt) hybrid duplexes (e.g., DNA-DNA, RNA-RNA or RNA-DNA) will form even where the annealed sequences are not perfectly complementary.
Thus specificity of hybridization is reduced at lower stringency. Conversely, at higher stringency (e.g., higher temperature or lower salt) successful hybridization requires fewer
mismatches. One of skill in the art will appreciate that hybridization conditions may be selected to provide any degree of stringency. Stringency can also be increased by addition of agents such as formamide. Hybridization specificity may be evaluated by comparison of hybridization to the test probes with hybridization to the various controls that can be present (e.g., expression level control, normalization control, mismatch controls, etc.).
In general, there is a tradeoff between hybridization specificity (stringency) and signal intensity. Thus, in a preferred embodiment, the wash is performed at the highest stringency that produces consistent results and that provides a signal intensity greater than approximately 10% of the background intensity. Thus, in a preferred embodiment, the hybridized array may be washed at. successively higher stringency solutions and read between each wash. Analysis of the data sets thus produced will reveal a wash stringency above which the hybridization pattern is not appreciably altered and which provides adequate signal for the particular oligonucleotide probes of interest.
As used herein, "hybridization," "hybridizes," or "capable of hybridizing" is understood to mean the forming of a double or triple stranded molecule or a molecule with partial double or triple stranded nature. The term "anneal" as used herein is synonymous with "hybridize." ■ The term "hybridization," "hybridizes," or "capable of hybridizing" are related to the term "stringent conditions" or "high stringency" and the terms "low stringency* or "low stringency conditions. " As used herein "stringent conditions" or "high stringency" "are those conditions that allow hybridization between or within one or more nucleic acid strands containing complementary sequences, but precludes hybridization of random sequences. Stringent conditions tolerate little, if any, mismatch between a nucleic acid and a target strand. Such conditions are well known to those of ordinary skill in the art, and are preferred for applications requiring high selectivity. Non-limiting applications include isolating a nucleic acid, such as an mRNA or a nucleic acid segment thereof, or detecting at least one specific mRNA transcript or a nucleic acid segment thereof.
Stringent conditions may comprise low salt and/or high temperature conditions, such as provided by about 0.02 M to about 0.15 M NaCI at temperatures of about 50° C. to about 70° C. It is understood that the temperature and ionic strength of a desired stringency are determined in part by the length of the particular nucleic acids, the length and nucleobase content of the target sequences, the charge composition of the nucleic acids, and the presence or concentration of formamide, tetramethylammonium chloride or other solvents in a hybridization mixture.
It is also understood that these ranges, compositions and conditions for hybridization are mentioned by way of non-limiting examples only, and that the desired stringency for a particular hybridization reaction is often determined empirically by comparison to one or more positive or negative controls. Depending on the application envisioned it is preferred to employ varying conditions of hybridization to achieve varying degrees of selectivity of a nucleic acid towards a target sequence. In a non-limiting example, identification or isolation of a related target nucleic acid that does not hybridize to a nucleic acid under stringent conditions may be achieved by hybridization at low temperature and/or high ionic strength. Such conditions are termed "low stringency" or "low stringency conditions," and non-limiting examples of low stringency include hybridization performed at about 0.15 M to about 0. 9 M NaCI at a temperature range of about 20° C. to about 50" C. Of course, it is within the skill of one in the art to further modify the low or high stringency conditions to suite a particular application. The hybridization conditions selected will depend on the particular circumstances (depending, for example, on the G+C content, type of target nucleic acid, source of nucleic acid, and size of hybridization probe). Optimization of hybridization conditions for the particular application of interest is well known to those of skill in the art. Representative solid phase hybridization methods are disclosed in U. S. Pat. Nos. 5,843,663, 5,900,481, and 5,919,626. Other methods of hybridization that may be used in the practice of the present invention are disclosed in U.S. Pat. Nos. 5,849,481 , 5,849,486, and 5,851,772. Signal Detection
The hybridized nucleic acids are typically detected by detecting one or more labels attached to the sample nucleic acids. The labels may be incorporated by any of a number of means well known to those of skill in the art (for example, see Affymetrix GeneChip® Expression Analysis Technical Manual.) DNA arrays and gene chip technology provide a means of rapidly screening a large number of nucleic acid samples for their ability to hybridize to a variety of single stranded DNA probes immobilized on a solid substrate. These techniques involve quantitative methods for analyzing large numbers of genes rapidly and accurately. The technology capitalizes on the complementary binding properties of single stranded DNA to screen nucleic acid samples by hybridization (Pease et al. , 1994; Fodor et at., 1991). Basically, a DNA array or gene chip consists of a solid substrate upon which an array of single stranded DNA molecules have been attached. For screening, the chip or array is contacted with a single stranded nucleic acid sample (e.g., cRNA), which Is allowed to hybridize under stringent conditions. The chip or array is then scanned to determine which probes have hybridized.
The ability to directly synthesize on or attach polynucleotide probes to solid substrates is well known in the art. See U. S. Pat. Nos. 5,837,832 and 5,837,860, both of which are expressly incorporated by reference. A variety of methods have been utilized to either permanently or removably attach the probes to the substrate. Exemplary methods include: the immobilization of biotinylated nucleic acid molecules to avidin/streptavidin coated supports (Holmstrom, 1993), the direct covalent attachment of short, 51- phosphorytated primers to chemically modified polystyrene plates (Rasmussen et al., 1991), or the precoating of the polystyrene or glass solid phases with poly-L-Lys or poly L-Lys, Phe, followed by the covalent attachment of either amino- or sulfhydryl-modified oligonucleotides using bi-functional crosslinking reagents (Running et al., 1990; Newton et al., 1993). When immobilized onto a substrate, the probes are stabilized and therefore may be used repeatedly.
In general terms, hybridization is performed on an immobilized nucleic acid target or a probe molecule that is attached to a solid surface such as nitrocellulose, nylon membrane or glass. Numerous other matrix materials may be used, including reinforced nitrocellulose membrane, activated quartz, activated glass, polyvinylidene difluoride (PVDF) membrane, polystyrene substrates, polyacrylamide-based substrate, other polymers such as polyvinyl chloride), poly(methyl methacrylate), poly(dimethyl siloxane), photopolymers (which contain photoreactive species such as nitrenes, carbenes and ketyl radicals capable of forming covalent links with target molecules). The Affymetrix GeneChip system may be used for hybridization and scanning of the probe arrays. In a preferred embodiment, the Affymetrix U133A array is used in conjunction with Microarray Suite 5.0 for data acquisition and preliminary analysis. Normalization Controls
Normalization controls are oligonucleotide probes that are complementary to labeled reference oligonucleotides that are added to the nucleic acid sample. The signals obtained from the normalization controls after hybridization provide a control for variations in hybridization conditions, label intensity, "reading" efficiency and other factors that may cause the hybridization signal to vary between arrays. For example, signals read from all other probes in the array can be divided by the signal from the control probes thereby normalizing the measurements.
Virtually any probe may serve as a normalization control. However, it is recognized that hybridization efficiency varies with base composition and probe length. Preferred normalization probes are selected to reflect the average length of the other probes present in the array, however, they can be selected to cover a range of lengths. The normalization
control(s) can also be selected to reflect the (average) base composition of the other probes in the array, however in a preferred embodiment, only one or a few normalization probes are used and they are selected such that they hybridize well (i.e. no secondary structure) and do not match any target-specific probes. Normalization probes can be localized at any position in the array or at multiple positions throughout the array to control for spatial variation in hybridization efficiently.
In a particular embodiment, a standard probe cocktail supplied by Affymetrix is added to the hybridization to control for hybridization efficiency when using Affymetrix Gene Chip arrays. Expression Level Controls
Expression level controls are probes that hybridize specifically with constitutively expressed genes in the sample. The expression level controls can be used to evaluate the efficiency of cRNA preparation.
Virtually any constitutively expressed gene provides a suitable target for expression level controls. Typically expression level control probes have sequences complementary to subsequences of constitutively expressed "housekeeping genes."
In one embodiment, the ratio of the signal obtained for a 3' expression level control probe and a 5' expression level control probe that specifically hybridize to a particular housekeeping gene is used as an indicator of the efficiency of cRNA preparation. A ratio of 1- 3 indicates an acceptable preparation.
Databases
Any appropriate computer platform may be used to perform the necessary comparisons between sequence information, gene expression information and any other information in a database or provided as an input. For example, a large number of computer workstations and programs are available from a variety of manufacturers, such has those available from Affymetrix.
Statistical methods
Combining profiles of gene expression over a wide array of transcripts has potentially more, classification prediction power than relying on any single gene. This contention relies implicitly on the intricate nature of gene-to-gene interactions and the host of possible molecular characteristics captured in genome wide RNA expression. The significance of the difference between the levels of gene expression between tissue sample types can be assessed using expression data and any number of statistical tests such as Significance Analysis of Mlcroarrays (SAM) method (Tusher VG, et a!., 2001 , Proc. Natl. Acad. ScL U S A
98(9):5116-21). SAM identifies genes with statistically significant changes in expression by assimilating a set of gene-specific t-tests. Each gene is assigned a score on the basis of its change in gene expression relative to the standard deviation of repeated measurements for that gene. Genes with scores greater than a threshold are deemed potentially significant. The percentage of such genes identified by chance is the false discovery rate (FDR). To estimate the FDR, nonsense genes are identified by analyzing permutations of the measurements. The threshold can be adjusted to identify smaller or larger sets of genes, and FDRs are calculated for each set. Kits Any of the compositions described herein may be comprised in a kit. In a non-limiting example, reagents for determining the genotype of one or more of the fourteen genes listed in Table 3 are included in a kit. The kit may further include individual nucleic acids that can be amplify and/or detect particular nucleic acid sequences of one or more of the fourteen genes listed in Table 3 gene. It may also include one or more buffers, such as a DNA isolation buffers, an amplification buffer or a hybridi-ration buffer. The kit may also contain compounds and reagents to prepare DNA templates and isolate DNA from a sample. The kit may also include various labeling reagents and compounds.
The components of the kits may be packaged either in aqueous media or in lyophilized form. The container means of the kits will generally include at least one viaf, test tube, flask, bottle, syringe or other container means, into which a component may be placed, and preferably, suitably aliquoted. Where there are more than one component in the kit (labeling reagent and label may be packaged together), the kit also will generally contain a second, third or other additional container into which the additional components may be separately placed. However, various combinations of components may be comprised in a vial. The kits of the present invention also will typically include a means for containing the nucleic acids, and any other reagent containers in close confinement for commercial sale. Such containers may include injection or blow-molded plastic containers into which the desired vials are retained.
When the components of the kit are provided in one and/or more liquid solutions, the liquid solution is an aqueous solution, with a sterile aqueous solution being particularly preferred. However, the components of the kit may be provided as dried powder(s). When reagents and/or components are provided as a dry powder, the powder can be reconstituted by the addition of a suitable solvent. It is envisioned that the solvent may also be provided in another container means.
A kit will also include instructions for employing the kit components as well the use of any other reagent not included in the kit. Instructions may include variations that can be implemented.
It is contemplated that such reagents are embodiments of kits of the invention. Such kits, however, are not limited to the particular items identified above and may include any reagent used directly or indirectly in the detection of all fourteen genes listed in Table 3.
EXAMPLE 1
Patients. Samples and Treatment Selection of the patients Patients were selected according to the following eligibility criteria:
Patients with histologically-proven colorectal cancer;
Patients treated as a fist line treatment with a combination of irinotecan and 5FU according to FOLFIRI schedule;
Available clinical and histopathological data; - Chemotherapeutic response determined according to WHO (or RECIST) criteria or data allowing to evaluate the response must be available; and
Available frozen tumor material or RNA sample Patients were excluded from the study if they: were previously treated with a topoisomerase I inhibitor (irinotecan, topotecan) had previous lines of chemotherapy for treatment of metastases had no clinical and histopathological data available had no frozen tumor material or RNA sample available, had inadequate RNA quality or quantity upon isloation. Inclusion procedure
Clinical data and sample (frozen tumor or RNA) collection was performed according to the following guidelines:
Determine the number of colorectal cancers patients for which frozen tumor sample is available - Among said patients, determine the number of colorectal cancer patients with synchronous metastases treated with FOLFIRI as a first line treatment
Retrieve frozen tumor material or RNA sample and transfer samples as soon as possible, on dry ice.
lesions were classified as non-responders (NB). Evaluation of the tumor response of the 21 patients is summarized in Table 1.

CR = complete response, PR = partial response (decrease > 50% , SD = stable disease (neither PR or PD criteria met), PD = progression disease (increase >25% or appearance of new lesions); CR and PR have to be confirmed at 4 weeks R= responder; NR= non-responder
EXAMPLE 2
Assessment of clinical response
Before doing gene expression analysis, responder and non-responder patients were defined based upon anatomic indicators (tumor lesions) according to WHO criteria. We have considered the best response to first-line chemotherapy. Of these 21 patients, 9 (43%) were
27
sensitive to FOLFIRI treatment showing a size reduction of metastases from 52 % to 94 % whereas 12 (57%) were considered as non-responders with tumor size decrease no more than 44 % or tumor size increase up to 25% (Table 1).
To assess differences in clinicopathoiogical features between responder and non- responder patients we used a Fisher's exact test for qualitative variables and a non-parametric Wilcoxon test for quantitative ones. As shown in Table 2 patient and tumor characteristics did not differ significantly between both groups.

28

-EXAMPLE 3 Assay Methods
All tissue samples were maintained at -180°c (liquid nitrogen) or at -80°c until RNA extraction and were weighed before homogenization. Then tissue samples were disrupted directly into a lysis buffer using Mixer Mill® MM 300 (Qiagen, Valencia, CA). The denaturing agents present into the lysis buffer inactivate cellular nucleases during cells or tissus disruption while maintaining RNA integrity. Total RNA was isolated from tissue lysates using RNeasy® mini Kit (Qiagen), and additional DNAse digestion was performed on all samples during the extraction process (RNase-Free DNase Set™ Protocol for DNase treatment on RNeasy® Mini spin columns, Qiagen). After each extraction, a small fraction of the total RNA preparation was taken to determine the quality of the sample and the yield of total RNA.
29
Controls were performed by UV spectroscopy and analysis of total RNA profile using Agilent RNA 6000 Nano LabChip® kit with Agilent 2100 Bloanalyser (Agilent Technologies, Palo Alto. CA) to determine RNA purity, quantity, and integrity.
EXAMPLE 4
Gene expression analysis
Total RNA was labeled according to standard Affymetrix protocols (see Affymetrix GeneChip® Expression Analysis Technical Manual; Affymetrix Inc., Santa Clara, CA). Generally, total RNA or mRNA was first reverse transcribed using a T7-Oligo(dT) Promoter Primer in the first-strand cDNA synthesis reaction. Following RNase H-mediated second- strand cDNA synthesis, the double-stranded cDNA was purified and serves as a template in the subsequent in vitro transcription (IVT) reaction. The IVT reaction was carried out in the presence of T7 RNA Polymerase and a biotinylated nucleotide analog/ribonucleotidβ mix, for complementary RNA (cRNA) amplification and biotin labeling. The biotinylated cRNA targets were then cleaned up, fragmented, and hybridized to GeneChip® expression arrays. For each sample, the labeled probes were then hybridized onto the Affymetrix Human Genome U133 Set (HG-U133; Affymetrix Inc., Santa Clara, CA)1 which contains 44,298 probe sets representing more than 39,000 transcripts derived from approximately 33,000 well- substantiated human genes. Hybridization and was performed using an Affymetrix GeneChip® Station and the conditions were as recommended in the Affymetrix GeneChip® Expression Analysis Technical Manual. After hybridization, the chips were stained with streptavidin phycoerythrin conjugate and scanned by the GeneChip® Scanner 3000 or the GeneArray® Scanner, where the amount of light emitted at 570 nm is proportional to the bound target at each location on the probe array. Inter-array normalization was performed using a set of standard genes with low variability common to the arrays, provided by Affymetrix, and applying a scaling factor for each array. The final data set file was complied using Affymetrix GeneChip® software, which, for each probe set, assigned an intensity corresponding to transcript abundance.
Expression profiling was conducted using Affymetrix U133 A and B chips comprised of 44298 probes set. For statistical analysis genes present in at least 50% of patients from one group were considered for further analysis resulting in a list of 19365 genes.
30
EXAMPLE 5
Determination of αene signature
The differentially expressed genes between responders and non-responders were determined using SAM. Based on a relevant FDR of 20%, about 5000 discriminatory genes were selected and ranked according their statistical significance. For each gene, using a non- parametric procedure, the total area (AUC) was estimated and the partial area (pAUC) under the receiver operating characteristic (ROC) curve was determined. The estimation of the pAUC has been restricted only to the region where the specificity is at least 90%. Genes were then ranked according to AUC and pAUC values and for each indicator we retained the top 40 genes. This process was repeated twenty one times with a training set of 20 samples (each time, a sample was held out). In order to establish a stable signature we selected the genes common to the 21 AUC lists (8 genes) and those common to the 21 pAUC lists (11 genes). Finally, as some genes were common to both the final AUC and pAUC lists, a set of 14 discriminatory genes were retained (Table 3). Unsupervised hierarchical clustering and Principal Component Analysis were applied to the 14 selected genes and this resulted, in both analyses, in a clear separation between responder and non-responders patients (Figurei).
31

32

*Genes selected by pAUC; "Genes selected by AU
Using an SVM-leaming algorithm, a predictor classifier was defined and its performance was evaluated by the "LOOCV". All the 9 responders (100% specificity) and 11 out of 12 non-responders (92% sensitivity) were correctly classified, for an overall accuracy of 95% to response to treatment.
33
PREDICTIVE VALUES
Gold Standard (WHO criteria)
NR R positive: NR TP=11 FP=O
Prediction (Signature) negative: R FN=1 TN=9
12
TP=trυe positives; FP=felse positives; FN=fa/se negatives; ~TN=true negatives
Sensitivity is defined as TP/(TP+FN); which is referred to as the true positive rate". The sensitivity (Se) corresponds to the proportion to the proportion of positive results among the NR patients.
Se =— = 0.92 12
Specificity is defined as TN/(TN+FP); which is referred to as the "true negative rate". The specificity (Sp) corresponds to the proportion of negative results among the R patients.
Sp= I =,
The positive predictive value (PPV) of a diagnostic test corresponds to the probability of a NR status if the signature gives a positive result. It is calculated by: Sexpvr
PPV = where, "prv" corresponds to the prevalence of NR
Se x pvr + (1 - Sp)(I - pvr) status, estimated by the proportion of NR patients in the population. In this example,

34
The negative predictive value (NPV) of a diagnostic test corresponds to the probability of a R status if the signature gives a negative result. It is calculated by
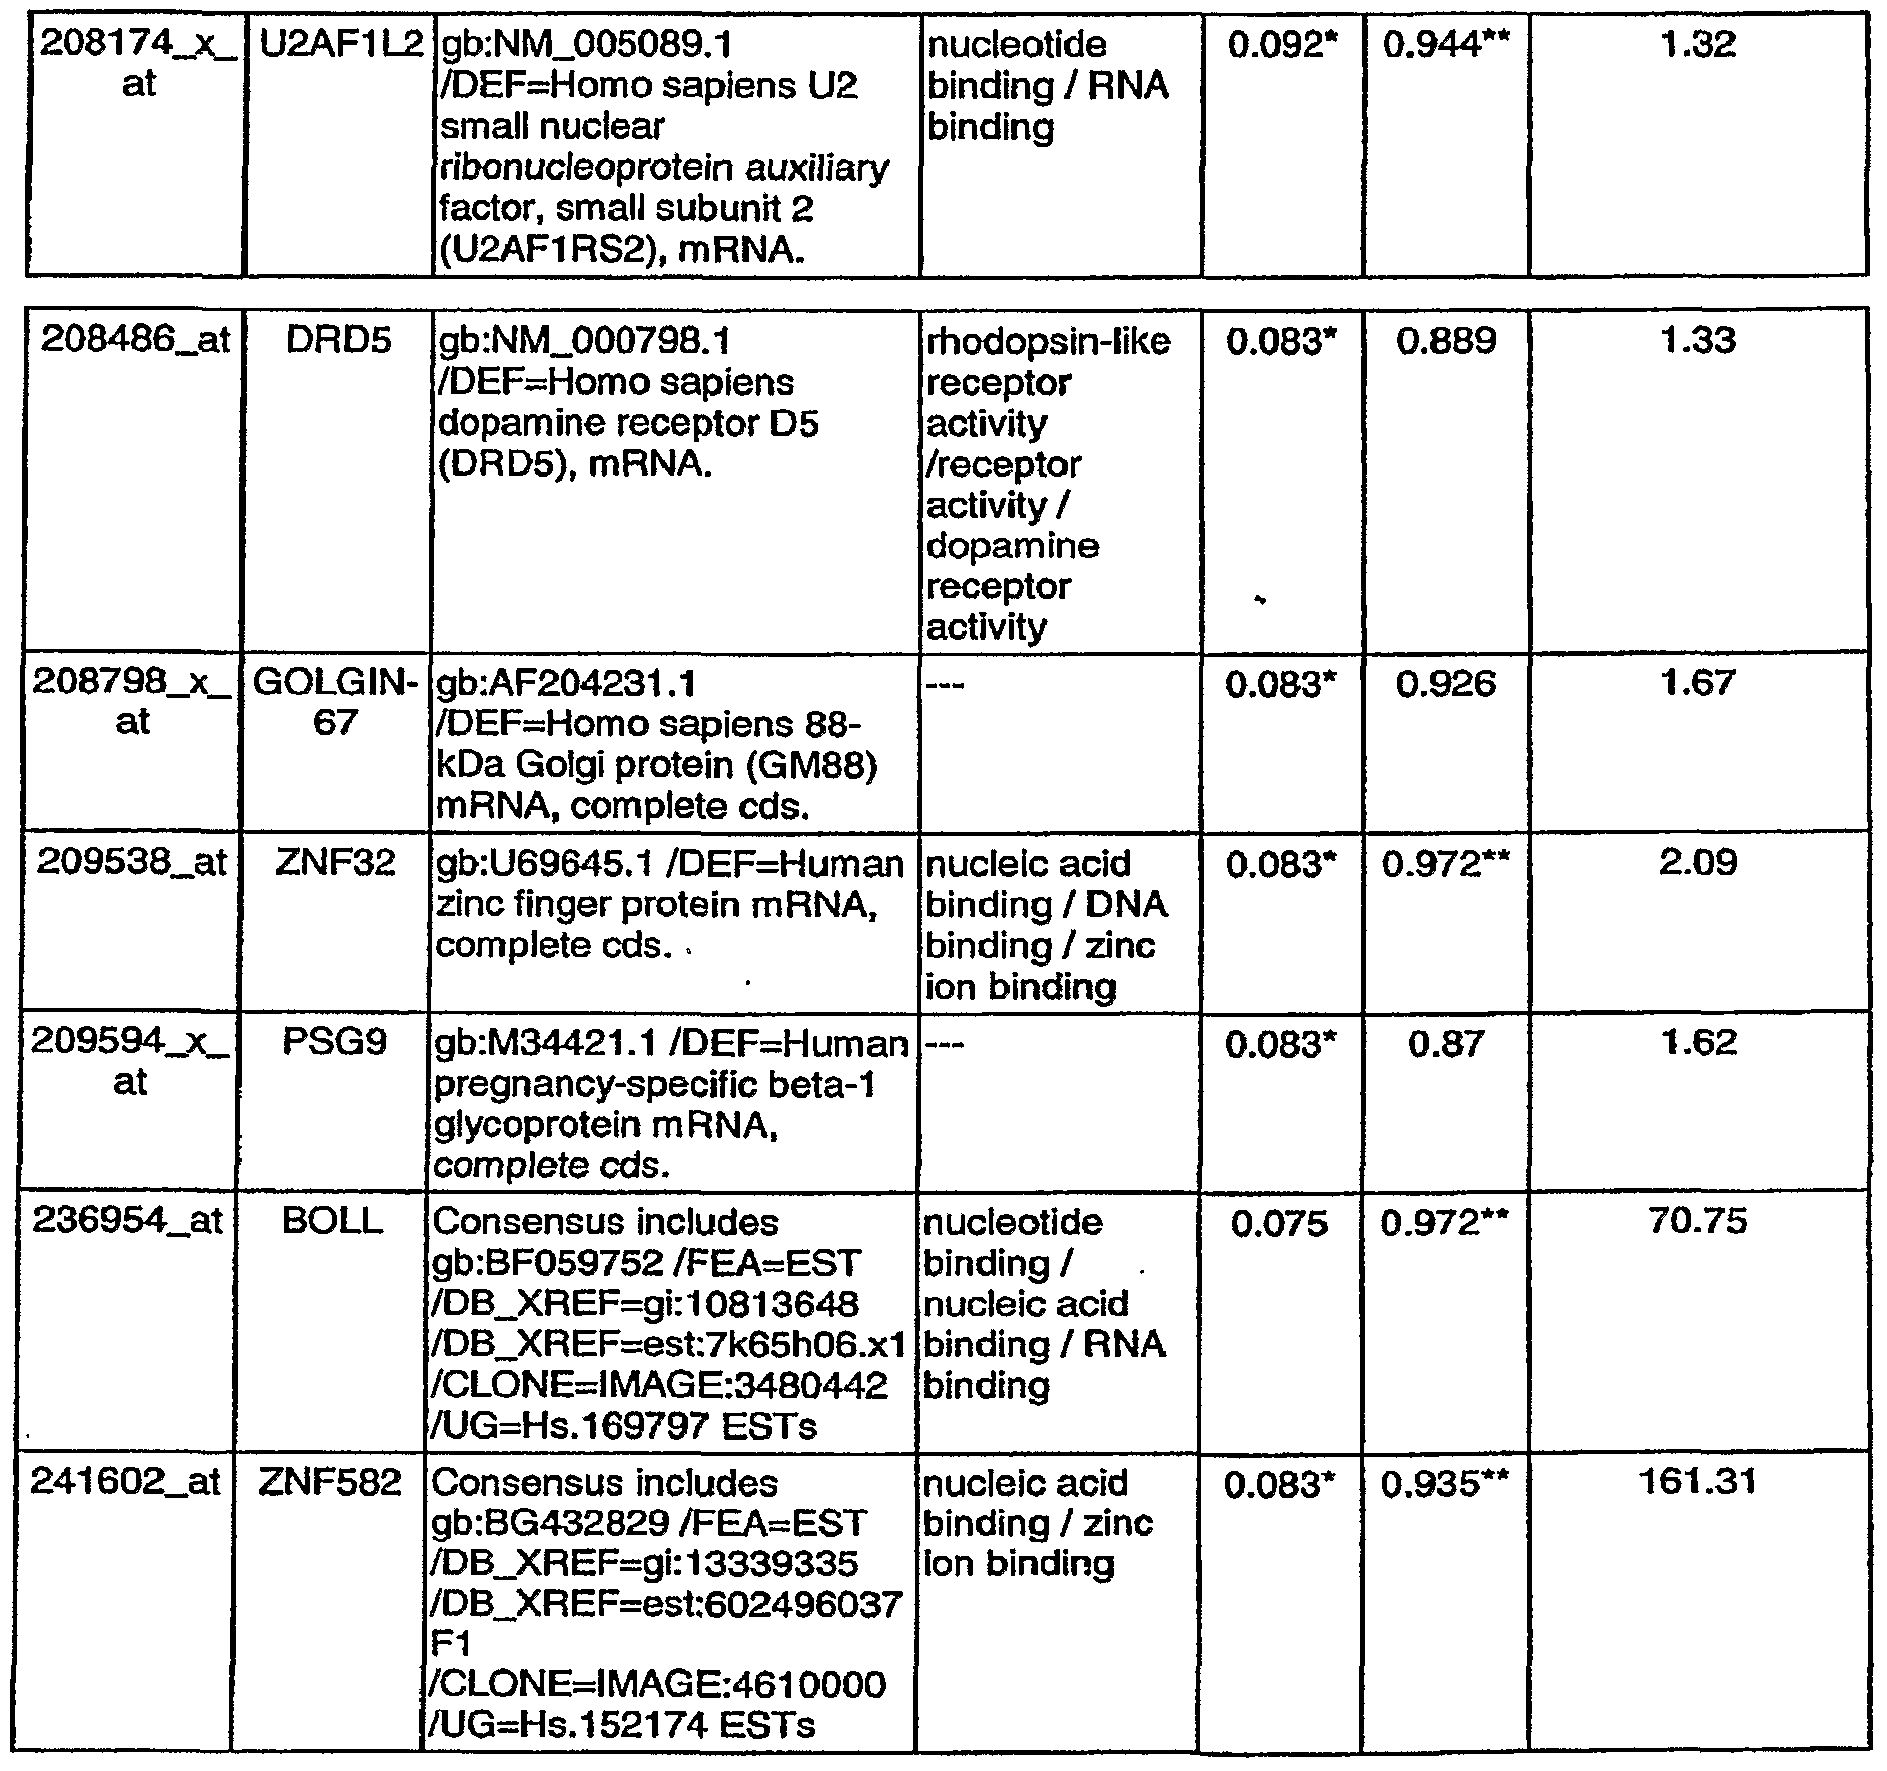
NPV=90%
To assess the misclassification rates, the approach described by Michiels 31 is utilized in accordance with Michiels S, Koscielny S, Hill C: Prediction of cancer outcome with microarrays: a multipte random validation strategy. Lancet 365:488-492, 2005, incorporated herein by reference. This method permits the determination of a mean rate of misclassification and plots this proportion of misclassification in validation sets as a function of the corresponding training set size (see figure 2)
This method consists in dividing the dataset into training sets of different size (from 5 to 19 samples) with at least one patient of each outcome. The remaining samples were considered as validation set (size from 16 to 2). 500 random training set were associated with each sample size. For a given training set, a classifier was built by SVM using thβ14 selected genes and tested in a designated validation test. As shown in figure 2, even with the smallest training size, the misclassification rate was only 25.6% (95 Cl 19% - 33.8%) and from a training set size > 13, the misclassification rate did not exceed 7.5%. First, we only considered genes called present in at least 50% of the patients from any one group. Data analysis was performed on the 19,365 remaining genes to determine an expression profile able to predict responder's patients. Differentially expressed genes between responders and non-responders were detected by means of the "Significance Analysis of Microarrays" method (SAM28). This approach allowed calculation of a d-score which corresponds to a Student's statistic with a factor added to the classic denominator. Then, genes were classified genes according to this score and their statistical significance. A set of genes with a relevant "False Discovery Rate" (FDR) of 20% were also identified.
The selected genes as a result of the SAM method was then ranked by computing the empirical area under the Receiver Operating Characteristic (ROC) curve (AUC) and the
35
empirical partial AUC (pAUC) restricted to a clinically relevant pertinent range of false-positive rates 29. The pAUC is an index of discrimination and the interval of chosen false positive rates allows considering a high specificity in order to particularly well detect the responder population. Then, the classification rule was defined with Support Vector Machines algorithm 30. Two parameters were required, the kernel function (RBF) and the magnitude of the penalty for violating the soft margin. Finally, leave-one-out cross validation (LOOCV) was used to estimate the performance and the accuracy of the output class prediction rule. With LOOCV, one sample is left out, and the remaining samples were used to construct a predictor classifier, which is used to classify the left-out sample. EXAMPLE 6
Functional classification of 14 genes from signature
All the 14 genes from signature were over-expressed in responder tumors. These genes showed a wide ratio as 1.3-160-fold increases in expression in sensitive compared with resistant tumors. According to GeneOntology classification, functional classes of these differentially expressed genes included RNA splicing (U2AF1 L2), regulation of transcription (ZNF32 and ZNF582), cell adhesion (F8, Galectin-8, PSG9), cell differentiation (SERPINE2, BOLL), ion transport (ATP5O), signal transduction (DRD5) development (ANGPTL2) and visual perception (EML2). GOLGIN-67 is a membrane Golgi protein whose function is unknown. Among the 14 genes, three genes, galectine-8, PSG9 and SERPINE2 (or PN-1), could he involved in the adhesion process. Galectin-8 is a matricellular protein that positively or negatively regulates cell adhesion, depending on the extracellular context 35. Moreover, the quantitative determination of the immunohistochemical expression of galectin-8 in the series of colon cancer specimens clearly showed that the extensively invasive colon cancers exhibited significantly less galectin-8 than locally invasive ones 36. PSG9, which is ectopically upregulated in vivo by colon cancer cells, 37 has an RGD motif in a conserved region in the N- terminal domain which suggests that these genes may function as adhesion recognition signals for integrins and are involved in adhesion/recognition processes 38. The serine proteinase inhibitor SERPINE2 could participate in maintaining the integrity of connective tissue matrices. SERPINE2 has been shown to inhibit tumour cell-mediated extracellular matrix destruction39. Two other genes, FVIII and ANGPTL2, could reflect the tumour vascularization. Indeed, intratumoral angiogenesis is commonly quantified by microvessel density measurement using immunohistochemical staining with monoclonal antibodies against factor VIII 40. ANGPTL2 protein induces sprouting in vascular endothelial cells 41 and
36
promotes angiogenβsis 42. Altogether, these results support the idea that the responder's tumour seems more adhesive and vascularized than the non-responder's one.
37
Claims
1. A method of predicting response of a human patient with colorectal cancer to chemotherapy, comprising detecting the expression of one or more genes selected from the group consisting of LGALS8, SERPINE2, ANGPTL2, ATP50, PRYM, EML2, F8, U2AF1L2, DRD5, GOLGIN-67, ZNF32, PSG9, BOLL, and ZNF583 in a tumor tissue sample from the patient wherein said gene expression is indicative of said patient's response to chemotherapy.
2. The method of claim 1 wherein the expression is 2 or more genes.
3. The method of claim 1, wherein the expression is 3 or more genes.
4. The method of claim 1 , wherein the expression is 4 or more genes.
5. The method of claim 1, wherein the expression is 5 or more genes.
6. The method of claim 1 , wherein the expression is 6 or more genes.
7. The method of claim 1 , wherein the expression is 7 or more genes.
8. The method of claim 1 , wherein the expression is 8 or more genes.
9. The method of claim 1 , wherein the expression is 9 or more genes.
10. The method of claim t, wherein the expression is 10 or more genes.
11. The method of claim 1 , wherein the expression is 11 or more genes.
12. The method of claim 1, wherein the expression is 12 or more genes.
13. The method of claim 1 , wherein the expression is 13 or more genes.
14. The method of claim 1, wherein the gene is selected from the following group SERP1NE2, ANGPTL2, ATP50, PRYM, EML2. F8, U2AF1L2, DRD5, GOLGIN-67, ZNF32, PSG9, BOLL, and ZNF583.
38
15. The method of claim 14, wherein the gene is selected from the following group ANGPTL2, ATP50. EML2. F8. U2AF1L2, DRD5, GOLGIN-67, ZNF32, PSG9, BOLL, and ZNF583.
16. The method of claim 15, wherein the gene is selected from the following group ATP50, EML2, F8, U2AF1 L2, DRD5, GOLGIN-67, ZNF32, PSG9, BOLL, and ZNF583.
17. The method of claim 16, wherein the gene is selected from the following group PRYM, EML2. F8, U2AF1L2, DRD5, GOLGIN-67, ZNF32, PSG9, BOLL, and ZNF583.
18. The method of claim 17, wherein the gene is selected from the following group EML2, F8, U2AF1L2, DRD5, GOLGIN-67, ZNF32, PSG9. BOLL, and ZNF583.
19. The method of claim 18, wherein the gene is selected from the following group F8, U2AF1L2, DRD5, GOLGIN-67, ZNF32. PSG9, BOLL, and ZNF583.
20. The method of claim 19, wherein the gene is selected from the following group U2AF1L2, DRD5, GOLGIN-67, ZNF32, PSG9, BOLL, and ZNF583.
21. The method of claim 20, wherein the gene is selected from the following group U2AF1L2, DRD5, GOLGIN-67, ZNF32, PSG9, BOLL, and ZNF583.
22. The method of claim 21, wherein the gene is selected from the following group DRD5, GOLGIN-67, ZNF32, PSG9, BOLL, and ZNF583.
23. The method of claim 22, wherein the gene is selected from the following group GOLGIN- 67, ZNF32, PSG9. BOLL, and ZNF583.
24. The method of claim 23, wherein the gene is selected from the following group ZNF32, PSG9, BOLL, and ZNF583.
25. The method of claim 24, wherein the gene Is selected from the following group PSG9, BOLL, and ZNF583.
39
26. The method of claim 25, wherein the gene is selected from the following group BOLL, and ZNF583.
27. The method of any of the preceding claims, wherein said chemotherapy comprises S administering a regimen of irinotecan, fluorouracil, and leucovorin to the patient.
28. The method of any of the claims 1 to 26, wherein said chemotherapy comprises administering a pharmaceutical regimen of oxaliplatin, fluorouracil, and leucovorin to the patient. 0
29. A method of any of the preceding claims wherein assessing the expression of any one or more of the genes LGALS8, SERPINE2, ANGPTL2, ATP50, PRYM, EML2, F8, U2AF1L2. DRD5, GOLGIN-67, ZNF32, PSG9, BOLL, and ZNF583 comprises detecting a protein derived from said genes in a tumor tissue sample from the patient wherein said gene expression is 5 indicative of said patient's response to chemotherapy.
30. A method of determining a chemotherapy regime for a human patient with colorectal cancer, comprising: a) detecting the expression of one or more genes selected from the following group LGALS8, SERPINE2, ANGPTL2, ATP50, PRYM, EML2, F8. U2AF1 L2, DRD5,
GOLGIN-67, ZNF32, PSG9, BOLL, and ZNF583 from a tumoral tissue sample from the patient wherein said gene expression is predicative of response to chemotherapy; and b) administering a regimen comprising irinotecan, fiuorouracil, and leucovorin to said patient if one or more of the genes listed in step (a) is detected in said patient.
31. A method of determining a chemotherapy regime for a human patient with colorectal cancer, comprising: a) detecting the expression of one or more genes selected from the following group LGALS8, SERPINE2, ANGPTL2, ATP50, PRYM, EML2, F8, U2AF1L2, DRD5, GOLGIN-67, ZNF32, PSG9, BOLL, and ZNF583 from a tissue sample from the patient wherein said gene expression is indicative of response to chemotherapy; and b) administering a regimen comprising oxaliplatin, fluorouracil, and leucovorin to one or more of the genes listed in step (a) is not detected in said patient.
40
32. A method of modifying a chemotherapy treatment for a human patient with colorectal cancer, comprising: a) administering a chemotherapy regimen to the patient; b) detecting the expression of one or more genes selected from the following group LGALS8, SERPINE2, ANGPTL2, ATP50, PRYM, EML2, F8, U2AF1L2, DRD5,
GOLGIN-67, ZNF32, PSG9, BOLL, and ZNF583 from a tissue sample from the patient; and c) administering irinotecan, fluorouracil, and leucovorin when one or more genes identified in (b) are expressed or administering oxaliplatin, fluorouracil, and leucovorin when one or more genes identified in (b) are not expressed.
33. A method of any of the preceding claims wherein said method comprises detecting a response of a human patient with metastatic colorectal cancer to chemotherapy.
34. A method of any of claims 30 to 32 wherein said pharmaceutical regime comprises administering to said patient irinotecan, fluorouracil, and leucovorin.
35. A method of any of claims 30 to 32 wherein said pharmaceutical regime comprises administering to said patient oxaliplatin, fluorouracil, and leucovorin.
36. A kit for use to select the optimal chemotherapy from several alternative treatment options for a human patient with colorectal cancer, the kit comprising: a. a microarray for detecting a mRNA derived from a sample from said human to assess the expression of the one or more of the following genes LGALS8, SERPINE2, ANGPTL2, ATP50, PRYM, EML2, F8, U2AF1L2, DRD5, GOLGIN-67, ZNF32, PSG9, BOLL, and ZNF583; and b. instructions describing a method of using said microarray.
37. A kit as in claim 36 wherein the microarray is a gene chip.
38. A kit for use to select the optimal chemotherapy from several alternative treatment options for a human patient with colorectal cancer, the kit comprising: a. a Western blot kit for detecting a protein derived from a sample from said human to assess the expression of the one or more of the following genes LGALS8, SERPINE2,
41 ANGPTL2, ATP50, PRYM, EML2, F8, U2AF1L2, DRD5, GOLGIN-67, ZNF32. PSG9, BOLL, and 2NF583; and b. instructions describing a method of using said Western blot kit.
39. A kit of any of claims 36-38 is for use to select the optimal chemotherapy from several alternative treatment options for a human patient with metastatic colorectal cancer.
42
Priority Applications (4)
| Application Number | Priority Date | Filing Date | Title |
|---|---|---|---|
| EP07751907A EP1994177A4 (en) | 2006-02-28 | 2007-02-28 | Gene predictors of response to metastatic colorectal chemotherapy |
| JP2008557349A JP2009528061A (en) | 2006-02-28 | 2007-02-28 | Gene predictors of response to metastatic colorectal chemotherapy |
| CA002643225A CA2643225A1 (en) | 2006-02-28 | 2007-02-28 | Gene predictors of response to metastatic colorectal chemotherapy |
| US12/224,335 US20090221609A1 (en) | 2006-02-28 | 2007-02-28 | Gene Predictors of Response to Metastatic Colorectal Chemotherapy |
Applications Claiming Priority (4)
| Application Number | Priority Date | Filing Date | Title |
|---|---|---|---|
| US77813806P | 2006-02-28 | 2006-02-28 | |
| US60/778,138 | 2006-02-28 | ||
| US87751606P | 2006-12-28 | 2006-12-28 | |
| US60/877,516 | 2006-12-28 |
Publications (3)
| Publication Number | Publication Date |
|---|---|
| WO2007100859A2 true WO2007100859A2 (en) | 2007-09-07 |
| WO2007100859A9 WO2007100859A9 (en) | 2007-10-25 |
| WO2007100859A3 WO2007100859A3 (en) | 2008-10-30 |
Family
ID=38459657
Family Applications (1)
| Application Number | Title | Priority Date | Filing Date |
|---|---|---|---|
| PCT/US2007/005176 WO2007100859A2 (en) | 2006-02-28 | 2007-02-28 | Gene predictors of response to metastatic colorectal chemotherapy |
Country Status (5)
| Country | Link |
|---|---|
| US (1) | US20090221609A1 (en) |
| EP (1) | EP1994177A4 (en) |
| JP (1) | JP2009528061A (en) |
| CA (1) | CA2643225A1 (en) |
| WO (1) | WO2007100859A2 (en) |
Cited By (8)
| Publication number | Priority date | Publication date | Assignee | Title |
|---|---|---|---|---|
| WO2009121878A2 (en) * | 2008-03-31 | 2009-10-08 | Universite Joseph Fourier | In vitro diagnostic method for the diagnosis of somatic and ovarian cancers |
| EP2169078A1 (en) * | 2008-09-26 | 2010-03-31 | Fundacion Gaiker | Methods and kits for the diagnosis and the staging of colorectal cancer |
| EP2319943A1 (en) * | 2009-11-05 | 2011-05-11 | Epigenomics AG | Methods of predicting therapeutic efficacy of cancer therapy |
| WO2012066451A1 (en) * | 2010-11-15 | 2012-05-24 | Pfizer Inc. | Prognostic and predictive gene signature for colon cancer |
| US9028831B2 (en) | 2009-09-02 | 2015-05-12 | Fundació Institut de Recerca Hospital Universitari Vall d'Hebron, Fundació Privado | Markers for selecting personalized therapies for the treatment of cancer |
| CN105468893A (en) * | 2014-09-26 | 2016-04-06 | 希森美康株式会社 | Computer system, program, and method for assisting recurrence risk diagnosis of colorectal cancer |
| US10900084B2 (en) | 2015-09-16 | 2021-01-26 | Sysmex Corporation | Method for supporting diagnosis of risk of colorectal cancer recurrence, treatment of colorectal cancer, and administration of anticancer drug |
| CN115721718A (en) * | 2022-09-16 | 2023-03-03 | 湖南灵康医疗科技有限公司 | Application of inhibiting ZNF32 gene expression in preparing colorectal cancer medicament |
Families Citing this family (4)
| Publication number | Priority date | Publication date | Assignee | Title |
|---|---|---|---|---|
| WO2013150167A2 (en) * | 2012-04-03 | 2013-10-10 | Servicio Andaluz De Salud | Microrna expression model as a survival indicator in patients having metastatic colorectal cancer |
| AU2015246009B2 (en) | 2014-04-10 | 2020-07-09 | Bio-Marcare Technologies Ltd. | Methods and kits for identifying pre-cancerous colorectal polyps and colorectal cancer |
| JP6757560B2 (en) * | 2014-09-26 | 2020-09-23 | シスメックス株式会社 | Methods, programs and computer systems to assist in diagnosing the risk of recurrence of colorectal cancer |
| CN110241221B (en) * | 2019-07-31 | 2022-07-19 | 中山大学附属第六医院 | Kit and system for prognosis prediction of metastatic colorectal cancer |
Family Cites Families (6)
| Publication number | Priority date | Publication date | Assignee | Title |
|---|---|---|---|---|
| US5545522A (en) * | 1989-09-22 | 1996-08-13 | Van Gelder; Russell N. | Process for amplifying a target polynucleotide sequence using a single primer-promoter complex |
| US5849481A (en) * | 1990-07-27 | 1998-12-15 | Chiron Corporation | Nucleic acid hybridization assays employing large comb-type branched polynucleotides |
| US5849486A (en) * | 1993-11-01 | 1998-12-15 | Nanogen, Inc. | Methods for hybridization analysis utilizing electrically controlled hybridization |
| US5837832A (en) * | 1993-06-25 | 1998-11-17 | Affymetrix, Inc. | Arrays of nucleic acid probes on biological chips |
| US5851772A (en) * | 1996-01-29 | 1998-12-22 | University Of Chicago | Microchip method for the enrichment of specific DNA sequences |
| US5837860A (en) * | 1997-03-05 | 1998-11-17 | Molecular Tool, Inc. | Covalent attachment of nucleic acid molecules onto solid-phases via disulfide bonds |
-
2007
- 2007-02-28 EP EP07751907A patent/EP1994177A4/en not_active Withdrawn
- 2007-02-28 CA CA002643225A patent/CA2643225A1/en not_active Abandoned
- 2007-02-28 JP JP2008557349A patent/JP2009528061A/en active Pending
- 2007-02-28 US US12/224,335 patent/US20090221609A1/en not_active Abandoned
- 2007-02-28 WO PCT/US2007/005176 patent/WO2007100859A2/en active Application Filing
Non-Patent Citations (1)
| Title |
|---|
| See references of EP1994177A4 * |
Cited By (12)
| Publication number | Priority date | Publication date | Assignee | Title |
|---|---|---|---|---|
| WO2009121878A2 (en) * | 2008-03-31 | 2009-10-08 | Universite Joseph Fourier | In vitro diagnostic method for the diagnosis of somatic and ovarian cancers |
| WO2009121878A3 (en) * | 2008-03-31 | 2010-01-21 | Universite Joseph Fourier | In vitro diagnostic method for the diagnosis of somatic and ovarian cancers |
| EP2169078A1 (en) * | 2008-09-26 | 2010-03-31 | Fundacion Gaiker | Methods and kits for the diagnosis and the staging of colorectal cancer |
| WO2010034794A2 (en) * | 2008-09-26 | 2010-04-01 | Universidad Del País Vasco | Methods and kits for the diagnosis and the staging of colorectal cancer |
| WO2010034794A3 (en) * | 2008-09-26 | 2010-06-24 | Universidad Del País Vasco | Methods and kits for the diagnosis and the staging of colorectal cancer |
| US9028831B2 (en) | 2009-09-02 | 2015-05-12 | Fundació Institut de Recerca Hospital Universitari Vall d'Hebron, Fundació Privado | Markers for selecting personalized therapies for the treatment of cancer |
| EP2319943A1 (en) * | 2009-11-05 | 2011-05-11 | Epigenomics AG | Methods of predicting therapeutic efficacy of cancer therapy |
| WO2012066451A1 (en) * | 2010-11-15 | 2012-05-24 | Pfizer Inc. | Prognostic and predictive gene signature for colon cancer |
| CN105468893A (en) * | 2014-09-26 | 2016-04-06 | 希森美康株式会社 | Computer system, program, and method for assisting recurrence risk diagnosis of colorectal cancer |
| EP3009842A3 (en) * | 2014-09-26 | 2016-07-20 | Sysmex Corporation | Method for supporting diagnosis of risk of colorectal cancer recurrence, program and computer system |
| US10900084B2 (en) | 2015-09-16 | 2021-01-26 | Sysmex Corporation | Method for supporting diagnosis of risk of colorectal cancer recurrence, treatment of colorectal cancer, and administration of anticancer drug |
| CN115721718A (en) * | 2022-09-16 | 2023-03-03 | 湖南灵康医疗科技有限公司 | Application of inhibiting ZNF32 gene expression in preparing colorectal cancer medicament |
Also Published As
| Publication number | Publication date |
|---|---|
| WO2007100859A3 (en) | 2008-10-30 |
| JP2009528061A (en) | 2009-08-06 |
| CA2643225A1 (en) | 2007-09-07 |
| EP1994177A4 (en) | 2010-03-31 |
| EP1994177A2 (en) | 2008-11-26 |
| US20090221609A1 (en) | 2009-09-03 |
| WO2007100859A9 (en) | 2007-10-25 |
Similar Documents
| Publication | Publication Date | Title |
|---|---|---|
| US20090221609A1 (en) | Gene Predictors of Response to Metastatic Colorectal Chemotherapy | |
| JP5745848B2 (en) | Signs of growth and prognosis in gastrointestinal cancer | |
| JP6404304B2 (en) | Prognosis prediction of melanoma cancer | |
| US10196691B2 (en) | Colon cancer gene expression signatures and methods of use | |
| US20130172203A1 (en) | Hybrid model for the classification of carcinoma subtypes | |
| Chon et al. | Microarray-based gene expression studies in ovarian cancer | |
| JP2006521793A (en) | Gene expression marker responsive to EGFR inhibitor drug | |
| US20170211155A1 (en) | Method for predicting risk of metastasis | |
| JP2006521793A5 (en) | ||
| EP2304631A1 (en) | Algorithms for outcome prediction in patients with node-positive chemotherapy-treated breast cancer | |
| JP2009528825A (en) | Molecular analysis to predict recurrence of Dukes B colorectal cancer | |
| JP2007506442A (en) | Gene expression markers for response to EGFR inhibitors | |
| US20110143946A1 (en) | Method for predicting the response of a tumor in a patient suffering from or at risk of developing recurrent gynecologic cancer towards a chemotherapeutic agent | |
| AU2008203226B2 (en) | Colorectal cancer prognostics | |
| JP7352937B2 (en) | Differential marker gene set, method and kit for differentiating or classifying breast cancer subtypes | |
| MX2011006926A (en) | Methods and means for typing a sample comprising colorectal cancer cells. | |
| WO2016118670A1 (en) | Multigene expression assay for patient stratification in resected colorectal liver metastases | |
| US20090297506A1 (en) | Classification of cancer | |
| EP3580357A1 (en) | Algorithms and methods for assessing late clinical endpoints in prostate cancer | |
| KR101346955B1 (en) | Composition for predicting the recurrence possibility and survival prognosis of brain tumor and kit comprising the same | |
| JP6694429B2 (en) | Mutations in the epidermal growth factor receptor kinase domain | |
| WO2018098241A1 (en) | Methods of assessing risk of recurrent prostate cancer | |
| US20090239756A1 (en) | Predictors for metastasis of breast cancer |
Legal Events
| Date | Code | Title | Description |
|---|---|---|---|
| WWE | Wipo information: entry into national phase |
Ref document number: 2643225 Country of ref document: CA |
|
| WWE | Wipo information: entry into national phase |
Ref document number: 2008557349 Country of ref document: JP |
|
| NENP | Non-entry into the national phase |
Ref country code: DE |
|
| WWE | Wipo information: entry into national phase |
Ref document number: 2007751907 Country of ref document: EP |
|
| WWE | Wipo information: entry into national phase |
Ref document number: 12224335 Country of ref document: US |