WO1998020323A1 - Particle analysis system and method - Google Patents
Particle analysis system and method Download PDFInfo
- Publication number
- WO1998020323A1 WO1998020323A1 PCT/US1997/020539 US9720539W WO9820323A1 WO 1998020323 A1 WO1998020323 A1 WO 1998020323A1 US 9720539 W US9720539 W US 9720539W WO 9820323 A1 WO9820323 A1 WO 9820323A1
- Authority
- WO
- WIPO (PCT)
- Prior art keywords
- particles
- particle
- light
- wavelengths
- size distribution
- Prior art date
Links
- 239000002245 particle Substances 0.000 title claims abstract description 306
- 238000000034 method Methods 0.000 title claims abstract description 112
- 238000004458 analytical method Methods 0.000 title claims description 18
- 238000009826 distribution Methods 0.000 claims abstract description 99
- 230000003993 interaction Effects 0.000 claims abstract description 49
- 238000010521 absorption reaction Methods 0.000 claims abstract description 17
- 238000000149 argon plasma sintering Methods 0.000 claims abstract description 15
- 230000004044 response Effects 0.000 claims abstract description 14
- 230000008569 process Effects 0.000 claims description 43
- 239000012530 fluid Substances 0.000 claims description 25
- 239000000725 suspension Substances 0.000 claims description 25
- 238000004364 calculation method Methods 0.000 claims description 15
- 238000001514 detection method Methods 0.000 claims description 15
- 238000000926 separation method Methods 0.000 claims description 13
- 238000009792 diffusion process Methods 0.000 claims description 10
- 238000006243 chemical reaction Methods 0.000 claims description 8
- 238000004863 hard-sphere model Methods 0.000 claims description 8
- 239000007788 liquid Substances 0.000 claims description 7
- 230000001419 dependent effect Effects 0.000 claims description 6
- 238000005259 measurement Methods 0.000 abstract description 66
- 238000013459 approach Methods 0.000 abstract description 8
- 230000010363 phase shift Effects 0.000 description 31
- 239000000835 fiber Substances 0.000 description 24
- 238000002296 dynamic light scattering Methods 0.000 description 21
- 239000000523 sample Substances 0.000 description 20
- 230000003287 optical effect Effects 0.000 description 14
- 239000007787 solid Substances 0.000 description 14
- 239000011159 matrix material Substances 0.000 description 13
- 239000013078 crystal Substances 0.000 description 12
- 230000006870 function Effects 0.000 description 12
- 239000006185 dispersion Substances 0.000 description 11
- GWEVSGVZZGPLCZ-UHFFFAOYSA-N Titan oxide Chemical compound O=[Ti]=O GWEVSGVZZGPLCZ-UHFFFAOYSA-N 0.000 description 10
- 239000000243 solution Substances 0.000 description 10
- 239000013598 vector Substances 0.000 description 9
- 238000013508 migration Methods 0.000 description 8
- 230000005012 migration Effects 0.000 description 8
- 239000004793 Polystyrene Substances 0.000 description 7
- 239000013307 optical fiber Substances 0.000 description 7
- 229920002223 polystyrene Polymers 0.000 description 7
- 238000005070 sampling Methods 0.000 description 6
- 238000001228 spectrum Methods 0.000 description 6
- YBJHBAHKTGYVGT-ZKWXMUAHSA-N (+)-Biotin Chemical compound N1C(=O)N[C@@H]2[C@H](CCCCC(=O)O)SC[C@@H]21 YBJHBAHKTGYVGT-ZKWXMUAHSA-N 0.000 description 5
- 238000004422 calculation algorithm Methods 0.000 description 5
- 238000004513 sizing Methods 0.000 description 5
- 239000000126 substance Substances 0.000 description 5
- -1 various coatings Substances 0.000 description 5
- FEPMHVLSLDOMQC-UHFFFAOYSA-N virginiamycin-S1 Natural products CC1OC(=O)C(C=2C=CC=CC=2)NC(=O)C2CC(=O)CCN2C(=O)C(CC=2C=CC=CC=2)N(C)C(=O)C2CCCN2C(=O)C(CC)NC(=O)C1NC(=O)C1=NC=CC=C1O FEPMHVLSLDOMQC-UHFFFAOYSA-N 0.000 description 5
- 238000007720 emulsion polymerization reaction Methods 0.000 description 4
- NOESYZHRGYRDHS-UHFFFAOYSA-N insulin Chemical compound N1C(=O)C(NC(=O)C(CCC(N)=O)NC(=O)C(CCC(O)=O)NC(=O)C(C(C)C)NC(=O)C(NC(=O)CN)C(C)CC)CSSCC(C(NC(CO)C(=O)NC(CC(C)C)C(=O)NC(CC=2C=CC(O)=CC=2)C(=O)NC(CCC(N)=O)C(=O)NC(CC(C)C)C(=O)NC(CCC(O)=O)C(=O)NC(CC(N)=O)C(=O)NC(CC=2C=CC(O)=CC=2)C(=O)NC(CSSCC(NC(=O)C(C(C)C)NC(=O)C(CC(C)C)NC(=O)C(CC=2C=CC(O)=CC=2)NC(=O)C(CC(C)C)NC(=O)C(C)NC(=O)C(CCC(O)=O)NC(=O)C(C(C)C)NC(=O)C(CC(C)C)NC(=O)C(CC=2NC=NC=2)NC(=O)C(CO)NC(=O)CNC2=O)C(=O)NCC(=O)NC(CCC(O)=O)C(=O)NC(CCCNC(N)=N)C(=O)NCC(=O)NC(CC=3C=CC=CC=3)C(=O)NC(CC=3C=CC=CC=3)C(=O)NC(CC=3C=CC(O)=CC=3)C(=O)NC(C(C)O)C(=O)N3C(CCC3)C(=O)NC(CCCCN)C(=O)NC(C)C(O)=O)C(=O)NC(CC(N)=O)C(O)=O)=O)NC(=O)C(C(C)CC)NC(=O)C(CO)NC(=O)C(C(C)O)NC(=O)C1CSSCC2NC(=O)C(CC(C)C)NC(=O)C(NC(=O)C(CCC(N)=O)NC(=O)C(CC(N)=O)NC(=O)C(NC(=O)C(N)CC=1C=CC=CC=1)C(C)C)CC1=CN=CN1 NOESYZHRGYRDHS-UHFFFAOYSA-N 0.000 description 4
- 239000000178 monomer Substances 0.000 description 4
- 239000004408 titanium dioxide Substances 0.000 description 4
- 230000008901 benefit Effects 0.000 description 3
- 230000008859 change Effects 0.000 description 3
- 238000001311 chemical methods and process Methods 0.000 description 3
- 238000002425 crystallisation Methods 0.000 description 3
- 230000008025 crystallization Effects 0.000 description 3
- 238000011161 development Methods 0.000 description 3
- 238000010790 dilution Methods 0.000 description 3
- 239000012895 dilution Substances 0.000 description 3
- 239000000839 emulsion Substances 0.000 description 3
- 238000002474 experimental method Methods 0.000 description 3
- 238000012986 modification Methods 0.000 description 3
- 230000004048 modification Effects 0.000 description 3
- 238000012545 processing Methods 0.000 description 3
- 238000004088 simulation Methods 0.000 description 3
- 238000012360 testing method Methods 0.000 description 3
- 239000010936 titanium Substances 0.000 description 3
- 229910052719 titanium Inorganic materials 0.000 description 3
- 102000004877 Insulin Human genes 0.000 description 2
- 108090001061 Insulin Proteins 0.000 description 2
- RTAQQCXQSZGOHL-UHFFFAOYSA-N Titanium Chemical compound [Ti] RTAQQCXQSZGOHL-UHFFFAOYSA-N 0.000 description 2
- 238000000333 X-ray scattering Methods 0.000 description 2
- 230000002411 adverse Effects 0.000 description 2
- XKRFYHLGVUSROY-UHFFFAOYSA-N argon Substances [Ar] XKRFYHLGVUSROY-UHFFFAOYSA-N 0.000 description 2
- 229910052786 argon Inorganic materials 0.000 description 2
- 230000008033 biological extinction Effects 0.000 description 2
- 238000012512 characterization method Methods 0.000 description 2
- 230000000052 comparative effect Effects 0.000 description 2
- 239000012470 diluted sample Substances 0.000 description 2
- 238000005516 engineering process Methods 0.000 description 2
- 239000011521 glass Substances 0.000 description 2
- 230000001976 improved effect Effects 0.000 description 2
- 229940125396 insulin Drugs 0.000 description 2
- 238000004519 manufacturing process Methods 0.000 description 2
- 238000012544 monitoring process Methods 0.000 description 2
- 239000003973 paint Substances 0.000 description 2
- 238000005191 phase separation Methods 0.000 description 2
- 229920000642 polymer Polymers 0.000 description 2
- 238000004886 process control Methods 0.000 description 2
- 230000001902 propagating effect Effects 0.000 description 2
- 238000011084 recovery Methods 0.000 description 2
- 238000000611 regression analysis Methods 0.000 description 2
- 230000001105 regulatory effect Effects 0.000 description 2
- 230000035945 sensitivity Effects 0.000 description 2
- 239000012798 spherical particle Substances 0.000 description 2
- 238000012546 transfer Methods 0.000 description 2
- 238000004627 transmission electron microscopy Methods 0.000 description 2
- 238000012935 Averaging Methods 0.000 description 1
- 241000894006 Bacteria Species 0.000 description 1
- 230000005653 Brownian motion process Effects 0.000 description 1
- 241001274197 Scatophagus argus Species 0.000 description 1
- 238000002835 absorbance Methods 0.000 description 1
- NIXOWILDQLNWCW-UHFFFAOYSA-N acrylic acid group Chemical group C(C=C)(=O)O NIXOWILDQLNWCW-UHFFFAOYSA-N 0.000 description 1
- 230000009471 action Effects 0.000 description 1
- 238000013019 agitation Methods 0.000 description 1
- 230000004075 alteration Effects 0.000 description 1
- 230000003321 amplification Effects 0.000 description 1
- 230000003466 anti-cipated effect Effects 0.000 description 1
- 238000010923 batch production Methods 0.000 description 1
- 230000015572 biosynthetic process Effects 0.000 description 1
- 238000005537 brownian motion Methods 0.000 description 1
- 238000004581 coalescence Methods 0.000 description 1
- 238000000576 coating method Methods 0.000 description 1
- 239000012141 concentrate Substances 0.000 description 1
- 239000000470 constituent Substances 0.000 description 1
- 238000007796 conventional method Methods 0.000 description 1
- 230000008878 coupling Effects 0.000 description 1
- 238000010168 coupling process Methods 0.000 description 1
- 238000005859 coupling reaction Methods 0.000 description 1
- 239000005343 cylinder glass Substances 0.000 description 1
- 230000006378 damage Effects 0.000 description 1
- 238000000354 decomposition reaction Methods 0.000 description 1
- 230000007423 decrease Effects 0.000 description 1
- 238000013461 design Methods 0.000 description 1
- 230000008034 disappearance Effects 0.000 description 1
- 239000003792 electrolyte Substances 0.000 description 1
- 238000001704 evaporation Methods 0.000 description 1
- 230000008020 evaporation Effects 0.000 description 1
- 239000010419 fine particle Substances 0.000 description 1
- 238000009472 formulation Methods 0.000 description 1
- 238000005194 fractionation Methods 0.000 description 1
- 239000008187 granular material Substances 0.000 description 1
- 230000036541 health Effects 0.000 description 1
- 230000003116 impacting effect Effects 0.000 description 1
- 238000011065 in-situ storage Methods 0.000 description 1
- 230000000977 initiatory effect Effects 0.000 description 1
- 230000002452 interceptive effect Effects 0.000 description 1
- 238000002955 isolation Methods 0.000 description 1
- 230000000670 limiting effect Effects 0.000 description 1
- 238000012423 maintenance Methods 0.000 description 1
- 239000000463 material Substances 0.000 description 1
- 239000004005 microsphere Substances 0.000 description 1
- 239000000203 mixture Substances 0.000 description 1
- 238000003199 nucleic acid amplification method Methods 0.000 description 1
- 238000005457 optimization Methods 0.000 description 1
- 210000003463 organelle Anatomy 0.000 description 1
- 230000008520 organization Effects 0.000 description 1
- 230000037361 pathway Effects 0.000 description 1
- 238000006116 polymerization reaction Methods 0.000 description 1
- 230000001737 promoting effect Effects 0.000 description 1
- 230000000644 propagated effect Effects 0.000 description 1
- 230000002829 reductive effect Effects 0.000 description 1
- 230000002040 relaxant effect Effects 0.000 description 1
- 238000012776 robust process Methods 0.000 description 1
- 229910052594 sapphire Inorganic materials 0.000 description 1
- 239000010980 sapphire Substances 0.000 description 1
- 238000004062 sedimentation Methods 0.000 description 1
- 238000001542 size-exclusion chromatography Methods 0.000 description 1
- 238000000638 solvent extraction Methods 0.000 description 1
- 230000003595 spectral effect Effects 0.000 description 1
- 230000006641 stabilisation Effects 0.000 description 1
- 238000011105 stabilization Methods 0.000 description 1
- 238000006467 substitution reaction Methods 0.000 description 1
- 238000010408 sweeping Methods 0.000 description 1
- 229920003051 synthetic elastomer Polymers 0.000 description 1
- 239000005061 synthetic rubber Substances 0.000 description 1
- 230000036962 time dependent Effects 0.000 description 1
- 239000011882 ultra-fine particle Substances 0.000 description 1
- 238000012795 verification Methods 0.000 description 1
- XLYOFNOQVPJJNP-UHFFFAOYSA-N water Chemical compound O XLYOFNOQVPJJNP-UHFFFAOYSA-N 0.000 description 1
Classifications
-
- G—PHYSICS
- G01—MEASURING; TESTING
- G01N—INVESTIGATING OR ANALYSING MATERIALS BY DETERMINING THEIR CHEMICAL OR PHYSICAL PROPERTIES
- G01N21/00—Investigating or analysing materials by the use of optical means, i.e. using sub-millimetre waves, infrared, visible or ultraviolet light
- G01N21/17—Systems in which incident light is modified in accordance with the properties of the material investigated
- G01N21/47—Scattering, i.e. diffuse reflection
- G01N21/49—Scattering, i.e. diffuse reflection within a body or fluid
-
- G—PHYSICS
- G01—MEASURING; TESTING
- G01N—INVESTIGATING OR ANALYSING MATERIALS BY DETERMINING THEIR CHEMICAL OR PHYSICAL PROPERTIES
- G01N15/00—Investigating characteristics of particles; Investigating permeability, pore-volume, or surface-area of porous materials
- G01N15/02—Investigating particle size or size distribution
- G01N15/0205—Investigating particle size or size distribution by optical means, e.g. by light scattering, diffraction, holography or imaging
Definitions
- the present invention relates to the analysis of particles with multiply scattered light, and more particularly, but not exclusively, relates to the determination of size distribution and volume fraction of particles using photon migration techniques.
- PSD Particle Size Distribution
- emulsion polymerization processes produce paints, various coatings, and synthetic rubbers to name only a few Since emulsion polymerization involves the growth of suspended polymer particles, PSD measurements can yield insight into the extent of reaction and molecular weight distribution and can also provide means for product characterization These measurements can also be adapted to many crystallization processes, such as in the food industry, pharmaceutics, agricultural products, and bulk chemicals
- One way to optimize many of the processes involving a dispersion of particles is by providing on-line measurement of particle size distribution in combination with robust process control responsive to these measurements
- turbidity analysis is only effective for diluted samples such that the product of turbidity, ⁇ , and pathlength, L, is less than about 0 3 In other
- the optical path of the sample is no less than about three times the mean distance between scattering particles Van de Hulst, H Light Scattering by Small Particles Dover Publications, New York (1983), J Wang, and F R Hallet, Spherical Particle Size Determination by Analytical Inversion
- the particle diffusion coefficient can be computed and the radius obtained from the Stokes-Einstein equation
- a statistical number of measurements of diluted and pretreated samples can provide a PSD
- DLS techniques are often used as the laboratory "standard” for spherical particles having a diameter of less than 10 microns Thomas, J C
- Turbidity, DLS, and diffraction measurements all require careful calibration of the light source and detector to provide meaningful measurements Also, the possibility that wavelength dependent sample absorbance will vary during normal process disturbances and feedstock changes threatens the accuracy of these techniques More importantly, these approaches all require a relatively dilute sample compared to the usual process concentration in order to be effective Turbidity, DLS, and diffraction techniques suffer from other limitations which complicates on-line implementation For example, on-line application of these techniques would require automated sampling procedures For sizing solids, side stream measurements frequently create maintenance problems such as clogged pumps, conduits and filters within sampling devices For sizing of liquid droplets, side stream measurements often induce coalescence and breakup Furthermore the mechanical action of most automated sampling procedures may change the particle, crystal, or dispersed phase size distribution Moreover, on-line measurements under these approaches may require substantial dilution, phase separation, or sample destruction to be effective
- a laser reflection or "backscatter” technique such as the PAR TEC 100 available from Laser Sensor Technology
- This system includes a laser with a narrow beam focused directly into a polydisperse medium undergoing processing The focal position is made to vibrate at a high rate so that the beam travels significantly faster than particles in the medium.
- particles intercept the beam and reflect light for a duration of time which is proportional to the particle size.
- the reflected light is detected and timed, and a particle size is inferred from this information.
- the instrument counts the number of times each size occurs. Besides the constraint on speed of the beam relative to particle motion, tests have shown that this system consistently measures small particles as too large and large particles as too small. Also, the range swept by the laser beam must be smaller than the smallest particle size to be measured.
- laser reflection techniques are based upon discrete single particle measurements to reconstruct PSD.
- Laser reflection measurements are sensitive to erroneous positioning of the focal plane, contribution of higher order scattering, and sampling error brought about by the hydrodynamic partitioning of large particles away from the wall and sensor head. In addition, the measurements are reported not to be accurate with non-opaque particles or dispersed droplets. Sparks, R.G., and C.L. Dobbs, The Use of Laser Backscatter Instrumentation for On-Line Measurement of the Particle Size Distribution of Emulsions, Part. Part. Syst. Charact. 10, 279-289 (1993) provides additional information concerning this technique.
- Turbidity, DLS, Diffraction, and Laser reflection are all limited to some extent by the multiple scattering of light by the particles. These systems attempt to confine this problem by sampling and dilution, or by adjusting various other system parameters. Also hampering the effectiveness of these techniques is the need to calibrate the equipment in situ. Process upsets, feedstock changes, or even normal batch process changes may invalidate the calibration. Depending upon the application, the sensor output for feedback control could be catastrophic absent proper calibration.
- this technique may be used to determine particle size distribution and volume fraction regardless of particle concentration level.
- particle size distribution or volume fraction of a number of particles in suspension is determined from the measurement of one or more propagation characteristics of multiply scattered light re-emitted from the suspension
- particles include crystals, solids, liquid droplets, microbes, or microbe organelles
- multiple scattering refers to the condition where, at a given wavelength, a photon is more likely to be consecutively scattered many times between particles due to a refractive index mismatch between the dispersed particles and the host medium before being absorbed or detected Generally, the multiple scattering condition entails that the particles be close enough to one another so that the distance a photon travels between scattering events is much smaller than the length traveled before absorption Thus, multiple scattering of light occurs when ⁇ s '» ⁇ a , where the absorption
- ⁇ a indicates the ability of a substance to absorb light of a
- ⁇ s ' is at least 10 times greater than ⁇ a More preferably, ⁇ s ' is at least 100 times greater than ⁇ a
- multiply scattered light refers to light that has traveled at least 5 times the mean isotropic scattering length for a particular wavelength, defined as
- time of flight When light is multiply scattered by particles in a fluid, it typically travels a greater distance and therefore has a longer travel time as compared to a direct path through the fluid without encountering the particles
- the "time of flight" of photons through a scattering media is on the order of about 1 nanosecond Because many different scattering paths are likely, time of flight is usually characterized as a distribution, however, this distribution typically varies with the light wavelength, the refractive character of the particles relative to the media, the size of the particles, and the volume fraction of the particles.
- measurements corresponding to photon migration time or travel time through the scattering media may be obtained and utilized to characterize the particles
- a particle interaction parameter which varies with particle concentration, may be utilized in one form of the present invention, a particle structure factor is utilized, such as the Percus-Yevick model, which further provides an assessment of the stability of a corresponding particle suspension
- particles suspended in a medium are exposed to a number of light wavelengths each being intensity-modulated at a predetermined frequency
- Multiply scattered light from the medium in response to this exposure is detected to characterize propagation of the multiply scattered light through the medium with a number of values
- the values each correspond to a different one of the wavelengths and are each representative of at least one of a phase or an amplitude of the multiply scattered light relative to the predetermined frequency
- An output is provided that is determined from the values
- the output corresponds to at least one of particle size distribution, volume fraction, or a particle interaction parameter
- This particle interaction parameter corresponds to a nonlinear relationship between particle concentration and an isotropic scattering coefficient for the particles
- a number of particles suspended in a medium are exposed to a number of light wavelengths of predetermined time-varying intensity
- Multiply scattered light form the particles in response to this exposure is detected to determine a number of values each corresponding to a different one of the wavelengths
- These values are each representative of a time of flight characteristic of the particles
- the output corresponds to at least one of particle size distribution, volume fraction, or a particle interaction parameter
- This particle interaction parameter corresponds to a nonlinear relationship between particle concentration and an isotropic scattering coefficient for the particles
- particles are exposed to an incident light with a predetermined time-varying intensity
- the particles are sufficiently close to each other to multiply scatter light
- Multiply scattered light is detected from the particles in response to the incident light to determine a first value corresponding to an observed isotropic scattering coefficient of the particles
- An estimate corresponding to at least one of volume fraction or size distribution of the particles is established, and a second value is calculated as a function of the estimate
- the second value corresponds to a calculated isotropic scattering coefficient
- the first and second values are compared to establish an error, and the estimate is changed
- the calculation of the second value, comparison of the first and second values, and changing of the estimate is repeated until the error reaches a desired minimum
- a method of analysis includes exposing a fluid with a number of suspended particles to an incident light The particles are sufficiently concentrated in the fluid to scatter light Multiply scattered light in response to this exposure is detected to determine a time-based value characteristic of propagation time of the multiply scattered light through the fluid A quantity is determined as a function of the value which corresponds to an isotropic scattering coefficient of the fluid An output is provided that corresponds to at least one of particle volume fraction, particle size distribution, or a particle interaction parameter corresponding to particle-to-particle interactions that influence light scattering behavior of the particles The output is determined from the quantity
- a further form of the present invention is a system for analyzing a number of particles suspended in a medium in sufficient concentration to multiply scatter light
- This system includes a light source configured to expose the medium to a number of different predetermined wavelengths of incident light each having a predetermined time-varying intensity and a sensor spaced apart from the source The sensor is configured to provide a detection signal corresponding to detected light This detected light originates from the source and is multiply scattered by the particles
- the system also includes a processor responsive to the first detection signal
- the processor receives an exposure signal corresponding to the incident light and generates propagation signals by comparing the detection signal and the exposure signal for each of the wavelengths These propagation signals characterize time of flight of the detected light through the medium resulting from multiple scattering by the particles
- the processor is also configured to generate scattering signals corresponding to an isotropic scattering coefficient of the medium The scattering signals are correspondingly determined from the propagation signals
- the processor further generates an output signal indicative of one of size distribution or volume fraction of the particles which is determined from the scattering signals
- Yet another form of the present invention is a system for analyzing a number of particles suspended in a medium in sufficient concentration to multiply scatter light
- This system includes a light source, a sensor spaced apart from the light source, a processor, and an output device The sensor provides a detected light signal corresponding to multiply scattered light from the particles at different wavelengths in response to exposure to the source.
- the processor is responsive to the emission signal and includes a calculation means for generating an output signal corresponding to at least one of a size distribution, volume fraction, or a structure factor of the particles in accordance with an observed isotropic scattering coefficient of the medium
- the processor determines a value representative of the observed isotropic scattering coefficient from the detected light signal
- the output device responds to the output signal to provide an output corresponding to at least one of the size distribution, the volume fraction, or the structure factor of the particles.
- one object of the present invention is to determine particle size distribution, particle volume fraction, or a particle interaction parameter from multiply scattered light
- Another object of the present invention is to provide a self-calibrating system for the on-line determination of particle size distribution and volume fraction by detecting the propagation characteristics of multiply scattered light from particles dispersed in a fluid medium
- Still another object of the present invention is to provide an estimation algorithm to inversely solve for size distribution, volume fraction, or structure factor of a number of particles using observed values representative of the isotropic scattering coefficient of the particles at different wavelengths. This estimation may be based on an expected form of the distribution. Also, the estimation may account for mass of the particles.
- An additional object of the present invention is to provide a technique for determining a particle interaction parameter which accounts for particle-to- particle interactions that vary with particle concentration and influence light scattering by the particles.
- FIG 1 is a schematic view of an analysis system of one embodiment of the present invention
- FIG 2 is a flow chart illustrating one process of the present invention performed by the system of FIG 1
- FIG 2a is a graph illustrating a time domain measurement of a photon time-of-flight distribution resulting from an incident light pulse in a scattering media
- FIG 2b is a graph illustrating the frequency domain measurement of light propagation in a scattering media in terms of phase shift, ⁇ , and amplitude, M
- FIG 3 is a schematic view of a chemical process control system of another embodiment of the present invention.
- FIG 4 is a graph depicting the relationship between phase shift and modulation frequency tor a dispersion of DOW PP722 particles
- FIG 5 is a graph depicting the isotropic scattering coefficient for a dispersion of DOW PP722 particles as a function of wavelength
- FIGS 6-8 are graphs depicting size distribution for DOW PP722, PP755, and PP788 particle dispersions without a mass balance constraint, respectively
- FIGS 9-1 1 are graphs depicting size distribution for DOW PP722, PP755, and PP788 particle dispersions with a mass balance constraint, respectively
- FIGS 12 is a graph depicting size distribution for an aqueous dispersion of T ⁇ 0 2 particles
- FIGS 12a-12b are graphs depicting size distributions for aqueous dispersions of T ⁇ 0 2 particles supplied as suspension samples S1 and S2, respectively, which compare measurement of size distribution in accordance with the present invention to measurements by Dynamic Light Scattering (DLS) and X-ray scattering techniques
- DLS Dynamic Light Scattering
- FIG 13 is a flow chart illustrating another process of the present invention capable of performance, for example, by the systems of FIGS 1 and 3
- FIG 14 is a comparative schematic illustration of selected aspects of particle-to-particle interaction structure factor models of the present invention
- FIG 15 is a graph comparing selected structure factor models in terms of isotropic scattering coefficient and light wavelength
- FIGS 16a-16c are graphs comparing the relationship of the isotropic scattering coefficient with the percent solids by volume from polydisperse polystyrene particles in suspension having a mean diameter of about 0 4 micron, 0 2 micron, and 0 15 micron, respectively
- FIGS 17a-17c are graphs depicting simulation results using a soft sphere particle-to-particle interaction structure factor model with simulated noise levels of 0%, 1 %, and 5%, respectively DESCRIPTION OF PREFERRED EMBODIMENTS For the purposes of promoting an understanding of the principles of the
- FIG 1 depicts an analysis system 20 of one embodiment of the present invention
- System 20 includes a light source 21 which includes Argon ion laser 22, Titanium Sapphire laser 24, and pulse conditioner 26 Laser 22 generates a monochromatic output beam 23 using electrical discharges in a
- laser 22 is provided by a Beam-Lok model 2060 laser available from Spectra Physics, CA which is configured to deliver a beam with a diameter of less than 2 millimeters (mm)
- Beam-Lok model 2060 laser is selected from a range of 0 and 10 watts (W)
- Beam 23 from laser 22 is configured to "pump” laser 24 using
- source 21 includes a Tsunami
- Ti Sapphire laser model 3950B, available from Spectra Physics, Mountain
- beam 25 a monochromatic, unidirectional optical pulse train of light pulses is produced which is designated beam 25
- beam 25 has generally equally spaced light pulses of 2 picoseconds (psec) Full Width Half Maximum (FWHM) at a repetition rate of about 80 Megahertz (MHz)
- the output power of beam 25 is preferably maintained at about 20% of the input power of beam 23
- Beam 25 is directed to pulse picker 26
- Picker 26 provides two functional capabilities (1 ) to select an output pulse frequency less than or equal to the pulse repetition rate of pulses from input beam 25 and (2) to selectively halve the wavelength ( ⁇ ) of the input beam
- the frequency selection capability is provided by directing beam 25 to an Acousto-Optic Modulator (AOM) crystal
- AOM crystal controllably diffracts pulses from the impinging beam 25 at an angle relative to the main beam in accordance with a electromagnetic Radio Frequency (RF) input
- RF Radio Frequency
- the rate of diffracted or ' picked" pulses may be selected to provide a number of different output repetition rates less than or equal to the input frequency
- Picker 26 also includes a Second Harmonic Generation (SHG) crystal to selectively produce output wavelengths at one half the input wavelength ⁇
- SHG Second Harmonic Generation
- Picker 26 is configured so that beam 25 passes through the SHG crystal after the AOM crystal
- the SHG crystal emits a single photon for every two photons absorbed
- the energy level of the emitted photon is approximately double the energy of each of the two absorbed photons
- the wavelength corresponding to the emitted photon is about one half and the frequency is about doubled compared to each of the two input photons
- the ⁇ and 0.5 ⁇ outputs are separated by a prism to provide two outputs
- the ⁇ output is selected for
- Beam 27 from source 21 is directed to a glass slide beam splitter 28 which splits beam 27 to direct about 80% along optical fiber 30 and the remaining 20% along fiber 32 to reference sensor 34.
- Light directed along fiber 30 enters sample tank 60 to encounter particles P suspended in fluid medium M. Particles P are sufficiently concentrated in medium M to multiply scatter light pulses entering by fiber 30. This multiple scattering is diagrammatically represented by scattering path SP. Multiply scattered light is collected by fiber 36, and is then directed to sample sensor 38.
- sensors 34, 38 are Photomultiplier Tubes (PMTs), (Hamamatsu R928, Hamamatsu, Japan) and fibers 30, 32, 36 are 1000 mm optical fibers (HCP- M1000T-08, Spectran, Avon, CT); however, in other embodiments other sensor types and couplings are envisioned as would occur to one skilled in the art.
- PMTs Photomultiplier Tubes
- HCP- M1000T-08 Spectran, Avon, CT
- Sensors 34, 38 are operatively coupled to heterodyne subsystem 40 and processor 50 via interface 52. It should be appreciated that the light pulse train incident on sensors 34 and 38 may be described in terms of a number of intensity modulated frequencies which are multiples of the pulse repetition rate via Fourier analysis. Heterodyne subsystem 40 and processor 50 provide frequency domain information about light collected from sensors 34, 38 in terms of one or more of the intensity modulation frequencies. Where the source 21 pulse repetition rate is ⁇ and q is a whole number
- multiplier, heterodyne subsystem 40 gain modulates sensors 34, 38 at a harmonic q ⁇ plus a cross-correlation frequency offset, ⁇ , using conventional
- an RF signal from frequency synthesizer 44 (Marconi Instruments Signal Generator, model 2022A) is phase-locked to the pulse frequency of source 21 via divider 42 and outputs the gain modulation frequency of q ⁇ + ⁇ for amplification by power amp 46 (model
- the output of power amp 46 modulates the signals from sensors 34, 38 resulting in a signal of frequency ⁇ from each
- harmonic frequency q ⁇ of the pulsed laser light delivered to sensors 34, 38 is obtained by comparing these outputs
- measurement of phase shift ( ⁇ ) and relative magnitude (M) may be obtained as a function of modulation frequency
- phase shift (0) and relative magnitude (M) may
- the source 21 pulse repetition rate is 80 MHz which is divided by 8 by divider 42 and input to synthesizer 44 to provide the phase-locked loop
- a 4 MHz pulse tram is selected with picker 26 and the corresponding cross-correlation offset frequency is 100 Hz
- Synthesizer 44 is preferably a Marconi Instruments signal generator, model 2022A, and amplifier 46 is a model 1403LA available from ENI, Rochester, NY
- interface 152 is a conventional data acquisition module suitable to digitize the output of sensors 34, 38 for subsequent analysis by processor 50
- Processor 50 may be an electronic circuit comprised of one or more components Similarly, processor 50 may be comprised of digital circuitry, analog circuitry, or both Also, processor 50 may be programmable, an integrated state machine, or a hybrid combination thereof Preferably, processor 50 is comprised of one or more devices of the a digitally programmable variety
- Processor 50 is coupled to at least one input device 54 and at least one output device 56
- input device 54 is a keyboard or input control of a conventional variety
- output device 56 is a Cathode Ray Tube (CRT) based video display, printer, or other image display system known to those skilled in the art
- CTR Cathode Ray Tube
- System 20 is well-suited to conveniently deliver and detect light pulses at a selected rate and wavelength in a laboratory setting
- the configuration of system 20 may vary to provide and sense light at selected wavelengths and with a desired time-varying intensity using techniques known to those skilled in the art
- FIG 2 is a flow chart depicting process 500 which is performed using system 20
- processor 50 is configured to execute a program that performs at least the more calculation intensive aspects of process 500
- selected variables employed in the description of process 500 are presented as follows in Table 1 GENERAL VARIABLES a,b,c,d parameters governing the size distribution and
- g mean cosine of angular scatter. r radius of particle, [microns].
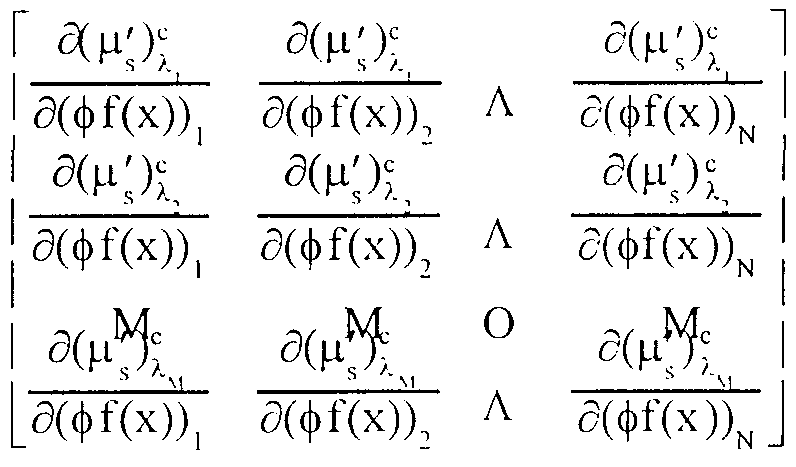
- Jacobian matrix describing changes in isotropic scattering with size distribution and volume fraction.
- process 500 begins by entering loop 510 at stage 512.
- particles P in medium M are exposed to pulses of light of wavelength ⁇ ( from source 21 via fiber 30; where "j" is the wavelength
- index form j 1 , M.
- the location of the source light is designated by position vector r s .
- stage 514 multiply scattered light resulting from the exposure in
- stage 512 is collected at detector location r corresponding to the position of
- Frequency domain quantities relating to ⁇ (rd) and M(rd) are collected for the given ⁇ ( and stored by processor 50.
- phase error inherent in the instrumentation of system 20 is reduced by collecting the multiply scattered light in two locations, rd1 and r 2, and
- Conditional 516 tests whether frequency domain information for all wavelengths of interest have been collected If not, the next wavelength ⁇ J+1 is selected by appropriate
- stage 520 the isotropic scattering coefficient for each of the wavelengths ⁇ , is determined This determination is based on the diffusion
- ⁇ (r, ⁇ ) is the fluence of photons at position r within a propagating
- m is the depth of sinusoidal modulation of the source located at position r s
- ⁇ a( ⁇ ) is the wavelength dependent absorption
- D( ⁇ ) is an "optical diffusion coefficient" which is given by:
- Measurement of phase-shift usually includes a contribution due to the electronics and photodetection systems.
- equations (6) and (7) may be fit
- processor 50 accumulates the frequency domain information in memory and is programmed to execute a Levenberg- Maraquardt non-linear least square regression algorithm to provide these optical coefficients The resulting observed isotropic scattering coefficients
- ( ⁇ s ⁇ is
- Stage 530 initiates an algorithm to inversely solve equation (3)
- stage 542 the isotropic scattering coefficients for each of the wavelengths of interest are calculated from equation (3) using the estimate of ⁇ t(x) For this calculation,
- equation (3) is approximated by the summation equation (8) as follows
- MI ⁇ j- QsC t( ⁇ j " Xl) (l - g ( ⁇ n, ⁇ l )) ⁇ f(x) ⁇ X
- Q scal ( ⁇ ,,n,x p ) and g( ⁇ ,,n,x,) are determined from look-up tables based on ⁇ ,, n,
- stage 544 This comparison is performed in accordance with
- ⁇ 2 ⁇ [( ⁇ : ) ; - ( ⁇ ; ) ;
- Conditional 546 tests whether this minimization has taken place. If the minimum has been reached, then control flows to stage 550 and the estimate is provided as the measured product ⁇ f(x) .
- f(x) and ⁇ may be separated by performing a summation
- the matrix 3 T 3 in equation (1 1 ) is sometimes ill-conditioned and may
- I is the identity matrix and ⁇ may be a scalar or a diagonal matrix.
- stages and conditionals corresponding to reference numbers 520 to 550 are performed through a software routine executed by processor 50, and processor 50 is of a type suitable to perform the extensive calculations of process 500 in an adequate amount of time
- the phase shift may be determined from detection at a single location rd using
- the diffusion equation may be utilized to compare incident light to resulting multiply scattered light in the time domain
- FIG 2a illustrates the relationship between an input light pulse LP of a selected wavelength to a corresponding "time of flight" response, shown as distribution TOF, where the vertical axis represents photon quantity in terms of intensity l(t), and the horizontal axis represents time t
- the TOF distribution may be employed to obtain the observed isotropic scattering coefficient by applying the time domain form of the diffusion equation
- time of flight values are in the range of picoseconds to a few nanoseconds
- phase shift ⁇ is represented by the left vertical axis
- amplitude modulation M is represented by the right vertical axis
- frequency is represented by the horizontal axis which increases from left to right
- the relationship of frequency to phase shift is characterized by the continuous curve that increases with increasing frequency (as designated by the left-pointing arrow) and the relationship of frequency to amplitude modulation is characterized by the continuous curve which decreases with increasing frequency (as designated by the right-pointing arrow)
- time-of-f light characteristics of a scattering medium alternatively may be described in terms of phase shift and amplitude modulation relative to the modulation frequency
- an intrinsic optical characteristic or optical property of the particles such as isotropic scattering and absorption coefficients, may be determined from a time-based propagation measurement of multiply scattered light relative to input light
- f(x) and ⁇ are simplified by assuming an expected form of the PSD.
- particulate processes can usually be characterized by Gaussian or log-normal distributions, both of which can be represented by proper parametric choices for a Weibull distribution described as follows:
- a, b and c describe the peak location, width, and shape, respectively, of the distribution.
- d corresponds to ⁇ , and the
- ⁇ is the vector updating the four parameters, a, b, c and d:
- the particle sizing task now becomes to recover the four parameters (a, b, c and d) to describe f(x) and ⁇ using the approach described in connection
- a low pass filter is employed to smooth the estimate based on the parameters for an expected form of distribution, such as the Weibull distribution.
- the size distribution is computed from the parameters and then subjected to a digital low pass filter by averaging over a window of N * ⁇ x.
- the estimation of f(x) and ⁇ focuses not only on the comparison of observed and calculated isotropic scattering coefficients, but also compares the known total particle mass to the mass obtained as a function of p and the estimates as follows
- V (V habitV 2 ,V 3 ,V 4 ) (26)
- V, w! M - p — ⁇ x ' ⁇ f(x)dx f p — ⁇ x' ⁇ — — dx L ' A 12 ⁇ ; JJ j K 12 ⁇ 9a (27)
- This mass balance constraint serves as an additional regularization scheme and typically provides further stabilization.
- FIG. 3 depicts system 120 of an alternative embodiment of the present invention is depicted.
- System 120 includes analyzer 150 coupled to reaction vessel 160 by fibers 130 and 134.
- Analyzer 150 is configured to determine PSD and volume fraction for particles dispersed in a fluid medium in vessel 160 in accordance with the present invention. Generally, the optimum number and size of the wavelengths selected for interrogation depends on the nature of the particles, medium, and process involved. Furthermore, it has been discovered that typically fewer wavelengths may be required to determine volume fraction as compared to PSD for a given arrangement.
- Analyzer 150 includes a light source configured to deliver light to vessel 160 via fiber 130.
- This light source may resemble source 21 of system 20, but preferably is a lamp-based or laser diode array system configured to provide light of a desired time-varying intensity at selected wavelengths.
- system 120 includes an array of laser diodes which each correspond to a desired wavelength suitable for the particular process and material being interrogated in vessel 160.
- the diodes are configured to provide incident (output) light with a sinusoidally modulated intensity.
- the light source arrangement is configured to provide wavelengths and time-varying intensity suitable for interrogation of the particular process being monitored using techniques known to those skilled in the art.
- Analyzer 150 also includes optical fiber 134 to detect re-emitted light from the particles in vessel 160 after multiple scattering.
- analyzer 150 be of rugged design suitable for industrial applications.
- Analyzer 150 includes a processor configured to execute software to determine values representative of PSD or volume fraction in accordance with the present invention.
- analyzer 150 is also operatively coupled to control elements 170 which are used to regulate processing in vessel 160.
- elements 170 may include valves, heaters, or agitation devices electronically regulated by analyzer 150.
- Analyzer 150 is further configured with appropriate programming and interfaces to provide one or more output signals to control elements 170 as a function of PSD or volume fraction.
- system 120 provides a closed loop feedback control system capability for regulating chemical processes from online measurement of PSD and/or volume fraction.
- Systems 20 and 120 of FIGS. 1 and 3, respectively, are described with corresponding light source fibers 30, 130 and detecting fibers 36, 136 geometrically arranged to approximate infinite boundary conditions - such that light travelling from fibers 30, 130 to fibers 36, 136 does not encounter a substantial boundary. Equations (6) or (7) are applied to determine the isotropic scattering coefficient ⁇ s ' and the absorption ⁇ a under such infinite boundary conditions.
- the present invention may be readily adapted to different boundary conditions.
- a processing chamber or passageway containing the scattering media may be interrogated by detecting multiply scattered light that is reflected or backscattered by the media through a "viewing window" arrangement instead of directly immersing fibers in the media. This arrangement results in a reflectance boundary condition.
- the present invention may be adapted using techniques known to those skilled in the art to accommodate this reflectance geometry or such other boundary conditions as may arise from a particular probe arrangement.
- the concentration of particles suspended in a medium is low (e.g. ⁇ 2%)
- the particles act independently with regard to light scattering; however, as the concentration increases, interactions between suspended particles become more significant. These particle-to-particle interactions may impact accuracy of the f(x) and ⁇ determination in accordance with the
- a particle interaction parameter which accounts for concentration-dependent particle interactions that influence light scattering properties is desirable.
- the determination of this particle interaction parameter may be incorporated into techniques of the present invention for determining f(x) and ⁇ .
- a structure factor S(q) for the particles has been found to be suitable as the particle interaction parameter.
- the structure factor S(q) accounts for nonrandom particle structure within the fluid that typically varies with concentration of the particles in the medium.
- the electrostatic charge on suspended particles generally influences spacing and organization of substantially concentrated particles in a fluid, which in turn influences light scattering.
- S(q) typically varies with the structure imparted by the particle interactions.
- FIG. 13 is a flow chart of process 600 which may be used to determine f(x), ⁇ , and S(g). Process 600 may be performed using system 20, system
- Stages 510-520 of process 600 are the same as the like numbered stages of process 500 described in connection with FIG. 2. After stage 520, stage 630 of process 600 is encountered. In stage 630, f(x) and ⁇ are estimated and S(q)
- loop 640 is entered.
- stage 642 is encountered in which isotropic scattering coefficients for each wavelength ( ⁇ s .) . are
- stage 642 control flows to stage 644 to determine ⁇ 2 as described in connection with stage 544 of process
- conditional 646 determines if the current estimates of f(x) and ⁇ are suitable for output. If conditional 646 is satisfied, control flows to
- stage 650 to output f(x), ⁇ , and S( ). If conditional 646 is not satisfied,
- stage 648 the estimation of f(x) and ⁇ is updated. This update also includes recalculation of g and q scat based on the current S(q) value.
- loop 640 closes back on stage 642 to provide updated calculations of the corresponding isotropic scattering coefficients. Loop 640 is iteratively executed until the ⁇ 2 difference is minimized to an
- structure factor S(q) may be output in stage 650. Aside from the improved accuracy of size distribution estimation and volume fraction at high particle concentrations, the structure factor S(q) is useful in ascertaining information about the behavior of colloidal suspensions and emulsions. For example, the structure factor alone is useful in monitoring colloidal suspensions and predicting shelf-life of emulsions with respect to phase separation. In other embodiments, different particle structure factor models may be employed other than the P-Y hard sphere model as would occur to those skilled in the art
- the hard sphere model is modified to account for electronic affects beyond the particle surface This phenomenon is particularly substantial for lower concentrations of electrolytes, where particle interactions are still significant
- FIG 14 comparatively represents this modification as a soft sphere SS next to hard sphere HS Soft sphere SS has a "soft" outer shell region corresponding to the interactive reach of the particle beyond its surface This "soft" region is designated by the radial extension increment ⁇ r and accounts for the electronic forces extending beyond the surface of the particles
- the effective electrostatic charge EC2 is shown as a broken line at r + ⁇ r
- the sum r + ⁇ r is treated as the "equivalent" hard sphere radius for the P-Y model which is otherwise applied in the same way as described above
- any of the embodiments previously described and any such variations as would occur to those skilled in the art may be adapted to incorporate the structure factor technique
- the mass balance constraint described in connection with equations (22)-(30) or the Weibull distribution simplification described in connection with equations (15)-(20) may be included in a process to determine a structure factor or effective hard sphere radius that accounts for the degree of particle interactions.
- other particle interaction parameters may be selected and applied in accordance with the present invention to account for variation in light scattering properties with particle concentration due to particle-to-particle interactions.
- Such particle interaction parameters generally characterize nonlinearity between a scattering property of the particles, such as the isotropic scattering coefficient, and the particle concentration level.
- the output beam was sent to a pulse picker (model 3980, Spectra Physics) having an AOM crystal to produce a pulse repetition rate of 4 MHz at 2 ps FWHM and a SHG crystal to provide for light wave frequency doubling (wavelength halving).
- a pulse picker model 3980, Spectra Physics
- AOM crystal to produce a pulse repetition rate of 4 MHz at 2 ps FWHM
- SHG crystal to provide for light wave frequency doubling (wavelength halving).
- wavelengths from 720 to 900 nm, and from 360 to 450 nm were available for selection.
- the average power exiting the AOM crystal and the frequency-doubler (SHG crystal) was 50 mW and 10 mW, respectively.
- the pulsed laser beam from the AOM or frequency doubter was sent to a glass slide beam splitter 28 that directed approximately 20% of the light to a reference sensor, photomultiplier tube (PMT) (Hamamatsu R928, Hamamatsu, Japan), via a 1000 ⁇ m optical fiber (HCP-M1000T-08, Spectran, Avon, CT).
- PMT photomultiplier tube
- HCP-M1000T-08 1000 ⁇ m optical fiber
- the remaining light was directed to the scattering sample by another optical fiber which was held stationary and vertical in a clear acrylic cylindrical tank having a 9 inch outer diameter and 8 inch height The tank was filled with a sample having particles suspended in a fluid medium
- the light which propagated from the source fiber within the multiple scattering medium was collected by another fiber held vertically in place in the tank
- the detected light was then delivered to a sample sensor, also a PMT, via an optic fiber
- Fourier analysis of the 4 MHz pulse train delivered to the sample and reference PMT's yielded a series of harmonic intensity- modulation frequencies at multiples of 4 MHz, which upon application of heterodyne detection techniques permitted isolation of the individual intensity- modulated frequencies
- Heterodyning was performed by gain modulating the reference and sample PMTs at a harmonic of the laser repetition rate plus an offset cross-correlation frequency of 100 Hz
- Gain modulation was accomplished using a commercial electronics package (ISS, Champaign, IL) and a -3 dBm RF signal from a frequency synthesizer (Marconi Instruments Signal Generator 2022A) amplified by a power amp (model 1403LA, ENI, Rochester, NY)
- Three polydisperse samples of polystyrene microsphere suspensions were characterized using frequency domain measurements of multiply scattered light with this instrumentation.
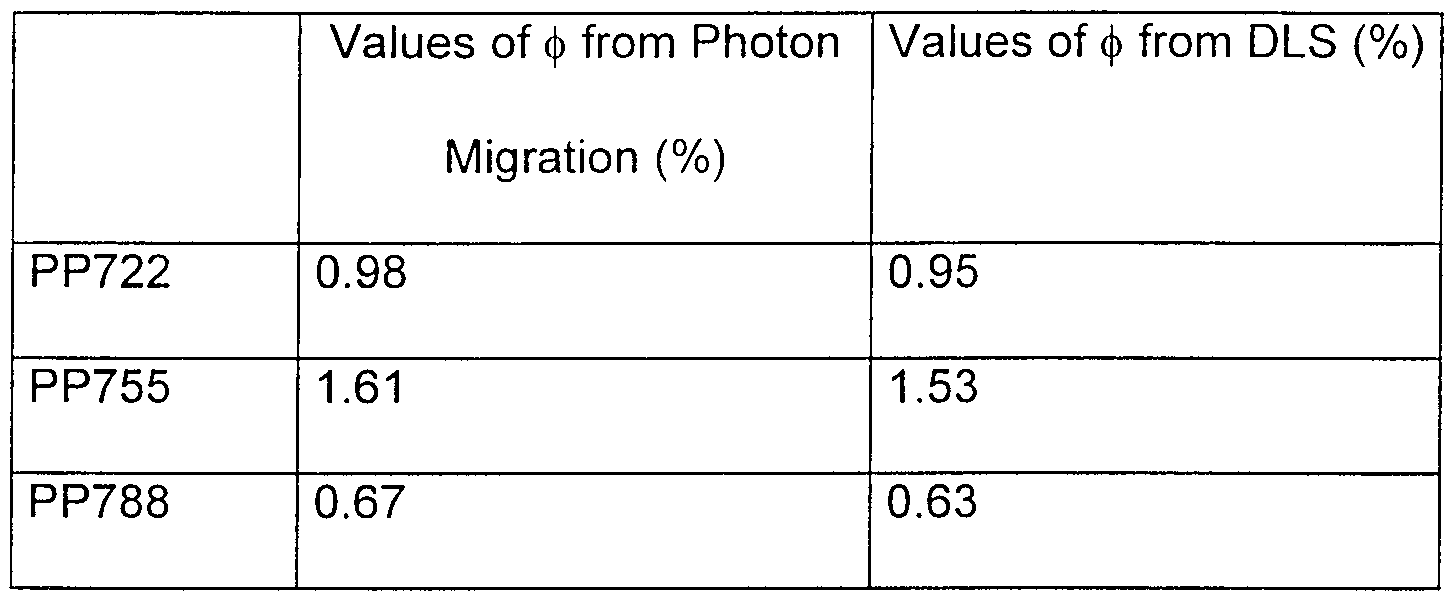
- the three polystyrene samples were obtained from DOW Chemical Company of Midland, Michigan and designated PP722, PP755, and PP788 with mean particle diameters of 0.5763, 0.2954, and 0.1685 microns, respectively, as determined by independent DLS measurements (Microtrac Ultrafine Particle Analyzer, Honeywell, Leeds and Northrup, St. Russia, FL).
- the concentration of solids for PP722, PP755, and PP788 were 47.95%, 52.74%, and 46.03% solids by volume respectively as determined through evaporation measurements.
- the samples were diluted about 50 times with deionized ultrafiltered water to obtain samples of approximately 1 % solids by volume. This concentration results in an opaque solution suitable to multiply scatter light.
- Figure 4 illustrates the typical measurements of relative phase-shift
- FIGS 6 through 8 show reconstructed particle size distributions from experimental measurements for the three different suspensions without the mass balance constraint
- the solid lines (PM) denote the reconstructed values from the photon migration measurements of multiply scattered light while the dashed lines represent the size distribution obtained from DLS for comparison
- Table 2 presents the volume fraction determination for the three different suspensions, as follows
- FIGS 9 through 1 1 display the reconstructed particle size distributions from experimental measurements for three different suspensions with the additional constraint of mass balance.
- the weighting parameter used for obtaining these results was a constant of 0.1. It has been discovered that a weighting parameter in the range between 0.01 and 0.2 works well for these samples.
- Table 3 presents the results from the volume fraction calculations for the three different suspensions as follows:
- FIG. 12 illustrates a Photon Migration (PM) measurement of multiply scattered light to experimentally determine PSD (solid line) for an aqueous Ti0 2 suspension following a procedure similar to the polystyrene suspensions described above.
- PM Photon Migration
- FIGS. 12a-12b comparatively illustrate size distribution determinations using Frequency Domain Photon Migration (FDPM) analysis (solid line) of the present invention, Dynamic Light Scattering (DLS) (short dashed line), and X- ray scattering (long dashed line) for each of two samples of titanium dioxide suspensions, designated S1 and S2, respectively.
- FDPM Frequency Domain Photon Migration
- DLS Dynamic Light Scattering
- X- ray scattering long dashed line
- Both the source and the detector optical fibers were placed parallel to the axis of the cylinder with their tips close to the center of the vessel.
- Phase shift and amplitude modulation was measured over a modulation frequency range of about 16 megahertz (MHz) to 240 MHz.
- Relative phase shifts were calculated corresponding to relative source-detector separations ranging form 0.1 cm to 0.5 cm. Samples were gently stirred between measurements to prevent any sedimentation.
- the solution of the diffusion equation (1) for the transport of photons in multiply scattering solution with infinite media boundary condition was applied to the data of relative phase shifts at different modulation frequencies.
- isotropic scattering coefficients ( ⁇ s ') were obtained at seventeen different wavelengths ranging from 400 nanometers (nm) to 900 nm.
- Particle size distribution, f(x), and volume fraction, ⁇ were determined from these values in accordance with the present invention for samples S1 and S2 corresponding to FIGS, 12a and 12b, respectively.
- a log-normal Gaussian distribution was assumed for f(x) in both cases.
- the mean size and standard deviation for samples S1 and S2 are correspondingly presented in tables 4 and 5 as follows:
- FIGS. 16a-16c comparatively illustrate the structure factor in terms of isotropic scattering coefficient (vertical axis) versus percent solids of particles by volume (horizontal axis).
- the generally straight, solid line corresponds to the linear relationship of isotropic scattering coefficients to particle concentration when particle interactions are ignored
- FIG. 16a shows the change in isotropic scattering coefficient
- FIG. 16b shows the isotropic scattering coefficient at about 670 nanometers for a polydisperse polystyrene suspension having a mean particle diameter of about 0.15 micron.
- FIG. 16c illustrates the isotropic scattering coefficient at about a 670 nanometer wavelength for a polydisperse polystyrene suspension having a mean particle
- FIGS. 17a-17c illustrate the results of
- the particle size axis (the horizontal
- particle analysis techniques of the present invention include monitoring processes involving genetically engineered microbes For example, the production of insulin in the granules of genetically engineered E coll bacteria may be monitored to provide rapid feedback for optimization of the insulin production process.
- the present invention finds application in many process involving the distribution of fine particles, including, but not limited to processes involving a dispersion of liquid or solid particles in a fluid medium, chemical reactions having particles of mixed phases (such as solids and liquid droplets dispersed together in
Abstract
Description


Claims
Priority Applications (3)
| Application Number | Priority Date | Filing Date | Title |
|---|---|---|---|
| US09/297,895 US7187441B1 (en) | 1996-11-08 | 1997-11-07 | Particle analysis system and method |
| EP97947450A EP0983501A4 (en) | 1996-11-08 | 1997-11-07 | Particle analysis system and method |
| AU52530/98A AU5253098A (en) | 1996-11-08 | 1997-11-07 | Particle analysis system and method |
Applications Claiming Priority (4)
| Application Number | Priority Date | Filing Date | Title |
|---|---|---|---|
| US08/747,112 | 1996-11-08 | ||
| US08/747,112 US5818583A (en) | 1996-11-08 | 1996-11-08 | Particle analysis system and method |
| US5080997P | 1997-06-26 | 1997-06-26 | |
| US60/050,809 | 1997-06-26 |
Publications (1)
| Publication Number | Publication Date |
|---|---|
| WO1998020323A1 true WO1998020323A1 (en) | 1998-05-14 |
Family
ID=26728710
Family Applications (1)
| Application Number | Title | Priority Date | Filing Date |
|---|---|---|---|
| PCT/US1997/020539 WO1998020323A1 (en) | 1996-11-08 | 1997-11-07 | Particle analysis system and method |
Country Status (4)
| Country | Link |
|---|---|
| US (1) | US7187441B1 (en) |
| EP (1) | EP0983501A4 (en) |
| AU (1) | AU5253098A (en) |
| WO (1) | WO1998020323A1 (en) |
Cited By (4)
| Publication number | Priority date | Publication date | Assignee | Title |
|---|---|---|---|---|
| GB2517269A (en) * | 2013-06-17 | 2015-02-18 | Horiba Ltd | Particle size distribution measuring device |
| RU2688587C1 (en) * | 2018-07-09 | 2019-05-21 | Акционерное общество "Обнинское научно-производственное предприятие "Технология" им. А.Г. Ромашина" | Method of determining distribution by size and concentration of inclusions in partially transparent strongly scattering materials |
| CN110580402A (en) * | 2019-10-08 | 2019-12-17 | 中国人民解放军国防科技大学 | Construction method of composite solid propellant filler stacking structure characteristic unit |
| CN112816387A (en) * | 2020-12-31 | 2021-05-18 | 北京市水利规划设计研究院 | Method and device for determining permeability coefficient and storage medium |
Families Citing this family (29)
| Publication number | Priority date | Publication date | Assignee | Title |
|---|---|---|---|---|
| US8103325B2 (en) * | 1999-03-08 | 2012-01-24 | Tyco Healthcare Group Lp | Method and circuit for storing and providing historical physiological data |
| US6591123B2 (en) * | 2000-08-31 | 2003-07-08 | Mallinckrodt Inc. | Oximeter sensor with digital memory recording sensor data |
| US6606510B2 (en) | 2000-08-31 | 2003-08-12 | Mallinckrodt Inc. | Oximeter sensor with digital memory encoding patient data |
| US7352469B2 (en) * | 2001-11-06 | 2008-04-01 | Mcgrew Stephen P | Quantum resonance analytical instrument |
| US7599732B2 (en) * | 2003-06-20 | 2009-10-06 | The Texas A&M University System | Method and system for near-infrared fluorescence contrast-enhanced imaging with area illumination and area detection |
| US7320823B2 (en) * | 2006-02-14 | 2008-01-22 | Kimoto Co., Ltd. | Light diffusing body and a transmission type screen |
| JP4236673B2 (en) * | 2006-04-12 | 2009-03-11 | 株式会社日立製作所 | Near-field light generator and near-field light recording / reproducing device |
| US9063117B2 (en) | 2007-02-21 | 2015-06-23 | Paul L. Gourley | Micro-optical cavity with fluidic transport chip for bioparticle analysis |
| US8209128B1 (en) | 2007-02-21 | 2012-06-26 | Paul L. Gourley | Nanolaser spectroscopy and micro-optical resonators for detecting, analyzing, and manipulating bioparticles |
| JP4395627B2 (en) * | 2007-03-19 | 2010-01-13 | ホーコス株式会社 | Mist measuring device |
| US8603772B2 (en) * | 2007-07-28 | 2013-12-10 | Bug Lab LLC | Particle sensor with wide linear range |
| US7859664B2 (en) * | 2007-09-13 | 2010-12-28 | Brightwell Technologies Inc. | Plurality of samples and method for selecting a target sample therefrom |
| US8102528B2 (en) * | 2007-09-13 | 2012-01-24 | Brightwell Technologies Inc. | Particle standard and method of calibrating or validating an optical particle analyzer |
| RU2351912C1 (en) * | 2007-11-20 | 2009-04-10 | Физический институт имени П.Н. Лебедева Российской академии наук | Method of measuring sizes of particles in fluid and device for its realisation |
| US8401608B2 (en) * | 2009-09-30 | 2013-03-19 | Covidien Lp | Method of analyzing photon density waves in a medical monitor |
| US8464592B2 (en) * | 2009-10-02 | 2013-06-18 | Hitec Luxembourg S.A. | Method and apparatus for determining void volume for a particulate material |
| US8391943B2 (en) | 2010-03-31 | 2013-03-05 | Covidien Lp | Multi-wavelength photon density wave system using an optical switch |
| US8521247B2 (en) | 2010-12-29 | 2013-08-27 | Covidien Lp | Certification apparatus and method for a medical device computer |
| US8870783B2 (en) | 2011-11-30 | 2014-10-28 | Covidien Lp | Pulse rate determination using Gaussian kernel smoothing of multiple inter-fiducial pulse periods |
| US8654329B2 (en) * | 2012-06-19 | 2014-02-18 | The United States Of America, As Represented By The Secretary Of The Navy | Parallel multisensor optical particle sensors for flowing fluid systems |
| CN103712927B (en) * | 2012-09-29 | 2016-12-21 | 埃科莱布美国股份有限公司 | Detecting system and method and water treatment system and method |
| WO2015026398A1 (en) * | 2013-08-19 | 2015-02-26 | Garcia Antonio Ph D | Spectrophotometer based on optical caustics |
| GB201404209D0 (en) * | 2014-03-10 | 2014-04-23 | E2V Tech Uk Ltd | Method and apparatus for remotely disabling vehicles |
| US9752974B2 (en) * | 2014-04-21 | 2017-09-05 | Buglab Llc | Particle sensor with interferent discrimination |
| DE102014016993B3 (en) * | 2014-11-18 | 2016-03-10 | Fraunhofer-Gesellschaft zur Förderung der angewandten Forschung e.V. | Apparatus and method for performing fiber optic measurements in liquids |
| JP6685555B2 (en) * | 2015-02-12 | 2020-04-22 | 国立大学法人京都工芸繊維大学 | Ultrasonic particle size measuring device and ultrasonic measuring device |
| RU2630447C1 (en) * | 2016-11-16 | 2017-09-07 | Федеральное государственное унитарное предприятие "ВСЕРОССИЙСКИЙ НАУЧНО-ИССЛЕДОВАТЕЛЬСКИЙ ИНСТИТУТ ОПТИКО-ФИЗИЧЕСКИХ ИЗМЕРЕНИЙ" (ФГУП "ВНИИОФИ") | Method for determining sizes of nanoparticles added to initial colloidal solution |
| CN108896587A (en) * | 2018-07-23 | 2018-11-27 | 浙江理工大学 | The experimental provision and experimental method of gas-solid two-phase shock tube flash X-ray imaging |
| CN113552031B (en) * | 2021-08-30 | 2024-02-13 | 山东理工大学 | Dynamic light scattering measurement method for suspended particles with ultralow concentration |
Family Cites Families (18)
| Publication number | Priority date | Publication date | Assignee | Title |
|---|---|---|---|---|
| US4245909A (en) | 1978-06-26 | 1981-01-20 | Loos Hendricus G | Optical instrument for measurement of particle size distributions |
| JPS57199943A (en) * | 1981-06-03 | 1982-12-08 | Hitachi Ltd | Measuring device for wetness of steam |
| SE443235B (en) | 1982-12-15 | 1986-02-17 | Eur Control Usa Inc | PROCEDURE FOR SEATING THE CONTENT OF SUSPENDED SUBSTANCE IN A FLOWING MEDIUM AND DEVICE FOR IMPLEMENTATION OF THE PROCEDURE |
| US4781460A (en) | 1986-01-08 | 1988-11-01 | Coulter Electronics Of New England, Inc. | System for measuring the size distribution of particles dispersed in a fluid |
| US4890920A (en) | 1986-02-12 | 1990-01-02 | Combustion Engineering, Inc. | In situ particle size measuring device |
| US4871251A (en) | 1987-04-27 | 1989-10-03 | Preikschat F K | Apparatus and method for particle analysis |
| DE68924749T2 (en) | 1988-09-15 | 1996-07-04 | Univ Arkansas | Identification of particles by modulated dynamic light scattering. |
| US5353799A (en) | 1991-01-22 | 1994-10-11 | Non Invasive Technology, Inc. | Examination of subjects using photon migration with high directionality techniques |
| US5229839A (en) | 1989-10-06 | 1993-07-20 | National Aerospace Laboratory Of Science & Technology Agency | Method and apparatus for measuring the size of a single fine particle and the size distribution of fine particles |
| JPH081482Y2 (en) | 1990-11-17 | 1996-01-17 | 株式会社堀場製作所 | Particle size distribution measuring device |
| US5438408A (en) | 1991-06-07 | 1995-08-01 | Sympatec Gmbh System-Partikel-Technik | Measuring device and method for the determination of particle size distributions by scattered light measurements |
| DE4228388B4 (en) | 1992-08-26 | 2005-03-03 | Sympatec Gmbh System-Partikel-Technik | Device for determining particle sizes and / or particle size distributions |
| US5424843A (en) * | 1992-12-23 | 1995-06-13 | The Regents Of The University Of California | Apparatus and method for qualitative and quantitative measurements of optical properties of turbid media using frequency-domain photon migration |
| US5416580A (en) | 1993-07-07 | 1995-05-16 | General Signal Corporation | Methods and apparatus for determining small particle size distribution utilizing multiple light beams |
| CA2175348A1 (en) | 1993-10-29 | 1995-05-04 | Arjun G. Yodh | Object imaging using diffuse light |
| WO1997008538A1 (en) | 1995-08-24 | 1997-03-06 | Purdue Research Foundation | Fluorescence lifetime-based imaging and spectroscopy in tissues and other random media |
| US5619324A (en) * | 1995-12-29 | 1997-04-08 | Insitec Measurement Systems | Method for measuring particle size in the presence of multiple scattering |
| US5818583A (en) | 1996-11-08 | 1998-10-06 | Purdue Research Foundation | Particle analysis system and method |
-
1997
- 1997-11-07 EP EP97947450A patent/EP0983501A4/en not_active Withdrawn
- 1997-11-07 WO PCT/US1997/020539 patent/WO1998020323A1/en not_active Application Discontinuation
- 1997-11-07 US US09/297,895 patent/US7187441B1/en not_active Expired - Fee Related
- 1997-11-07 AU AU52530/98A patent/AU5253098A/en not_active Abandoned
Non-Patent Citations (1)
| Title |
|---|
| SCHOOL OF CHEMICAL ENGINEERING, PURDUE UNIVERSITY, (West Lafayette, IN, USA), PAITHANKAR D., "Particle Size Distribution Estimation Via Solution of the Inverse Problem of Multi-Wavelength Scattering Coefficient Measurements", August 1995. * |
Cited By (6)
| Publication number | Priority date | Publication date | Assignee | Title |
|---|---|---|---|---|
| GB2517269A (en) * | 2013-06-17 | 2015-02-18 | Horiba Ltd | Particle size distribution measuring device |
| US9329116B2 (en) | 2013-06-17 | 2016-05-03 | Horiba, Ltd. | Particle size distribution measuring device |
| GB2517269B (en) * | 2013-06-17 | 2018-06-06 | Horiba Ltd | Particle size distribution measuring device |
| RU2688587C1 (en) * | 2018-07-09 | 2019-05-21 | Акционерное общество "Обнинское научно-производственное предприятие "Технология" им. А.Г. Ромашина" | Method of determining distribution by size and concentration of inclusions in partially transparent strongly scattering materials |
| CN110580402A (en) * | 2019-10-08 | 2019-12-17 | 中国人民解放军国防科技大学 | Construction method of composite solid propellant filler stacking structure characteristic unit |
| CN112816387A (en) * | 2020-12-31 | 2021-05-18 | 北京市水利规划设计研究院 | Method and device for determining permeability coefficient and storage medium |
Also Published As
| Publication number | Publication date |
|---|---|
| EP0983501A1 (en) | 2000-03-08 |
| US7187441B1 (en) | 2007-03-06 |
| EP0983501A4 (en) | 2000-03-08 |
| AU5253098A (en) | 1998-05-29 |
Similar Documents
| Publication | Publication Date | Title |
|---|---|---|
| US7187441B1 (en) | Particle analysis system and method | |
| US5818583A (en) | Particle analysis system and method | |
| Naiim et al. | Multiangle dynamic light scattering for the improvement of multimodal particle size distribution measurements | |
| US7268873B2 (en) | Method for characterising particles in suspension from frequency domain photon migration measurements | |
| Austin et al. | Nanoparticle number concentration measurements by multi-angle dynamic light scattering | |
| Cotterell et al. | Optical extinction efficiency measurements on fine and accumulation mode aerosol using single particle cavity ring-down spectroscopy | |
| Mason et al. | Direct measurements of the optical cross sections and refractive indices of individual volatile and hygroscopic aerosol particles | |
| US20060017925A1 (en) | Method for characterizing particles in suspension from frequency domain photon migration measurements | |
| Yin | Dynamic light scattering | |
| JP7001712B2 (en) | Fine bubble removing method and fine bubble removing device, as well as bubble diameter distribution measuring method and bubble diameter distribution measuring device | |
| Richter et al. | Particle sizing using frequency domain photon migration | |
| Sevick‐Muraca et al. | Photon‐migration measurement of latex size distribution in concentrated suspensions | |
| Postelmans et al. | Estimation of particle size distribution from bulk scattering spectra: validation on monomodal suspensions | |
| Mariani et al. | Single particle extinction and scattering allows novel optical characterization of aerosols | |
| Sentis et al. | Size distribution of migrating particles and droplets under gravity in concentrated dispersions measured with static multiple light scattering | |
| Chicea et al. | Investigation on the Possibility of Designing an Educational Dynamic Light Scattering Device for Sizing Particles Suspended in Air | |
| Li et al. | Particle size distribution determination from spectral extinction using evolutionary programming | |
| Bressel et al. | 4.10 Photon Density Wave (PDW) Spectroscopy for Nano‐and Microparticle Sizing | |
| Richter et al. | Characterization of concentrated colloidal suspensions using time-dependent photon migration measurements | |
| Gheghiani et al. | Online Monitoring of the Particle Size in Semibatch Emulsion Copolymerization Using Spatially Resolved Spectroscopy and Raman Spectroscopy | |
| Valenzuela et al. | Electrodynamic single-particle trap integrated into double-cavity ring-down spectroscopy for light extinction | |
| Tontrup et al. | Light backscattering by fine non-absorbing suspended particles | |
| Gupta et al. | Determination of the Size of Microspheres in Monodisperse Turbid Solutions | |
| Janzen et al. | Light Scattering for In-Line Process Monitoring | |
| Romanov et al. | Low-order light scattering in multiple scattering disperse media |
Legal Events
| Date | Code | Title | Description |
|---|---|---|---|
| AK | Designated states |
Kind code of ref document: A1 Designated state(s): AL AM AT AU AZ BA BB BG BR BY CA CH CN CU CZ DE DK EE ES FI GB GE GH HU ID IL IS JP KE KG KP KR KZ LC LK LR LS LT LU LV MD MG MK MN MW MX NO NZ PL PT RO RU SD SE SG SI SK SL TJ TM TR TT UA UG US US UZ VN YU ZW AM AZ BY KG KZ MD RU TJ TM |
|
| AL | Designated countries for regional patents |
Kind code of ref document: A1 Designated state(s): GH KE LS MW SD SZ UG ZW AT BE CH DE DK ES FI FR GB GR IE IT LU |
|
| DFPE | Request for preliminary examination filed prior to expiration of 19th month from priority date (pct application filed before 20040101) | ||
| CFP | Corrected version of a pamphlet front page |
Free format text: ADD INID NUMBER (63) "RELATED BY CONTINUATION (CON) OR CONTINUATION-IN-PART (CIP) TO EARLIER APPLICATION" WHICH WAS INADVERTENTLY OMITTED FROM THE FRONT PAGE |
|
| 121 | Ep: the epo has been informed by wipo that ep was designated in this application | ||
| WWE | Wipo information: entry into national phase |
Ref document number: 1997947450 Country of ref document: EP |
|
| WWE | Wipo information: entry into national phase |
Ref document number: 09297895 Country of ref document: US |
|
| REG | Reference to national code |
Ref country code: DE Ref legal event code: 8642 |
|
| WWP | Wipo information: published in national office |
Ref document number: 1997947450 Country of ref document: EP |
|
| NENP | Non-entry into the national phase |
Ref country code: CA |
|
| WWW | Wipo information: withdrawn in national office |
Ref document number: 1997947450 Country of ref document: EP |