US9892895B2 - Method for analyzing small molecule components of a complex mixture in a multi-sample process, and associated apparatus and computer program product - Google Patents
Method for analyzing small molecule components of a complex mixture in a multi-sample process, and associated apparatus and computer program product Download PDFInfo
- Publication number
- US9892895B2 US9892895B2 US15/315,147 US201515315147A US9892895B2 US 9892895 B2 US9892895 B2 US 9892895B2 US 201515315147 A US201515315147 A US 201515315147A US 9892895 B2 US9892895 B2 US 9892895B2
- Authority
- US
- United States
- Prior art keywords
- peak
- intensity
- plot
- sample
- identifying
- Prior art date
- Legal status (The legal status is an assumption and is not a legal conclusion. Google has not performed a legal analysis and makes no representation as to the accuracy of the status listed.)
- Active
Links
- 238000000034 method Methods 0.000 title claims abstract description 117
- 238000004590 computer program Methods 0.000 title description 34
- 150000003384 small molecules Chemical class 0.000 title description 13
- 239000000203 mixture Substances 0.000 title description 10
- 230000008569 process Effects 0.000 title description 10
- 230000014759 maintenance of location Effects 0.000 claims abstract description 142
- 238000003860 storage Methods 0.000 claims abstract description 34
- 238000000926 separation method Methods 0.000 claims abstract description 21
- 230000004044 response Effects 0.000 claims description 52
- 238000012545 processing Methods 0.000 claims description 27
- 230000006870 function Effects 0.000 claims description 24
- 230000014509 gene expression Effects 0.000 claims description 24
- 230000010354 integration Effects 0.000 claims description 19
- 230000000977 initiatory effect Effects 0.000 claims description 8
- 150000002500 ions Chemical class 0.000 description 69
- 230000000875 corresponding effect Effects 0.000 description 62
- 239000002207 metabolite Substances 0.000 description 37
- 238000004458 analytical method Methods 0.000 description 27
- 238000002705 metabolomic analysis Methods 0.000 description 23
- 230000001431 metabolomic effect Effects 0.000 description 23
- 150000001875 compounds Chemical class 0.000 description 18
- 238000004611 spectroscopical analysis Methods 0.000 description 16
- 201000010099 disease Diseases 0.000 description 12
- 208000037265 diseases, disorders, signs and symptoms Diseases 0.000 description 12
- 238000004891 communication Methods 0.000 description 11
- 238000010586 diagram Methods 0.000 description 9
- 239000000126 substance Substances 0.000 description 8
- 239000003814 drug Substances 0.000 description 6
- 108090000623 proteins and genes Proteins 0.000 description 6
- 230000008901 benefit Effects 0.000 description 5
- 229940079593 drug Drugs 0.000 description 5
- 239000002609 medium Substances 0.000 description 5
- 239000002676 xenobiotic agent Substances 0.000 description 5
- 238000013421 nuclear magnetic resonance imaging Methods 0.000 description 4
- 102000004169 proteins and genes Human genes 0.000 description 4
- 230000007704 transition Effects 0.000 description 4
- 238000004364 calculation method Methods 0.000 description 3
- 210000004027 cell Anatomy 0.000 description 3
- 238000007405 data analysis Methods 0.000 description 3
- 230000000694 effects Effects 0.000 description 3
- 230000004060 metabolic process Effects 0.000 description 3
- 230000037361 pathway Effects 0.000 description 3
- 238000011002 quantification Methods 0.000 description 3
- 210000001519 tissue Anatomy 0.000 description 3
- 230000001413 cellular effect Effects 0.000 description 2
- 210000001175 cerebrospinal fluid Anatomy 0.000 description 2
- 230000008859 change Effects 0.000 description 2
- 230000003247 decreasing effect Effects 0.000 description 2
- 238000007876 drug discovery Methods 0.000 description 2
- 239000002359 drug metabolite Substances 0.000 description 2
- 239000007788 liquid Substances 0.000 description 2
- 238000004519 manufacturing process Methods 0.000 description 2
- 238000012986 modification Methods 0.000 description 2
- 230000004048 modification Effects 0.000 description 2
- 210000000056 organ Anatomy 0.000 description 2
- 238000012216 screening Methods 0.000 description 2
- 102000004190 Enzymes Human genes 0.000 description 1
- 108090000790 Enzymes Proteins 0.000 description 1
- CDBYLPFSWZWCQE-UHFFFAOYSA-L Sodium Carbonate Chemical compound [Na+].[Na+].[O-]C([O-])=O CDBYLPFSWZWCQE-UHFFFAOYSA-L 0.000 description 1
- 239000000654 additive Substances 0.000 description 1
- 235000013405 beer Nutrition 0.000 description 1
- 230000009286 beneficial effect Effects 0.000 description 1
- 230000003851 biochemical process Effects 0.000 description 1
- 239000008280 blood Substances 0.000 description 1
- 210000004369 blood Anatomy 0.000 description 1
- 238000004113 cell culture Methods 0.000 description 1
- 235000013351 cheese Nutrition 0.000 description 1
- 235000019219 chocolate Nutrition 0.000 description 1
- 238000007596 consolidation process Methods 0.000 description 1
- 238000012937 correction Methods 0.000 description 1
- 230000002596 correlated effect Effects 0.000 description 1
- 238000001514 detection method Methods 0.000 description 1
- 238000003745 diagnosis Methods 0.000 description 1
- 238000010828 elution Methods 0.000 description 1
- 238000005516 engineering process Methods 0.000 description 1
- 238000011156 evaluation Methods 0.000 description 1
- 230000002349 favourable effect Effects 0.000 description 1
- 239000000796 flavoring agent Substances 0.000 description 1
- 235000019634 flavors Nutrition 0.000 description 1
- 239000012530 fluid Substances 0.000 description 1
- 235000013305 food Nutrition 0.000 description 1
- 239000003205 fragrance Substances 0.000 description 1
- 235000011389 fruit/vegetable juice Nutrition 0.000 description 1
- 230000023266 generation of precursor metabolites and energy Effects 0.000 description 1
- 239000001963 growth medium Substances 0.000 description 1
- 210000005260 human cell Anatomy 0.000 description 1
- 238000012423 maintenance Methods 0.000 description 1
- 238000013507 mapping Methods 0.000 description 1
- 238000001819 mass spectrum Methods 0.000 description 1
- 239000012528 membrane Substances 0.000 description 1
- 238000006241 metabolic reaction Methods 0.000 description 1
- 238000007884 metabolite profiling Methods 0.000 description 1
- 239000008267 milk Substances 0.000 description 1
- 210000004080 milk Anatomy 0.000 description 1
- 235000013336 milk Nutrition 0.000 description 1
- 238000001823 molecular biology technique Methods 0.000 description 1
- 238000012544 monitoring process Methods 0.000 description 1
- 230000006855 networking Effects 0.000 description 1
- 238000005457 optimization Methods 0.000 description 1
- 210000003463 organelle Anatomy 0.000 description 1
- 230000035479 physiological effects, processes and functions Effects 0.000 description 1
- 239000000419 plant extract Substances 0.000 description 1
- 229920000642 polymer Polymers 0.000 description 1
- 230000019525 primary metabolic process Effects 0.000 description 1
- 238000000275 quality assurance Methods 0.000 description 1
- 238000003908 quality control method Methods 0.000 description 1
- 210000003296 saliva Anatomy 0.000 description 1
- 230000003595 spectral effect Effects 0.000 description 1
- 238000012421 spiking Methods 0.000 description 1
- 238000012360 testing method Methods 0.000 description 1
- 229940124597 therapeutic agent Drugs 0.000 description 1
- 238000002560 therapeutic procedure Methods 0.000 description 1
- 231100000167 toxic agent Toxicity 0.000 description 1
- 239000003440 toxic substance Substances 0.000 description 1
- 210000002700 urine Anatomy 0.000 description 1
- 238000012795 verification Methods 0.000 description 1
- 235000014101 wine Nutrition 0.000 description 1
- 230000002034 xenobiotic effect Effects 0.000 description 1
- 235000013618 yogurt Nutrition 0.000 description 1
Images


Classifications
-
- H—ELECTRICITY
- H01—ELECTRIC ELEMENTS
- H01J—ELECTRIC DISCHARGE TUBES OR DISCHARGE LAMPS
- H01J49/00—Particle spectrometers or separator tubes
- H01J49/0027—Methods for using particle spectrometers
- H01J49/0036—Step by step routines describing the handling of the data generated during a measurement
-
- G—PHYSICS
- G01—MEASURING; TESTING
- G01N—INVESTIGATING OR ANALYSING MATERIALS BY DETERMINING THEIR CHEMICAL OR PHYSICAL PROPERTIES
- G01N30/00—Investigating or analysing materials by separation into components using adsorption, absorption or similar phenomena or using ion-exchange, e.g. chromatography or field flow fractionation
- G01N30/02—Column chromatography
- G01N30/86—Signal analysis
- G01N30/8624—Detection of slopes or peaks; baseline correction
- G01N30/8631—Peaks
- G01N30/8634—Peak quality criteria
-
- G—PHYSICS
- G01—MEASURING; TESTING
- G01N—INVESTIGATING OR ANALYSING MATERIALS BY DETERMINING THEIR CHEMICAL OR PHYSICAL PROPERTIES
- G01N30/00—Investigating or analysing materials by separation into components using adsorption, absorption or similar phenomena or using ion-exchange, e.g. chromatography or field flow fractionation
- G01N30/02—Column chromatography
- G01N30/86—Signal analysis
- G01N30/8624—Detection of slopes or peaks; baseline correction
- G01N30/8644—Data segmentation, e.g. time windows
-
- G—PHYSICS
- G01—MEASURING; TESTING
- G01N—INVESTIGATING OR ANALYSING MATERIALS BY DETERMINING THEIR CHEMICAL OR PHYSICAL PROPERTIES
- G01N33/00—Investigating or analysing materials by specific methods not covered by groups G01N1/00 - G01N31/00
- G01N33/48—Biological material, e.g. blood, urine; Haemocytometers
- G01N33/50—Chemical analysis of biological material, e.g. blood, urine; Testing involving biospecific ligand binding methods; Immunological testing
- G01N33/68—Chemical analysis of biological material, e.g. blood, urine; Testing involving biospecific ligand binding methods; Immunological testing involving proteins, peptides or amino acids
- G01N33/6803—General methods of protein analysis not limited to specific proteins or families of proteins
- G01N33/6848—Methods of protein analysis involving mass spectrometry
-
- H—ELECTRICITY
- H01—ELECTRIC ELEMENTS
- H01J—ELECTRIC DISCHARGE TUBES OR DISCHARGE LAMPS
- H01J49/00—Particle spectrometers or separator tubes
- H01J49/02—Details
- H01J49/04—Arrangements for introducing or extracting samples to be analysed, e.g. vacuum locks; Arrangements for external adjustment of electron- or ion-optical components
Definitions
- the present disclosure relates to the field of analyzing small molecule components in a complex mixture and, more particularly, to a method and associated apparatus and computer program product for analyzing small molecule components of a complex mixture in a multi-sample process, with such small molecule analysis including metabolomics, which is the study of small molecules produced by an organism's metabolic processes, or other analysis of small molecules produced through metabolism.
- Metabolomics is the study of the small molecules, or metabolites, contained in a cell, tissue or organ (including fluids) and involved in primary and intermediary metabolism.
- the term “metabolome” refers to the collection of metabolites present in an organism.
- the human metabolome encompasses native small molecules (natively biosynthesizeable, non-polymeric compounds) that are participants in general metabolic reactions and that are required for the maintenance, growth and normal function of a cell.
- metabolomics is a direct observation of the status of cellular physiology, and may thus be predictive of disease in a given organism.
- Subtle biochemical changes are inherent in a given disease. Therefore, the accurate mapping of these changes to known pathways may allow researchers to build a biochemical hypothesis for a disease. Based on this hypothesis, the enzymes and proteins critical to the disease can be uncovered such that disease targets may be identified for treatment with targeted pharmaceutical compounds or other therapy.
- genomics (study of the DNA-level biochemistry), transcript profiling (study of the RNA-level biochemistry), and proteomics (study of the protein-level biochemistry) are useful for identification of disease pathways, these methods are complicated by the fact that there exist over 25,000 genes, 100,000 to 200,000 RNA transcripts and up to 1,000,000 proteins in human cells. However, it is estimated that there may be as few as 2,500 small molecules in the human metabolome.
- metabolomic technology provides a significant leap beyond genomics, transcript profiling, and/or proteomics.
- metabolomics metabolites and their role in metabolism may be readily identified.
- the identification of disease targets may be expedited with greater accuracy relative to other known methods.
- the collection of metabolomic data for use in identifying disease pathways is generally known in the art, as described generally, for example, in U.S. Pat. Nos. 7,005,255 and 7,329,489 to Metabolon, Inc., each entitled Methods for Drug Discovery, Disease Treatment, and Diagnosis Using Metabolomics.
- metabolomics data include, for example, determining response to a therapeutic agent (i.e., a drug) or other xenobiotics, monitoring drug response, determining drug safety, and drug discovery.
- a therapeutic agent i.e., a drug
- the collection and sorting of metabolomic data taken from a variety of samples consumes large amounts of time and computational power.
- spectrometry data for certain samples is collected and plotted in three (or more) dimensions (i.e., sample properties that can be represented along an axis with respect to other sample properties) and stored in an individual file corresponding to each sample.
- This data is then, by individual file, compared to data corresponding to a plurality of known metabolites in order to identify known metabolites that may be disease targets.
- the data may also be used for identification of toxic agents and/or drug metabolites.
- Furthermore such data may also be used to monitor the effects of xenobiotics and/or used to monitor/measure/identify the xenobiotics and associated metabolites produced by processing (metabolizing) the xenobiotics.
- file-based methods referring to the individual data file generated for each sample) require the use of large amounts of computing power and memory capacity to handle the screening of large numbers of known metabolites.
- file-based data handling may not lend itself to the compilation of sample population data across a number of samples because, according to known metabolomic data handling techniques, each sample is analyzed independently, without taking into account subtle changes in metabolite composition that may be more readily detectable across a sample population.
- existing “file-based” method may have other limitations including: limited security and auditability; and poor data set consistency across multiple file copies.
- individual files may not support multiple indices (i.e., day collected, sample ID, control vs. treated, drug dose, etc.) such that all files must be scanned when only a particular subset is desired.
- spectrometry data corresponding to a number of samples generally results in a large data file corresponding to each sample, wherein each data file must then be subjected to an individual screening process with respect to a library of known metabolites.
- conventional systems do not readily allow for the consolidation of spectrometry data from a number of samples for the subjective evaluation of the data generated by the spectrometry processes.
- a single file corresponding to an individual sample may be inconclusive, such data may be more telling if viewed subjectively in a succinct format with respect to other samples within a sample population.
- One particular example of a limitation in current metabolomic data analysis techniques involves the identification and quantification of a metabolite in each of a plurality of sample.
- the identification of the metabolite involves analyzing the data file of each sample to determine whether an indication (i.e., an intensity peak for a particular sample ion mass or sample component mass, observed at a particular retention time or range or retention times) of that metabolite exists within the respective data files. If such an indication is determined, quantification of that metabolite may then involve the integration (mathematical calculation of area) of the area represented by that indication (i.e., the area under the intensity peak).
- the indication i.e., the intensity peak
- the integration procedure used to calculate the area represented by the indication may vary, for instance, based on the assumptions used or estimates performed in connection with the calculation, particularly where the origin and the terminus of a particular intensity peak is not clearly evident.
- the indication i.e., the intensity peak
- the various assumptions and estimates which may be difficult to analyze for individual samples when using a file-base data handling method, may result in an inaccurate indication of the quantity of that metabolite (or a plurality of metabolites) present over the plurality of the sample.
- such a quantitative inaccuracy introduced into a metabolomics analysis at such an early stage may lead to larger inaccuracies in subsequent steps or analyses.
- aspects of the present disclosure which, in one aspect, provides a method of analyzing data for a plurality of samples obtained from a component separation and mass spectrometer system, wherein the data includes a data set for each sample, and wherein each data set includes a sample indicia (i.e., a sample identifier such as, e.g., a number, a name, an ID, or other suitable/unique designation or combinations thereof), a sample ion mass or sample component mass, a retention time, and an intensity.
- a sample indicia i.e., a sample identifier such as, e.g., a number, a name, an ID, or other suitable/unique designation or combinations thereof
- Such a method may comprise forming a profile plot for each sample from the data obtained from the component separation and mass spectrometer system and corresponding to the respective sample, with each profile plot having a retention time axis and an intensity axis, and including a graphical representation of intensity as a function of retention time for a selected sample ion mass.
- An intensity peak arrangement corresponding to a selected ion is identified in the profile plot for each sample, with the intensity peak arrangement including at least one identifying peak, and with each of the at least one identifying peak having a peak range and a characteristic intensity within the peak range.
- An orthogonal plot, corresponding to the profile plot, is formed for each sample, with the orthogonal plot extending along the retention time axis in a plane perpendicular to the intensity axis.
- the characteristic intensity of each of the at least one identifying peak is represented on the retention time axis of the orthogonal plot with gradated indicia.
- the at least one identifying peak includes a main peak and at least one sub-peak, such that the characteristic intensity of each of the at least one identifying peak is represented on the retention time axis of the orthogonal plot with gradated indicia having a maximum expression for the characteristic intensity of the main peak and a lesser expression for the characteristic intensity of each of the at least one sub-peak.
- the peak range of each of the at least one identifying peak is represented on the orthogonal plot with range indicia, with the range indicia having a first indicium representing an initiation of the peak range and a second indicium representing a termination of the peak range, for the main peak and each of the at least one sub-peak.
- Another aspect of the present disclosure provides an apparatus for analyzing data for a plurality of samples obtained from a component separation and mass spectrometer system, with the data including a data set for each sample, and with each data set including a sample indicia, a sample ion mass, a retention time, and an intensity, wherein the apparatus comprises a processor and a memory storing executable instructions that, in response to execution by the processor, cause the apparatus to at least perform the steps of the method aspect of the present disclosure.
- a further aspect of the present disclosure provides a computer program product for analyzing data for a plurality of samples obtained from a component separation and mass spectrometer system, with the data including a data set for each sample, and with each data set including a sample indicia, a sample ion mass, a retention time, and an intensity
- the computer program product comprises at least one non-transitory computer readable storage medium having computer-readable program code stored thereon, the computer-readable program code comprising program code that is executable to at least perform the steps of the method aspect of the present disclosure.
- a method of analyzing data for a plurality of samples obtained from a component separation and mass spectrometer system the data including a data set for each sample, each data set including sample indicia, sample ion mass, retention time, and intensity
- a method comprises forming a profile plot for each sample from the data obtained from the component separation and mass spectrometer system and corresponding to the respective sample, wherein each profile plot has a retention time axis and an intensity axis, and includes a graphical representation of intensity as a function of retention time for a selected sample ion mass; identifying an intensity peak arrangement corresponding to a selected ion in the profile plot for each sample, wherein the intensity peak arrangement includes at least one identifying peak, and wherein each of the at least one identifying peak has a peak range and a characteristic intensity within the peak range; forming an orthogonal plot, corresponding to the profile plot, for each sample, wherein the orthogonal plot extends along the retention time axis in a plane perpendicular to the intensity
- representing the characteristic intensity of each of the at least one identifying peak further comprises representing the characteristic intensity of the at least one identifying peak on the retention time axis of the orthogonal plot with gradated indicia having an expression for each of the at least one identifying peak in proportion to a relation of the characteristic intensity to a defined range.
- the at least one identifying peak includes a main peak and at least one sub-peak
- representing the characteristic intensity of each of the at least one identifying peak further comprises representing the characteristic intensity of the at least one identifying peak on the retention time axis of the orthogonal plot with gradated indicia having a maximum expression for the characteristic intensity of the main peak and a lesser expression for the characteristic intensity of each of the at least one sub-peak.
- any preceding or subsequent embodiment, or combinations thereof further comprising representing the peak range of each of the at least one identifying peak on the orthogonal plot with range indicia, wherein the range indicia has a first indicium representing an initiation of the peak range and a second indicium representing a termination of the peak range, for each of the at least identifying peak.
- the at least one identifying peak includes a main peak and at least one sub-peak
- representing the peak range of each of the at least one identifying peak on the orthogonal plot with range indicia comprises representing the peak range of each of the at least one identifying peak on the orthogonal plot with range indicia, with the second indicium of the range indicia of the main peak also representing the first indicium of the range indicia of a next sub-peak of the intensity peak arrangement, and wherein the next sub-peak is one of a shoulder peak and a secondary peak associated with the main peak.
- the at least one identifying peak includes a main peak and at least one sub-peak
- representing the peak range of each of the at least one identifying peak on the orthogonal plot with range indicia comprises representing the peak range of each of the at least one identifying peak on the orthogonal plot with range indicia, with the second indicium of the range indicia of one of the sub-peaks also representing the first indicium of the range indicia of a next sub-peak of the intensity peak arrangement, and wherein the next sub-peak is one of a shoulder peak and a secondary peak associated with the one of the sub-peaks.
- the at least one identifying peak includes a main peak and at least one sub-peak
- representing the characteristic intensity of each of the at least one identifying peak on the retention time axis of the orthogonal plot comprises representing the characteristic intensity of each of the at least one identifying peak on the retention time axis of the orthogonal plot with a gradated shape having a maximum size of the shape for the characteristic intensity of the main peak and a lesser size of the shape for the characteristic intensity of each of the at least one sub-peak.
- the at least one identifying peak includes a main peak and at least one sub-peak
- representing the characteristic intensity of each of the at least one identifying peak on the retention time axis of the orthogonal plot comprises representing the characteristic intensity of each of the at least one identifying peak on the retention time axis of the orthogonal plot with a gradated shading having a maximum intensity of the shading for the characteristic intensity of the main peak and a lesser intensity of the shading for the characteristic intensity of each of the at least one sub-peak.
- the at least one identifying peak includes a main peak and at least one sub-peak
- representing the characteristic intensity of each of the at least one identifying peak on the retention time axis of the orthogonal plot comprises representing the characteristic intensity of each of the at least one identifying peak on the retention time axis of the orthogonal plot with a gradated color having a maximum intensity of the color for the characteristic intensity of the main peak and a lesser intensity of the color for the characteristic intensity of each of the at least one sub-peak.
- the at least one identifying peak includes a main peak and at least one sub-peak
- representing the characteristic intensity of each of the at least one identifying peak on the retention time axis of the orthogonal plot comprises representing the characteristic intensity of each of the at least one identifying peak on the retention time axis of the orthogonal plot with different shapes, including a first shape for the characteristic intensity of the main peak and a second shape for the characteristic intensity of one of the at least one sub-peak.
- any preceding or subsequent embodiment, or combinations thereof further comprising forming a first across-sample plot from the orthogonal plots of the plurality of samples, wherein the first across-sample plot has the retention time axis and a sample indicia axis, and includes a graphical representation of the orthogonal plots across the plurality of samples.
- any preceding or subsequent embodiment, or combinations thereof further comprising determining an area associated with any of the at least one identifying peak of the intensity peak arrangement for the selected ion, using an integration procedure, wherein the determined area is associated with a relative quantity of an ion component corresponding thereto in the respective sample.
- determining an identity peak for the selected ion from the at least one identifying peak further comprising determining an area associated with the identity peak for the selected ion, using an integration procedure, and wherein the determined area of the identity peak is associated with a relative quantity of the selected ion corresponding thereto in the respective sample.
- any preceding or subsequent embodiment, or combinations thereof further comprising forming a first across-sample plot from the orthogonal plots of the plurality of samples, wherein the first across-sample plot has the retention time axis and a sample indicia axis, and includes a graphical representation of the orthogonal plots across the plurality of samples, and displaying the second across-sample plot concurrently with the first across-sample plot.
- An apparatus for analyzing data for a plurality of samples obtained from a component separation and mass spectrometer system the data including a data set for each sample, each data set including sample indicia, sample ion mass, retention time, and intensity
- the apparatus comprising a processor and a memory storing executable instructions that, in response to execution by the processor, cause the apparatus to at least perform the steps of forming a profile plot for each sample from the data obtained from the component separation and mass spectrometer system and corresponding to the respective sample, wherein each profile plot having a retention time axis and an intensity axis, and includes a graphical representation of intensity as a function of retention time for a selected sample ion mass; identifying an intensity peak arrangement corresponding to a selected ion in the profile plot for each sample, wherein the intensity peak arrangement includes at least one identifying peak, and wherein each of the at least one identifying peak has a peak range and a characteristic intensity within the peak range; forming an orthogonal plot, corresponding to the profile plot,
- the memory stores executable instructions that, in response to execution by the processor, cause the apparatus to further perform the step of representing the characteristic intensity of the at least one identifying peak on the retention time axis of the orthogonal plot with gradated indicia having an expression for each of the at least one identifying peak in proportion to a relation of the characteristic intensity to a defined range.
- the at least one identifying peak includes a main peak and at least one sub-peak
- the memory stores executable instructions that, in response to execution by the processor, cause the apparatus to further perform the step of representing the characteristic intensity of the at least one identifying peak on the retention time axis of the orthogonal plot with gradated indicia having a maximum expression for the characteristic intensity of the main peak and a lesser expression for the characteristic intensity of each of the at least one sub-peak.
- the memory stores executable instructions that, in response to execution by the processor, cause the apparatus to further perform the step of representing the peak range of each of the at least one identifying peak on the orthogonal plot with range indicia, wherein the range indicia has a first indicium representing an initiation of the peak range and a second indicium representing a termination of the peak range, for each of the at least one identifying peak.
- the at least one identifying peak includes a main peak and at least one sub-peak
- the memory stores executable instructions that, in response to execution by the processor, cause the apparatus to further perform the step of representing the peak range of each of the at least one identifying peak on the orthogonal plot with range indicia, with the second indicium of the range indicia of the main peak also representing the first indicium of the range indicia of a next sub-peak of the intensity peak arrangement, wherein the next sub-peak is one of a shoulder peak and a secondary peak associated with the main peak.
- the at least one identifying peak includes a main peak and at least one sub-peak
- the memory stores executable instructions that, in response to execution by the processor, cause the apparatus to further perform the step of representing the peak range of each of the at least one identifying peak on the orthogonal plot with range indicia, with the second indicium of the range indicia of one of the sub-peaks also representing the first indicium of the range indicia of a next sub-peak of the intensity peak arrangement, wherein the next sub-peak is one of a shoulder peak and a secondary peak associated with the one of the sub-peaks.
- the at least one identifying peak includes a main peak and at least one sub-peak
- the memory stores executable instructions that, in response to execution by the processor, cause the apparatus to further perform the step of representing the characteristic intensity of each of the at least one identifying peak on the retention time axis of the orthogonal plot with a gradated shape having a maximum size of the shape for the characteristic intensity of the main peak and a lesser size of the shape for the characteristic intensity of each of the at least one sub-peak.
- the at least one identifying peak includes a main peak and at least one sub-peak
- the memory stores executable instructions that, in response to execution by the processor, cause the apparatus to further perform the step of representing the characteristic intensity of each of the at least one identifying peak on the retention time axis of the orthogonal plot with a gradated shading having a maximum intensity of the shading for the characteristic intensity of the main peak and a lesser intensity of the shading for the characteristic intensity of each of the at least one sub-peak.
- the at least one identifying peak includes a main peak and at least one sub-peak
- the memory stores executable instructions that, in response to execution by the processor, cause the apparatus to further perform the step of representing the characteristic intensity of each of the at least one identifying peak on the retention time axis of the orthogonal plot with a gradated color having a maximum intensity of the color for the characteristic intensity of the main peak and a lesser intensity of the color for the characteristic intensity of each of the at least one sub-peak.
- the at least one identifying peak includes a main peak and at least one sub-peak
- the memory stores executable instructions that, in response to execution by the processor, cause the apparatus to further perform the step of representing the characteristic intensity of each of the at least one identifying peak on the retention time axis of the orthogonal plot with different shapes, including a first shape for the characteristic intensity of the main peak and a second shape for the characteristic intensity of one of the at least one sub-peak.
- the memory stores executable instructions that, in response to execution by the processor, cause the apparatus to further perform the step of forming a first across-sample plot from the orthogonal plots of the plurality of samples, wherein the first across-sample plot has the retention time axis and a sample indicia axis, and includes a graphical representation of the orthogonal plots across the plurality of samples displayed on the display.
- the memory stores executable instructions that, in response to execution by the processor, cause the apparatus to further perform the step of determining an area associated with any of the at least one identifying peak of the intensity peak arrangement for the selected ion, using an integration procedure, wherein the determined area is associated with a relative quantity of an ion component corresponding thereto in the respective sample.
- the memory stores executable instructions that, in response to execution by the processor, cause the apparatus to further perform the step of determining an identity peak for the selected ion from the at least one identifying peak, wherein determining an area comprises determining an area associated with the identity peak for the selected ion, using an integration procedure, and wherein the determined area of the identity peak is associated with a relative quantity of the selected ion corresponding thereto in the respective sample.
- the memory stores executable instructions that, in response to execution by the processor, cause the apparatus to further perform the step of selectively toggling between the profile plot and the orthogonal plot of the intensity peak arrangement of at least one of the samples displayed on the display.
- the memory stores executable instructions that, in response to execution by the processor, cause the apparatus to further perform the step of concurrently displaying the profile plot and the orthogonal plot of the ion peak arrangement of at least one of the samples displayed on the display.
- the memory stores executable instructions that, in response to execution by the processor, cause the apparatus to further perform the step of superimposing the profile plots of the selected ion for at least a portion of the samples on a second across-sample plot displayed on the display.
- the memory stores executable instructions that, in response to execution by the processor, cause the apparatus to further perform the step of forming a first across-sample plot from the orthogonal plots of the plurality of samples, wherein the first across-sample plot has the retention time axis and a sample indicia axis, and includes a graphical representation of the orthogonal plots across the plurality of samples displayed on the display, and displaying the second across-sample plot concurrently with the first across-sample plot on the display.
- a computer program product for analyzing data for a plurality of samples obtained from a component separation and mass spectrometer system, wherein the data includes a data set for each sample, wherein each data set includes sample indicia, sample ion mass, retention time, and intensity
- the computer program product comprises at least one non-transitory computer readable storage medium having computer-readable program code stored thereon, and wherein the computer-readable program code comprises program code for forming a profile plot for each sample from the data obtained from the component separation and mass spectrometer system and corresponding to the respective sample, wherein each profile plot has a retention time axis and an intensity axis, and includes a graphical representation of intensity as a function of retention time for a selected sample ion mass; program code for identifying an intensity peak arrangement corresponding to a selected ion in the profile plot for each sample, wherein the intensity peak arrangement includes at least one identifying peak, and wherein each of the at least one identifying peak has a peak range and a characteristic intensity within the peak range; program
- the at least one identifying peak includes a main peak and at least one sub-peak
- the computer program product comprises program code for representing the characteristic intensity of the at least one identifying peak on the retention time axis of the orthogonal plot with gradated indicia having a maximum expression for the characteristic intensity of the main peak and a lesser expression for the characteristic intensity of each of the at least one sub-peak.
- the at least one identifying peak includes a main peak and at least one sub-peak
- the program code for representing the peak range of each of the at least one identifying peak on the orthogonal plot with range indicia comprises program code for representing the peak range of each of the at least one identifying peak on the orthogonal plot with range indicia, with the second indicium of the range indicia of the main peak also representing the first indicium of the range indicia of a next sub-peak of the intensity peak arrangement, wherein the next sub-peak is one of a shoulder peak and a secondary peak associated with the main peak.
- the at least one identifying peak includes a main peak and at least one sub-peak
- the program code for representing the peak range of each of the at least one identifying peak on the orthogonal plot with range indicia comprises program code for representing the peak range of each of the at least one identifying peak on the orthogonal plot with range indicia, with the second indicium of the range indicia of one of the sub-peaks also representing the first indicium of the range indicia of a next sub-peak of the intensity peak arrangement, wherein the next sub-peak is one of a shoulder peak and a secondary peak associated with the one of the sub-peaks.
- the at least one identifying peak includes a main peak and at least one sub-peak
- the program code for representing the characteristic intensity of each of the at least one identifying peak on the retention time axis of the orthogonal plot comprises program code for representing the characteristic intensity of each of the at least one identifying peak on the retention time axis of the orthogonal plot with a gradated shape having a maximum size of the shape for the characteristic intensity of the main peak and a lesser size of the shape for the characteristic intensity of each of the at least one sub-peak.
- program code for representing the characteristic intensity of each of the at least one identifying peak on the retention time axis of the orthogonal plot comprises program code for representing the characteristic intensity of each of the at least one identifying peak on the retention time axis of the orthogonal plot with a gradated shading having a maximum intensity of the shading for the characteristic intensity of the main peak and a lesser intensity of the shading for the characteristic intensity of each of the at least one sub-peak.
- program code for representing the characteristic intensity of each of the at least one identifying peak on the retention time axis of the orthogonal plot comprises program code for representing the characteristic intensity of each of the at least one identifying peak on the retention time axis of the orthogonal plot with a gradated color having a maximum intensity of the color for the characteristic intensity of the main peak and a lesser intensity of the color for the characteristic intensity of each of the at least one sub-peak.
- program code for representing the characteristic intensity of each of the at least one identifying peak on the retention time axis of the orthogonal plot comprises program code for representing the characteristic intensity of each of the at least one identifying peak on the retention time axis of the orthogonal plot with different shapes, including a first shape for the characteristic intensity of the main peak and a second shape for the characteristic intensity of one of the at least one sub-peak.
- the apparatuses, methods, and computer program products for analyzing data obtained from a component separation and mass spectrometer system provide these and other advantages, as detailed further herein.
- these advantages include a compact format that spans an “additional dimension” of the sample data, or otherwise facilitates analysis of sample data across a population of samples or between samples within the population, thereby providing increased quality and consistency of analysis results.
- These advantages also include the capability of identifying additional sample components and/or ion components thereof, and the improved capability of determining the relative quantity of one or more of such sample components and/or ion components thereof indicated by the recited intensity peaks or intensity peak arrangements.
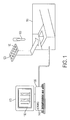
- FIG. 1 schematically illustrates a system according to one aspect of the present disclosure including a memory device having a database, a processor device, and a user interface (display), in communication with a spectrometry device;
- FIG. 2 schematically illustrates a three-dimensional plot of spectrometry data associated with one exemplary sample
- FIG. 3 schematically illustrates a two-dimensional profile plot for one exemplary sample that may be determined from the corresponding three-dimensional plot of spectrometry data for that sample according to some aspects of the present disclosure
- FIG. 4 schematically illustrates a two-dimensional orthogonal plot corresponding to the two-dimensional profile plot for an exemplary sample shown in FIG. 3 , according to some aspects of the present disclosure
- FIG. 5 schematically illustrates a two-dimensional profile plot for another exemplary sample that may be determined from the corresponding three-dimensional plot of spectrometry data for that sample according to some aspects of the present disclosure
- FIG. 6 schematically illustrates a two-dimensional orthogonal plot corresponding to the two-dimensional profile plot for an exemplary sample shown in FIG. 5 , according to some aspects of the present disclosure
- FIG. 7 schematically illustrates a first across-sample plot that may be generated by some aspects of the present disclosure showing a comparison of orthogonal plots across a plurality of samples;
- FIG. 8 schematically illustrates an operational flow of the apparatuses, methods, and computer program products of one exemplary aspect of the present disclosure
- FIG. 9 schematically illustrates another plot that may be generated by some aspects of the present disclosure showing a comparison of the profile plots of selected intensity peaks across a plurality of samples, wherein the determination of the area under an intensity peak or component of an intensity peak arrangement is determined according to one aspect of the present disclosure
- FIG. 10 schematically illustrates a first across-sample plot that may be generated by some aspects of the present disclosure showing a comparison of orthogonal plots across a plurality of samples, and a concurrent display of the profile plot corresponding to one of the orthogonal plots;
- FIG. 11 schematically illustrates a first across-sample plot that may be generated by some aspects of the present disclosure showing a comparison of orthogonal plots across a plurality of samples, and a concurrent display of a second across-sample plot corresponding to superimposed profile plots for a selected number of samples.
- the various aspects of the present disclosure mentioned above, as well as many other aspects of the disclosure, are described in further detail herein.
- the apparatuses and methods associated with aspects of the present disclosure are exemplarily disclosed, in some instances, in conjunction with an appropriate analytical device which may, in some instances, comprise a separator portion (i.e., a chromatograph) and/or a detector portion (i.e., a spectrometer).
- a separator portion i.e., a chromatograph
- a detector portion i.e., a spectrometer
- the apparatuses and methods associated with aspects of the present disclosure can be adapted to any number of processes that are used to generate complex sets of data for each sample, across a plurality of samples, whether biological, chemical, or biochemical, in nature.
- aspects of the present disclosure may be used with and applied to a variety of different analytical devices and processes including, but not limited to: analytical devices including a separator portion (or “component separator” portion) comprising one of a liquid chromatograph (LC) and a gas chromatograph (GC); a cooperating detector portion (or “mass spectrometer” portion) comprising one of a nuclear magnetic resonance imaging (NMR) device; a mass spectrometer (MS); and an electrochemical array (EC); and/or combinations thereof.
- analytical devices including a separator portion (or “component separator” portion) comprising one of a liquid chromatograph (LC) and a gas chromatograph (GC); a cooperating detector portion (or “mass spectrometer” portion) comprising one of a nuclear magnetic resonance imaging (NMR) device; a mass spectrometer (MS); and an electrochemical array (EC); and/or combinations thereof.
- LC liquid chromatograph
- GC gas chromatograph
- cooperating detector portion or “mass
- the aspects of the present disclosure as disclosed herein can be implemented in other applications where there is a need to characterize or analyze small molecules present within a sample or complex mixture, regardless of the origin of the sample or complex mixture.
- the aspects of the present disclosure as disclosed herein can also be implemented in a bioprocess optimization procedure where the goal is to grow cells to produce drugs or additives, or in a drug metabolite profiling procedure where the goal is to identify all metabolites that are the result of biotranformations of an administered xenobiotic.
- these exemplary applications may be very different from a metabolomics analysis, where the goal is only to examine endogenous metabolites.
- Some other non-limiting examples of other applications could include a quality assurance procedure for consumer product manufacturing where the goal may be to objectively ensure that desired product characteristics are met, in procedures where a large number of sample components can give rise to a particular attribute, such as taste or flavor (e.g., cheese, wine or beer), or scent/smell (e.g., fragrances).
- a quality assurance procedure for consumer product manufacturing where the goal may be to objectively ensure that desired product characteristics are met, in procedures where a large number of sample components can give rise to a particular attribute, such as taste or flavor (e.g., cheese, wine or beer), or scent/smell (e.g., fragrances).
- taste or flavor e.g., cheese, wine or beer
- scent/smell e.g., fragrances
- FIG. 1 illustrates an example of a system according to one aspect of the present disclosure wherein the system is in communication with an analytical device 110 , such as a combination chromatograph (component separator)/mass spectrometer.
- an analytical device 110 such as a combination chromatograph (component separator)/mass spectrometer.
- an analytical device 110 such as a combination chromatograph (component separator)/mass spectrometer.
- an analytical device 110 such as a combination chromatograph (component separator)/mass spectrometer.
- a sample whether biological, chemical, or biochemical, in nature
- a sample 100 may be introduced into the separator portion of the analytical device 110 and analyzed using appropriate techniques, as applied through the detector portion, that will be appreciated by those skilled in the art.
- the components of a particular sample 100 may pass through a column associated with the separator portion, at different rates and exhibit different spectral responses, as detected by the detector portion, based upon their specific characteristics.
- the analytical device 110 may generate a set of spectrometry data, corresponding to each sample 100 and having three or more dimensions (i.e., quantifiable samples properties) associated therewith, wherein the data included in the data set generally indicates the composition of the sample 100 .
- the data set may comprise, for example, data for each sample related to retention time, sample or component (ion) mass, intensity, or even sample indicia or identity. However, such data must first be appropriately analyzed in order to determine the sample composition.
- a three-dimensional data set for each of the plurality of samples may be selected or otherwise designated for further analysis, with each dimension corresponding to a quantifiable sample property.
- An example of such a three-dimensional set of spectrometry data is shown generally in FIG. 2 , and may be plotted on a three-axis plot or graph, with the plot or graph including individual axes for a response intensity element 220 , a sample component mass element 210 , and a time element 230 (particularly, in this example, the retention time or the time that a particular component spends in the column of the separator portion of the analytical device 110 ).
- the location of data points in relation to the sample component mass axis 210 may be indicative, for example, of the number of individual component molecules within the sample 100 and the relative mass values for such sample components.
- other analytical devices may be used to generate a three or more dimensional set of analytical data corresponding to the sample 100 .
- the analytical device may include, but is not limited to: various combinations of a separator portion comprising one of a liquid chromatograph (LC) (positive or negative channel) and a gas chromatograph (GC); and a cooperating detector portion comprising one of a nuclear magnetic resonance imaging (NMR) device; a mass spectrometer (MS); and an electrochemical array (EC).
- LC liquid chromatograph
- NMR nuclear magnetic resonance imaging
- MS mass spectrometer
- EC electrochemical array
- a plurality of samples 100 may be taken individually from a well plate 120 and/or from other types of sample containers and introduced individually into the analytical device 110 for analysis and generation of the corresponding three or more dimensional data set (see, e.g., FIG. 2 ).
- individual samples 100 may be transferred from a well plate 120 to the analytical device 110 via pipette, syringe, microfluidic passageways defined by a test array, and/or other systems for transferring samples in a laboratory environment.
- samples may, vary considerably, generally comprising mixtures or complex mixtures including small molecules, wherein such samples may exemplarily include, but are not limited to: blood samples, urine samples, cell cultures, saliva samples, plant tissue and organs (e.g., leaves, roots, stems, flowers, etc.), plant extracts, culture media, membranes, cellular compartments/organelles, cerebral spinal fluid (CSF), milk, soda products, food products (e.g., yogurt, chocolate, juice), and/or other types of biological, chemical, and/or biochemical samples in which the metabolites and/or chemical/molecular components of interest may be present.
- CSF cerebral spinal fluid
- aspects of the present disclosure may comprise a database (e.g., a relational database) stored at least in part, for example, as executable instructions in a memory or memory device 140 (i.e., a computer-readable storage medium having computer-readable program code portions stored therein), wherein the memory device 140 is in communication with a processor or processor device 130 (e.g., a computer device implementing a processor) for selectively executing the instructions/computer-readable program code portions in the memory device 140 to cause an apparatus to perform particular method steps and/or functions.
- a database e.g., a relational database
- a memory or memory device 140 i.e., a computer-readable storage medium having computer-readable program code portions stored therein
- the memory device 140 is in communication with a processor or processor device 130 (e.g., a computer device implementing a processor) for selectively executing the instructions/computer-readable program code portions in the memory device 140 to cause an apparatus to perform particular method steps and/or functions.
- the memory device 140 and/or the processor device 130 may be configured to be in communication with the analytical device 110 for automatically receiving a data set (in some instances, a data set comprising three or more dimensions, wherein a data parameter such as sample indicia, sample or component (ion) mass, retention time, and intensity/response may represent one of the dimensions of the data set), corresponding to each of the plurality of samples 100 , therefrom.
- a data set in some instances, a data set comprising three or more dimensions, wherein a data parameter such as sample indicia, sample or component (ion) mass, retention time, and intensity/response may represent one of the dimensions of the data set
- the processor device 130 may be in communication with the analytical device 110 via wire line (RS-232, and/or other types of wire connection) and/or wireless (such as, for example, RF, IR, or other wireless communication) techniques such that the database associated with the memory device 140 /processor device 130 (and/or in communication therewith) may receive the data set from the analytical device 110 so as to be stored thereby
- the analytical device 110 may be in communication with one or more processor devices 130 (and associated user interfaces or displays 150 ) via a wire line and/or wireless computer network including, but not limited to: the Internet, local area networks (LAN), wide area networks (WAN), or other networking types and/or techniques that will be appreciated by one skilled in the art.
- the user interface/display 150 may be used to display any or all of the communications involving the system, including the manipulations and analyses of sample data disclosed herein, as will be understood and appreciated by one skilled in the art.
- the database may be structured using commercially-available software, such as, for example, Oracle, Sybase, DB2, or other database software.
- the processor device 130 may be in communication with the memory device 140 (such as a hard drive, memory chip, flash memory, RAM module, ROM module, and/or other memory device 140 ) for storing/administering the database, including the three-dimensional data sets automatically received from the analytical device 110 .
- the memory device 140 may also be used to store other received data in the database and/or data otherwise manipulated by the processor device 130 .
- the processor device 130 may, in some aspects, be capable of converting each of the data sets (see, e.g., FIG. 2 , wherein the exemplary data set is a three-dimensional data set) for each of the samples, received by the memory device 140 , into at least one corresponding two-dimensional data set (see, e.g., FIG. 3 ), wherein the at least one two-dimensional data set may comprise, for example, a two-dimensional component “profile” of a particular sample 100 at a particular point 235 ( FIG. 2 ) along one of the three axes of the three-dimensional data set.
- the particular point 235 along one of the three axes may be, for example, a particular sample component mass along the sample component mass axis 210 .
- the resulting profile (also referred to herein as a “profile plot” as shown in FIGS. 3 and 5 ) illustrates that particular sample component mass detected (and the intensity of that detection) as a function of time measured from a zero point, the zero point corresponding to when the sample 100 is injected and/or otherwise introduced into the analytical device 110 ).
- the processor device 130 may be configured to produce a sample component (retention) time versus intensity/response profile of the sample for that given or selected sample component mass point 235 (see FIGS. 3 and 5 , for example).
- the “x” axis in FIG. 2 (or time axis 230 , for example) may further, in some instances, be characterized as a retention index and/or a retention time.
- the processor device 130 may be further capable of parsing each of the three (or more) dimensional data sets, for each of the plurality of samples, into one or more individual two-dimensional (i.e., sample component retention time versus intensity/response profile) profiles corresponding to at least one particular (selected) sample component mass point (element 235 , for example) so as to convert each three (or more) dimensional data set (of FIG. 2 , for example) into at least one corresponding two-dimensional data set of a selected sample component (having a profile or profile plot shown, for example, in FIGS. 3 and 5 , and step 600 in FIG. 8 ) that may further be plotted as an response intensity 220 of the corresponding sample component mass versus a sample component retention time 230 , and displayed on the user interface/display 150 , as desired.
- individual two-dimensional i.e., sample component retention time versus intensity/response profile
- the processor device 130 may be configured to selectively execute the executable instructions/computer-readable program code portions stored by the memory device 140 so as to accomplish, for instance, the identification, quantification, representation, and/or other analysis of a selected sample component (i.e., a metabolite, molecule, or ion, or portion thereof) in each of the plurality of samples, from the two-dimensional data set representing that selected sample component.
- a selected sample component i.e., a metabolite, molecule, or ion, or portion thereof
- the sample component to be analyzed is first determined by selecting an intensity peak (see, e.g., element 225 in FIG. 5 ) or intensity peak arrangement (see, e.g., element 225 in FIG.
- each of the plurality of two-dimensional data sets i.e., across the plurality of samples
- metabolomics data i.e., “at least one identifying peak”.
- two-dimensional data sets are determined from respective three or more dimensional data sets of metabolomics data for each of a plurality of samples, generally by selecting or otherwise designating two desired dimensions/axes, and selecting a particular value (i.e., retention time or sample component mass) with respect to another one of the dimensions/axes of the three or more dimensional data set.
- sample component to be analyzed may, in some instances, be selected from the three or more dimensional data set, if necessary or desired, and that such selection of the sample component to be analyzed may be further refined upon analysis of the two-dimensional data set corresponding thereto.
- the selection of the sample component to be analyzed may be facilitated, for example, by analyzing a graphical representation of the three or more dimensional data set(s) (i.e., via user interface or display 150 , which may comprise, for example, a display device, personal computer, and/or other electronic device having a display for graphical representation of data), and the selection may involve, for instance, evaluating the apparent response intensity of that sample component in the respective two-dimensional and/or three or more dimensional data sets, to determine the selected intensity peak or intensity peak arrangement 225 (i.e., “at least one identifying peak”).
- user interface or display 150 which may comprise, for example, a display device, personal computer, and/or other electronic device having a display for graphical representation of data
- the selection may involve, for instance, evaluating the apparent response intensity of that sample component in the respective two-dimensional and/or three or more dimensional data sets, to determine the selected intensity peak or intensity peak arrangement 225 (i.e., “at least one identifying peak”).
- the processor device 130 may be configured to execute computer-readable program code portions stored by the memory device 140 for analyzing the collected data sets across two or more of the plurality of samples so as to determine a suitable sample component to be further analyzed, whether that sample component has been previously identified (i.e., as a particular molecule, ion, or metabolite, or portion thereof) or not, via an intensity peak or combination or arrangement of intensity peaks (also referred to herein as an “intensity peak arrangement”) 225 .
- the intensity peak(s) or combinations thereof otherwise may be referred to herein as “at least one identifying peak,” “selected intensity peak,” “selected intensity peak arrangement,” “ion peak,”, or “selected ion peak” associated therewith.
- the processor device 130 may be configured to sort and/or group intensity/ion peak data across the plurality of samples, for example, by sample component mass and/or by selected retention time. In this manner, the processor device 130 may also be configured, for instance, to examine intensity peak or intensity peak arrangement data that is sufficiently discernible from background noise or other undesirable data artifacts (i.e., of suitable quality), in order to reduce variances and provide a more statistically significant analysis upon determining the selected intensity peak or intensity peak arrangement 225 (i.e., “at least one identifying peak”).
- an “intensity peak arrangement” or combination of intensity peaks 225 may comprise, for example, a “main peak” 225 A and at least one “sub-peak” 225 B, 225 C, 225 D following on the retention time axis (see, e.g., FIG. 3 ). Such an “intensity peak arrangement” or combination of intensity peaks 225 may result, for example, from instances of co-elution in high throughput processing of samples through the analytical device(s).
- the intensity peaks representing the various metabolites may not be detected by the analytical device(s) in such a manner as to appear “well separated” (i.e., “well resolved”) from each other in the resulting data, and may thus appear as groups of intensity peaks as shown, for example, in FIG. 3 .
- the at least one sub-peak 225 B, 225 C, 225 D may have a lesser intensity/response than the main peak 225 A, though not necessarily always evident.
- one or more of the at least one sub-peak may be evident prior to the main peak 225 A on the retention time axis 230 .
- the intensity peaks representing the various metabolites may be detected by the analytical device(s) in such a manner as to appear “w well-separated/well-resolved” from each other in the resulting data, and may thus appear as a separate, distinct, and/or discrete intensity peak as shown, for example, in FIG. 5 .
- the processor device 130 may be configured to first identify a plurality of candidate intensity peaks or intensity peak arrangements in each of the two-dimensional data sets, and compare the candidate intensity peaks or intensity peak arrangements across the plurality of two-dimensional data sets, wherein the candidate intensity peak or intensity peak arrangement with the lowest standard deviation (i.e., the best data quality of the main peak 225 A across the plurality of samples) may be selected as the selected intensity/ion peak or intensity/ion arrangement 225 (see, e.g., step 610 in FIG. 8 ).
- the selected intensity peak or intensity peak arrangement may be determined in other manners.
- one of the candidate intensity peaks or intensity peak arrangements evident across the plurality of two-dimensional data sets, and corresponding to a recognized compound, metabolite, ion, or component or portion thereof in an associated database of such compounds, metabolites, ions, or components or portions thereof, may be selected as the selected intensity/ion peak or intensity peak arrangement.
- the candidate intensity peaks or intensity peak arrangements across the plurality of two-dimensional data sets may be compared with mass spectra included in a library or database of recognized or otherwise known compounds (i.e., using a library or database matching process), followed with subjective curation or resolution of the matching process, if necessary.
- one of the candidate intensity peaks or intensity peak arrangements matched with, corresponding to, or best correlated with, the recognized or known compound i.e., by comparison of quantitative mass
- the processor device 130 may further be configured to execute instructions/computer readable program code portions so as to identify a particular compound or sample component (i.e., a metabolite) associated with the selected and analyzed intensity peak or intensity peak arrangement 225 ).
- the particular compound/sample component may be “known named” and/or “known, but unnamed” chemicals/compounds. That is, for example, the identified particular compound/sample component may correspond to a metabolite having a chemical nomenclature or to a “known, but unnamed” metabolite which has been previously identified, but not yet assigned a chemical name and/or classification.
- the processor device 130 may be further configured to align the selected intensity peak or intensity peak arrangement 225 evident in each two-dimensional data set, across the plurality of samples, prior to further analysis of the data. More particularly, when analyzing spectrometry data across a plurality of samples, various compounds (including metabolites) may move at somewhat different rates during a separation process, from one sample to another, so that it may not be entirely clear which peaks or peak arrangements (corresponding to eluted or co-eluted compounds, for example) should be considered as corresponding to one another across the plurality of samples. As such, the processor device 130 may be configured to execute instructions/computer readable program code portions to implement an intensity peak/peak arrangement alignment correction method for the selected intensity peak or peak arrangement in each two-dimensional data set across the plurality of samples.
- one such method involves spiking known compounds into each sample that are characterized by known retention times (RT) in spectrometry analysis.
- the set of “spiked” compounds matches a fixed retention index (RI) value to the shifting RT.
- the “spiked” compounds thus provide an internal standard (IS) that may be used to align data from a plurality of samples from study to study and/or from study to a chemical library.
- IS internal standard
- One skilled in the art will appreciate, however, that many different methods may be used to perform the intensity peak/peak arrangement alignment for the selected intensity peak or peak arrangement, across the plurality of samples, within the spirit and scope of the present disclosure, and that the example presented herein in this respect is not intended to be limiting in any manner.
- the processor device 130 may be configured to execute instructions/computer readable program code portions to implement a procedure for determining an area associated with the selected intensity peak or the selected peak arrangement or component thereof, using one of a plurality of integration procedures, for each of the two-dimensional data sets across the plurality of samples (see, e.g., the area represented by the shaded portions of each of the 4 profile plots for 4 different samples shown in FIG. 9 ).
- the area of the selected intensity peak or the selected peak arrangement (or component thereof) 225 may represent, for example, a relative quantity of the corresponding sample component (i.e., molecule, ion, or metabolite or portion thereof) within the sample, for example, in terms of a percent relative standard deviation (% RSD), since each two-dimensional data set is configured to indicate a sample property (i.e., sample component (retention) time) in one dimension versus a detected intensity at a selected value of another sample property (i.e., sample component mass) as a function of time in the other dimension.
- the intensity may represent, for example, an amount of the molecules, ions, or metabolites or portion or component thereof having the selected value of the sample component mass, detected as a function of (retention) time, beginning from a time zero point.
- the processor device 130 may be configured to execute instructions/computer readable program code portions to determine an intensity peak origin 500 and an intensity peak terminus 550 of the intensity peak (whether discrete/standing alone, or as a component of an intensity peak arrangement) along the time dimension (i.e., the sample component time axis 230 ) of the two-dimensional data set (see, e.g., FIG. 9 ).
- each of the intensity peak origin 500 and the intensity peak terminus 550 may not necessarily be clearly defined.
- the determination of the intensity peak origin 500 and/or the intensity peak terminus 550 may also involve some approximations or subjective analysis such as, for example, determining a particular change in slope or other threshold change, wherein some variations may be permissible within certain tolerances without significantly affecting data quality (i.e., from a statistical perspective).
- relative data may also be determined such as, for example, the relationship of the selected (actual) intensity peak 225 in relation to the intensity peak origin 500 and/or the intensity peak terminus 550 .
- Such a relationship between the selected (actual) intensity peak 225 and the intensity peak origin 500 and/or the intensity peak terminus 550 may indicate, for instance, a shape of the area under the curve of intensity magnitude as a function of time (i.e., extending along the time dimension 220 ), as well as, for example, the magnitude of the area under the curve of intensity magnitude as a function of time, itself.
- the relation of each of the intensity peak origin 500 and the intensity peak terminus 550 , with respect to a baseline intensity 575 in the intensity dimension 220 must also be determined in order to determine the area of the selected intensity peak, or the selected intensity peak arrangement or component thereof. Details and disclosure regarding the determination of the baseline intensity (noise), as well as the integration procedure used to determine the area under the curve, are disclosed, for example, in U.S. Patent Application Publication No. US 2012/0239306 to Dai et al.
- one aspect of an analysis herein generally involves determining an identity peak or characteristic intensity for the selected ion from at least one identifying peak (i.e., the main peak and the at least one sub-peak), and determining an area associated with the identity peak/characteristic intensity for the selected ion, using an integration (mathematical calculation of area) procedure, wherein the determined area of the identity peak/characteristic intensity is associated with a relative quantity of the selected ion corresponding thereto in the respective sample.
- Another aspect of the present disclosure comprises a method of analyzing data for a plurality of samples obtained from a component separation and mass spectrometer system (see, e.g., FIG. 9 ), wherein the data includes a data set for each sample, and wherein each data set includes, for example, a sample indicia, a sample ion mass, a retention time, and an intensity, as otherwise disclosed herein.
- a profile plot may be formed for each sample from the data obtained from the component separation and mass spectrometer system, and corresponding to the respective sample, as previously disclosed.
- Each such profile plot for each sample may include a retention time axis 230 and an intensity axis 220 , and may provide a graphical representation of intensity as a function of retention time for a selected sample ion mass or sample component mass (step 600 , FIG. 8 ).
- the method may also include identifying an intensity peak or intensity peak arrangement 225 (i.e., “at least one identifying peak”) corresponding to a selected ion or components of a selected ion in the profile plot for each sample (step 610 , FIG. 8 ).
- an intensity peak or intensity peak arrangement 225 i.e., “at least one identifying peak”
- the at least one identifying peak or intensity peak arrangement may include a main peak 225 A and at least one sub-peak (see, e.g., 225 B, 225 C, 225 D, etc.).
- the at least one sub-peak may occur successively to the main peak 225 A.
- one or more of the at least one sub-peak may occur or otherwise be evident prior to the occurrence of the main peak 225 A.
- the at least one identifying peak may comprise a single “well separated” or “well-resolved” intensity peak 225 that may be apparent as a separate, distinct, and/or discrete intensity peak.
- the well-separated/well-resolved intensity peak 225 ( FIG. 5 ) or the main peak 225 A and each of the at least one sub-peak ( 225 B, 225 C, 225 D, etc.) ( FIG. 3 ) may each be characterized as having a peak range and a characteristic intensity within that peak range.
- the characteristic intensity of the well-separated/well-resolved intensity peak 225 , or the main peak 225 A and each of the at least one sub-peak ( 225 B, 225 C, 225 D, etc.), may be designated according to a particular intensity observed at a characteristic retention time (or within a retention time range) and, in some instances, according to an expected intensity (or intensity range) at the characteristic retention time.
- an orthogonal plot 650 (see, e.g., FIGS. 4 and 6 ), corresponding to the profile plot, for each sample ( FIGS. 4 and 6 , and step 620 , FIG. 8 ).
- Such an orthogonal plot 650 generally extends along the retention time axis 230 in a plane perpendicular to the intensity axis 220 .
- the orthogonal plot 650 may be characterized as a view of the profile plot along the x-axis (retention time axis 230 ) from a perspective parallel to the y-axis (intensity axis 220 ), wherein the viewed plane extends along the x-axis, perpendicularly to the y-axis. See, e.g., FIGS. 4 and 6 .
- the orthogonal view may also appear as a “two-dimensional” view, with the y-axis being represented by a point, and the view of the sample data for the particular component mass appearing as a line co-extensive with the x-axis.
- an additional aspect of the present disclosure may comprise representing the characteristic intensity of each of the well-separated intensity peak 225 , or the main peak 225 A and the at least one sub-peak ( 225 B, 225 C, 225 D, etc.), on the retention time axis 220 of the orthogonal plot with discernible indicia (see, e.g., elements 650 A, 650 B, 650 C, and 650 D in FIG.
- discernible indicia may comprise, for example, gradated indicia having, for instance, a maximum expression for the characteristic intensity of the main peak 650 A and a lesser expression for the characteristic intensity of each of the at least one sub-peak ( 650 B, 650 C, 650 D, etc.).
- Such gradated indicia may also be applicable in instances of a well-separated/well-resolved intensity peak 225 , as shown, for example, in FIG.
- the discernible indicia may represent the characteristic intensity of the well-separated/well-resolved intensity peak 225 in relation to a legend or other catalog of such gradated indicia.
- Such gradated indicia may include, for example, a particular shape or object that is gradated in size for the characteristic intensities based upon, for instance, the intensity magnitude of each of the characteristic intensities. That is, the characteristic intensity of each of the main peak and the at least one sub-peak on the retention time axis of the orthogonal plot, may be represented with a gradated shape having a maximum size of the shape for the characteristic intensity of the main peak and a lesser size of the shape for the characteristic intensity of each of the at least one sub-peak.
- the indicia may be gradated, for example, according to the magnitude of the characteristic intensity thereof in a given range (i.e., the closer the characteristic intensity is to the maximum of the range, the greater the gradation of the indicia for the well-separated/well-resolved peak on the orthogonal plot)
- the shape may be a circle or oval (see, e.g., FIGS. 4 and 6 ), wherein, as shown in FIG. 4 , the characteristic intensity of the main peak 650 A may be represented by the largest size circle (i.e., the maximum expression of this shape) placed at the retention time along the retention time axis corresponding to the characteristic intensity (i.e., the highest intensity magnitude) of the main peak 650 A.
- the at least one sub-peak may further be represented by gradually lesser-sized circles (i.e., lesser expressions of this shape) for each sub-peak, with each such lesser-sized circle being placed at the retention time along the retention time axis corresponding to the characteristic intensity (i.e., a lesser intensity magnitude) of the respective at least one sub-peak.
- the main peak and the at least one sub-peak of the selected intensity peak arrangement 225 may not necessarily correspond in gradation to the intensity magnitude. That is, there may be some instances where the main peak identifying the ion or intensity peak arrangement may not necessarily have the highest intensity in the intensity peak arrangement.
- a well-separated intensity peak 225 may be an indicia, such as a circle or oval, that is gradated according to the particular characteristics of that intensity peak according to a predefined or preselected range or criteria (i.e., the illustrated circle 650 A representing the well-separated intensity peak 225 may be the largest circle available in the defined gradation of the indicia, which signifies that the characteristic intensity is at or about the highest intensity expected for that intensity peak).
- the disclosed indicia may include other indicia instead of or in addition to the shape indicia.
- indicia comprising different shapes may be used to indicate the main peak and the at least one sub-peak (i.e., a circle for the main peak, followed by a triangle for the next sub-peak, followed by a square for the still-next sub-peak, etc.), or the characteristic(s) of the well-separated intensity peak in relation to the defined gradation.
- the characteristic intensity of each of the main peak and one of the at least one sub-peak on the retention time axis of the orthogonal plot may be represented with different shapes, including a first shape for the characteristic intensity of the main peak and a second shape for the characteristic intensity of the one of the at least one sub-peak, or the well-separated intensity peak may be represented by a particular shape in relation to the magnitude of the characteristic intensity of that peak.
- the indicia may comprise a shape outline, wherein the outline is filled with a gradated color, shade, hue, or other progression for the main peak and the at least one sub-peak, or according to the characteristic(s) of the well-separated intensity peak in relation to the defined gradation.
- the largest circular outline representing the main peak may be filled with the darkest (i.e., the highest intensity magnitude) of a selected color, with the color becoming lighter (i.e., a lesser intensity magnitude) for the successive sub-peaks.
- a grayscale may be used, for instance, with black representing the main peak (i.e., the highest intensity magnitude) and shades of gray (i.e., a lesser intensity magnitude) used to represent the successive sub-peaks.
- the well-separated intensity peak may be represented by a particular color, shade, hue, or other indicia within the progression in relation to the magnitude of the characteristic intensity of that peak.
- the characteristic intensity of each of the main peak and the at least one sub-peak on the retention time axis of the orthogonal plot may be represented with a gradated shading, color, hue, etc. having a maximum intensity of the shading, color, hue, etc. for the characteristic intensity of the main peak and a lesser intensity of the shading, color, hue, etc. for the characteristic intensity of each of the at least one sub-peak, or according to the characteristic(s) of the well-separated intensity peak in relation to the defined gradation.
- the process of distinguishing the characteristic intensity of the main peak from the characteristic intensity of the at least one sub-peak, and/or the characteristic intensity of the sub-peaks from each other, as well as representing the characteristic(s) of the well-separated intensity peak in relation to the defined gradation may be accomplished in many different manners, in the alternative or in addition to the manners disclosed herein with respect to shape, outline, color, shade, hue, other progression, etc.
- each indicia representing the main peak and the at least one-sub-peak is configured to project outwardly from the orthogonal plot, for example, in proportion to the characteristic intensity of the respective one of the main peak and the at least one sub-peak, or according to the characteristic(s) of the well-separated intensity peak in relation to the defined gradation of the three-dimensional effect.
- the method may also include representing the peak range 675 A, 675 B, 675 C, 675 D of each of the main peak and the at least one sub-peak on the orthogonal plot with range indicia, or the peak range 675 of the well-separated peak 225 (see, e.g., FIG. 6 ), with the range indicia having a first indicium 680 (see, e.g., FIGS.
- the peak range representing an initiation of the peak range (i.e., the intensity peak origin 500 ) and a second indicium 690 (see, e.g., FIGS. 4 and 6 ) representing a termination of the peak range (i.e., the intensity peak terminus 550 ), for the main peak and each of the at least one sub-peak, or for the well-separated intensity peak, of the selected intensity peak arrangement 225 for each sample.
- the peak range may be provided in addition to or in the alternative to the characteristic intensities of the main peak and the at least one sub-peak, or the well-separated intensity peak.
- the characteristic intensity 650 A, 650 B, 650 C, 650 D (or characteristic intensity 650 A for the well-separated peak) generally falls between the corresponding intensity peak origin 500 , 680 and intensity peak terminus 550 , 690 .
- the relation between the characteristic intensity 650 A, 650 B, 650 C, 650 D, and the corresponding intensity peak origin 500 , 680 and intensity peak terminus 550 , 690 of the peak range of the corresponding one of the main peak or the at least one sub-peak (or the well-separated/well-resolved peak) may be indicative of properties or characteristics of the intensity as a function of retention time (for a particular sample component mass) on the corresponding profile plot That is, the relationship of the peak range to the characteristic intensity, and/or the relationship of the peak range of one component of the intensity peak arrangement and the peak range of an adjacent component of the intensity peak arrangement, may indicate, for example, a shape of the particular main peak or the at least one sub-peak (or the well-separated/well-resolved peak) and/or the area of the main peak or the at least one sub-peak (or the well-separated/well-resolved peak) under the plotted intensity as a function of time.
- a characteristic intensity disposed approximately medially between an intensity peak origin and an intensity peak terminus may signify that the particular peak is a “stand alone,” “well-separated,” or “well-resolved” intensity peak that is generally symmetrical on either side of the intensity peak (i.e., similar to a symmetrical bell curve).
- the “stand alone,” “well-separated,” or “well-resolved” intensity peak may be skewed accordingly (i.e., the bell curve is skewed or shifted away from symmetry).
- the area under the intensity curve (indicative of the amount of the ion of other component in the intensity peak arrangement) may thus be determined by various integration (mathematical) techniques used for determining the area under such a curve or function.
- the intensity peak origin of a particular peak range does also comprise the intensity peak terminus of an adjacent preceding peak or sub-peak, or if the intensity peak terminus does comprise the intensity peak origin of an adjacent subsequent peak or sub-peak, such a relationship may indicate that the adjacent preceding peak or sub-peak, or the adjacent subsequent peak or sub-peak, may comprise, for example, a “shoulder peak,” “secondary peak,” or other transition about either the intensity peak origin 500 or the intensity peak terminus 550 (see, e.g., FIG. 4 ).
- the peak range of each of the main peak and the at least one sub-peak may be represented on the orthogonal plot with range indicia, with the second indicium of the range indicia of the main peak also representing the first indicium of the range indicia of a next successive sub-peak of the intensity peak arrangement, which indicates that the next successive sub-peak is one of a shoulder peak and a secondary peak associated with the main peak.
- the peak range of each of the main peak and the at least one sub-peak may be represented on the orthogonal plot with range indicia, with the second indicium of the range indicia of one of the sub-peaks also representing the first indicium of the range indicia of a next successive sub-peak of the intensity peak arrangement, which indicates that the next successive sub-peak is one of a shoulder peak and a secondary peak associated with the one of the sub-peaks.
- the particular location of the characteristic intensity 650 A, 650 B, 650 C, 650 D along the retention time axis for either of the adjacent preceding peak or sub-peak, or the adjacent subsequent peak or sub-peak, may also serve to identify the particular nature of the sub-peak (i.e., as a shoulder peak, secondary peak, or other transition, etc.), as well as the skew thereof.
- the area under the intensity curve (indicative of the amount of the ion of other component in the intensity peak arrangement) may thus be determined by various integration techniques used for determining the area under such a curve or function related to, for example, a shoulder peak, secondary peak, or other transition, as disclosed, for instance, in U.S. Patent Application Publication No. US 2012/0239306 to Dai et al. otherwise incorporated herein in its entirety by reference.
- the representation of the sample data on the orthogonal plot, for the corresponding profile plot may be appropriately configured such that the implementation thereof indicates additional “dimensions,” sample properties, or other information, over the mere two-dimensional representation afforded by the orthogonal plot.
- the “two-dimensional” orthogonal plot may be provided with appropriate indicia to indicate, for example, additional “dimensions” such as peak area and peak shape, which may be useful to one skilled in the art for expediting interpretation and analysis of the sample data.
- the selected intensity peak or peak arrangement 225 may be compared or otherwise analyzed across any or all of the various samples.
- the processor device 130 may further be configured to execute instructions/computer readable program code portions so as to arrange or group the orthogonal plots for the analyzed plurality of samples to form a first across-sample plot, as shown in FIG. 7 , wherein the first across-sample plot is configured so as to have a retention time axis 230 and a sample indicia axis 240 , and to include a graphical representation of the orthogonal plots across the plurality of samples, arranged by sample indicia.
- the orthogonal plots are arranged along the sample indicia axis such that the orthogonal plots are adjacently disposed over the same retention time range of the retention time axis associated with the selected intensity peak or intensity peak arrangement 225 , such that the appearance (or absence) of the selected intensity peak or intensity peak arrangement may be analyzed concurrently across any or all of the plurality of samples.
- the processor device 130 may further be configured to execute instructions/computer readable program code portions so as to provide the capability to selectively toggle between the orthogonal plot and the profile plot of the intensity peak or the intensity peak arrangement of at least one of the samples (see, e.g., FIG. 10 ).
- the across-sample plot i.e., orthogonal plots for a plurality of the samples
- selecting one of the orthogonal plots corresponding to one of the sample for instance, by mouse or cursor selection, may cause the across-sample plot to be replaced on the display by the corresponding profile plot of the selected orthogonal plot corresponding thereto.
- the corresponding profile plot 800 may be displayed on the display 150 concurrently with and adjacent to the across-sample plot (i.e., as in inset or in a designated portion of the display 150 ).
- the analysis method may also comprise concurrently displaying the profile plot and the orthogonal plot of the well-separated ion peak or the ion peak arrangement of at least one of the samples.
- the profile plot may be further deselected, for example, by mouse or cursor selection, which may then cause the profile plot to be removed from the display. The display would thus return to the across-sample plot.
- the across-sample analysis may be implemented in different manners as will be appreciated by one skilled in the art.
- the processor device 130 may further be configured to execute instructions/computer readable program code portions so as to superimpose the profile plots of the selected ion for at least a portion of the samples upon each other so as to form a second across-sample plot (see, e.g., element 900 in FIG. 11 , showing only three superimposed profile plots for the sake of clarity).
- the second across-sample plot 900 may be characterized as viewing the first across-sample plot (i.e., sample indicia versus retention time for the orthogonal plots) from the x-axis (time retention axis) in a direction along the y-axis (sample indicia axis).
- Such a view may provide particular information from the across-sample analysis, for example, whether the characteristic intensity of a particular peak of a particular sample is of a greater than expected magnitude given the relative amount of that ion or ion component in the other samples.
- the processor device 130 may further be configured to execute instructions/computer readable program code portions so as to display the second across-sample plot on a display 150 , for example, by toggling the second across-sample plot with the first across-sample plot having the retention time axis and a sample indicia axis, and including a graphical representation of the orthogonal plots across the plurality of samples, by way of mouse or cursor selection.
- the second across-sample plot may be displayed concurrently with the first across-sample plot, for example, as in inset or in a designated portion of the display, also by way of mouse or cursor selection.
- aspects of the present disclosure also provide methods of analyzing metabolomics data, as shown generally in the operational flow diagram of FIG. 8 , and as previously discussed herein.
- aspects of the present disclosure may also provide associated computer program products for performing the functions/operations/steps disclosed above, in the form of, for example, a computer-readable storage medium (i.e., memory device 140 ) having particular computer-readable program code portions stored therein by the medium that, in response to execution by the processor device 130 , cause the apparatus to at least perform the steps disclosed herein.
- FIG. 8 is an operational flow diagram associated with particular methods, apparatuses and computer program products according to particular aspects of the present disclosure.
- each block or step of the operational flow diagram or combinations of blocks in the operational flow diagram can be implemented by appropriate computer program instructions executed by the processor device 130 .
- These computer program instructions may be loaded onto a computer device or other programmable apparatus for executing the functions specified in the operational flow diagram otherwise associated with the method(s) disclosed herein.
- These computer program instructions may also be stored in a computer-readable memory (i.e., memory device 140 ), so as to be accessible by a computer device or other programmable apparatus in a particular manner, such that the executable instructions stored in the computer-readable memory may produce or facilitate the operation of an article of manufacture capable of directing or otherwise executing the instructions which implement the functions specified in the operational flow diagram otherwise associated with the method(s) disclosed herein.
- the computer program instructions may also be loaded onto a computer device or other programmable apparatus to cause a series of operational steps to be performed on the computer device or other programmable apparatus to produce a computer-implemented process such that the instructions executed by the computer device or other programmable apparatus provide or otherwise direct appropriate steps for implementing the functions/steps specified in the operational flow diagram otherwise associated with the method(s) disclosed herein. It will also be understood that each step of the operational flow diagram, or combinations of steps in the operational flow diagram, can be implemented by special purpose hardware-based computer systems which perform the specified functions or steps, or combinations of special purpose hardware and computer instructions (software).
Abstract
Description
Claims (45)
Priority Applications (1)
| Application Number | Priority Date | Filing Date | Title |
|---|---|---|---|
| US15/315,147 US9892895B2 (en) | 2014-05-30 | 2015-05-28 | Method for analyzing small molecule components of a complex mixture in a multi-sample process, and associated apparatus and computer program product |
Applications Claiming Priority (3)
| Application Number | Priority Date | Filing Date | Title |
|---|---|---|---|
| US201462005596P | 2014-05-30 | 2014-05-30 | |
| US15/315,147 US9892895B2 (en) | 2014-05-30 | 2015-05-28 | Method for analyzing small molecule components of a complex mixture in a multi-sample process, and associated apparatus and computer program product |
| PCT/US2015/032803 WO2015184048A1 (en) | 2014-05-30 | 2015-05-28 | Method for analyzing small molecule components of a complex mixture in a multi-sample process, and associated apparatus and computer program product |
Publications (2)
| Publication Number | Publication Date |
|---|---|
| US20170117122A1 US20170117122A1 (en) | 2017-04-27 |
| US9892895B2 true US9892895B2 (en) | 2018-02-13 |
Family
ID=53404881
Family Applications (1)
| Application Number | Title | Priority Date | Filing Date |
|---|---|---|---|
| US15/315,147 Active US9892895B2 (en) | 2014-05-30 | 2015-05-28 | Method for analyzing small molecule components of a complex mixture in a multi-sample process, and associated apparatus and computer program product |
Country Status (4)
| Country | Link |
|---|---|
| US (1) | US9892895B2 (en) |
| EP (1) | EP3149762A1 (en) |
| JP (1) | JP6538083B2 (en) |
| WO (1) | WO2015184048A1 (en) |
Families Citing this family (1)
| Publication number | Priority date | Publication date | Assignee | Title |
|---|---|---|---|---|
| EP3724654B1 (en) | 2017-12-15 | 2024-04-24 | Metabolon, Inc. | Method for analyzing small molecule components of a complex mixture, and associated apparatus and computer program product |
Citations (8)
| Publication number | Priority date | Publication date | Assignee | Title |
|---|---|---|---|---|
| US5672869A (en) * | 1996-04-03 | 1997-09-30 | Eastman Kodak Company | Noise and background reduction method for component detection in chromatography/spectrometry |
| US20010037178A1 (en) * | 1998-09-15 | 2001-11-01 | Bush Ronald R. | System and method for delineating spatially dependent objects, such as hydrocarbon accumulations from seismic data |
| US20040181345A1 (en) * | 2003-02-05 | 2004-09-16 | Evgueni Kolossov | Processing of chemical analysis data |
| US6873915B2 (en) * | 2001-08-24 | 2005-03-29 | Surromed, Inc. | Peak selection in multidimensional data |
| US7381944B2 (en) * | 2004-04-28 | 2008-06-03 | Sionex Corporation | Systems and methods for ion species analysis with enhanced condition control and data interpretation |
| US7884318B2 (en) * | 2008-01-16 | 2011-02-08 | Metabolon, Inc. | Systems, methods, and computer-readable medium for determining composition of chemical constituents in a complex mixture |
| US8428881B2 (en) * | 2003-12-19 | 2013-04-23 | Metabolon, Inc. | System and methods for non-targeted processing of chromatographic data |
| US20150162175A1 (en) * | 2013-12-11 | 2015-06-11 | Thermo Finnigan Llc | Methods for Isolation and Decomposition of Mass Spectrometric Protein Signatures |
Family Cites Families (12)
| Publication number | Priority date | Publication date | Assignee | Title |
|---|---|---|---|---|
| US7329489B2 (en) | 2000-04-14 | 2008-02-12 | Matabolon, Inc. | Methods for drug discovery, disease treatment, and diagnosis using metabolomics |
| JP2003530130A (en) | 2000-04-14 | 2003-10-14 | メタボロン インコーポレイテッド | Methods for drug discovery, disease treatment and diagnosis using metabolomics |
| EP1886134B1 (en) * | 2005-06-03 | 2017-01-18 | Waters Technologies Corporation | Methods for fractionation-based chemical analyses |
| US8165820B2 (en) * | 2005-06-03 | 2012-04-24 | Waters Technologies Corporation | Methods and apparatus for performing retention-time matching |
| WO2007019485A1 (en) | 2005-08-08 | 2007-02-15 | Metabolon Inc. | A system, method, and computer program product using a database in a computing system to compile and compare metabolomic data obtained from a plurality of samples |
| US7949475B2 (en) | 2005-08-08 | 2011-05-24 | Metabolon Inc. | System and method for analyzing metabolomic data |
| JP5496650B2 (en) | 2006-03-21 | 2014-05-21 | メタボロン インコーポレイテッド | System, method and computer program product for analyzing spectroscopic data to identify and quantify individual elements in a sample |
| WO2007140327A2 (en) * | 2006-05-26 | 2007-12-06 | Waters Investments Limited | Ion detection and parameter estimation for n-dimensional data |
| JP4860575B2 (en) * | 2007-08-28 | 2012-01-25 | 株式会社日立ハイテクノロジーズ | Analysis result display method and display apparatus for chromatography mass spectrometry |
| US8761465B2 (en) * | 2009-03-18 | 2014-06-24 | Microsoft Corporation | Centroid processing |
| WO2011041656A2 (en) * | 2009-10-02 | 2011-04-07 | Metabolon Inc. | Apparatus and associated method for analyzing small molecule components in a complex mixture |
| WO2011058883A1 (en) * | 2009-11-13 | 2011-05-19 | 株式会社日立ハイテクノロジーズ | Liquid chromatography/mass spectrometry device and analysis method using liquid chromatography/mass spectrometry device |
-
2015
- 2015-05-28 EP EP15729638.5A patent/EP3149762A1/en active Pending
- 2015-05-28 WO PCT/US2015/032803 patent/WO2015184048A1/en active Application Filing
- 2015-05-28 JP JP2016569423A patent/JP6538083B2/en active Active
- 2015-05-28 US US15/315,147 patent/US9892895B2/en active Active
Patent Citations (8)
| Publication number | Priority date | Publication date | Assignee | Title |
|---|---|---|---|---|
| US5672869A (en) * | 1996-04-03 | 1997-09-30 | Eastman Kodak Company | Noise and background reduction method for component detection in chromatography/spectrometry |
| US20010037178A1 (en) * | 1998-09-15 | 2001-11-01 | Bush Ronald R. | System and method for delineating spatially dependent objects, such as hydrocarbon accumulations from seismic data |
| US6873915B2 (en) * | 2001-08-24 | 2005-03-29 | Surromed, Inc. | Peak selection in multidimensional data |
| US20040181345A1 (en) * | 2003-02-05 | 2004-09-16 | Evgueni Kolossov | Processing of chemical analysis data |
| US8428881B2 (en) * | 2003-12-19 | 2013-04-23 | Metabolon, Inc. | System and methods for non-targeted processing of chromatographic data |
| US7381944B2 (en) * | 2004-04-28 | 2008-06-03 | Sionex Corporation | Systems and methods for ion species analysis with enhanced condition control and data interpretation |
| US7884318B2 (en) * | 2008-01-16 | 2011-02-08 | Metabolon, Inc. | Systems, methods, and computer-readable medium for determining composition of chemical constituents in a complex mixture |
| US20150162175A1 (en) * | 2013-12-11 | 2015-06-11 | Thermo Finnigan Llc | Methods for Isolation and Decomposition of Mass Spectrometric Protein Signatures |
Also Published As
| Publication number | Publication date |
|---|---|
| US20170117122A1 (en) | 2017-04-27 |
| WO2015184048A1 (en) | 2015-12-03 |
| JP2017517731A (en) | 2017-06-29 |
| JP6538083B2 (en) | 2019-07-03 |
| EP3149762A1 (en) | 2017-04-05 |
Similar Documents
| Publication | Publication Date | Title |
|---|---|---|
| Diggins et al. | Methods for discovery and characterization of cell subsets in high dimensional mass cytometry data | |
| US7949475B2 (en) | System and method for analyzing metabolomic data | |
| Choi et al. | QPROT: Statistical method for testing differential expression using protein-level intensity data in label-free quantitative proteomics | |
| US11315774B2 (en) | Big-data analyzing Method and mass spectrometric system using the same method | |
| JP5496650B2 (en) | System, method and computer program product for analyzing spectroscopic data to identify and quantify individual elements in a sample | |
| JP5348029B2 (en) | Mass spectrometry data processing method and apparatus | |
| JP4602374B2 (en) | Chromatography mass spectrometry method and chromatograph mass spectrometer | |
| US20160216244A1 (en) | Method and electronic nose for comparing odors | |
| DeHaven et al. | Software techniques for enabling high-throughput analysis of metabolomic datasets | |
| Zhang et al. | Elemental metabolomics | |
| CA2618123A1 (en) | A system, method, and computer program product using a database in a computing system to compile and compare metabolomic data obtained from a plurality of samples | |
| JP2016180599A (en) | Data analysis device | |
| CN108369612A (en) | Automate sample quality evaluation | |
| EA011959B1 (en) | Method for determining the impact of a multicomponent natural product mixture on the biological profile of a disease within a group of living systems and the development and quality control of natural product based medicine | |
| US9189595B2 (en) | Apparatus and associated method for analyzing small molecule components in a complex mixture | |
| JP5272822B2 (en) | Data processing device for metabolite analysis | |
| Jansen et al. | FLOOD: FLow cytometric orthogonal orientation for diagnosis | |
| US9892895B2 (en) | Method for analyzing small molecule components of a complex mixture in a multi-sample process, and associated apparatus and computer program product | |
| CN112415208A (en) | Method for evaluating quality of proteomics mass spectrum data | |
| US11387087B2 (en) | Method for analyzing small molecule components of a complex mixture, and associated apparatus and computer program product | |
| JP2013506843A5 (en) | ||
| JP5007326B2 (en) | Chromatography mass spectrometry method and chromatograph mass spectrometer | |
| JP2016176811A (en) | Analytical data analyzer | |
| Shraideh et al. | Requirements for Transferring Value from proteomics Research to Personalized Medicine: Insights from the current Tool Landscape. |
Legal Events
| Date | Code | Title | Description |
|---|---|---|---|
| AS | Assignment |
Owner name: MIDCAP FINANCIAL TRUST, AS AGENT, MARYLAND Free format text: SECURITY INTEREST (REVOLVING);ASSIGNORS:METABOLON, INC.;LACM, INC.;REEL/FRAME:043551/0603 Effective date: 20160613 Owner name: MIDCAP FINANCIAL TRUST, AS AGENT, MARYLAND Free format text: SECURITY INTEREST (TERM);ASSIGNORS:METABOLON, INC.;LACM, INC.;REEL/FRAME:043551/0554 Effective date: 20160613 |
|
| STCF | Information on status: patent grant |
Free format text: PATENTED CASE |
|
| AS | Assignment |
Owner name: LACM, INC., NORTH CAROLINA Free format text: RELEASE BY SECURED PARTY;ASSIGNOR:MIDCAP FUNDING IV TRUST;REEL/FRAME:047247/0568 Effective date: 20180703 Owner name: METABOLON, INC., NORTH CAROLINA Free format text: RELEASE BY SECURED PARTY;ASSIGNOR:MIDCAP FUNDING IV TRUST;REEL/FRAME:047247/0568 Effective date: 20180703 Owner name: METABOLON, INC., NORTH CAROLINA Free format text: RELEASE BY SECURED PARTY;ASSIGNOR:MIDCAP FUNDING IV TRUST;REEL/FRAME:047247/0658 Effective date: 20180703 Owner name: LACM, INC., NORTH CAROLINA Free format text: RELEASE BY SECURED PARTY;ASSIGNOR:MIDCAP FUNDING IV TRUST;REEL/FRAME:047247/0658 Effective date: 20180703 |
|
| AS | Assignment |
Owner name: INNOVATUS LIFE SCIENCES LENDING FUND I, LP, NEW YORK Free format text: SECURITY INTEREST;ASSIGNOR:METABOLON, INC.;REEL/FRAME:052902/0736 Effective date: 20180702 |
|
| AS | Assignment |
Owner name: METABOLON, INC., NORTH CAROLINA Free format text: RELEASE BY SECURED PARTY;ASSIGNOR:MIDCAP FINANCIAL TRUST;REEL/FRAME:053198/0646 Effective date: 20200713 Owner name: LACM, INC., NORTH CAROLINA Free format text: RELEASE BY SECURED PARTY;ASSIGNOR:MIDCAP FINANCIAL TRUST;REEL/FRAME:053198/0646 Effective date: 20200713 |
|
| AS | Assignment |
Owner name: METABOLON, INC., NORTH CAROLINA Free format text: RELEASE BY SECURED PARTY;ASSIGNOR:INNOVATUS LIFE SCIENCES LENDING FUND I, LP;REEL/FRAME:053290/0441 Effective date: 20200722 |
|
| AS | Assignment |
Owner name: PERCEPTIVE CREDIT HOLDINGS III, LP, NEW YORK Free format text: SECURITY AGREEMENT;ASSIGNOR:METABOLON, INC.;REEL/FRAME:053313/0406 Effective date: 20200722 |
|
| MAFP | Maintenance fee payment |
Free format text: PAYMENT OF MAINTENANCE FEE, 4TH YR, SMALL ENTITY (ORIGINAL EVENT CODE: M2551); ENTITY STATUS OF PATENT OWNER: SMALL ENTITY Year of fee payment: 4 |
|
| AS | Assignment |
Owner name: METABOLON, INC., NORTH CAROLINA Free format text: RELEASE BY SECURED PARTY;ASSIGNOR:PERCEPTIVE CREDIT HOLDINGS ILL, LP;REEL/FRAME:066971/0054 Effective date: 20240327 |
|
| AS | Assignment |
Owner name: METABOLON, INC., NORTH CAROLINA Free format text: CORRECTIVE ASSIGNMENT TO CORRECT THE ASSIGNOR'S NAME FROM " PERCEPTIVE CREDIT HOLDINGS ILL, LP" TO "PERCEPTIVE CREDIT HOLDINGS III, LP" PREVIOUSLY RECORDED AT REEL: 66971 FRAME: 0054. ASSIGNOR(S) HEREBY CONFIRMS THE RELEASE OF SECURITY INTEREST;ASSIGNOR:PERCEPTIVE CREDIT HOLDINGS III, LP;REEL/FRAME:067019/0662 Effective date: 20240327 |