US9855894B1 - Apparatus, system and methods for providing real-time sensor feedback and graphically translating sensor confidence data - Google Patents
Apparatus, system and methods for providing real-time sensor feedback and graphically translating sensor confidence data Download PDFInfo
- Publication number
- US9855894B1 US9855894B1 US15/268,402 US201615268402A US9855894B1 US 9855894 B1 US9855894 B1 US 9855894B1 US 201615268402 A US201615268402 A US 201615268402A US 9855894 B1 US9855894 B1 US 9855894B1
- Authority
- US
- United States
- Prior art keywords
- sensor
- confidence value
- sensor data
- sensors
- data
- Prior art date
- Legal status (The legal status is an assumption and is not a legal conclusion. Google has not performed a legal analysis and makes no representation as to the accuracy of the status listed.)
- Active
Links
- 238000000034 method Methods 0.000 title claims abstract description 53
- 238000012545 processing Methods 0.000 claims abstract description 124
- 230000008569 process Effects 0.000 claims abstract description 20
- 230000004927 fusion Effects 0.000 claims description 28
- 238000004364 calculation method Methods 0.000 claims description 7
- 230000001419 dependent effect Effects 0.000 claims 2
- 238000009877 rendering Methods 0.000 description 19
- 238000004891 communication Methods 0.000 description 13
- 239000000872 buffer Substances 0.000 description 10
- 238000005516 engineering process Methods 0.000 description 9
- 230000008859 change Effects 0.000 description 8
- 238000009826 distribution Methods 0.000 description 8
- 230000005540 biological transmission Effects 0.000 description 7
- 238000010586 diagram Methods 0.000 description 7
- 230000003044 adaptive effect Effects 0.000 description 6
- 238000001514 detection method Methods 0.000 description 6
- 230000000694 effects Effects 0.000 description 6
- 230000006870 function Effects 0.000 description 6
- 238000005259 measurement Methods 0.000 description 5
- 238000013459 approach Methods 0.000 description 4
- 239000002245 particle Substances 0.000 description 4
- 238000003860 storage Methods 0.000 description 4
- 230000001133 acceleration Effects 0.000 description 3
- 238000004422 calculation algorithm Methods 0.000 description 3
- 230000002441 reversible effect Effects 0.000 description 3
- 230000004913 activation Effects 0.000 description 2
- 238000007792 addition Methods 0.000 description 2
- 230000001276 controlling effect Effects 0.000 description 2
- 238000001816 cooling Methods 0.000 description 2
- 238000000605 extraction Methods 0.000 description 2
- 238000001914 filtration Methods 0.000 description 2
- 239000000446 fuel Substances 0.000 description 2
- 231100001261 hazardous Toxicity 0.000 description 2
- 238000003384 imaging method Methods 0.000 description 2
- 238000002347 injection Methods 0.000 description 2
- 239000007924 injection Substances 0.000 description 2
- 230000004048 modification Effects 0.000 description 2
- 238000012986 modification Methods 0.000 description 2
- 230000000007 visual effect Effects 0.000 description 2
- 230000009471 action Effects 0.000 description 1
- 238000013528 artificial neural network Methods 0.000 description 1
- 230000003416 augmentation Effects 0.000 description 1
- 230000008901 benefit Effects 0.000 description 1
- 230000003139 buffering effect Effects 0.000 description 1
- 238000005266 casting Methods 0.000 description 1
- 230000003197 catalytic effect Effects 0.000 description 1
- 239000003086 colorant Substances 0.000 description 1
- 238000004590 computer program Methods 0.000 description 1
- 238000012937 correction Methods 0.000 description 1
- 230000002596 correlated effect Effects 0.000 description 1
- 230000009849 deactivation Effects 0.000 description 1
- 230000007812 deficiency Effects 0.000 description 1
- 230000009977 dual effect Effects 0.000 description 1
- 230000007613 environmental effect Effects 0.000 description 1
- 230000004907 flux Effects 0.000 description 1
- 238000007499 fusion processing Methods 0.000 description 1
- 230000010354 integration Effects 0.000 description 1
- 230000003993 interaction Effects 0.000 description 1
- 238000012804 iterative process Methods 0.000 description 1
- 238000011068 loading method Methods 0.000 description 1
- 238000005461 lubrication Methods 0.000 description 1
- 238000010801 machine learning Methods 0.000 description 1
- 238000013507 mapping Methods 0.000 description 1
- 239000003550 marker Substances 0.000 description 1
- 239000011159 matrix material Substances 0.000 description 1
- 230000007246 mechanism Effects 0.000 description 1
- 238000002156 mixing Methods 0.000 description 1
- 230000006855 networking Effects 0.000 description 1
- 230000003287 optical effect Effects 0.000 description 1
- 230000001151 other effect Effects 0.000 description 1
- 230000003647 oxidation Effects 0.000 description 1
- 238000007254 oxidation reaction Methods 0.000 description 1
- 230000002093 peripheral effect Effects 0.000 description 1
- 238000003825 pressing Methods 0.000 description 1
- ZLIBICFPKPWGIZ-UHFFFAOYSA-N pyrimethanil Chemical compound CC1=CC(C)=NC(NC=2C=CC=CC=2)=N1 ZLIBICFPKPWGIZ-UHFFFAOYSA-N 0.000 description 1
- 230000008929 regeneration Effects 0.000 description 1
- 238000011069 regeneration method Methods 0.000 description 1
- 230000035945 sensitivity Effects 0.000 description 1
- 239000007787 solid Substances 0.000 description 1
- 239000000243 solution Substances 0.000 description 1
- 230000001360 synchronised effect Effects 0.000 description 1
- 230000002123 temporal effect Effects 0.000 description 1
- 238000012360 testing method Methods 0.000 description 1
- 230000036962 time dependent Effects 0.000 description 1
Images


Classifications
-
- B—PERFORMING OPERATIONS; TRANSPORTING
- B60—VEHICLES IN GENERAL
- B60R—VEHICLES, VEHICLE FITTINGS, OR VEHICLE PARTS, NOT OTHERWISE PROVIDED FOR
- B60R1/00—Optical viewing arrangements; Real-time viewing arrangements for drivers or passengers using optical image capturing systems, e.g. cameras or video systems specially adapted for use in or on vehicles
-
- B—PERFORMING OPERATIONS; TRANSPORTING
- B60—VEHICLES IN GENERAL
- B60K—ARRANGEMENT OR MOUNTING OF PROPULSION UNITS OR OF TRANSMISSIONS IN VEHICLES; ARRANGEMENT OR MOUNTING OF PLURAL DIVERSE PRIME-MOVERS IN VEHICLES; AUXILIARY DRIVES FOR VEHICLES; INSTRUMENTATION OR DASHBOARDS FOR VEHICLES; ARRANGEMENTS IN CONNECTION WITH COOLING, AIR INTAKE, GAS EXHAUST OR FUEL SUPPLY OF PROPULSION UNITS IN VEHICLES
- B60K35/00—Arrangement of adaptations of instruments
-
- G06K9/00798—
-
- G06K9/00805—
-
- G—PHYSICS
- G06—COMPUTING; CALCULATING OR COUNTING
- G06T—IMAGE DATA PROCESSING OR GENERATION, IN GENERAL
- G06T11/00—2D [Two Dimensional] image generation
- G06T11/001—Texturing; Colouring; Generation of texture or colour
-
- G—PHYSICS
- G06—COMPUTING; CALCULATING OR COUNTING
- G06T—IMAGE DATA PROCESSING OR GENERATION, IN GENERAL
- G06T11/00—2D [Two Dimensional] image generation
- G06T11/60—Editing figures and text; Combining figures or text
-
- G—PHYSICS
- G06—COMPUTING; CALCULATING OR COUNTING
- G06T—IMAGE DATA PROCESSING OR GENERATION, IN GENERAL
- G06T15/00—3D [Three Dimensional] image rendering
- G06T15/08—Volume rendering
-
- G—PHYSICS
- G06—COMPUTING; CALCULATING OR COUNTING
- G06V—IMAGE OR VIDEO RECOGNITION OR UNDERSTANDING
- G06V20/00—Scenes; Scene-specific elements
- G06V20/50—Context or environment of the image
- G06V20/56—Context or environment of the image exterior to a vehicle by using sensors mounted on the vehicle
- G06V20/58—Recognition of moving objects or obstacles, e.g. vehicles or pedestrians; Recognition of traffic objects, e.g. traffic signs, traffic lights or roads
-
- G—PHYSICS
- G06—COMPUTING; CALCULATING OR COUNTING
- G06V—IMAGE OR VIDEO RECOGNITION OR UNDERSTANDING
- G06V20/00—Scenes; Scene-specific elements
- G06V20/50—Context or environment of the image
- G06V20/56—Context or environment of the image exterior to a vehicle by using sensors mounted on the vehicle
- G06V20/588—Recognition of the road, e.g. of lane markings; Recognition of the vehicle driving pattern in relation to the road
-
- B60K2350/106—
-
- B60K2350/1096—
-
- B—PERFORMING OPERATIONS; TRANSPORTING
- B60—VEHICLES IN GENERAL
- B60R—VEHICLES, VEHICLE FITTINGS, OR VEHICLE PARTS, NOT OTHERWISE PROVIDED FOR
- B60R2300/00—Details of viewing arrangements using cameras and displays, specially adapted for use in a vehicle
- B60R2300/80—Details of viewing arrangements using cameras and displays, specially adapted for use in a vehicle characterised by the intended use of the viewing arrangement
- B60R2300/802—Details of viewing arrangements using cameras and displays, specially adapted for use in a vehicle characterised by the intended use of the viewing arrangement for monitoring and displaying vehicle exterior blind spot views
- B60R2300/8026—Details of viewing arrangements using cameras and displays, specially adapted for use in a vehicle characterised by the intended use of the viewing arrangement for monitoring and displaying vehicle exterior blind spot views in addition to a rear-view mirror system
-
- B—PERFORMING OPERATIONS; TRANSPORTING
- B60—VEHICLES IN GENERAL
- B60R—VEHICLES, VEHICLE FITTINGS, OR VEHICLE PARTS, NOT OTHERWISE PROVIDED FOR
- B60R2300/00—Details of viewing arrangements using cameras and displays, specially adapted for use in a vehicle
- B60R2300/80—Details of viewing arrangements using cameras and displays, specially adapted for use in a vehicle characterised by the intended use of the viewing arrangement
- B60R2300/8053—Details of viewing arrangements using cameras and displays, specially adapted for use in a vehicle characterised by the intended use of the viewing arrangement for bad weather conditions or night vision
-
- B—PERFORMING OPERATIONS; TRANSPORTING
- B60—VEHICLES IN GENERAL
- B60R—VEHICLES, VEHICLE FITTINGS, OR VEHICLE PARTS, NOT OTHERWISE PROVIDED FOR
- B60R2300/00—Details of viewing arrangements using cameras and displays, specially adapted for use in a vehicle
- B60R2300/80—Details of viewing arrangements using cameras and displays, specially adapted for use in a vehicle characterised by the intended use of the viewing arrangement
- B60R2300/806—Details of viewing arrangements using cameras and displays, specially adapted for use in a vehicle characterised by the intended use of the viewing arrangement for aiding parking
-
- B—PERFORMING OPERATIONS; TRANSPORTING
- B60—VEHICLES IN GENERAL
- B60R—VEHICLES, VEHICLE FITTINGS, OR VEHICLE PARTS, NOT OTHERWISE PROVIDED FOR
- B60R2300/00—Details of viewing arrangements using cameras and displays, specially adapted for use in a vehicle
- B60R2300/80—Details of viewing arrangements using cameras and displays, specially adapted for use in a vehicle characterised by the intended use of the viewing arrangement
- B60R2300/8093—Details of viewing arrangements using cameras and displays, specially adapted for use in a vehicle characterised by the intended use of the viewing arrangement for obstacle warning
-
- G—PHYSICS
- G06—COMPUTING; CALCULATING OR COUNTING
- G06T—IMAGE DATA PROCESSING OR GENERATION, IN GENERAL
- G06T2215/00—Indexing scheme for image rendering
- G06T2215/16—Using real world measurements to influence rendering
Definitions
- the present disclosure relates to sensor data processing and graphical processing. More specifically, the present disclosure is directed to improving the operation of automotive sensor system and the graphical representation of sensor data on a Human-Machine Interface (HMI).
- HMI Human-Machine Interface
- ADAS Advanced driver assistance systems
- Safety features in vehicles are designed to avoid collisions and accidents by offering technologies that alert the driver to potential problems, or to avoid collisions by implementing safeguards and taking over control of the vehicle.
- Adaptive features may automate lighting, provide adaptive cruise control, automate braking, incorporate GPS/ traffic warnings, connect to smartphones, alert driver to other cars or dangers, keep the driver in the correct lane, or show if vehicles and/or objects are present in blind spots.
- While sensors are known to provide relatively accurate sensor readings (sensor data), there are certain driving conditions (e.g., rain, fog, small road debris, etc.) that may affect the accuracy of certain sensors.
- driving conditions e.g., rain, fog, small road debris, etc.
- ADAS systems As ADAS systems become more prevalent in automobiles, it becomes more important to determine and communicate a confidence level on the accuracy and/or integrity of the sensors during operation. In certain instances, ADAS systems may fail to engage if the sensors are unable to obtain the necessary data. In other instances, ADAS systems may continue to operate when sufficient sensor data is received, but the sensor data is not fully accurate and/or contains certain deficiencies in the data. Accordingly, technologies and techniques are needed to establish a confidence (reliability) factor for sensor data. Furthermore, technologies and techniques are needed to graphically display one or more confidence factors for sensors in a manner that is not distracting and/or overwhelming for the driver/user.
- a system for processing sensor data in a vehicle, comprising one or more sensors configured to provide sensor data relating to at least one of a vehicle operating characteristic and/or a driving environment; a processing apparatus, communicatively coupled to the one or more sensors, wherein the processor is configured to receive data from the one or more sensors; and a display, operatively coupled to the processor, wherein the display is configured to display a scene comprising one or more images associated with the sensor data, wherein the processing apparatus comprises a probability processing module configured to process the sensor data to calculate a sensor confidence value representing an estimated accuracy for at least one of the one or more sensors, and wherein the processing apparatus comprises a graphics processing module configured to process the sensor confidence value to modify the scene on the display to represent the estimated accuracy for the at least one or more of the sensors.
- a method for processing sensor data in a vehicle comprising receiving sensor data from one or more sensors, wherein the sensor data relating to at least one of a vehicle operating characteristic and/or a driving environment; displaying a scene, via a vehicle display, comprising one or more images associated with the sensor data; processing the sensor data, via a processing apparatus comprising a probability processing module, to calculate a sensor confidence value representing an estimated accuracy for at least one of the one or more sensors; and processing the sensor confidence value and modifying the scene on the display via a graphics processing module, based on the processed sensor confidence value, to represent the estimated accuracy for the at least one or more of the sensors.
- a method for processing sensor data in a vehicle comprising receiving sensor data from one or more sensors, wherein the sensor data relating to at least one of a vehicle operating characteristic and/or a driving environment; displaying a scene, via a vehicle display, comprising one or more images associated with the sensor data; processing the sensor data, via a processing apparatus comprising a probability processing module, to calculate a sensor confidence value representing an estimated accuracy for at least one of the one or more sensors; processing the sensor confidence value and modifying the scene on the display via a graphics processing module, based on the processed sensor confidence value, to represent the estimated accuracy for the at least one or more of the sensors; receiving, in the processing apparatus, further data from the one or more sensors; processing, via the processing module, the further sensor data to calculate a new sensor confidence value representing a new estimated accuracy for at least one of the one or more sensors; and further modifying, via the graphics processing module, the scene on the display based on the new sensor confidence value.
- FIG. 1 shows an exemplary vehicle system block diagram showing multiple components and modules, together with a navigation system under an illustrative embodiment
- FIG. 2 shows a vehicle sensor system and configuration for sensing vehicle environment and characteristics and providing sensor data for processing under an illustrative embodiment
- FIG. 3 shows a block diagram for a sensor architecture configured to process sensor data in a vehicle under an illustrative embodiment
- FIG. 4 shows a configuration for performing high-level and/or low level sensor fusion for sensor data under an illustrative embodiment
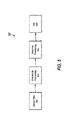
- FIG. 5 shows a block diagram for performing probability processing on sensor data to establish a confidence factor, wherein the confidence factor result may be used for graphical rendering and display under an illustrative embodiment
- FIG. 6 shows a block diagram for graphically processing one or more confidence factor results to providing volumetric texturing to sensor data displayed to a user under an illustrative embodiment
- FIG. 7 shows a process for receiving sensor data, performing sensor data fusion, performing processing to determine sensor confidence data, perform graphical processing on sensor confidence data and rendering and/or modifying graphical images relating to the sensor confidence data on a display under an illustrative embodiment
- FIGS. 8A-8C show different simplified and simulated examples of graphical rendering of a sensor confidence value on a vehicle display under illustrative embodiments.
- first, second, third, etc. may be used herein to describe various elements, components, regions, layers and/or sections, these elements, components, regions, layers and/or sections should not be limited by these terms. These terms may be only used to distinguish one element, component, region, layer or section from another element, component, region, layer or section. Terms such as “first,” “second,” and other numerical terms when used herein do not imply a sequence or order unless clearly indicated by the context. Thus, a first element, component, region, layer or section discussed below could be termed a second element, component, region, layer or section without departing from the teachings of the exemplary embodiments.
- the disclosed embodiments may be implemented, in some cases, in hardware, firmware, software, or any tangibly-embodied combination thereof.
- the disclosed embodiments may also be implemented as instructions carried by or stored on one or more non-transitory machine-readable (e.g., computer-readable) storage medium, which may be read and executed by one or more processors.
- a machine-readable storage medium may be embodied as any storage device, mechanism, or other physical structure for storing or transmitting information in a form readable by a machine (e.g., a volatile or non-volatile memory, a media disc, or other media device).
- a computer program product in accordance with one embodiment comprises a tangible computer usable medium (e.g., standard RAM, an optical disc, a USB drive, or the like) having computer-readable program code embodied therein, wherein the computer-readable program code is adapted to be executed by a processor (working in connection with an operating system) to implement one or more functions and methods as described below.
- a tangible computer usable medium e.g., standard RAM, an optical disc, a USB drive, or the like
- the computer-readable program code is adapted to be executed by a processor (working in connection with an operating system) to implement one or more functions and methods as described below.
- program code may be implemented in any desired language, and may be implemented as machine code, assembly code, byte code, interpretable source code or the like (e.g., via Scalable Language (“Scala”), C, C++, C#, Java, Actionscript, Objective-C, Javascript, CSS, XML, etc.).
- Scala Scalable Language
- C++ C++
- C# Java
- Actionscript Java
- Objective-C Javascript
- CSS XML, etc.
- Engine/transmission module 102 is configured to process and provide vehicle engine and transmission characteristic or parameter data, and may comprise an engine control unit (ECU), and a transmission control.
- ECU engine control unit
- module 102 may provide data relating to fuel injection rate, emission control, NOx control, regeneration of oxidation catalytic converter, turbocharger control, cooling system control, and throttle control, among others.
- module 102 may provide data relating to lambda control, on-board diagnostics, cooling system control, ignition system control, lubrication system control, fuel injection rate control, throttle control, and others.
- Transmission characteristic data may comprise information relating to the transmission system and the shifting of the gears, torque, and use of the clutch.
- an engine control unit and transmission control may exchange messages, sensor signals and control signals for any of gasoline, hybrid and/or electrical engines.
- Global positioning system (GPS) module 103 provides navigation processing and location data for the vehicle 101 .
- the sensors 104 provide sensor data which may comprise data relating to vehicle characteristic and/or parameter data (e.g., from 102 ), and may also provide environmental data pertaining to the vehicle, its interior and/or surroundings, such as temperature, humidity and the like, and may further include LiDAR, radar, image processing, and computer vision.
- Radio/entertainment module 105 may provide data relating to audio/video media being played in vehicle 101 .
- the radio/entertainment module 105 may be integrated and/or communicatively coupled to an entertainment unit configured to play AM/FM radio, satellite radio, compact disks, DVDs, digital media, streaming media and the like.
- Communications module 106 allows any of the modules of system 100 to communicate with each other and/or external devices (e.g., devices 202 - 203 ) via a wired connection (e.g., Controller Area Network (CAN bus), local interconnect network, etc.) or wireless protocol, such as Wi-Fi, Bluetooth, NFC, etc.
- a wired connection e.g., Controller Area Network (CAN bus), local interconnect network, etc.
- wireless protocol such as Wi-Fi, Bluetooth, NFC, etc.
- modules 102 - 106 may be communicatively coupled to bus 112 for certain communication and data exchange purposes.
- Vehicle 101 may further comprise a main processor 107 (also referred to herein as a “processing apparatus”) that centrally processes and controls data communication throughout the system 100 .
- the processor 107 is equipped with advanced driver assistance modules that allow for communication with and control of any of the modules in vehicle 100 .
- Storage 108 may be configured to store data, software, media, files and the like, and may include vehicle data, sensor data and driver profile data, discussed in greater detail below.
- Digital signal processor (DSP) 109 may comprise a processor separate from main processor 107 , or may be integrated within processor 107 .
- DSP 109 may be configured to take signals, such as voice, audio, video, temperature, pressure, position, etc. that have been digitized and then process them as needed.
- Display 110 may be configured to provide visual (as well as audio) indicial from any module in FIG. 1 , and may be a configured as a LCD, LED, OLED, or any other suitable display. The display 110 may also be configured with audio speakers for providing audio output.
- Input/output module 111 is configured to provide data input and outputs to/from other peripheral devices, such as key fobs, device controllers and the like. As discussed above, modules 107 - 111 may be communicatively coupled to data bus 112 for transmitting/receiving data and information from other modules.
- FIG. 2 is an exemplary embodiment of an advanced driver system 200 that includes components of FIG. 1 , where the sensors 104 may include LiDAR, radar, image processing, computer vision, and may also include in-car networking, as well as additional inputs from other sources separate from the primary vehicle platform via communications 106 , such as Vehicle-to-vehicle (V2V), or Vehicle-to-Infrastructure (such as mobile telephony or Wi-Fi data network) communication and systems.
- V2V Vehicle-to-vehicle
- Vehicle-to-Infrastructure such as mobile telephony or Wi-Fi data network
- vehicle 101 may be equipped with surround view ( 202 A, 202 B), that may be configured, under one embodiment, using a camera in the middle of a front grille of the vehicle, dual ultra-wide-angle cameras from the side view mirrors along the flanks on the car, and another positioned above the license plate.
- software may stitch the images together and insert an image of the vehicle in the middle.
- Blind spot detectors 204 A, 204 B may be configured using sensors, such as surround view sensors ( 202 A, 202 B), and/or be equipped with independent sensors that use imaging and/or electromagnetic waves to detect other vehicles and/or objects present in the vehicle's blind spot.
- sensors such as surround view sensors ( 202 A, 202 B)
- independent sensors that use imaging and/or electromagnetic waves to detect other vehicles and/or objects present in the vehicle's blind spot.
- a front portion of the vehicle 101 may be equipped with park assist 206 , cross-traffic alert 208 , traffic sign recognition and lane departure warning 210 , emergency braking/pedestrian detection/collision avoidance 212 (collectively “collision avoidance”) and adaptive cruise control 214 .
- a rear portion of the vehicle 101 may be equipped with park assist 216 , rear collision warning 218 and surround view 220 .
- park assist 206 , as well as rear park assist 216 may utilize the processor/ADS 107 which may be operatively coupled to the vehicle's sensors 104 , that may include sonar, one or more backup cameras and additional forward sensors on the front side fenders.
- the sonar and sensors may be configured on the forward and rear bumpers to detect obstacles, allowing the vehicle to sound warnings and calculate optimum steering angles during regular parking.
- the processor(s) e.g., 107
- the backup camera screen features parking buttons which can be used to activate automated parking procedures.
- the processor e.g., 107
- the cross traffic alert 208 and rear-collision warning 218 may be incorporated as independent modules or configured as part of the blind-spot detection ( 204 A, 204 B).
- Cross traffic alert 208 and rear-collision warning 318 utilize sensors for vehicle detection while in drive ( 208 ) or may activate when the vehicle is in reverse ( 218 ). During operation, they detect vehicles that might be crossing into a forward or rearward path, and, when an oncoming vehicle is detected, the system generates an alert.
- Traffic recognition/lane departure warning module 210 may include a forward-facing camera that may be incorporated with other modules of FIG. 2 , and is configured to scan a road ahead for traffic signs. This camera is connected to character recognition software, which may monitor and process any changes described by the signs, and relaying it onto the car's instrument panel.
- a lane departure module of 210 captures a moving view of the road ahead. The digitized image is parsed for straight or dashed lines (i.e., the lane markings). As the car deviates and approaches or reaches a lane marking, the vehicle issues a warning.
- the lane departure module 210 may incorporate a lane assist feature, where, if a vehicle reaches a lane marking, the vehicle, via assisted steering, may move itself away from the marker. Sometimes the steering change may be effected by braking the opposite front wheel, pivoting the vehicle.
- Collision avoidance module 212 may be configured as a radar (all-weather) and may incorporate laser and camera to detect an imminent collision. Once the detection is processed, the module 212 may provide a warning to the driver when there is an imminent collision, and/or control the vehicle autonomously without any driver input (by braking or steering or both).
- Adaptive cruise control module 214 (or “autonomous cruise control”) may be a laser-based system and/or radar-based system, where the sensors automatically adjust the vehicle speed to maintain a safe distance from vehicles ahead. If configured as a cooperative adaptive cruise control system. the module 214 further extends the automation of navigation by using information gathered from fixed infrastructure such as satellites and roadside beacons, or mobile infrastructure such as reflectors or transmitters on the back of other vehicles.
- the drawing shows a block diagram for a sensor architecture 300 configured to process sensor data in a vehicle (e.g., 101 ) under an illustrative embodiment.
- the sensor architecture may be configured to have a data input portion 322 , a processing portion 324 , and an actuation portion 326 .
- the data input portion 322 may include all information received from the sensors installed in a vehicle, including vehicle communication module 310 , which may include technologies like Vehicle-to-Vehicle (V2V) and Vehicle-to-Infrastructure (V2I) communications that may communicate, or be integrated with, the GPS 103 .
- V2V Vehicle-to-Vehicle
- V2I Vehicle-to-Infrastructure
- the vehicle communication module 310 may receive data/information relating to hazardous situations (e.g., congestions, accidents, obstacles etc.), merging assistance, intersection safety, speed management, and rail crossing operations, among others. Additional data/information may include, but is not limited to, traffic jam notification, prior recognition of potential traffic jams, dynamic traffic light control, dynamic traffic control, and connected navigation. Utilizing V2V technology, the vehicle communication module 310 may receive data/information relating to warnings on entering intersections or departing highways, hazardous location warning (e.g., obstacle discovery, reporting accidents), sudden stop warnings (e.g., forward collision warning, pre-crash sensing or warning) and lane change/keeping warnings/assistance.
- hazardous situations e.g., congestions, accidents, obstacles etc.
- Additional data/information may include, but is not limited to, traffic jam notification, prior recognition of potential traffic jams, dynamic traffic light control, dynamic traffic control, and connected navigation.
- the vehicle communication module 310 may receive data/information relating to warnings on entering intersections or departing highway
- Additional data/information may include, but is not limited to, enhanced route guidance and navigation, intelligent intersections data (e.g., adaptable traffic lights, automated traffic intersection control, green light optimal speed advisory, merging assistance (e.g., entering an on-ramp to a limited access roadway), variable speed limits, pull-over commands and speed measurements.
- intelligent intersections data e.g., adaptable traffic lights, automated traffic intersection control, green light optimal speed advisory, merging assistance (e.g., entering an on-ramp to a limited access roadway), variable speed limits, pull-over commands and speed measurements.
- vehicle communication module 310 In addition to information/data generated from vehicle (e.g., 101 ) data, information/data from other vehicles may be received in vehicle communication module 310 , such as speed, acceleration, distance to preceding vehicle, current time gap, control activation, and so on. All data from vehicle communication module 310 may be included on the CAN bus data structure and communicated to CAN module 308 . The information/data may also include detection and assignment of vehicle position sequence, which may be carried out by the vehicle communication module 310 using the GPS 103 and may utilize Wider Area Augmentation System (WAAS) differential corrections.
- WAAS Wider Area Augmentation System
- Vehicle (e.g., 101 ) information/data is also obtained from the on-board sensors 304 (e.g., 104 ), which may include any of the sensors described herein and/or otherwise known in the art, as well as odometer data, which may include speed and acceleration data.
- Settings module may include flag signals to provide information/data on vehicle and sensor setting, as well as information regarding the interaction of the driver with the driver interface (e.g., activation or deactivation of the system or vehicle setting selection). This may include data from driver interface buttons and inputs associated with the ADAS system, which may include autonomous cruise control (ACC) and/or cooperative adaptive cruise control (CACC) settings and/or control signals.
- Information/data from settings module 302 , sensors 304 and odometer 306 may be communicated to CAN module 308 , wherein the CAN module 308 may be configured to communicate the data to processing portion 324 .
- Processing portion 324 may include an ACC 314 and/or a CACC 316 that may comprise high-level and low-level controllers that are accessible to a driver, and may allow a driver to switch between them during operation to establish a driving mode (e.g., normal mode, eco-driving mode, sport mode, snow mode, etc.), which may be communicated to controller 320 for actuating the mode.
- a driving mode e.g., normal mode, eco-driving mode, sport mode, snow mode, etc.
- a control code may read the CAN bus information from a transmission mode selection button.
- a high level controller e.g., via controller 320
- an ACC controller output may be sent to a low-level controller (e.g., via controller 320 ).
- the CACC controller can be deactivated in the same way as the ACC, either using the driver interface inputs/buttons or pressing the brake pedal.
- the actuation portion 326 may be configured to execute target reference commands from the processing portion 324 .
- the low-level controller may be configured to convert the target speed commands into throttle and brake actions, via the ACC controller.
- raw sensor data may be used for configuring and controlling ADAS systems.
- ADAS system performance may be improved by incorporating sensor fusion to the raw data.
- the signal processing of fusion may advantageously incorporate the refinement of raw sensor data to an abstract context description as well as the actual fusion step.
- sensor data may be fused on a low level of abstraction, high level of abstraction or on multiple levels of abstraction (hybrid approach).
- FIG. 4 a configuration is shown for performing high-level and/or low level sensor fusion system 400 for sensor data under an illustrative embodiment.
- the sensor system 400 may be integrated into the sensors 104 of FIG. 1 , or may be configured as a separate sensor arrangement.
- information/data may be received from one or more sensors S 1 -S n ( 402 - 406 ), and synchronized in synchronization module 408 before being subjected to low-level data fusion in module 410 .
- the output of the low-level data fusion 410 is the subjected to signal processing in signal processing module 422 , which may include, but is not limited to a clustering module 412 , feature extraction module 414 , association module 416 , filter(s) 418 and tracking module 420 .
- the processed low-level data fusion output 424 may be communicated to processor 107 for further processing, which may include graphics processing that is described in greater detail below.
- Each output of synchronization module 408 may also be communicated to respective signal processing modules 426 - 430 , which may be configured similarly as signal processing module 422 .
- the output of each of the signal processing modules 426 - 430 may then be subjected to high-level data fusion in 432 , wherein the output 434 may also be communicated to processor 107 for further processing, which may include graphics processing that is described in greater detail below.
- a common temporal and spatial base of the sensor data should be established through data synchronization prior to data integration.
- the clustering module may assemble groups of data points that are believed to be originating from the same real world entity.
- the data clusters may then be processed and analyzed by the feature extraction module 414 to derive relevant attributes of the clustered entities (e.g. distance, velocity, yaw rate. acceleration, width, height, length, weight, etc.).
- relevant attributes of the clustered entities e.g. distance, velocity, yaw rate. acceleration, width, height, length, weight, etc.
- the association of objects from the last time step with the currently present objects may be performed in association module 416 .
- filter module 418 may execute one or more filter algorithms and may additionally provide state predictions for a next iteration's association step.
- High-level fusion architectures may be configured to integrate context data (e.g., from signal processing 426 - 430 ) based on associated and filtered sensor data whereas low-level fusion architectures may be configured to integrate sensor data (e.g., from signal processing 422 ) at an early stage of signal processing.
- sensor fusion for system 400 may utilize Kalman filtering, or any other suitable algorithm.
- Kalman filtering an iterative process may be performed, where one or more filters may calculate a weighted state update X k of a state prediction X k from a previous iteration, based on an actual measurement Z k and a Kalman gain matrix K k :
- X k X k k +K k ( Z k ⁇ C X k )
- the Kalman gain may be derived from signal covariance values.
- other filter approached, such as particle filters may be employed depending on the application.
- the association of objects from different time steps may be done using greedy approaches (e.g., Nearest Neighbor (NN) and variants), Joint Probabilistic Data Association (JPDA) or Multiple-Hypothesis Testing (MHT). These algorithms may be used to tailor to different computational loads and/or ability to find local (e.g., iterative NN) or global optimal (e.g., JPDA, MHT) applications for sensor data.
- greedy approaches e.g., Nearest Neighbor (NN) and variants
- JPDA Joint Probabilistic Data Association
- MHT Multiple-Hypothesis Testing
- the fusion paradigms used for a sensor system may include, but are not limited to, low-level fusion of raw sensor data (e.g., where near-raw sensor data or sensor data that has been minimally processed), high-level fusion of sensor data (e.g., sensor data processed independently to a high level of abstraction) and hybrid fusion of sensor data, which may include multiple levels of abstraction.
- the fusion system 400 may be incorporated as a separate vehicle system (e.g., 100 ) component, or may be incorporated within a vehicle's processing system (e.g., 107 )
- sensor data 502 may be raw sensor data, and/or processed sensor data (e.g., fused sensor data via 400 ).
- the sensor data 502 may be subjected to probability processing via module 504 , where a processor (e.g., 107 ) may determine a confidence value for individual sensors, and/or a confidence value for a collective group of sensors.
- the probability processing may be incorporated as part of the fusion process (e.g., 400 ).
- confidence values may be assigned to each sensor measurement.
- probability processing module 504 may process the individual behavior of each sensor, and/or the collective behavior of groups of related sensors.
- a history of measurements from each sensor e.g., S 1 -S n ( 402 - 406 )
- Individual confidence values for each sensor may be calculated from the estimations utilizing a t-norm (e.g., the minimum). The obtained value may be interpreted as the normality of the sensor individual behavior.
- the sensor data may be received and processed for a predetermined amount of time in order to establish an initial determination of possibility distributions. Once the initial distribution is determined, a new possibility distribution may be calculated over another predetermined period of time in parallel with the assignment of confidence values.
- Such a configuration may advantageously result in a possibility distribution that is continuously evolving from the initial state to a state that is closer to a current sensor behavior.
- the probability module 504 of the system 500 may distinguish between sensors independently measuring the same physical variable or several sensors measuring simultaneously several numerically related physical variables.
- the probability module 504 may be configured with an expert system including a knowledge base and inference engine, where expert knowledge about the collective behavior of the sensors may be expressed in terms of probabilistic rules that may monitor sensor behavior. If the same physical variable is being monitored, the rules may determine a grade of coincidence in the values and the evolution of the values. If different related variables are being measured, the rules may reflect the agreement of the variables evolution with their relationships, and several collective confidence values may be determined from the rules by means of logical inference. In one example, pairwise confidence values may be obtained to each measurement. In another example, one collective confidence value may be assigned to each sensor.
- individual confidence values and one or more collective confidence values may be fused into a final confidence value using a suitable function, such as ⁇ square root over (w 1 ⁇ 1 2 +w 2 ⁇ 2 2 + . . . +w n ⁇ n 2 ) ⁇
- ⁇ i are the confidence values obtained
- the weights may accordingly be determined with the expert knowledge about the characteristics of the sensors (e.g., precision, sensitivity, expected reliability, etc.). The closer to 1 the confidence values are, the closer to 1 the final confidence value. Accordingly, it makes it easier to tune the impact of each confidence value in the final fusion, and the function presents in practice smoother changes than a linearly weighted average.
- one or more confidence values generated in module 504 may be used as a basis to perform graphical processing in module 506 for display on a display screen on a human-machine interface (HMI) 508 .
- the confidence value may be used as a basis for rendering and/or modifying images on an HMI having a display including, but not limited to, instrument clusters, digital instrument panels, heads-up displays, navigation displays, entertainment module displays, and the like.
- the confidence value may be transformed via graphics processing to convert one or more color characteristic in the display alone or in combination, including, but not limited to, hue (color), saturation (or “chroma”, which determines the intensity or purity of a hue), lightness (i.e., the relative degree of black or white mixed with a given hue) and temperature (i.e., the perceived warmth or coolness of a color).
- hue color
- saturation or “chroma”, which determines the intensity or purity of a hue
- lightness i.e., the relative degree of black or white mixed with a given hue
- temperature i.e., the perceived warmth or coolness of a color
- the HMI should be configured to support two-dimensional and three-dimensional graphics and animation, and may include a physics engine, particle effects, blending and colorization.
- Illustrative models include display systems based on NVidia DriveTM CX, and Visteon LightscapeTM D3.2 platforms, among others.
- each confidence value is used by graphics processing module 506 to generate a graphical image, modification, and/or effect on the display of the HMI 508 .
- an instrument cluster may display an image of a vehicle detected by one or more sensors.
- these values may represent sensor accuracy confidence that is less than 100%.
- graphics processing module may, in one example, change the hue of the displayed vehicle image (e.g., from blue to red) in real time to represent a decrease in sensor confidence. The changes to the image may be incremental or gradual, depending on the application.
- a graphical symbol may be displayed concurrently with the displayed image, indicating a numerical sensor confidence value (e.g., 0-100%).
- the graphics processing module may change the graphical symbol (e.g., hue) concurrently with the image during display.
- the ability to graphically represent the sensor confidence to the driver advantageously provides real-time feedback to the driver, which allows a driver to make more informed decisions regarding sensor information and therefore provide for a more robust and more safe driving experience.
- the operation and feedback capabilities of sensor systems in a vehicle setting are improved.
- sensor data may be processed to generate volumetric imaging overlays onto an HMI display to indicate sensor confidence.
- confidence values may be used as an input to generate additional volumetric light and/or volumetric objects of varying transparencies relative to the object (e.g., vehicle image) normally displayed on the HMI screen.
- volumetric textures such as a “volumetric fog” over the one or more display images, which may advantageously provide an intuitive display of sensor confidence for a driver without overly cluttering the display and/or provide distracting additions to a driver's console.
- the graphics processing module 506 may define a texture (e.g. fog) having an initial density that may be fixed, which assumes that incoming light at each particle is constant, and that each particle of texture emits the same amount of light, and in all directions. Under these assumptions, the amount of contributing light may be equal to the area of fog between a pinhole (using a pinhole camera model in this example) and the point in the screen.
- a texture e.g. fog
- the amount of contributing light may be equal to the area of fog between a pinhole (using a pinhole camera model in this example) and the point in the screen.
- a simplified texture (fog) model may be calculated for each color channel using an intensity of pixel (1 ⁇ L x *A x )*(I r )+L e *A e *I f , where L s represents the amount of light absorbed by the fog, A s represents an area of fog absorbing light, I r represents the intensity of light coming from the scene, L e represents the amount of light emitted by the fog, A e represents the area of fog emitting light and I f represents the intensity of the light coming from the fog.
- a pixel changes to the fog color may be proportional to the amount of fog between the camera and the pixel.
- a standard depth fog may use the Z (or w) value as the density of fog under a simplified illustrative embodiment.
- the fog would create an omnipresent fog. at all points in a scene on a HMI display.
- a polygonal hull may be modeled by graphics processing module 506 to represent the fog and to compute the area of fog for each pixel rendered on the scene.
- the shaft of fog along a ray (e.g., measured from the camera, through the fog, and to the object) can be closely approximated subtracting the w depth a ray enters a fog volume from the w depth of the point it leaves the for volume, and multiplying by some constant.
- this may be processed by applying a form of Stoke's theorem, where all but 2 of the terms cancel, since the flux may be considered constant in the interior of the fog.
- Finding the point(s) where a ray enters a fog volume may be computed by rendering the fog volume and reading the w value.
- Finding the ray on the other side of the fog volume may be determined by culling away polygons not facing the camera. However, any surface not facing the camera would be the backside of the fog volume, the inside of a fog volume may be rendered by reversing the culling order and drawing the fog again.
- a buffer e.g., via graphic processing module 506 ) containing the front side w values of the fog volume may be subtracted from the buffer containing the back side w values of the fog.
- w pixel operations may be performed using a vertex shader or other suitable module, where the w may be encoded into the alpha channel, thereby loading the w depth of every pixel into the alpha channel of the render target. After the subtraction, the remaining w value represents the amount of fog at that pixel.
- the graphics processing module 506 may first clear the buffer and render the scene into an off-screen buffer (A), encoding each pixel's w depth as its alpha value (Z buffering enabled). The backside of the fog may be rendered into the off-screen buffer (A), where each pixel's w depth is encoded.
- the scene may be rendered into another off-screen buffer (B) (or copied from buffer A), using the w depth alpha encoding, where the front side of the fog volume may be rendered into off-screen buffer B with w alpha encoding. Since the fog volume should be in front of parts of the object that are obscured by fog, it will replace them at those pixels. Finally, the two buffers (A, B) may be subtracted in screen space using the alpha value to blend on a fog mask.
- FIG. 6 shows a block system 600 diagram for graphically processing one or more confidence factor results to providing volumetric texturing to sensor data displayed to a user under an illustrative embodiment.
- System 600 may be incorporated as part of graphics processing module 506 , or may be configured as a separate processing entity.
- system 600 includes a density estimation module 602 and density texture module 604 to generate volumetric data.
- Density estimation module 506 estimates a density for volumetric fog, where a density calculation may be based on one or more octaves of Perlin noise that may be optionally animated, and subjected to vertical media density attenuation.
- a scattering coefficient may be stored in an alpha channel of a volume texture buffer/database that may be part of a density texture module 604 .
- Lighting calculation module 608 and lighting texture module 610 is optional, but may be advantageous for providing lighting and shadowing effects on volumetric fog.
- Lighting calculation module 608 may accumulate lighting effects from a main light, a constant ambient term and multiple dynamic point lights intersecting with a view frustum to achieve a desired atmospheric lighting effect. Technologies such as exponential shadow maps may be also used to achieve shadowing from the main light.
- Lighting information may be modulated by density in an RGB channel of volumetric texturing in lighting texture module 610 .
- the outputs of modules 602 - 604 and 608 - 610 may be provided to raymarching module 608 that performs a volume ray casting using a form of ray tracing in which imaginary light rays are computed where they intersect with solid parts of an object/fog model, and are also sampled and modified as they pass through space.
- raymarching module 608 that performs a volume ray casting using a form of ray tracing in which imaginary light rays are computed where they intersect with solid parts of an object/fog model, and are also sampled and modified as they pass through space.
- 2-D raymarching may be performed on the volume and the result may be stored in volume slices.
- the textures may be aligned with the camera frustum, where frustum to cuboid direct mapping may be performed using normalized coordinates (e.g., width ⁇ height axis), where exponential depth distribution may be performed for depth slices.
- the data may be configured to be applied on a HMI display image either in a forward manner (e.g., directly when drawing objects) or a deferred manner (e.g., as full screen quad pass).
- Final application may occur via a bilinear look-up from a 3D texture, and application of a fused multiply-add operation.
- Shading module 616 may comprise a compute shader that accumulates in-scattered light and fog density at every step to generate a volumetric texture with information at every texel including amounts of light in-scattered from a camera to a given 3D point, and how much density of participating media was accumulated, which also describes an amount of out-scattered incoming light.
- FIG. 7 shows a process for receiving sensor data, performing sensor data fusion, performing processing to determine sensor confidence data, perform graphical processing on sensor confidence data and rendering and/or modifying graphical images relating to the sensor confidence data on a display under an illustrative embodiment.
- a vehicle processing apparatus e.g., processor 107
- the processor which may include graphics processing module 506 , performs processing to determine sensor confidence data, and, based at least in part on the sensor confidence data, perform graphical processing on sensor confidence data using any of the techniques described herein.
- the processor may render/modify graphical images onto the HMI driver display.
- FIGS. 8A-8C illustrate different examples of graphical rendering of a sensor confidence value on a vehicle display (e.g., 110 ) under illustrative embodiments.
- the display includes a display scene 800 that includes one or more objects, where one object of interest is a scooter 802 .
- the scene 800 may be provided by one or more cameras and may include data from one or more vehicle sensors.
- the sensor confidence value is shown as being relatively high, which results in the rendering of a volumetric fog 804 A that is relatively transparent and not dense, indicating to the driver that the sensor confidence is relatively high.
- FIG. 8A illustrate different examples of graphical rendering of a sensor confidence value on a vehicle display (e.g., 110 ) under illustrative embodiments.
- the display includes a display scene 800 that includes one or more objects, where one object of interest is a scooter 802 .
- the scene 800 may be provided by one or more cameras and may include data from one or more vehicle sensors.
- the sensor confidence value is shown as being relatively high,
- the sensor confidence value is shown as being somewhat high, which results in the rendering of a volumetric fog 804 B that has a higher density indicating to the driver that the sensor confidence is somewhat high, but not optimal.
- the sensor confidence value is shown as being relatively low, which results in the rendering of a volumetric fog 804 C that is relatively dense, indicating to the driver that the sensor confidence is relatively low.
- the present disclosure provides a plurality of embodiments demonstrating the effectiveness of sensor processing to allow a vehicle system to provide near real-time feedback of sensor confidence data to a driver, and graphically process the sensor confidence value so that it is presented to the driver in a new and intuitive way.
- vehicle instrument clusters develop, presenting the diver with a visual “picture” of lanes, and other vehicles on the roads becomes useful, particularly while an autonomous system is engaged.
- a driver may use this information to decide if the autonomous system should be engaged or disengaged.
- sensor confidence data is not presented on an HMI because of the sheer number of sensors involved, and the ability of a driver to quickly and safely glance at the display to determine sensor confidence.
- Collecting all the sensor confidence factors from sensors e.g., LiDAR, radar, cameras, etc.
- a probability density calculation can produce a single global sensor confidence value that can be used as an input to render fog density over a scene enables the driver to quickly and intuitively determine an accurate level of sensor confidence.
- Graphics processing e.g., 506
- the sensor confidence values may change in real time as driving conditions change and the information should be presented in a manner that a quick glance (even in autonomous driving mode) can give a good representation of sensor confidence to the driver.
- sensor confidence values may be calculated at fixed intervals with a special weight associated to each that can change in real time, depending on the sensor. For example, a LiDAR value is typically not affected by lighting or weather conditions as much as camera sensors are. To compensate for this, a global average may be used.
- the sensor inputs may be used for a probability density function over a fixed spatial area (e.g., mobileye field of view).
- an inverse density function may be used for fog rendering, where high density fog (e.g., 804 C) represents a low confidence, while low density fog (e.g., 804 A) may represent a high confidence that can be evaluated quickly at a glance by the driver.
- colors may be introduced to the fog uniformly or at different regions to represent additional information, such as sensor type.
Abstract
Description
The Kalman gain may be derived from signal covariance values. Of course, other filter approached, such as particle filters, may be employed depending on the application. The association of objects from different time steps may be done using greedy approaches (e.g., Nearest Neighbor (NN) and variants), Joint Probabilistic Data Association (JPDA) or Multiple-Hypothesis Testing (MHT). These algorithms may be used to tailor to different computational loads and/or ability to find local (e.g., iterative NN) or global optimal (e.g., JPDA, MHT) applications for sensor data.
√{square root over (w1α1 2+w2α2 2+ . . . +wnαn 2)}
Claims (17)
Priority Applications (1)
| Application Number | Priority Date | Filing Date | Title |
|---|---|---|---|
| US15/268,402 US9855894B1 (en) | 2016-09-16 | 2016-09-16 | Apparatus, system and methods for providing real-time sensor feedback and graphically translating sensor confidence data |
Applications Claiming Priority (1)
| Application Number | Priority Date | Filing Date | Title |
|---|---|---|---|
| US15/268,402 US9855894B1 (en) | 2016-09-16 | 2016-09-16 | Apparatus, system and methods for providing real-time sensor feedback and graphically translating sensor confidence data |
Publications (1)
| Publication Number | Publication Date |
|---|---|
| US9855894B1 true US9855894B1 (en) | 2018-01-02 |
Family
ID=60805397
Family Applications (1)
| Application Number | Title | Priority Date | Filing Date |
|---|---|---|---|
| US15/268,402 Active US9855894B1 (en) | 2016-09-16 | 2016-09-16 | Apparatus, system and methods for providing real-time sensor feedback and graphically translating sensor confidence data |
Country Status (1)
| Country | Link |
|---|---|
| US (1) | US9855894B1 (en) |
Cited By (21)
| Publication number | Priority date | Publication date | Assignee | Title |
|---|---|---|---|---|
| US20180159647A1 (en) * | 2016-12-02 | 2018-06-07 | Texas Instruments Incorporated | Synchronizing Vehicle Devices over a Controller Area Network |
| US20180281849A1 (en) * | 2017-03-31 | 2018-10-04 | Toyota Jidosha Kabushiki Kaisha | Steering control apparatus |
| US10137836B2 (en) * | 2015-06-17 | 2018-11-27 | Geo Semiconductor Inc. | Vehicle vision system |
| US20180349785A1 (en) * | 2017-06-06 | 2018-12-06 | PlusAI Corp | Method and system for on-the-fly object labeling via cross temporal validation in autonomous driving vehicles |
| US10222796B2 (en) * | 2016-04-28 | 2019-03-05 | Toyota Jidosha Kabushiki Kaisha | Autonomous driving control apparatus |
| US20190188499A1 (en) * | 2017-12-14 | 2019-06-20 | Toyota Research Institute, Inc. | Proving hypotheses for a vehicle using optimal experiment design |
| US20190276041A1 (en) * | 2018-03-06 | 2019-09-12 | Industry-Academic Cooperation Foundation, Dankook University | Apparatus and method for fault diagnosis and back-up of advanced driver assistance system sensors based on deep learning |
| US20200167942A1 (en) * | 2018-11-27 | 2020-05-28 | Infineon Technologies Ag | Filtering Continous-Wave Time-of-Flight Measurements, Based on Coded Modulation Images |
| US20200172135A1 (en) * | 2017-08-10 | 2020-06-04 | Siemens Mobility GmbH | Sensor-controlled adjustment of odometric measurement parameters to weather conditions |
| CZ308605B6 (en) * | 2018-10-01 | 2020-12-30 | Roboauto s.r.o. | Sensory system with fast group fusion to obtain a model of objects in its vicinity |
| US10997491B2 (en) * | 2017-10-04 | 2021-05-04 | Huawei Technologies Co., Ltd. | Method of prediction of a state of an object in the environment using an action model of a neural network |
| CN113177428A (en) * | 2020-01-27 | 2021-07-27 | 通用汽车环球科技运作有限责任公司 | Real-time active object fusion for object tracking |
| US20210390284A1 (en) * | 2020-06-11 | 2021-12-16 | Cnh Industrial America Llc | System and method for identifying objects present within a field across which an agricultural vehicle is traveling |
| US20210389466A1 (en) * | 2020-06-16 | 2021-12-16 | Toyota Research Institute, Inc. | Sensor placement to reduce blind spots |
| WO2022063900A1 (en) * | 2020-09-23 | 2022-03-31 | Robert Bosch Gmbh | Method for fusing environment-related parameters |
| US11335085B2 (en) * | 2019-07-05 | 2022-05-17 | Hyundai Motor Company | Advanced driver assistance system, vehicle having the same and method for controlling the vehicle |
| US11392133B2 (en) | 2017-06-06 | 2022-07-19 | Plusai, Inc. | Method and system for object centric stereo in autonomous driving vehicles |
| US11524695B2 (en) * | 2019-01-23 | 2022-12-13 | Motional Ad Llc | Interface for harmonizing performance of different autonomous vehicles in a fleet |
| US11550334B2 (en) | 2017-06-06 | 2023-01-10 | Plusai, Inc. | Method and system for integrated global and distributed learning in autonomous driving vehicles |
| US11661059B2 (en) * | 2019-05-06 | 2023-05-30 | Easymile | Method and system for modifying the speed of a vehicle depending on the validation of its calculated localization field |
| US11842642B2 (en) * | 2018-06-20 | 2023-12-12 | Cavh Llc | Connected automated vehicle highway systems and methods related to heavy vehicles |
Citations (4)
| Publication number | Priority date | Publication date | Assignee | Title |
|---|---|---|---|---|
| US20090204289A1 (en) * | 2005-09-27 | 2009-08-13 | Klaus Lehre | Method and Device for Controlling at Least One Object Detection Sensor |
| US20140222277A1 (en) * | 2013-02-06 | 2014-08-07 | GM Global Technology Operations LLC | Display systems and methods for autonomous vehicles |
| US20150112571A1 (en) * | 2013-10-22 | 2015-04-23 | Honda Research Institute Europe Gmbh | Composite confidence estimation for predictive driver assistant systems |
| US9489635B1 (en) * | 2012-11-01 | 2016-11-08 | Google Inc. | Methods and systems for vehicle perception feedback to classify data representative of types of objects and to request feedback regarding such classifications |
-
2016
- 2016-09-16 US US15/268,402 patent/US9855894B1/en active Active
Patent Citations (4)
| Publication number | Priority date | Publication date | Assignee | Title |
|---|---|---|---|---|
| US20090204289A1 (en) * | 2005-09-27 | 2009-08-13 | Klaus Lehre | Method and Device for Controlling at Least One Object Detection Sensor |
| US9489635B1 (en) * | 2012-11-01 | 2016-11-08 | Google Inc. | Methods and systems for vehicle perception feedback to classify data representative of types of objects and to request feedback regarding such classifications |
| US20140222277A1 (en) * | 2013-02-06 | 2014-08-07 | GM Global Technology Operations LLC | Display systems and methods for autonomous vehicles |
| US20150112571A1 (en) * | 2013-10-22 | 2015-04-23 | Honda Research Institute Europe Gmbh | Composite confidence estimation for predictive driver assistant systems |
Cited By (35)
| Publication number | Priority date | Publication date | Assignee | Title |
|---|---|---|---|---|
| US10137836B2 (en) * | 2015-06-17 | 2018-11-27 | Geo Semiconductor Inc. | Vehicle vision system |
| US10222796B2 (en) * | 2016-04-28 | 2019-03-05 | Toyota Jidosha Kabushiki Kaisha | Autonomous driving control apparatus |
| US20180159647A1 (en) * | 2016-12-02 | 2018-06-07 | Texas Instruments Incorporated | Synchronizing Vehicle Devices over a Controller Area Network |
| US11588567B2 (en) * | 2016-12-02 | 2023-02-21 | Texas Instruments Incorporated | Synchronizing vehicle devices over a controller area network |
| US20180281849A1 (en) * | 2017-03-31 | 2018-10-04 | Toyota Jidosha Kabushiki Kaisha | Steering control apparatus |
| US11794807B2 (en) | 2017-03-31 | 2023-10-24 | Toyota Jidosha Kabushiki Kaisha | Steering control apparatus |
| US11027777B2 (en) * | 2017-03-31 | 2021-06-08 | Toyota Jidosha Kabushiki Kaisha | Steering control apparatus |
| US20180349784A1 (en) * | 2017-06-06 | 2018-12-06 | PlusAI Corp | Method and system for on-the-fly object labeling via cross modality validation in autonomous driving vehicles |
| US11550334B2 (en) | 2017-06-06 | 2023-01-10 | Plusai, Inc. | Method and system for integrated global and distributed learning in autonomous driving vehicles |
| US11435750B2 (en) | 2017-06-06 | 2022-09-06 | Plusai, Inc. | Method and system for object centric stereo via cross modality validation in autonomous driving vehicles |
| US11392133B2 (en) | 2017-06-06 | 2022-07-19 | Plusai, Inc. | Method and system for object centric stereo in autonomous driving vehicles |
| US11573573B2 (en) | 2017-06-06 | 2023-02-07 | Plusai, Inc. | Method and system for distributed learning and adaptation in autonomous driving vehicles |
| US11537126B2 (en) * | 2017-06-06 | 2022-12-27 | Plusai, Inc. | Method and system for on-the-fly object labeling via cross modality validation in autonomous driving vehicles |
| US11042155B2 (en) * | 2017-06-06 | 2021-06-22 | Plusai Limited | Method and system for closed loop perception in autonomous driving vehicles |
| US11790551B2 (en) | 2017-06-06 | 2023-10-17 | Plusai, Inc. | Method and system for object centric stereo in autonomous driving vehicles |
| US20180349785A1 (en) * | 2017-06-06 | 2018-12-06 | PlusAI Corp | Method and system for on-the-fly object labeling via cross temporal validation in autonomous driving vehicles |
| US20200172135A1 (en) * | 2017-08-10 | 2020-06-04 | Siemens Mobility GmbH | Sensor-controlled adjustment of odometric measurement parameters to weather conditions |
| US10997491B2 (en) * | 2017-10-04 | 2021-05-04 | Huawei Technologies Co., Ltd. | Method of prediction of a state of an object in the environment using an action model of a neural network |
| US20190188499A1 (en) * | 2017-12-14 | 2019-06-20 | Toyota Research Institute, Inc. | Proving hypotheses for a vehicle using optimal experiment design |
| US10546202B2 (en) * | 2017-12-14 | 2020-01-28 | Toyota Research Institute, Inc. | Proving hypotheses for a vehicle using optimal experiment design |
| US10946864B2 (en) * | 2018-03-06 | 2021-03-16 | Industry-Academic Cooperation Foundation, Dankook University | Apparatus and method for fault diagnosis and back-up of advanced driver assistance system sensors based on deep learning |
| US20190276041A1 (en) * | 2018-03-06 | 2019-09-12 | Industry-Academic Cooperation Foundation, Dankook University | Apparatus and method for fault diagnosis and back-up of advanced driver assistance system sensors based on deep learning |
| US11842642B2 (en) * | 2018-06-20 | 2023-12-12 | Cavh Llc | Connected automated vehicle highway systems and methods related to heavy vehicles |
| CZ308605B6 (en) * | 2018-10-01 | 2020-12-30 | Roboauto s.r.o. | Sensory system with fast group fusion to obtain a model of objects in its vicinity |
| US11393115B2 (en) * | 2018-11-27 | 2022-07-19 | Infineon Technologies Ag | Filtering continuous-wave time-of-flight measurements, based on coded modulation images |
| US20200167942A1 (en) * | 2018-11-27 | 2020-05-28 | Infineon Technologies Ag | Filtering Continous-Wave Time-of-Flight Measurements, Based on Coded Modulation Images |
| US11524695B2 (en) * | 2019-01-23 | 2022-12-13 | Motional Ad Llc | Interface for harmonizing performance of different autonomous vehicles in a fleet |
| US11661059B2 (en) * | 2019-05-06 | 2023-05-30 | Easymile | Method and system for modifying the speed of a vehicle depending on the validation of its calculated localization field |
| US11335085B2 (en) * | 2019-07-05 | 2022-05-17 | Hyundai Motor Company | Advanced driver assistance system, vehicle having the same and method for controlling the vehicle |
| CN113177428A (en) * | 2020-01-27 | 2021-07-27 | 通用汽车环球科技运作有限责任公司 | Real-time active object fusion for object tracking |
| US20210390284A1 (en) * | 2020-06-11 | 2021-12-16 | Cnh Industrial America Llc | System and method for identifying objects present within a field across which an agricultural vehicle is traveling |
| US11531114B2 (en) * | 2020-06-16 | 2022-12-20 | Toyota Research Institute, Inc. | Sensor placement to reduce blind spots |
| US11762097B2 (en) * | 2020-06-16 | 2023-09-19 | Toyota Research Institute, Inc. | Sensor placement to reduce blind spots |
| US20210389466A1 (en) * | 2020-06-16 | 2021-12-16 | Toyota Research Institute, Inc. | Sensor placement to reduce blind spots |
| WO2022063900A1 (en) * | 2020-09-23 | 2022-03-31 | Robert Bosch Gmbh | Method for fusing environment-related parameters |
Similar Documents
| Publication | Publication Date | Title |
|---|---|---|
| US9855894B1 (en) | Apparatus, system and methods for providing real-time sensor feedback and graphically translating sensor confidence data | |
| KR102201290B1 (en) | Vehicle display device and vehicle | |
| US20170334455A1 (en) | Vehicle control system, vehicle control method and vehicle control program | |
| US9507345B2 (en) | Vehicle control system and method | |
| US20180272934A1 (en) | Information presentation system | |
| US10452930B2 (en) | Information display device mounted in vehicle including detector | |
| US9063548B1 (en) | Use of previous detections for lane marker detection | |
| CN111918053A (en) | Vehicle image verification | |
| US11042758B2 (en) | Vehicle image generation | |
| CN110789533B (en) | Data presentation method and terminal equipment | |
| WO2020079698A1 (en) | Adas systems functionality testing | |
| CN112512887B (en) | Driving decision selection method and device | |
| JP2020053046A (en) | Driver assistance system and method for displaying traffic information | |
| EP3825958B1 (en) | A new way to generate tight 2d bounding boxes for autonomous driving labeling | |
| US20220073104A1 (en) | Traffic accident management device and traffic accident management method | |
| CN116674557B (en) | Vehicle autonomous lane change dynamic programming method and device and domain controller | |
| CN113126294B (en) | Multi-layer imaging system | |
| CN112987053A (en) | Method and apparatus for monitoring yaw sensor | |
| WO2023061363A1 (en) | Systems and methods for prediction-based driver assistance | |
| CN116572837A (en) | Information display control method and device, electronic equipment and storage medium | |
| JP6781035B2 (en) | Imaging equipment, image processing equipment, display systems, and vehicles | |
| KR20240026449A (en) | Route guidance device and route guidance system based on augmented reality and mixed reality | |
| CN114842455A (en) | Obstacle detection method, device, equipment, medium, chip and vehicle | |
| CN114862931A (en) | Depth distance determination method and device, vehicle, storage medium and chip | |
| CN116653965B (en) | Vehicle lane change re-planning triggering method and device and domain controller |
Legal Events
| Date | Code | Title | Description |
|---|---|---|---|
| AS | Assignment |
Owner name: AUDI AG, GERMANY Free format text: ASSIGNMENT OF ASSIGNORS INTEREST;ASSIGNOR:KHORASANI, ALLEN;REEL/FRAME:039784/0601 Effective date: 20160914 Owner name: PORSCHE AG, GERMANY Free format text: ASSIGNMENT OF ASSIGNORS INTEREST;ASSIGNOR:KHORASANI, ALLEN;REEL/FRAME:039784/0601 Effective date: 20160914 Owner name: VOLKSWAGEN AKTIENGESELLSCHAFT, GERMANY Free format text: ASSIGNMENT OF ASSIGNORS INTEREST;ASSIGNOR:KHORASANI, ALLEN;REEL/FRAME:039784/0601 Effective date: 20160914 |
|
| AS | Assignment |
Owner name: AUDI AG, GERMANY Free format text: CORRECTIVE ASSIGNMENT TO CORRECT THE 3RD ASSIGNEE NAME PREVIOUSLY RECORDED AT REEL: 039784 FRAME: 0601. ASSIGNOR(S) HEREBY CONFIRMS THE ASSIGNMENT;ASSIGNOR:KHORASANI, ALLEN;REEL/FRAME:040129/0304 Effective date: 20160914 Owner name: DR. ING. H.C. F. PORSCHE AG, GERMANY Free format text: CORRECTIVE ASSIGNMENT TO CORRECT THE 3RD ASSIGNEE NAME PREVIOUSLY RECORDED AT REEL: 039784 FRAME: 0601. ASSIGNOR(S) HEREBY CONFIRMS THE ASSIGNMENT;ASSIGNOR:KHORASANI, ALLEN;REEL/FRAME:040129/0304 Effective date: 20160914 Owner name: VOLKSWAGEN AKTIENGESELLSCHAFT, GERMANY Free format text: CORRECTIVE ASSIGNMENT TO CORRECT THE 3RD ASSIGNEE NAME PREVIOUSLY RECORDED AT REEL: 039784 FRAME: 0601. ASSIGNOR(S) HEREBY CONFIRMS THE ASSIGNMENT;ASSIGNOR:KHORASANI, ALLEN;REEL/FRAME:040129/0304 Effective date: 20160914 |
|
| STCF | Information on status: patent grant |
Free format text: PATENTED CASE |
|
| MAFP | Maintenance fee payment |
Free format text: PAYMENT OF MAINTENANCE FEE, 4TH YEAR, LARGE ENTITY (ORIGINAL EVENT CODE: M1551); ENTITY STATUS OF PATENT OWNER: LARGE ENTITY Year of fee payment: 4 |