US9827445B2 - Automatic creation and selection of dose prediction models for treatment plans - Google Patents
Automatic creation and selection of dose prediction models for treatment plans Download PDFInfo
- Publication number
- US9827445B2 US9827445B2 US14/040,468 US201314040468A US9827445B2 US 9827445 B2 US9827445 B2 US 9827445B2 US 201314040468 A US201314040468 A US 201314040468A US 9827445 B2 US9827445 B2 US 9827445B2
- Authority
- US
- United States
- Prior art keywords
- new
- radiation treatment
- dose
- radiation
- cluster
- Prior art date
- Legal status (The legal status is an assumption and is not a legal conclusion. Google has not performed a legal analysis and makes no representation as to the accuracy of the status listed.)
- Active, expires
Links
Images


Classifications
-
- A—HUMAN NECESSITIES
- A61—MEDICAL OR VETERINARY SCIENCE; HYGIENE
- A61N—ELECTROTHERAPY; MAGNETOTHERAPY; RADIATION THERAPY; ULTRASOUND THERAPY
- A61N5/00—Radiation therapy
- A61N5/10—X-ray therapy; Gamma-ray therapy; Particle-irradiation therapy
- A61N5/103—Treatment planning systems
- A61N5/1031—Treatment planning systems using a specific method of dose optimization
-
- G06F19/345—
-
- G06F19/3481—
-
- G—PHYSICS
- G16—INFORMATION AND COMMUNICATION TECHNOLOGY [ICT] SPECIALLY ADAPTED FOR SPECIFIC APPLICATION FIELDS
- G16H—HEALTHCARE INFORMATICS, i.e. INFORMATION AND COMMUNICATION TECHNOLOGY [ICT] SPECIALLY ADAPTED FOR THE HANDLING OR PROCESSING OF MEDICAL OR HEALTHCARE DATA
- G16H20/00—ICT specially adapted for therapies or health-improving plans, e.g. for handling prescriptions, for steering therapy or for monitoring patient compliance
- G16H20/10—ICT specially adapted for therapies or health-improving plans, e.g. for handling prescriptions, for steering therapy or for monitoring patient compliance relating to drugs or medications, e.g. for ensuring correct administration to patients
- G16H20/17—ICT specially adapted for therapies or health-improving plans, e.g. for handling prescriptions, for steering therapy or for monitoring patient compliance relating to drugs or medications, e.g. for ensuring correct administration to patients delivered via infusion or injection
-
- G—PHYSICS
- G16—INFORMATION AND COMMUNICATION TECHNOLOGY [ICT] SPECIALLY ADAPTED FOR SPECIFIC APPLICATION FIELDS
- G16H—HEALTHCARE INFORMATICS, i.e. INFORMATION AND COMMUNICATION TECHNOLOGY [ICT] SPECIALLY ADAPTED FOR THE HANDLING OR PROCESSING OF MEDICAL OR HEALTHCARE DATA
- G16H20/00—ICT specially adapted for therapies or health-improving plans, e.g. for handling prescriptions, for steering therapy or for monitoring patient compliance
- G16H20/40—ICT specially adapted for therapies or health-improving plans, e.g. for handling prescriptions, for steering therapy or for monitoring patient compliance relating to mechanical, radiation or invasive therapies, e.g. surgery, laser therapy, dialysis or acupuncture
-
- G—PHYSICS
- G16—INFORMATION AND COMMUNICATION TECHNOLOGY [ICT] SPECIALLY ADAPTED FOR SPECIFIC APPLICATION FIELDS
- G16H—HEALTHCARE INFORMATICS, i.e. INFORMATION AND COMMUNICATION TECHNOLOGY [ICT] SPECIALLY ADAPTED FOR THE HANDLING OR PROCESSING OF MEDICAL OR HEALTHCARE DATA
- G16H50/00—ICT specially adapted for medical diagnosis, medical simulation or medical data mining; ICT specially adapted for detecting, monitoring or modelling epidemics or pandemics
- G16H50/20—ICT specially adapted for medical diagnosis, medical simulation or medical data mining; ICT specially adapted for detecting, monitoring or modelling epidemics or pandemics for computer-aided diagnosis, e.g. based on medical expert systems
-
- G—PHYSICS
- G16—INFORMATION AND COMMUNICATION TECHNOLOGY [ICT] SPECIALLY ADAPTED FOR SPECIFIC APPLICATION FIELDS
- G16H—HEALTHCARE INFORMATICS, i.e. INFORMATION AND COMMUNICATION TECHNOLOGY [ICT] SPECIALLY ADAPTED FOR THE HANDLING OR PROCESSING OF MEDICAL OR HEALTHCARE DATA
- G16H50/00—ICT specially adapted for medical diagnosis, medical simulation or medical data mining; ICT specially adapted for detecting, monitoring or modelling epidemics or pandemics
- G16H50/50—ICT specially adapted for medical diagnosis, medical simulation or medical data mining; ICT specially adapted for detecting, monitoring or modelling epidemics or pandemics for simulation or modelling of medical disorders
-
- G—PHYSICS
- G16—INFORMATION AND COMMUNICATION TECHNOLOGY [ICT] SPECIALLY ADAPTED FOR SPECIFIC APPLICATION FIELDS
- G16H—HEALTHCARE INFORMATICS, i.e. INFORMATION AND COMMUNICATION TECHNOLOGY [ICT] SPECIALLY ADAPTED FOR THE HANDLING OR PROCESSING OF MEDICAL OR HEALTHCARE DATA
- G16H50/00—ICT specially adapted for medical diagnosis, medical simulation or medical data mining; ICT specially adapted for detecting, monitoring or modelling epidemics or pandemics
- G16H50/70—ICT specially adapted for medical diagnosis, medical simulation or medical data mining; ICT specially adapted for detecting, monitoring or modelling epidemics or pandemics for mining of medical data, e.g. analysing previous cases of other patients
-
- A—HUMAN NECESSITIES
- A61—MEDICAL OR VETERINARY SCIENCE; HYGIENE
- A61N—ELECTROTHERAPY; MAGNETOTHERAPY; RADIATION THERAPY; ULTRASOUND THERAPY
- A61N5/00—Radiation therapy
- A61N5/10—X-ray therapy; Gamma-ray therapy; Particle-irradiation therapy
- A61N5/103—Treatment planning systems
- A61N2005/1041—Treatment planning systems using a library of previously administered radiation treatment applied to other patients
Definitions
- the present disclosure relates generally to treatment planning for radiation therapy and is more particularly directed to dose prediction models for generating a treatment plan.
- radiation therapy consists of the use of ionizing radiation to treat living tissue, usually tumors.
- ionizing radiation used in radiation therapy, including high energy x-rays, electron beams, and proton beams.
- the process of administering the radiation to a patient can be somewhat generalized regardless of the type of radiation used.
- Techniques allow the radiologist to treat a patient from multiple angles while varying the shape and dose of the radiation beam, thereby providing greatly enhanced ability to deliver radiation to a target within a treatment volume while avoiding excess irradiation of nearby healthy tissue.
- this variability in delivering radiation has made the task of developing treatment plans more difficult.
- Both the target within the treatment volume and any nearby organs may have complex three dimensional shapes adding to the difficulty of preparing a treatment plan.
- Treatment planning can start with (1) images of the treatment volume (e.g., slices from CT or MRI scans) and, (2) the desired dose of radiation which is to be delivered to a target, such as a tumor, within the treatment volume, and (3) the maximum dose which can be safely absorbed by tissue structures, such as organs, within the treatment volume that are adjacent to or near the tumor or other target volume.
- images of the treatment volume e.g., slices from CT or MRI scans
- tissue structures such as organs
- the inverse problem involves optimizing the angles, MLC leaf movements and durations of irradiations. Because of the large number of variables involved and complex matrix manipulations that are required, the algorithms for calculating and optimizing treatment plans require substantial computational time even when using modern high speed computers.
- the desired dose may not always be possible given the constraints of the system and the particular patient (e.g., geometry of the tumor).
- the desired dose distribution may need be modified as part of the optimization process, which can cause further difficulty. Therefore, it is desirable to identify a dose distribution that is achievable.
- knowledge based dose prediction information from previously planned radiation treatments are used to gain knowledge about what is an achievable dose distribution in a new case.
- One approach to knowledge based dose prediction is to use a set of the previously planned cases to create a prediction model that is then be used (without needing to store all information related to this training set) to predict the dose for a new case.
- the dose prediction model can help identify a dose distribution that is achievable and reduces the effort to determine a desired dose.
- dose prediction models are created from training sets of treatment plans that are selected by a human operator. It may prove very time consuming for a human operator to shift through thousands of treatment plans in order to categorize them into different training sets for different models. It is also very difficult for a human operator to evaluate whether all selected treatment plans in a particular training set are representative of the set.
- Embodiments of the present invention are directed to determining a dose prediction model for generating a dose distribution of a treatment plan for irradiating a target structure (e.g. a tumor) within a patient.
- Treatment plans from previous patients can be analyzed to determine D characteristic values, e.g., geometric characteristics of the tumor. Coordinates can be assigned to the D characteristic values to obtain a D-dimensional point for each treatment plan.
- the treatment plans can be clustered based on the D-dimensional points.
- the treatment plans of a cluster can then be used to determine a dose prediction model for generating one or more new treatment plans. In this manner, the creation of a dose prediction model is more efficient than selecting treatment plans by hand, and greater accuracy can be achieved, e.g., via specified criteria for clusters.
- Embodiments of the present invention are also directed to selecting a dose prediction model for generating a dose distribution of a treatment plan for irradiating a target structure within a patient.
- Characteristics about the patient can be used to determine a D-dimensional point corresponding to the patient.
- the D-dimensional point can be used to select a model from K models. For example, a set of data for each model can be used to determine at least one D-dimensional point for each model (e.g., a centroid for each cluster corresponding to a model).
- the D-dimensional point of the patient can be compared to the D-dimensional points of the models to selected a model, which can be used to determine a treatment plan for the patient.
- FIG. 1 is a perspective view of a radiation therapy system.
- FIG. 2 is a side view of a radiation therapy system.
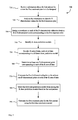
- FIG. 3 is a flowchart of a method 300 of determining a treatment plan for irradiating a target according to embodiments of the present invention.
- FIG. 4 shows a plot 400 of a plurality of dose volume histograms (DVH) according to embodiments of the present invention.
- FIG. 5 is a flowchart illustrating a method 500 for determining a dose prediction model using M treatment plans according to embodiments of the present invention.
- FIG. 6 is a flowchart of method 600 for creating a dose prediction model for new patient according to embodiments of the present invention.
- FIG. 7 is a flowchart illustrating a method 700 of selecting a first dose prediction model for generating a dose distribution of a first treatment plan for irradiating a target structure within a first patient according to embodiments of the present invention
- FIG. 8 shows a block diagram of an example computer system 800 usable with system and methods according to embodiments of the present invention.
- “Radiation” refers to any particles (e.g., photons, electrons, protons etc.) used to treat tissue, e.g., tumors.
- Examples of radiation include high energy x-rays, gamma rays, electron beams, and proton beams.
- the different particles can correspond to different types of radiation treatments.
- the “treatment volume” refers to the entire volume that will be subjected to radiation, and is sometimes referred to as the “irradiated volume.”
- the “target structure”, “target volume”, and “planning target volume” (“PTV”) refer to tissue intended to receive a therapeutic prescribed dose.
- a “treatment plan” can include a dose distribution, machine parameters for achieving the dose distribution for a given patient, and information about the given patient.
- a dose distribution provides information about the variation in the dose of radiation with position.
- a “dose distribution” can take many forms, e.g., a dose volume histogram (DVH) or a dose matrix.
- a DVH can summarize three-dimensional (3D) dose distributions in a graphical 2D format, e.g., where the horizontal axis is the dose (e.g., in units of grays—Gy) absorbed by the target structure (e.g., a tumor) and the vertical axis is the volume percentage.
- a differential DVH the height of a bar at a particular dose indicates the volume of the target structure receiving the particular dose.
- the height of a bar at a particular dose represents the volume of the structure receiving greater than or equal to that dose.
- the cumulative DVH is generally a curve (e.g., when small bin sizes are used), whereas the differential DVH is generally a disjoint bar graph.
- a drawback of a DVH is that it offers no spatial information; i.e., a DVH does not show where within a structure a dose is received.
- a dose matrix can provide the dose that each part of the body receives.
- a “dose prediction model” receives patient data and outputs a dose distribution that is predicted to be obtainable.
- a model can also output other data, such as optimization objectives. Different types of radiation treatments can have different models.
- the patient data can include diagnostic information (e.g., general tumor location or stage information) and geometric information (e.g., the spatial geometry of the tumor and of other organs in the patient).
- a particular model can have an accuracy (reliability) associated with the predicted dose distribution.
- the accuracy can be determined from a set of test treatment plans whose dose distribution has been determined via other means (e.g., by optimizing a cost function). For example, the accuracy can be determined based on how well the model predicts the actual dose distributions obtained by optimizing a cost function.
- a dose prediction model can be used to determine a dose distribution for a new patient.
- the dose prediction models can already be determined.
- a plurality of pre-determined models may be created based on training sets of previously determined treatment plans for other patients.
- Embodiments can automatically select the treatment plans to be used in creating a dose prediction model. The automatic selection can be based on a similarity of defined characteristics between treatment plans, as quantified by a distance.
- a training set can then be used to determine a model, which can be used to generate a treatment plan for a new patient.
- an embodiment can select a best model between pre-existing models. For example, characteristics of the treatment plans of the training set used to create the model can be saved as characteristics of the model, and then used to determine if the new patient data is similar to the characteristics of the model. This can be done across a plurality of dose prediction models to determine which model is most similar.
- the characteristics of the treatment plans of a model can be saved in a variety of ways, e.g., as an average of the characteristics of the treatment plan, as a volume, or as the raw data of the specific treatment plans in the training set of the model.
- embodiments can create a dose prediction model that is tailored to a new patient. Treatment plans with similar characteristics as the new patient can be identified and then used to create a prediction model for the new patient.
- FIGS. 1 and 2 depict a radiation therapy system of the type which may be used in connection with the present invention.
- a perspective view of radiation therapy system in this case a linear accelerator
- such a system is capable of generating either an electron (particle) beam or an x-ray (photon) beam for use in the radiotherapy treatment of patients on a treatment table 35 .
- Other radiation therapy systems are capable of generating heavy ion particles such as protons.
- x-ray irradiation will be discussed. However, it will be appreciated by those skilled in the art that the same principles apply to other systems.
- Stand 10 supports a rotatable gantry 20 with a treatment head 30 .
- a control unit (not shown) which includes operational electronics for controlling the different modes of operation of the accelerator.
- a high voltage source is provided within the stand or in the gantry, to supply voltage to an electron gun (not shown) positioned on an accelerator guide located in gantry 20 . Electrons are emitted from the electron gun into the guide (not shown) where they are accelerated.
- a source supplies RF (microwave) power for the generation of an electric field within the waveguide.
- the electrons emitted from the electron gun are accelerated in the waveguide by the electric field, and exit the waveguide as a high energy electron beam, typically at megavoltage energies.
- the electron beam then strikes a suitable metal target, emitting high energy x-rays in the forward direction.
- FIG. 2 a somewhat more detailed side view of a radiation therapy system of the type which may be used in connection with the present invention is shown.
- a patient P is shown lying on treatment table 35 .
- X-rays formed as described above are emitted from the target in treatment head 30 in a divergent beam 104 .
- a patient plane 116 which is perpendicular to the page in FIG. 1B , is positioned about one meter from the x-ray source or target, and the axis of gantry 20 is located on plane 116 , such that the distance between the target and isocenter 178 remains constant when gantry 20 is rotated.
- Isocenter 178 is at the intersection between patient plane 116 and the central axis of beam 122 .
- a treatment volume to be irradiated is located about the isocenter.
- “Jaws” (not shown) or x-ray collimators comprising an x-ray blocking material, are positioned in head 30 to define the width of the x-ray beam at the patient plane.
- the jaws are moveable and, when fully open, define a maximum beam of about 40 cm ⁇ 40 cm at patient plane 116 .
- a multileaf collimator (“MLC”) (not shown in FIG. 1B ) is positioned at the exit of head 30 , to further shape the x-ray beam. Since its introduction in 1990 the MLC has become a standard feature of most radiation therapy systems.
- MLCs sold by the assignee of the present invention use up to 120 individually controllable leaves, typically thin slices of tungsten, that can be moved into or out of the x-ray beam under the control of system software.
- the MLC can be used to collimate the x-rays to provide conformal treatment of tumors from various angles (“3D conformal,”) as well as intensity modulated radiotherapy (“IMRT”), whereby different radiation doses are delivered to different portions of the treatment area.
- the treatment volume i.e., the irradiated volume proximate to the isocenter in the path of the x-ray beam, is defined by the jaws, the angle of the head and the MLC.
- IMRT the leaves of the MLC are moved, such that the treatment volume comprises the total volume exposed during the course of a treatment.
- arc therapy the gantry is moved while radiation is delivered.
- Modern radiation therapy techniques involve the use of a treatment plan designed to irradiate a desired target volume, usually corresponding to a tumor, with a desired dose of x-rays (or other radiation).
- Most treatment planning involves the use of the MLC to provide conformal and/or intensity modulated irradiation.
- a treatment plan comprises irradiating one or more selected portions of the treatment volume with a calculated dose of x-rays, and often involves irradiating a treatment area from a plurality of different angles which, in the case of arc therapy, may be delivered while the gantry is rotated.
- Various treatment planning software and other tools are available for developing specific treatment plans, and the details of the various techniques for creating such plans are known and will be described in further detail below.
- a treatment plan is created it is implemented, in part, by controlling the angle of incidence and the leaves of the MLC so as allow the desired radiation dose to reach the selected portions of the treatment volume from the selected angles or while the gantry is rotating.
- the MLC is adjusted to provide static conformal irradiation of a specific site from a single angle.
- the leaves are moved into different positions between or during irradiations.
- the leaves of the MLC can either be moved iteratively into different positions while the beam is off, with irradiation between movements, (such that the leaves are static during x-ray emission), or they can be continually moved during irradiation in a “sliding window” or other variable aperture technique.
- an important aspect of the conformal and IMRT techniques that are associated with the use of MLCs is the ability to both provide a desired dose of radiation to a target volume while minimizing the dose delivered to adjacent healthy tissue.
- such information may comprise a map of the planning target volume (“PTV”), such as a prostate tumor, which is prescribed by the physician to receive a certain therapeutic radiation dose with allowable tolerances.
- PTV planning target volume
- Volumetric information about nearby tissues may include for example, maps of the patient's bladder, spinal cord and rectum, each of which may be deemed an organ at risk that can only receive a much lower, maximum prescribed amount of radiation without risk of damage.
- This volumetric information along with the prescribed dose limits and similar objectives set by the medical professionals is the basis for calculating an optimized dose distribution and the treatment plan to deliver it.
- the volumetric information may, for example, be reduced to an objective function or a single figure of merit that accounts for the relative importance of various trade-offs inherent in such a plan, along with constraints that must be met for the plan to be medically acceptable or physically possible.
- Treatment planning algorithms can account for the capabilities of the specific radiation therapy system they are used with. For example, the type, energy level and fluence of the radiation beam, and the capabilities of the MLC.
- treatment planning algorithms proceed by calculating the radiation dose received by each voxel in the treatment volume, adjusting one or more variable system parameters, such as the angle of irradiation or the positions of the MLC leaves, and then recalculating the dose received by each voxel. This process is ideally performed iteratively until an optimized plan is reached.
- the amount of time needed to perform the large number of calculations for each iteration places a practical limit on the number of iterations that can be performed. Accordingly, the algorithm is terminated after a predetermined amount of time, after a predetermined number of iterations, or after some other practical limit is reached.
- the treatment plans of a training set can be automatically selected based on characteristics of the treatment plans. For example, a heterogeneous group of radiotherapy treatment plans can be analyzed with regards to certain characteristics of the plans and clustered into groups (training sets), where the treatment plans of a training set have similar characteristics. As another example, a training set can be determined based on data of a new patient.
- FIG. 3 is a flowchart of a method 300 of determining a treatment plan for irradiating a target according to embodiments of the present invention.
- Method 300 can be performed wholly or partially with a computer system, as can other method described herein.
- Blocks 310 - 340 are repeated for each of N treatment plans corresponding to a plurality of patients.
- the patients can be considered former patients as a treatment plan has already been developed.
- Each treatment plan can correspond to a different patient, but more than one treatment plan can be for the same patient.
- the information about the treatment plan can include information about a patient for whom the treatment plan was designed.
- the information can also include a dose distribution for the treatment plan, as well as the machine parameters for obtaining the dose distribution.
- the information is analyzed to identify D characteristic values of the treatment plan.
- Each characteristic value corresponds to a different characteristic of the treatment plan.
- the D characteristic values can include one or more geometric characteristic values of a tumor of the patient.
- the D characteristic values can act as a set of criteria for determining a similarity among the treatment plans.
- characteristics include characteristics that describe the patient geometry (e.g., mass, volume, a particular size, such as length, width, and depth) and the geometric relationship of the target structure and healthy tissue (e.g., a physical distance between the two, a type of healthy tissue, a number of critical organs around the target, etc.).
- Other examples for characteristics related to a patient may include diagnostic information (such as the type of tumor or general location, and the stage of the tumor) and relevant clinical and demographic data such as patient's sex and diagnosis.
- diagnostic information such as the type of tumor or general location, and the stage of the tumor
- relevant clinical and demographic data such as patient's sex and diagnosis.
- characteristics of the field geometry and dose distribution used to irradiate the patient can be used.
- a coordinate is assigned to each of the D characteristic values to obtain a D-dimensional point corresponding to the treatment plan.
- the coordinate can simply be the corresponding characteristic value (e.g., a number specifying a mass or volume of a tumor).
- the assigning of a tumor can also include a transformation, e.g., two possible classifications of a characteristic (e.g., a diagnosis or radiation type) can be assigned to be 0 or 1.
- Each characteristic can correspond to a different dimension in a D-dimensional space.
- the number of possible values for any given dimension may be just two (e.g., just two options) or have more than two.
- the possible values can effectively be continuous values (e.g., numerical values), as opposed to discrete values (e.g., only two or ten options).
- a cluster of M treatment plans is identified based on the D-dimensional points.
- M would be less than N.
- the N treatment plans can be organized into M groups (clusters), where each cluster can include a plurality of treatment plans.
- the treatment plans in a cluster would generally have similar values for the D characteristics.
- a distance between D-dimensional points can be used to determine whether treatment plans are in a same cluster.
- the clusters can be identified in a variety of ways, as is mentioned herein.
- All the M treatment plans of the cluster can be required to have the same value for particular characteristic(s).
- all M treatment plans can be constrained to be for the same diagnosis (e.g., liver cancer).
- Other characteristics can have a distance measured between the characteristic values (e.g., size, shape, and location of the tumor).
- the size or volume of the tumor e.g., one cubic centimeter or two liters
- the cluster can be determined such that the tumor size and locations are similar (e.g., a distance between the D dimensional points is within a threshold, which may be determined dynamically).
- a distance can be computed as a sum of differences between values for the various dimensions, e.g., of ones which are not constrained to be equal.
- the distance can include different weightings for different dimensions (e.g., one characteristic can be weighted higher than another distance).
- a distance between two treatment plans can have a difference of a first characteristic (dimension) multiplied by a first weight and a difference of a second characteristic (dimension) multiplied by a second weight.
- a difference between two values can be based on subtraction of numerical values.
- any difference between two values can be designated as having a same difference value (e.g., when a type of tumor differs, the difference can always be designated as one).
- the cluster can be determined dynamically based on information for a new patient. As the cluster specifically determine for the new patient, this embodiment is called real-time modeling. In another embodiment, the cluster is determined from only previous treatment plans. Multiple clusters can be determined from the entire collection of previous treatment plans. Various clustering algorithms can be used, such as a k-means algorithm.
- the M treatment plans of the cluster are used to determine a dose prediction model for generating one or more new treatment plans.
- the cluster can be used as the training set for determining the dose prediction model.
- the dose prediction model can be used to generate a new treatment plan by outputting a predicted dose distribution, which is then used to obtain machine parameters for obtaining the dose distribution.
- the machine parameters can be determined by optimizing a cost function.
- the dose distribution can also be updated during this optimization process.
- the one or more new treatment plans can be generated for one or more new patients.
- a new treatment plan can be used for irradiating a target structure within the patient.
- the treatment plan data could comprise a diagnosis for the patient.
- a similar diagnosis may be found in the treatment plans of a cluster.
- a size of a patient (e.g., mass or height) and tumor size may also provide a similar the dose level at the target, and thus may be used as characteristics.
- a distance from critical organs can also be used to identify matches in the geometry patterns of the patients corresponding to the respective treatment plans.
- General information about the patient can also be used, e.g., demographic information, such as ethnicity or some genetic measure (e.g., a DNA profile).
- each treatment plan can be stored as a record in a database, with a plurality of fields for the record.
- the fields can correspond to any of the above-mentioned characteristics. Such information can be entered into the database when a treatment plan for patient is created. Any of the fields can have numerical values or character values, e.g., the character values correspond to particular classifications, such as a diagnosis or stage of the tumor. Which fields are to be used as the characteristics for determining a cluster can be set as a default will be chosen by a user. Once the fields have been chosen, a record of the treatment plan can be stored as a D-dimensional point. The plurality of D dimensional points can then be fed into a clustering function. In one implementation, such fields can be searched to identify treatment plans having certain characteristics.
- the database and any engine for performing methods described herein may be implemented in a server and accessed from a client.
- the information about the treatment plans can be obtained from a set of patient cases for which treatment plans have already been determined. Since the treatment plans are already determined, the dose distributions of the treatment plans can also be used as one of the characteristics for determining a similarity among the treatment plans. Accordingly, in one embodiment, the D characteristic values corresponding to a treatment plan include a dose distribution of the treatment plan. Accordingly, embodiments can find clusters of similar treatment plans automatically from a database by considering the similarities in patient geometry and the dose distribution compared to other treatment plans.
- One or more specific values can be determined from a dose distribution, and each of the specific values can be used as a characteristic (dimension). Any term (e.g., statistical terms) determined from a dose distribution can be used. For example, first order terms such as maximum dose, mean dose, median dose, minimum dose, dose in a specific volume percent, and volume percent of a specific dose may be used. Second or higher order terms of the first order terms (e.g., standard deviation, skewness, and kurtosis) are other examples. Other examples include projections of DVHs over principal components (i.e. principal components scores).
- principal components scores i.e. principal components scores
- the estimate of the dose distribution for new patient can be determined as an average or weighted average of the dose distributions of the treatment plans in the cluster.
- the estimated dose distribution can be an average of the dose distributions of the two treatment plans. If the D dimensional point for new patient was closer to one treatment plan of the other, then a weighted average might be determined.
- the average can be done on a per bin basis (i.e., the average is of the volume fraction for each dose range). Accordingly, the model can be defined by the rules for determining such an average.
- the dose prediction model can be determined from a functional fit.
- the parameters of such a functional fit can be stored, and the individual characteristics of the treatment plans of the training set can be discarded.
- Such a dose prediction model can receive the characteristic values of a new patient (e.g., as a new D-dimensional point) and output the dose distribution.
- the values of the dose distribution may be parameterized to provide the predicted values for each dose range of a dose volume histogram (DVH).
- the dose prediction model can provide discrete values for each dose range of a DVH.
- FIG. 4 shows a plot 400 of a plurality of dose volume histograms (DVH) according to embodiments of the present invention.
- the horizontal axis provides an amount of radiation in Grays.
- the vertical axis is the percentage of volume.
- the dose distributions represent the volume of the structure receiving greater than or equal to that dose. For example, distribution 410 has about 50% of the volume receiving 15 Grays or more.
- the curves can be broken up into various bins (dose ranges). For example, dose range 420 is about one Gray wide. Dose distributions can be compared to one another at a resolution of the bin size, e.g., a difference between two distributions can be computed for each dose range.
- some of the characteristics can be dropped in order to provide more accurate model. For example, if a selection criterion that tumor size is very well matched for cluster, one may drop the size of the tumor as a parameter from the modeling because you would already know that it matches very well. This may improve the model as the small differences in tumor size can provide for relatively flat objective function in the dimension of tumor size, which can cause difficulties in determining the functional fit.
- the determination of the dose prediction model can also account for other factors, such as not providing too much radiation to healthy tissue. For example, after some fraction of the organ gets some level of dose, side effects will be seen, and this can be discouraged in the determination of the model.
- the dose prediction model can be used to determine a predicted dose distribution for patient.
- the predicted dose distribution can be used to set optimization objectives that will drive the optimization algorithm towards the solution found.
- the predicted dose distribution can also be used to determine if other treatment plans (e.g., other than radiation or other type of radiation) would be better or if there is a need to sacrifice some organ in order to spare a more important organ.
- the predicted dose distribution can be used, as well, as a quality tool to evaluate if, for example, for a manual planned case there would be a better solution.
- a model outputs the estimated achievable DVH (e.g., as a 2D representation of the dose) and optimization objectives to guide the optimization algorithm towards that solution.
- the optimizer can calculate an optimized 3-D dose distribution and the field fluences (intensity of dose delivered in “individual” beams of radiation) that can be obtained with the 3D dose distribution.
- the field fluences can be used to calculate the MLC movements in IMRT (in arc cases they are calculated concurrently).
- the fluences and MLC movements can be input to the dose calculation algorithm that calculates the real dose that would be delivered to the patient given the plan.
- an accuracy (effectiveness) of the model can be determined.
- the actual treatment plans are available.
- Embodiments can compare the result of the model to the actual plans. This accuracy can also be used to refine the treatment plans in a cluster, and thus refine the dose prediction model.
- the predicted dose distributions output from the model can be tested by comparing the predicted dose distributions to the actual dose distributions of select treatment plans.
- the selected treatment plans used for testing can include all or some different treatment plans from the ones in the training set, or all can be from the training set.
- patient data of a treatment plan from the training set can be input to the model to obtain a predicted dose distribution, which can be compared to the actual dose distribution of the treatment plan.
- This comparison can provide a measure of accuracy of the model, e.g., as a reliability score.
- reliability scores include the number of histogram bins that are overestimated, number of histogram bins that are underestimated, average over/under estimation, root mean square error (RMSE) per bin, and total RMSE of the estimate.
- RMSE root mean square error
- the comparison can be performed for multiple test treatment plans, and the accuracy (reliability score) can be determined as an average or some of the errors between each of the predicted and actual dose distributions.
- the errors can be calculated as a difference between the volume fractions for each dose range. This measure of accuracy can be stored with the model for use in later evaluations of the model.
- the test treatment plans can be determined in a similar manner as the training set, and can even be the same as the training set.
- the measure of accuracy can be compared to a threshold value for determining whether the model is sufficiently accurate. Accordingly, a testing set of selected treatment plans can be used to compare dose predictions of the model to the actual dose distributions of the testing set plans as part of a validation of a model. If the model is not sufficiently accurate, the model can be refined in various ways, e.g., updating parameters of the model.
- the model may have specific functional form with parameters that can vary to fit the model to the data of the cluster. The parameters can be updated so as to increase the accuracy of the model for the testing set plans. In this manner, the model (i.e., the parameters for the model) that most accurately predicts the dose distributions of a testing set is indicated.
- different functional forms for the model may be used and that accuracy can be compared to each other to determine the most accurate model.
- a success rate of the dose distribution can also be tracked. For example, if a first treatment plan was more successful in treating a tumor than another treatment plan (e.g., as determined by a physician), then the first treatment plan can be weighted higher in a functional fit process for determining the dose prediction model. In this manner, the predicted dose distributions can provide more successful treatment plans. Success can be measured in a variety of ways, e.g., by reduction in size of tumor, length of remission, side of effects, etc.
- a metric for each dimension of a data point can identify if the point in that dimension is an outlier or not (e.g., with z-metrics or z-modified metrics).
- Acceptable values for certain dimensions of the training set can be identified to determine whether the data point for a new patient is outside the acceptable values.
- Patient (data points) of a training set can also be eliminated if they are outliers.
- Other metrics can consider a subset of dimensionalities, distance metrics, etc. Such a process can identify when a particular characteristic for a patient (or treatment plan) is significantly different than the characteristics of the patients used for the model.
- the reliability may decrease, and thus that model may not be used or may need to be modified.
- the level of decrease can depend on the particular characteristic and the extent of the difference. For example, a model may only be accurate for particular range of values for that particular characteristic, thereby causing errors in the prediction for a patient having a characteristic outside the operating range.
- Reliability scores can also be determined for dose matrices.
- the dose matrix as an image of size XY and dimensionality Z. Image processing methods can be used to extract features that will allow the calculation of distances (an RGB image can be considered dimension 3 while a black-and-white can be considered dimension 1, where dimensionality z can then be used).
- the dose matrix can be summarized into 2D vectors, such as the DVHs or distance DVHs, for each of the structures. Metrics can be compared between them (e.g., using signal processing methods). Checking estimates of prescribed doses can also be used.
- dose metrics can be used to calculate the DVH of each of the structures, and the maximum dose can be calculated.
- the DVHs can be further processed to obtain the first 2-3 principal components (e.g., using a machine learning algorithm for principal component analysis). From the principal components and the DVHs, the principal component scores can be calculated. These principal component scores can be used to check how similar treatment plans are.
- Accuracies and errors of a model can be used to iteratively create new models by subdividing or combining models (e.g., by subdividing or combing training sets) until certain acceptance thresholds are met.
- specific treatment plans can be identified for excluding from the cluster. For example, the predicted dose distribution for a particular treatment plan have a large difference from the actual dose distribution. This treatment plan can be identified as not being representative of the cluster.
- one embodiment can identify individual plans of a training set (cluster) that are not representative of a model and exclude these plans. The remaining plans can then be used in a new iteration for determining the model.
- FIG. 5 is a flowchart illustrating a method 500 for determining a dose prediction model using M treatment plans according to embodiments of the present invention.
- Method 500 may be used to refine the treatment plans within a cluster in order to provide better dose prediction model.
- the M treatment plans are used to determine an initial prediction model.
- Initial prediction model can be determined as described above.
- the method for determining the initial prediction model can be different than the method for determining the final dose prediction model.
- one or more of the M treatment plans that are not representative of the initial prediction model are identified, e.g., as described above for identifying outliers.
- These treatment plans having a high error can be identified as not being representative of the model.
- Such exclusion step can occur after multiple iterations in updating parameters of the model so that an additional improvement in the accuracy is not expected for these non-representative treatment plans.
- Such non-representative treatment plans might occur when a doctor specifies very unique criteria for a treatment plan.
- the identified one or more treatment plans are removed from the cluster.
- the identified one or more treatment plans can simply be excluded from the next step in an iterative process for determining the dose prediction model.
- any rates associated with the identified one or more treatment plans can be reduced, thereby effectively providing an exclusion of the treatment plan from the cluster.
- the remaining treatment plans of the cluster are used to determine the dose prediction model.
- the same techniques as described above can be used to determine the dose prediction model from the remaining treatment plans.
- an accuracy of the dose prediction model to predict the dose distributions of the remaining treatment plans can be used in an iterative procedure for determining the dose prediction model.
- embodiments can compare which patients were good fits and which ones were not that good fits. And, then that information can be used as a criteria to exclude some treatment plans from the model. Additional criteria can also be specified, which can lead to the exclusion of treatment plans. For example, a physician can determine that certain healthy tissue is not need to be spared, and thus treatment plans that were developed to spare the healthy tissue can be excluded. For instance, it may not be important to spare the parotids as the person is already paralyzed, and they are not important to save.
- a dose prediction model can be made specifically for a new patient.
- a model that is tailored to the new patient can be created.
- the new dose prediction model is created from treatment plans that have similar characteristics as the characteristics for the new patient. Accordingly, a similar framework as described above can be used.
- the user knows that the model is to be used for a particular patient, then one does not need to use patients that are very different from the new patient. Instead, information about a new patient can be used to identify a particular D-dimensional point, and a cluster of treatment plans can be identified around that D-dimensional point.
- FIG. 6 is a flowchart of method 600 for creating a dose prediction model for new patient according to embodiments of the present invention.
- Method 600 can be used to perform the clustering of M treatment plans based on the D-dimensional points and block 340 of method 300 .
- the characteristics values would generally not include a dose distribution, as can be done when clustering similar existing treatment plans.
- new information is received about a new patient that is not one of the plurality of patients corresponding to N existing treatment plans.
- the information about the new patient can include information as described herein. For example, information about the geometry of the patient (e.g., height and weight), demographic information about the patient, a type of radiation treatment to be used, and relative geometry information about the location of the tumor relative to healthy tissue. Certain information about the new patient corresponds to characteristics for determining a D-dimensional point, as described herein.
- the new information is analyzed to determine a new D-dimensional point for the new patient.
- a similar procedure as described above can be used to identify D characteristics of the new information.
- the values of the D characteristics can be used to create the new D-dimensional point.
- the particular characteristics to be used can be set as a default, by user, be determined dynamically, or any combination thereof.
- distances between the new D-dimensional point and the D-dimensional points corresponding to the N treatment plans are determined.
- a distance between two points can be calculated as a sum of the differences in the values for each dimension.
- different weights can be used for the differences of different dimensions.
- a first dimension e.g., tumor size
- a second dimension e.g., demographic information
- similarity in values for the first dimension is more critical than a similarity in values for a second dimension.
- the result can provide a larger weight for multiplying a difference in the values for the first dimension then further weight for multiplying a difference in the values for the second dimension.
- a particular dimension can be required to have the same value as for the new patient, and thus any difference for such dimension can be scaled by a very large number so that the effect a distance is large, thereby preventing points having such differences from being included within the cluster for the new patient.
- Such weighting schemes can effectively provide a metric for the D-dimensional space, with a metric differs from an identity metric when different weights are used for different dimensions.
- the cluster of M treatment plans is identified based on the distances.
- This cluster of M treatment plans can correspond to the cluster determined at block 340 of method 300 .
- the cluster of M treatment plans corresponds to the M D-dimensional points closest to the new D-dimensional point (e.g., the 30 or 50 treatment plans having D characteristic values closest to the new patient).
- the value of M can be set as a default, by user, or dynamically.
- the distance can incorporate any rating scheme described above.
- the M D-dimensional points are the points that are within a specified boundary around the new D-dimensional point.
- the specified boundary can have any shape, thereby allowing larger differences for certain dimensions.
- the shape of the boundary can be accounted for by using different metrics for the D-dimensional space.
- the boundary can have shape such as a sphere or be oblong.
- the body can be defined to provide treatment plans that have an exact match for one or more characteristics and that have other characteristics with values that are within a certain percentage of the values for the new patient (e.g., the volume of the tumors from the other treatment plans should be within 30% of the tumor volume for the new patient).
- the cluster of M treatment plans can then be used to determine a dose prediction model for generating a new treatment plan for the new patient, as described above (e.g., and block 350 of method 300 ).
- a model can be generated in real-time for the new patient by finding a cluster of M treatment plans that satisfy certain similarity criteria (e.g., the boundary of block 640 ).
- certain similarity criteria e.g., the boundary of block 640 .
- a patient image, delineated structures in the body, a defined target, and a prescription for the treatment can be used to find a matching or similar set of plans from existing plans.
- a learning model can be created out of those plans and used to predict the achievable dose in the new patient.
- as the treatment plans of the training set are similar, one does not need to use a large training set.
- a plurality of models are determined from various clusters of similar treatment plans identified from a heterogeneous collection of treatment plans. Such models may be determine an automatic fashion, e.g., as described in method 300 . In other implementations, the models may be determined from a manual selection of treatment plans to be used to create each model, or some of the models. Regardless of the technique used to determine the models, an appropriate model can be selected for a new patient from the plurality of predetermined models. If the treatment planning system has many dose prediction models available, it is difficult or time consuming to select a model that is most relevant to the current case.
- Each model typically has a certain region where its predictions are valid. If geometric parameters of the new case differ too much from the geometric parameters spanned by the training set used to create the model, the dose predictions are generally not reliable. It is anticipated that a clinic might have several models to cover a large variety of different regions. It is also possible that example treatment plans and models are shared between clinics increasing the available models even more.
- Embodiments can automatically select the appropriate model based on the information from the current case.
- the information from the current case can be used to deduce the model that could has the best relevance or whose predictions are most reliable.
- the automatic selection can be based on diagnostic information, such as stage information.
- the selection also be based on geometric information of the patient, such as geometric information about the tumor (e.g., location).
- FIG. 7 is a flowchart illustrating a method 700 of selecting a first dose prediction model for generating a dose distribution of a first treatment plan for irradiating a target structure within a first patient according to embodiments of the present invention. Aspects of method 700 can be performed in a similar manner as other methods described herein.
- information is received about the first patient for whom the first treatment plan is to be designed.
- the information can include geometric information about the patient and/or tumor, diagnostic information, and demographic information.
- Information about the first treatment plan can also be received. For example, information can be received about the type of radiation treatment to be used.
- the information is analyzed to identify D characteristic values for the first treatment plan.
- Each characteristic value corresponds to a different characteristic of the first treatment plan.
- the analysis can be performed as described above.
- the D characteristic values can include at least one geometric characteristic value of a tumor of the first patient.
- a user can specify which characteristics are to be used, as may be done for other methods described herein.
- a coordinate is assigned to each of the D characteristic values to obtain a first D-dimensional point corresponding to the first treatment plan.
- the coordinate can be assigned as described above.
- Each characteristic can correspond to a different dimension in a D-dimensional space.
- K dose prediction models are identified.
- Each dose prediction model is generated from a respective cluster of treatment plans.
- some or all of the clusters of treatment plans can be identified using method 300 .
- some or all of the clusters can be determined manually.
- each set of data corresponds to a different dose prediction model.
- a set of data corresponding to a dose prediction model can be generated in various ways. For example, a set of data can be derived from the treatment plans used to create a dose prediction model. The characteristics of the treatment plans of a model can be saved in a variety of ways, e.g., as an average of the characteristics of the treatment plans, as a volume, or as the raw data of the specific treatment plans in the training set of the model.
- each set of data includes at least one geometric characteristic value (e.g., a location and/or size of a tumor).
- the information from the cluster of treatment plans used to create a dose prediction model can be condensed to one value for each characteristic. This may be done by giving an average of the characteristic values of the treatment plans of the cluster.
- a set of data can include more than one value for each characteristic, and may include the values for each of the treatment plans of the cluster. In one implementation, the set of data may correspond to characteristic values of representative treatment plans of the cluster.
- At block 760 at least one D-dimensional point corresponding to each of the K sets of data is determined.
- a set of data may be analyzed to extract representative values for the D characteristics. If one representative values obtained for each characteristic, and a single D dimensional point can be obtained for each set of data. In other embodiments, more than one representative value can be obtained, thereby providing multiple D-dimensional points.
- the multiple D-dimensional points can specify a region of the D-dimensional space. For example, the points can lie on a surface of the D-dimensional shape that defines a region within the surface.
- the first D-dimensional point is compared to the at least one D-dimensional point of each of the K sets of data.
- the comparison can be performed in various ways. For example, if each dose prediction model is represented by a single D-dimensional point, distances between the first D-dimensional point and the respective D-dimensional points can be used to identify the closest D-dimensional point to the first D dimensional point. In this manner, the closest dose prediction model can be identified.
- the first D-dimensional point is within a specified region. If the first D-dimensional point is within multiple regions of different models, these identified models can be further analyzed (e.g., a reliability score can be used). In one embodiment, a centroid can be determined from the multiple points of each of the identified models, and a distance of the first D-dimensional point from the centroids can be used in the comparison (e.g., the model having a close a centroid can be identified). In another embodiment, the distance from the first D-dimensional point to a surface of the region can be used.
- the first dose prediction model is selected from among the K dose prediction models based on the comparison.
- the model that is the closest to the first D-dimensional point can be selected.
- Other criteria can be used, e.g., a distance of the first D-dimensional point from a surface of the region corresponding to a dose prediction model.
- it can be determined that the first treatment plan corresponds to the cluster used to create the first dose prediction model.
- the first treatment plan is generated for the first patient using the first dose prediction model.
- the first dose prediction model can be used to predict the dose distribution for the first treatment plan.
- the predicted dose distribution can be input into an optimization process to determine the parameters of the radiation system.
- a target structure within the patient can then be irradiated using the new treatment plan.
- the reliability of a model can be used in determining whether to select a model. For example, if two models are identified as being relevant (e.g., based on similarity of the D-dimensional points of the models relative to the first D-dimensional point), then the model with a higher reliability score can be selected.
- the reliability score can be a measure of accuracy and may be determined as described above. For example, several models may be used to provide a trial-prediction, and the one with the most reliable result is used.
- the best two or more prediction models can be combined to provide a single prediction model.
- the treatment plans used to create each of the models can be combined into a single cluster and a new model can be generated from this single, larger cluster.
- each of the best two or more models can be selected, and used independently to generate different treatment plans. As an example, this might be done when there are different treatment strategies for the two models, and thus they cannot be combined.
- a computer system includes a single computer apparatus, where the subsystems can be the components of the computer apparatus.
- a computer system can include multiple computer apparatuses, each being a subsystem, with internal components.
- FIG. 8 The subsystems shown in FIG. 8 are interconnected via a system bus 875 . Additional subsystems such as a printer 874 , keyboard 878 , storage device(s) 879 , monitor 876 , which is coupled to display adapter 882 , and others are shown. Peripherals and input/output (I/O) devices, which couple to I/O controller 871 , can be connected to the computer system by any number of means known in the art, such as serial port 877 . For example, serial port 877 or external interface 881 (e.g. Ethernet, Wi-Fi, etc.) can be used to connect computer system 800 to a wide area network such as the Internet, a mouse input device, or a scanner.
- I/O input/output
- system bus 875 allows the central processor 873 to communicate with each subsystem and to control the execution of instructions from system memory 872 or the storage device(s) 879 (e.g., a fixed disk, such as a hard drive or optical disk), as well as the exchange of information between subsystems.
- system memory 872 and/or the storage device(s) 879 may embody a computer readable medium. Any of the data mentioned herein can be output from one component to another component and can be output to the user.
- a computer system can include a plurality of the same components or subsystems, e.g., connected together by external interface 881 or by an internal interface.
- computer systems, subsystem, or apparatuses can communicate over a network.
- one computer can be considered a client and another computer a server, where each can be part of a same computer system.
- a client and a server can each include multiple systems, subsystems, or components.
- any of the embodiments of the present invention can be implemented in the form of control logic using hardware (e.g. an application specific integrated circuit or field programmable gate array) and/or using computer software with a generally programmable processor in a modular or integrated manner.
- a processor includes a multi-core processor on a same integrated chip, or multiple processing units on a single circuit board or networked.
- any of the software components or functions described in this application may be implemented as software code to be executed by a processor using any suitable computer language such as, for example, Java, C++ or Perl using, for example, conventional or object-oriented techniques.
- the software code may be stored as a series of instructions or commands on a computer readable medium for storage and/or transmission, suitable media include random access memory (RAM), a read only memory (ROM), a magnetic medium such as a hard-drive or a floppy disk, or an optical medium such as a compact disk (CD) or DVD (digital versatile disk), flash memory, and the like.
- RAM random access memory
- ROM read only memory
- magnetic medium such as a hard-drive or a floppy disk
- an optical medium such as a compact disk (CD) or DVD (digital versatile disk), flash memory, and the like.
- CD compact disk
- DVD digital versatile disk
- flash memory and the like.
- the computer readable medium may be any combination of such storage or transmission devices.
- Such programs may also be encoded and transmitted using carrier signals adapted for transmission via wired, optical, and/or wireless networks conforming to a variety of protocols, including the Internet.
- a computer readable medium may be created using a data signal encoded with such programs.
- Computer readable media encoded with the program code may be packaged with a compatible device or provided separately from other devices (e.g., via Internet download). Any such computer readable medium may reside on or within a single computer product (e.g. a hard drive, a CD, or an entire computer system), and may be present on or within different computer products within a system or network.
- a computer system may include a monitor, printer, or other suitable display for providing any of the results mentioned herein to a user.
- any of the methods described herein may be totally or partially performed with a computer system including one or more processors, which can be configured to perform the steps.
- embodiments can be directed to computer systems configured to perform the steps of any of the methods described herein, potentially with different components performing a respective steps or a respective group of steps.
- steps of methods herein can be performed at a same time or in a different order. Additionally, portions of these steps may be used with portions of other steps from other methods. Also, all or portions of a step may be optional. Additionally, any of the steps of any of the methods can be performed with modules, circuits, or other means for performing these steps.
Landscapes
- Health & Medical Sciences (AREA)
- Engineering & Computer Science (AREA)
- Public Health (AREA)
- Medical Informatics (AREA)
- Biomedical Technology (AREA)
- General Health & Medical Sciences (AREA)
- Epidemiology (AREA)
- Primary Health Care (AREA)
- Pathology (AREA)
- Data Mining & Analysis (AREA)
- Databases & Information Systems (AREA)
- Nuclear Medicine, Radiotherapy & Molecular Imaging (AREA)
- Veterinary Medicine (AREA)
- Radiology & Medical Imaging (AREA)
- Life Sciences & Earth Sciences (AREA)
- Animal Behavior & Ethology (AREA)
- Medicinal Chemistry (AREA)
- Surgery (AREA)
- Urology & Nephrology (AREA)
- Chemical & Material Sciences (AREA)
- Bioinformatics & Cheminformatics (AREA)
- Radiation-Therapy Devices (AREA)
Abstract
Description
Claims (20)
Priority Applications (1)
| Application Number | Priority Date | Filing Date | Title |
|---|---|---|---|
| US14/040,468 US9827445B2 (en) | 2013-09-27 | 2013-09-27 | Automatic creation and selection of dose prediction models for treatment plans |
Applications Claiming Priority (1)
| Application Number | Priority Date | Filing Date | Title |
|---|---|---|---|
| US14/040,468 US9827445B2 (en) | 2013-09-27 | 2013-09-27 | Automatic creation and selection of dose prediction models for treatment plans |
Publications (2)
| Publication Number | Publication Date |
|---|---|
| US20150095043A1 US20150095043A1 (en) | 2015-04-02 |
| US9827445B2 true US9827445B2 (en) | 2017-11-28 |
Family
ID=52740987
Family Applications (1)
| Application Number | Title | Priority Date | Filing Date |
|---|---|---|---|
| US14/040,468 Active 2034-07-29 US9827445B2 (en) | 2013-09-27 | 2013-09-27 | Automatic creation and selection of dose prediction models for treatment plans |
Country Status (1)
| Country | Link |
|---|---|
| US (1) | US9827445B2 (en) |
Cited By (79)
| Publication number | Priority date | Publication date | Assignee | Title |
|---|---|---|---|---|
| US20170087382A1 (en) * | 2015-09-25 | 2017-03-30 | Varian Medical Systems International Ag | Apparatus and method using automatic generation of a base dose |
| US10159851B2 (en) * | 2013-05-21 | 2018-12-25 | Varian Medical Systems International SG | Systems and methods for automatic training of dose prediction models and treatment plans as a cloud service |
| US10702708B2 (en) * | 2015-09-25 | 2020-07-07 | Varian Medical Systems, Inc. | Accounting for imaging-based radiation doses |
| WO2020200849A1 (en) | 2019-03-29 | 2020-10-08 | Varian Medical Systems International Ag | Using isodose surfaces for optimizing dose distribution in radiation treatment planning |
| US11173323B2 (en) * | 2018-07-27 | 2021-11-16 | Reshma Munbodh | Computer-implemented method of evaluating a protocol for radiation therapy including a pre-treatment physics chart review (TPCR) |
| US20210387017A1 (en) * | 2020-06-11 | 2021-12-16 | Varian Medical Systems International Ag | Method and Apparatus to Facilitate Administering Therapeutic Radiation to a Patient |
| US20220001205A1 (en) * | 2020-07-02 | 2022-01-06 | Varian Medical Systems International Ag | Methods and apparatus pertaining to radiation treatment plans |
| US20220288460A1 (en) * | 2019-10-03 | 2022-09-15 | Rom Technologies, Inc. | Method and system for using artificial intelligence to assign patients to cohorts and dynamically controlling a treatment apparatus based on the assignment during an adaptive telemedical session |
| US20220314027A1 (en) * | 2021-03-30 | 2022-10-06 | Hitachi, Ltd. | Treatment planning system, treatment planning generation method, and recording medium |
| US20230158334A1 (en) * | 2020-04-09 | 2023-05-25 | Raysearch Laboratories Ab (Publ) | A method of generating a radiotherapy treatment plan for a patient, a computer program product and a computer system |
| US20230178193A1 (en) * | 2021-11-15 | 2023-06-08 | Koninklijke Philips N.V. | System and method for processing data |
| US20230293906A1 (en) * | 2017-07-28 | 2023-09-21 | Varian Medical Systems International Ag | Apparatus to Facilitate the Administration of a Knowledge-Based Radiation Treatment Plan |
| US11887717B2 (en) | 2019-10-03 | 2024-01-30 | Rom Technologies, Inc. | System and method for using AI, machine learning and telemedicine to perform pulmonary rehabilitation via an electromechanical machine |
| US11896540B2 (en) | 2019-06-24 | 2024-02-13 | Rehab2Fit Technologies, Inc. | Method and system for implementing an exercise protocol for osteogenesis and/or muscular hypertrophy |
| US11904207B2 (en) | 2019-05-10 | 2024-02-20 | Rehab2Fit Technologies, Inc. | Method and system for using artificial intelligence to present a user interface representing a user's progress in various domains |
| US11915815B2 (en) | 2019-10-03 | 2024-02-27 | Rom Technologies, Inc. | System and method for using artificial intelligence and machine learning and generic risk factors to improve cardiovascular health such that the need for additional cardiac interventions is mitigated |
| US11915816B2 (en) | 2019-10-03 | 2024-02-27 | Rom Technologies, Inc. | Systems and methods of using artificial intelligence and machine learning in a telemedical environment to predict user disease states |
| US11923065B2 (en) | 2019-10-03 | 2024-03-05 | Rom Technologies, Inc. | Systems and methods for using artificial intelligence and machine learning to detect abnormal heart rhythms of a user performing a treatment plan with an electromechanical machine |
| US11923057B2 (en) | 2019-10-03 | 2024-03-05 | Rom Technologies, Inc. | Method and system using artificial intelligence to monitor user characteristics during a telemedicine session |
| US11942205B2 (en) | 2019-10-03 | 2024-03-26 | Rom Technologies, Inc. | Method and system for using virtual avatars associated with medical professionals during exercise sessions |
| US11955220B2 (en) | 2019-10-03 | 2024-04-09 | Rom Technologies, Inc. | System and method for using AI/ML and telemedicine for invasive surgical treatment to determine a cardiac treatment plan that uses an electromechanical machine |
| US11955222B2 (en) | 2019-10-03 | 2024-04-09 | Rom Technologies, Inc. | System and method for determining, based on advanced metrics of actual performance of an electromechanical machine, medical procedure eligibility in order to ascertain survivability rates and measures of quality-of-life criteria |
| US11950861B2 (en) | 2019-10-03 | 2024-04-09 | Rom Technologies, Inc. | Telemedicine for orthopedic treatment |
| US11955223B2 (en) | 2019-10-03 | 2024-04-09 | Rom Technologies, Inc. | System and method for using artificial intelligence and machine learning to provide an enhanced user interface presenting data pertaining to cardiac health, bariatric health, pulmonary health, and/or cardio-oncologic health for the purpose of performing preventative actions |
| US11951359B2 (en) | 2019-05-10 | 2024-04-09 | Rehab2Fit Technologies, Inc. | Method and system for using artificial intelligence to independently adjust resistance of pedals based on leg strength |
| US11955218B2 (en) | 2019-10-03 | 2024-04-09 | Rom Technologies, Inc. | System and method for use of telemedicine-enabled rehabilitative hardware and for encouraging rehabilitative compliance through patient-based virtual shared sessions with patient-enabled mutual encouragement across simulated social networks |
| US11955221B2 (en) | 2019-10-03 | 2024-04-09 | Rom Technologies, Inc. | System and method for using AI/ML to generate treatment plans to stimulate preferred angiogenesis |
| US11957960B2 (en) | 2019-05-10 | 2024-04-16 | Rehab2Fit Technologies Inc. | Method and system for using artificial intelligence to adjust pedal resistance |
| US11961603B2 (en) | 2019-10-03 | 2024-04-16 | Rom Technologies, Inc. | System and method for using AI ML and telemedicine to perform bariatric rehabilitation via an electromechanical machine |
| US11957956B2 (en) | 2019-05-10 | 2024-04-16 | Rehab2Fit Technologies, Inc. | System, method and apparatus for rehabilitation and exercise |
| US11978559B2 (en) | 2019-10-03 | 2024-05-07 | Rom Technologies, Inc. | Systems and methods for remotely-enabled identification of a user infection |
| US12020799B2 (en) | 2019-10-03 | 2024-06-25 | Rom Technologies, Inc. | Rowing machines, systems including rowing machines, and methods for using rowing machines to perform treatment plans for rehabilitation |
| US12020800B2 (en) | 2019-10-03 | 2024-06-25 | Rom Technologies, Inc. | System and method for using AI/ML and telemedicine to integrate rehabilitation for a plurality of comorbid conditions |
| US12029940B2 (en) | 2019-03-11 | 2024-07-09 | Rom Technologies, Inc. | Single sensor wearable device for monitoring joint extension and flexion |
| US12057237B2 (en) | 2020-04-23 | 2024-08-06 | Rom Technologies, Inc. | Method and system for describing and recommending optimal treatment plans in adaptive telemedical or other contexts |
| US12062425B2 (en) | 2019-10-03 | 2024-08-13 | Rom Technologies, Inc. | System and method for implementing a cardiac rehabilitation protocol by using artificial intelligence and standardized measurements |
| US12100499B2 (en) | 2020-08-06 | 2024-09-24 | Rom Technologies, Inc. | Method and system for using artificial intelligence and machine learning to create optimal treatment plans based on monetary value amount generated and/or patient outcome |
| US12096997B2 (en) | 2019-10-03 | 2024-09-24 | Rom Technologies, Inc. | Method and system for treating patients via telemedicine using sensor data from rehabilitation or exercise equipment |
| US12102878B2 (en) | 2019-05-10 | 2024-10-01 | Rehab2Fit Technologies, Inc. | Method and system for using artificial intelligence to determine a user's progress during interval training |
| US12154672B2 (en) | 2019-10-03 | 2024-11-26 | Rom Technologies, Inc. | Method and system for implementing dynamic treatment environments based on patient information |
| US12150792B2 (en) | 2019-10-03 | 2024-11-26 | Rom Technologies, Inc. | Augmented reality placement of goniometer or other sensors |
| US12165768B2 (en) | 2019-10-03 | 2024-12-10 | Rom Technologies, Inc. | Method and system for use of telemedicine-enabled rehabilitative equipment for prediction of secondary disease |
| US12176091B2 (en) | 2019-10-03 | 2024-12-24 | Rom Technologies, Inc. | Systems and methods for using elliptical machine to perform cardiovascular rehabilitation |
| US12176089B2 (en) | 2019-10-03 | 2024-12-24 | Rom Technologies, Inc. | System and method for using AI ML and telemedicine for cardio-oncologic rehabilitation via an electromechanical machine |
| US12183447B2 (en) | 2019-10-03 | 2024-12-31 | Rom Technologies, Inc. | Method and system for creating an immersive enhanced reality-driven exercise experience for a user |
| US12191018B2 (en) | 2019-10-03 | 2025-01-07 | Rom Technologies, Inc. | System and method for using artificial intelligence in telemedicine-enabled hardware to optimize rehabilitative routines capable of enabling remote rehabilitative compliance |
| US12191021B2 (en) | 2019-10-03 | 2025-01-07 | Rom Technologies, Inc. | System and method for use of telemedicine-enabled rehabilitative hardware and for encouragement of rehabilitative compliance through patient-based virtual shared sessions |
| US12217865B2 (en) | 2019-10-03 | 2025-02-04 | Rom Technologies, Inc. | Method and system for enabling physician-smart virtual conference rooms for use in a telehealth context |
| US12220201B2 (en) | 2019-10-03 | 2025-02-11 | Rom Technologies, Inc. | Remote examination through augmented reality |
| US12224052B2 (en) | 2019-10-03 | 2025-02-11 | Rom Technologies, Inc. | System and method for using AI, machine learning and telemedicine for long-term care via an electromechanical machine |
| US12226671B2 (en) | 2019-03-11 | 2025-02-18 | Rom Technologies, Inc. | System, method and apparatus for electrically actuated pedal for an exercise or rehabilitation machine |
| US12230381B2 (en) | 2019-10-03 | 2025-02-18 | Rom Technologies, Inc. | System and method for an enhanced healthcare professional user interface displaying measurement information for a plurality of users |
| US12230382B2 (en) | 2019-10-03 | 2025-02-18 | Rom Technologies, Inc. | Systems and methods for using artificial intelligence and machine learning to predict a probability of an undesired medical event occurring during a treatment plan |
| US12249410B2 (en) | 2019-10-03 | 2025-03-11 | Rom Technologies, Inc. | System and method for use of treatment device to reduce pain medication dependency |
| US12283356B2 (en) | 2019-10-03 | 2025-04-22 | Rom Technologies, Inc. | System and method for processing medical claims using biometric signatures |
| US12285654B2 (en) | 2019-05-10 | 2025-04-29 | Rom Technologies, Inc. | Method and system for using artificial intelligence to interact with a user of an exercise device during an exercise session |
| US12301663B2 (en) | 2019-10-03 | 2025-05-13 | Rom Technologies, Inc. | System and method for transmitting data and ordering asynchronous data |
| US12327623B2 (en) | 2019-10-03 | 2025-06-10 | Rom Technologies, Inc. | System and method for processing medical claims |
| US12340884B2 (en) | 2019-10-03 | 2025-06-24 | Rom Technologies, Inc. | Method and system to analytically optimize telehealth practice-based billing processes and revenue while enabling regulatory compliance |
| US12347543B2 (en) | 2019-10-03 | 2025-07-01 | Rom Technologies, Inc. | Systems and methods for using artificial intelligence to implement a cardio protocol via a relay-based system |
| US12347558B2 (en) | 2019-10-03 | 2025-07-01 | Rom Technologies, Inc. | Method and system for using artificial intelligence and machine learning to provide recommendations to a healthcare provider in or near real-time during a telemedicine session |
| US12357195B2 (en) | 2020-06-26 | 2025-07-15 | Rom Technologies, Inc. | System, method and apparatus for anchoring an electronic device and measuring a joint angle |
| US12367960B2 (en) | 2020-09-15 | 2025-07-22 | Rom Technologies, Inc. | System and method for using AI ML and telemedicine to perform bariatric rehabilitation via an electromechanical machine |
| US12380984B2 (en) | 2019-10-03 | 2025-08-05 | Rom Technologies, Inc. | Systems and methods for using artificial intelligence and machine learning to generate treatment plans having dynamically tailored cardiac protocols for users to manage a state of an electromechanical machine |
| US12390689B2 (en) | 2019-10-21 | 2025-08-19 | Rom Technologies, Inc. | Persuasive motivation for orthopedic treatment |
| US12402804B2 (en) | 2019-09-17 | 2025-09-02 | Rom Technologies, Inc. | Wearable device for coupling to a user, and measuring and monitoring user activity |
| US12420143B1 (en) | 2019-10-03 | 2025-09-23 | Rom Technologies, Inc. | System and method for enabling residentially-based cardiac rehabilitation by using an electromechanical machine and educational content to mitigate risk factors and optimize user behavior |
| US12420145B2 (en) | 2019-10-03 | 2025-09-23 | Rom Technologies, Inc. | Systems and methods of using artificial intelligence and machine learning for generating alignment plans to align a user with an imaging sensor during a treatment session |
| US12424319B2 (en) | 2019-11-06 | 2025-09-23 | Rom Technologies, Inc. | System for remote treatment utilizing privacy controls |
| US12427376B2 (en) | 2019-10-03 | 2025-09-30 | Rom Technologies, Inc. | Systems and methods for an artificial intelligence engine to optimize a peak performance |
| US12469587B2 (en) | 2019-10-03 | 2025-11-11 | Rom Technologies, Inc. | Systems and methods for assigning healthcare professionals to remotely monitor users performing treatment plans on electromechanical machines |
| US12478837B2 (en) | 2019-10-03 | 2025-11-25 | Rom Technologies, Inc. | Method and system for monitoring actual patient treatment progress using sensor data |
| US12515104B2 (en) | 2020-10-28 | 2026-01-06 | Rom Technologies, Inc. | Systems and methods for using machine learning to control a rehabilitation and exercise electromechanical device |
| US12539446B2 (en) | 2019-10-03 | 2026-02-03 | Rom Technologies, Inc. | Method and system for using sensors to optimize a user treatment plan in a telemedicine environment |
| US12548656B2 (en) | 2019-10-03 | 2026-02-10 | Rom Technologies, Inc. | System and method for an enhanced patient user interface displaying real-time measurement information during a telemedicine session |
| US12555667B2 (en) | 2019-10-03 | 2026-02-17 | Rom Technologies, Inc. | Systems and methods for using AI/ML and for cardiac and pulmonary treatment via an electromechanical machine related to urologic disorders and antecedents and sequelae of certain urologic surgeries |
| US12558594B2 (en) | 2019-10-03 | 2026-02-24 | Rom Technologies, Inc. | Systems and methods for using machine learning to control an electromechanical device used for prehabilitation, rehabilitation, and/or exercise |
| US12562271B2 (en) | 2019-11-06 | 2026-02-24 | Rom Technologies, Inc. | System for remote treatment utilizing privacy controls |
| US12558593B2 (en) | 2019-05-15 | 2026-02-24 | Rom Technologies, Inc. | System and method for using an exercise machine to improve completion of an exercise |
Families Citing this family (19)
| Publication number | Priority date | Publication date | Assignee | Title |
|---|---|---|---|---|
| WO2015176011A1 (en) * | 2014-05-15 | 2015-11-19 | The Johns Hopkins University | Method, system and computer-readable media for treatment plan risk analysis |
| GB2539261A (en) * | 2015-06-12 | 2016-12-14 | Elekta ltd | Improvements in Dosimetry Techniques for Radiotherapy |
| GB2543731A (en) | 2015-06-12 | 2017-05-03 | Elekta ltd | Improvements in dosimetry techniques for radiotherapy |
| US11056243B2 (en) * | 2015-12-21 | 2021-07-06 | Elekta Ab (Publ) | Systems and methods for optimizing treatment planning |
| US10850120B2 (en) * | 2016-12-27 | 2020-12-01 | Varian Medical Systems International Ag | Selecting a dose prediction model based on clinical goals |
| US10512790B2 (en) | 2017-01-11 | 2019-12-24 | Varian Medical Systems International Ag. | Systems and methods for generating radiation treatment plans |
| US10188873B2 (en) * | 2017-03-22 | 2019-01-29 | Varian Medical Systems International Ag | Systems and methods for dose calculation in generating radiation treatment plans |
| EP3395405B1 (en) * | 2017-04-24 | 2021-10-13 | RaySearch Laboratories AB | System and method for radiation therapy treatment planning |
| CN107908925A (en) * | 2017-11-17 | 2018-04-13 | 中国电子科技集团公司第十四研究所 | A kind of increment of rotation occupy-place formula moving-target label automatic avoiding method |
| US10828509B2 (en) * | 2018-02-13 | 2020-11-10 | Varian Medical Systems International Ag | Optimizing radiation dose to overlapping structures |
| WO2019174898A1 (en) * | 2018-03-14 | 2019-09-19 | Koninklijke Philips N.V. | Identifying treatment protocols |
| US12508446B2 (en) * | 2019-05-15 | 2025-12-30 | Elekta Ab (Publ) | Machine learning based dose guided real-time adaptive radiotherapy |
| CN110327554B (en) * | 2019-07-08 | 2020-11-10 | 南方医科大学 | Intensity modulated radiotherapy plan optimization method based on predicted dose distribution guidance and application |
| US11580390B2 (en) * | 2020-01-22 | 2023-02-14 | Canon Medical Systems Corporation | Data processing apparatus and method |
| US11537912B2 (en) | 2020-02-19 | 2022-12-27 | Varian Medical Systems International Ag | Generating and applying robust dose prediction models |
| EP3936187A1 (en) * | 2020-07-09 | 2022-01-12 | Koninklijke Philips N.V. | An artificial intelligence system to support adaptive radiotherapy |
| WO2022077160A1 (en) * | 2020-10-12 | 2022-04-21 | Elekta (Shanghai) Technology Co., Ltd. | Evaluation and presentation of robustness of treatment plan |
| EP4257181B1 (en) * | 2022-04-05 | 2025-08-20 | RaySearch Laboratories AB | Methods and system related to radiotherapy treatment planning |
| US12564732B2 (en) * | 2022-11-09 | 2026-03-03 | Xiangya Hospital Central South University | Tumor radiotherapy planning design method and apparatus, electronic device and storage medium |
Citations (22)
| Publication number | Priority date | Publication date | Assignee | Title |
|---|---|---|---|---|
| US20030177039A1 (en) * | 2002-02-13 | 2003-09-18 | Nicholas Joseph A. | Method of outsourcing IMRT services |
| US20050131738A1 (en) * | 2002-05-15 | 2005-06-16 | Morris Tommy J. | System and method for handling medical information |
| WO2006126109A1 (en) * | 2005-05-26 | 2006-11-30 | Koninklijke Philips Electronics, N.V. | Radio-therapeutic treatment planning incorporating functional imaging information |
| US20090154644A1 (en) * | 2007-12-12 | 2009-06-18 | Varian Medical Systems International Ag | Treatment planning system and method for radiotherapy |
| US20090240523A1 (en) * | 2008-03-24 | 2009-09-24 | International Business Machines Corporation | Optimizing pharmaceutical treatment plans across multiple dimensions |
| US20090299766A1 (en) * | 2008-05-30 | 2009-12-03 | International Business Machines Corporation | System and method for optimizing medical treatment planning and support in difficult situations subject to multiple constraints and uncertainties |
| US20100204920A1 (en) | 2005-04-25 | 2010-08-12 | Caduceus Information Systems Inc. | System for development of individualised treatment regimens |
| US7796731B2 (en) | 2008-08-22 | 2010-09-14 | Varian Medical Systems International Ag | Leaf sequencing algorithm for moving targets |
| US7801270B2 (en) | 2008-06-19 | 2010-09-21 | Varian Medical Systems International Ag | Treatment plan optimization method for radiation therapy |
| US7809107B2 (en) | 2008-06-30 | 2010-10-05 | Varian Medical Systems International Ag | Method for controlling modulation strength in radiation therapy |
| US7817778B2 (en) | 2008-08-29 | 2010-10-19 | Varian Medical Systems International Ag | Interactive treatment plan optimization for radiation therapy |
| US20100303205A1 (en) * | 2009-05-26 | 2010-12-02 | Agile Planet Inc | System and Method for Radiation Therapy Imaging and Treatment Workflow Scheduling and Optimization |
| US20110082712A1 (en) * | 2009-10-01 | 2011-04-07 | DecisionQ Corporation | Application of bayesian networks to patient screening and treatment |
| US20110106749A1 (en) | 2006-04-17 | 2011-05-05 | Siemens Medical Solutions Usa, Inc. | Personalized Prognosis Modeling in Medical Treatment Planning |
| US8009804B2 (en) | 2009-10-20 | 2011-08-30 | Varian Medical Systems International Ag | Dose calculation method for multiple fields |
| US20120016690A1 (en) | 2010-07-16 | 2012-01-19 | Navya Network Inc. | Treatment related quantitative decision engine |
| CA2813643A1 (en) | 2010-10-06 | 2012-04-12 | Thomas G. Purdie | Methods and systems for automated planning of radiation therapy |
| US20120136194A1 (en) | 2010-08-17 | 2012-05-31 | Xiaodong Zhang | Automated treatment planning for radiation therapy |
| US20120310615A1 (en) * | 2011-06-03 | 2012-12-06 | Moore Kevin L | Developing predictive dose-volume relationships for a radiotherapy treatment |
| US8331532B2 (en) | 2010-02-18 | 2012-12-11 | Varian Medical Systems International Ag | Method and system for treating moving target |
| US20130077752A1 (en) * | 2011-09-28 | 2013-03-28 | Corey Zankowski | Radiation therapy treatment plan improvement through use of knowledge base |
| US20130085343A1 (en) | 2011-09-30 | 2013-04-04 | Lasse Toimela | Semantic radiation treatment plan optimization guidance |
-
2013
- 2013-09-27 US US14/040,468 patent/US9827445B2/en active Active
Patent Citations (23)
| Publication number | Priority date | Publication date | Assignee | Title |
|---|---|---|---|---|
| US20030177039A1 (en) * | 2002-02-13 | 2003-09-18 | Nicholas Joseph A. | Method of outsourcing IMRT services |
| US20050131738A1 (en) * | 2002-05-15 | 2005-06-16 | Morris Tommy J. | System and method for handling medical information |
| US20100204920A1 (en) | 2005-04-25 | 2010-08-12 | Caduceus Information Systems Inc. | System for development of individualised treatment regimens |
| WO2006126109A1 (en) * | 2005-05-26 | 2006-11-30 | Koninklijke Philips Electronics, N.V. | Radio-therapeutic treatment planning incorporating functional imaging information |
| US20110106749A1 (en) | 2006-04-17 | 2011-05-05 | Siemens Medical Solutions Usa, Inc. | Personalized Prognosis Modeling in Medical Treatment Planning |
| US20090154644A1 (en) * | 2007-12-12 | 2009-06-18 | Varian Medical Systems International Ag | Treatment planning system and method for radiotherapy |
| US8085899B2 (en) | 2007-12-12 | 2011-12-27 | Varian Medical Systems International Ag | Treatment planning system and method for radiotherapy |
| US20090240523A1 (en) * | 2008-03-24 | 2009-09-24 | International Business Machines Corporation | Optimizing pharmaceutical treatment plans across multiple dimensions |
| US20090299766A1 (en) * | 2008-05-30 | 2009-12-03 | International Business Machines Corporation | System and method for optimizing medical treatment planning and support in difficult situations subject to multiple constraints and uncertainties |
| US7801270B2 (en) | 2008-06-19 | 2010-09-21 | Varian Medical Systems International Ag | Treatment plan optimization method for radiation therapy |
| US7809107B2 (en) | 2008-06-30 | 2010-10-05 | Varian Medical Systems International Ag | Method for controlling modulation strength in radiation therapy |
| US7796731B2 (en) | 2008-08-22 | 2010-09-14 | Varian Medical Systems International Ag | Leaf sequencing algorithm for moving targets |
| US7817778B2 (en) | 2008-08-29 | 2010-10-19 | Varian Medical Systems International Ag | Interactive treatment plan optimization for radiation therapy |
| US20100303205A1 (en) * | 2009-05-26 | 2010-12-02 | Agile Planet Inc | System and Method for Radiation Therapy Imaging and Treatment Workflow Scheduling and Optimization |
| US20110082712A1 (en) * | 2009-10-01 | 2011-04-07 | DecisionQ Corporation | Application of bayesian networks to patient screening and treatment |
| US8009804B2 (en) | 2009-10-20 | 2011-08-30 | Varian Medical Systems International Ag | Dose calculation method for multiple fields |
| US8331532B2 (en) | 2010-02-18 | 2012-12-11 | Varian Medical Systems International Ag | Method and system for treating moving target |
| US20120016690A1 (en) | 2010-07-16 | 2012-01-19 | Navya Network Inc. | Treatment related quantitative decision engine |
| US20120136194A1 (en) | 2010-08-17 | 2012-05-31 | Xiaodong Zhang | Automated treatment planning for radiation therapy |
| CA2813643A1 (en) | 2010-10-06 | 2012-04-12 | Thomas G. Purdie | Methods and systems for automated planning of radiation therapy |
| US20120310615A1 (en) * | 2011-06-03 | 2012-12-06 | Moore Kevin L | Developing predictive dose-volume relationships for a radiotherapy treatment |
| US20130077752A1 (en) * | 2011-09-28 | 2013-03-28 | Corey Zankowski | Radiation therapy treatment plan improvement through use of knowledge base |
| US20130085343A1 (en) | 2011-09-30 | 2013-04-04 | Lasse Toimela | Semantic radiation treatment plan optimization guidance |
Non-Patent Citations (9)
| Title |
|---|
| Appenzoller, Lindsey, M., et al., "Predicting dose-volume histograms for organs-at-risk in IMRT planning," Med. Phys., Dec. 2012, vol. 39, No. 12, pp. 7446-7461. |
| International Search Report and Written Opinion dated Mar. 6, 2015 in PCT/IB2014/064936, 11 pages. |
| Office Action dated Jul. 31, 2015 in U.S. Appl. No. 14/040,479, 15 pages. |
| U.S. Appl. No. 14/040,479 (unpublished), filed Sep. 27, 2013, entitled "Decision Support Tool for Choosing Treatment Plans," 39 pages. |
| U.S. Appl. No. 14/040,479, "Final Office Action", dated Dec. 23, 2016, 26 Pages. |
| U.S. Appl. No. 14/040,479, Non-Final Office Action dated May 19, 2016, 23 pages. |
| Yuan, Lulin, et al., "Quantitative analysis of the factors which affect the interpatient organ-at-risk dose sparing variation in IMRT plans," Med. Phys., Nov. 2012, vol. 39, No. 11, pp. 6868-6878. |
| Zhu, Xiaofeng, "A planning quality evaluation tool for prostate adaptive IMRT based on machine learning," Feb. 2011, Med. Phys. 38(2), pp. 719-726. * |
| Zhu, Xiaofeng, "A planning quality evaluation tool for prostate adaptive IMRT based on machine learning," Med. Phys. 38(2), Feb. 2011. * |
Cited By (105)
| Publication number | Priority date | Publication date | Assignee | Title |
|---|---|---|---|---|
| US10159851B2 (en) * | 2013-05-21 | 2018-12-25 | Varian Medical Systems International SG | Systems and methods for automatic training of dose prediction models and treatment plans as a cloud service |
| US10252081B2 (en) * | 2015-09-25 | 2019-04-09 | Varian Medical Systems International Ag | Apparatus and method using automatic generation of a base dose |
| US10702708B2 (en) * | 2015-09-25 | 2020-07-07 | Varian Medical Systems, Inc. | Accounting for imaging-based radiation doses |
| US11191978B2 (en) | 2015-09-25 | 2021-12-07 | Varian Medical Systems International Ag | Apparatus and method using automatic generation of a base dose |
| US20170087382A1 (en) * | 2015-09-25 | 2017-03-30 | Varian Medical Systems International Ag | Apparatus and method using automatic generation of a base dose |
| US12491377B2 (en) * | 2017-07-28 | 2025-12-09 | Siemens Healthineers International Ag | Apparatus comprising a memory, a control circuit, a user interface, and a radiation treatment platform to facilitate an administration of a knowledge-based radiation treatment plan |
| US20230293906A1 (en) * | 2017-07-28 | 2023-09-21 | Varian Medical Systems International Ag | Apparatus to Facilitate the Administration of a Knowledge-Based Radiation Treatment Plan |
| US11173323B2 (en) * | 2018-07-27 | 2021-11-16 | Reshma Munbodh | Computer-implemented method of evaluating a protocol for radiation therapy including a pre-treatment physics chart review (TPCR) |
| US12059591B2 (en) | 2019-03-11 | 2024-08-13 | Rom Technologies, Inc. | Bendable sensor device for monitoring joint extension and flexion |
| US12226671B2 (en) | 2019-03-11 | 2025-02-18 | Rom Technologies, Inc. | System, method and apparatus for electrically actuated pedal for an exercise or rehabilitation machine |
| US12083380B2 (en) | 2019-03-11 | 2024-09-10 | Rom Technologies, Inc. | Bendable sensor device for monitoring joint extension and flexion |
| US12083381B2 (en) | 2019-03-11 | 2024-09-10 | Rom Technologies, Inc. | Bendable sensor device for monitoring joint extension and flexion |
| US12029940B2 (en) | 2019-03-11 | 2024-07-09 | Rom Technologies, Inc. | Single sensor wearable device for monitoring joint extension and flexion |
| US12186623B2 (en) | 2019-03-11 | 2025-01-07 | Rom Technologies, Inc. | Monitoring joint extension and flexion using a sensor device securable to an upper and lower limb |
| US12226670B2 (en) | 2019-03-11 | 2025-02-18 | Rom Technologies, Inc. | System, method and apparatus for electrically actuated pedal for an exercise or rehabilitation machine |
| WO2020200849A1 (en) | 2019-03-29 | 2020-10-08 | Varian Medical Systems International Ag | Using isodose surfaces for optimizing dose distribution in radiation treatment planning |
| US12102878B2 (en) | 2019-05-10 | 2024-10-01 | Rehab2Fit Technologies, Inc. | Method and system for using artificial intelligence to determine a user's progress during interval training |
| US11904207B2 (en) | 2019-05-10 | 2024-02-20 | Rehab2Fit Technologies, Inc. | Method and system for using artificial intelligence to present a user interface representing a user's progress in various domains |
| US12285654B2 (en) | 2019-05-10 | 2025-04-29 | Rom Technologies, Inc. | Method and system for using artificial intelligence to interact with a user of an exercise device during an exercise session |
| US12324961B2 (en) | 2019-05-10 | 2025-06-10 | Rom Technologies, Inc. | Method and system for using artificial intelligence to present a user interface representing a user's progress in various domains |
| US11951359B2 (en) | 2019-05-10 | 2024-04-09 | Rehab2Fit Technologies, Inc. | Method and system for using artificial intelligence to independently adjust resistance of pedals based on leg strength |
| US11957956B2 (en) | 2019-05-10 | 2024-04-16 | Rehab2Fit Technologies, Inc. | System, method and apparatus for rehabilitation and exercise |
| US11957960B2 (en) | 2019-05-10 | 2024-04-16 | Rehab2Fit Technologies Inc. | Method and system for using artificial intelligence to adjust pedal resistance |
| US12558593B2 (en) | 2019-05-15 | 2026-02-24 | Rom Technologies, Inc. | System and method for using an exercise machine to improve completion of an exercise |
| US11896540B2 (en) | 2019-06-24 | 2024-02-13 | Rehab2Fit Technologies, Inc. | Method and system for implementing an exercise protocol for osteogenesis and/or muscular hypertrophy |
| US12402804B2 (en) | 2019-09-17 | 2025-09-02 | Rom Technologies, Inc. | Wearable device for coupling to a user, and measuring and monitoring user activity |
| US12402805B2 (en) | 2019-09-17 | 2025-09-02 | Rom Technologies, Inc. | Wearable device for coupling to a user, and measuring and monitoring user activity |
| US12495987B2 (en) | 2019-09-17 | 2025-12-16 | Rom Technologies, Inc. | Wearable device for coupling to a user, and measuring and monitoring user activity |
| US12183447B2 (en) | 2019-10-03 | 2024-12-31 | Rom Technologies, Inc. | Method and system for creating an immersive enhanced reality-driven exercise experience for a user |
| US12283356B2 (en) | 2019-10-03 | 2025-04-22 | Rom Technologies, Inc. | System and method for processing medical claims using biometric signatures |
| US11955221B2 (en) | 2019-10-03 | 2024-04-09 | Rom Technologies, Inc. | System and method for using AI/ML to generate treatment plans to stimulate preferred angiogenesis |
| US11955223B2 (en) | 2019-10-03 | 2024-04-09 | Rom Technologies, Inc. | System and method for using artificial intelligence and machine learning to provide an enhanced user interface presenting data pertaining to cardiac health, bariatric health, pulmonary health, and/or cardio-oncologic health for the purpose of performing preventative actions |
| US11961603B2 (en) | 2019-10-03 | 2024-04-16 | Rom Technologies, Inc. | System and method for using AI ML and telemedicine to perform bariatric rehabilitation via an electromechanical machine |
| US11950861B2 (en) | 2019-10-03 | 2024-04-09 | Rom Technologies, Inc. | Telemedicine for orthopedic treatment |
| US11978559B2 (en) | 2019-10-03 | 2024-05-07 | Rom Technologies, Inc. | Systems and methods for remotely-enabled identification of a user infection |
| US12020799B2 (en) | 2019-10-03 | 2024-06-25 | Rom Technologies, Inc. | Rowing machines, systems including rowing machines, and methods for using rowing machines to perform treatment plans for rehabilitation |
| US12020800B2 (en) | 2019-10-03 | 2024-06-25 | Rom Technologies, Inc. | System and method for using AI/ML and telemedicine to integrate rehabilitation for a plurality of comorbid conditions |
| US11955222B2 (en) | 2019-10-03 | 2024-04-09 | Rom Technologies, Inc. | System and method for determining, based on advanced metrics of actual performance of an electromechanical machine, medical procedure eligibility in order to ascertain survivability rates and measures of quality-of-life criteria |
| US12562243B2 (en) | 2019-10-03 | 2026-02-24 | Rom Technologies, Inc. | System and method for processing medical claims using biometric signatures |
| US11955220B2 (en) | 2019-10-03 | 2024-04-09 | Rom Technologies, Inc. | System and method for using AI/ML and telemedicine for invasive surgical treatment to determine a cardiac treatment plan that uses an electromechanical machine |
| US12062425B2 (en) | 2019-10-03 | 2024-08-13 | Rom Technologies, Inc. | System and method for implementing a cardiac rehabilitation protocol by using artificial intelligence and standardized measurements |
| US12558594B2 (en) | 2019-10-03 | 2026-02-24 | Rom Technologies, Inc. | Systems and methods for using machine learning to control an electromechanical device used for prehabilitation, rehabilitation, and/or exercise |
| US11942205B2 (en) | 2019-10-03 | 2024-03-26 | Rom Technologies, Inc. | Method and system for using virtual avatars associated with medical professionals during exercise sessions |
| US11923057B2 (en) | 2019-10-03 | 2024-03-05 | Rom Technologies, Inc. | Method and system using artificial intelligence to monitor user characteristics during a telemedicine session |
| US12555667B2 (en) | 2019-10-03 | 2026-02-17 | Rom Technologies, Inc. | Systems and methods for using AI/ML and for cardiac and pulmonary treatment via an electromechanical machine related to urologic disorders and antecedents and sequelae of certain urologic surgeries |
| US12096997B2 (en) | 2019-10-03 | 2024-09-24 | Rom Technologies, Inc. | Method and system for treating patients via telemedicine using sensor data from rehabilitation or exercise equipment |
| US11923065B2 (en) | 2019-10-03 | 2024-03-05 | Rom Technologies, Inc. | Systems and methods for using artificial intelligence and machine learning to detect abnormal heart rhythms of a user performing a treatment plan with an electromechanical machine |
| US12154672B2 (en) | 2019-10-03 | 2024-11-26 | Rom Technologies, Inc. | Method and system for implementing dynamic treatment environments based on patient information |
| US12150792B2 (en) | 2019-10-03 | 2024-11-26 | Rom Technologies, Inc. | Augmented reality placement of goniometer or other sensors |
| US12165768B2 (en) | 2019-10-03 | 2024-12-10 | Rom Technologies, Inc. | Method and system for use of telemedicine-enabled rehabilitative equipment for prediction of secondary disease |
| US12176091B2 (en) | 2019-10-03 | 2024-12-24 | Rom Technologies, Inc. | Systems and methods for using elliptical machine to perform cardiovascular rehabilitation |
| US12176089B2 (en) | 2019-10-03 | 2024-12-24 | Rom Technologies, Inc. | System and method for using AI ML and telemedicine for cardio-oncologic rehabilitation via an electromechanical machine |
| US11915816B2 (en) | 2019-10-03 | 2024-02-27 | Rom Technologies, Inc. | Systems and methods of using artificial intelligence and machine learning in a telemedical environment to predict user disease states |
| US12191018B2 (en) | 2019-10-03 | 2025-01-07 | Rom Technologies, Inc. | System and method for using artificial intelligence in telemedicine-enabled hardware to optimize rehabilitative routines capable of enabling remote rehabilitative compliance |
| US11915815B2 (en) | 2019-10-03 | 2024-02-27 | Rom Technologies, Inc. | System and method for using artificial intelligence and machine learning and generic risk factors to improve cardiovascular health such that the need for additional cardiac interventions is mitigated |
| US12191021B2 (en) | 2019-10-03 | 2025-01-07 | Rom Technologies, Inc. | System and method for use of telemedicine-enabled rehabilitative hardware and for encouragement of rehabilitative compliance through patient-based virtual shared sessions |
| US12217865B2 (en) | 2019-10-03 | 2025-02-04 | Rom Technologies, Inc. | Method and system for enabling physician-smart virtual conference rooms for use in a telehealth context |
| US12220201B2 (en) | 2019-10-03 | 2025-02-11 | Rom Technologies, Inc. | Remote examination through augmented reality |
| US12224052B2 (en) | 2019-10-03 | 2025-02-11 | Rom Technologies, Inc. | System and method for using AI, machine learning and telemedicine for long-term care via an electromechanical machine |
| US12220202B2 (en) | 2019-10-03 | 2025-02-11 | Rom Technologies, Inc. | Remote examination through augmented reality |
| US12230383B2 (en) | 2019-10-03 | 2025-02-18 | Rom Technologies, Inc. | United states systems and methods for using elliptical machine to perform cardiovascular rehabilitation |
| US11887717B2 (en) | 2019-10-03 | 2024-01-30 | Rom Technologies, Inc. | System and method for using AI, machine learning and telemedicine to perform pulmonary rehabilitation via an electromechanical machine |
| US12548656B2 (en) | 2019-10-03 | 2026-02-10 | Rom Technologies, Inc. | System and method for an enhanced patient user interface displaying real-time measurement information during a telemedicine session |
| US12230381B2 (en) | 2019-10-03 | 2025-02-18 | Rom Technologies, Inc. | System and method for an enhanced healthcare professional user interface displaying measurement information for a plurality of users |
| US12230382B2 (en) | 2019-10-03 | 2025-02-18 | Rom Technologies, Inc. | Systems and methods for using artificial intelligence and machine learning to predict a probability of an undesired medical event occurring during a treatment plan |
| US12246222B2 (en) * | 2019-10-03 | 2025-03-11 | Rom Technologies, Inc. | Method and system for using artificial intelligence to assign patients to cohorts and dynamically controlling a treatment apparatus based on the assignment during an adaptive telemedical session |
| US12249410B2 (en) | 2019-10-03 | 2025-03-11 | Rom Technologies, Inc. | System and method for use of treatment device to reduce pain medication dependency |
| US11955218B2 (en) | 2019-10-03 | 2024-04-09 | Rom Technologies, Inc. | System and method for use of telemedicine-enabled rehabilitative hardware and for encouraging rehabilitative compliance through patient-based virtual shared sessions with patient-enabled mutual encouragement across simulated social networks |
| US12548657B2 (en) | 2019-10-03 | 2026-02-10 | Rom Technologies, Inc. | System and method for using AI/ML and telemedicine to integrate rehabilitation for a plurality of comorbid conditions |
| US12301663B2 (en) | 2019-10-03 | 2025-05-13 | Rom Technologies, Inc. | System and method for transmitting data and ordering asynchronous data |
| US12539446B2 (en) | 2019-10-03 | 2026-02-03 | Rom Technologies, Inc. | Method and system for using sensors to optimize a user treatment plan in a telemedicine environment |
| US12327623B2 (en) | 2019-10-03 | 2025-06-10 | Rom Technologies, Inc. | System and method for processing medical claims |
| US12340884B2 (en) | 2019-10-03 | 2025-06-24 | Rom Technologies, Inc. | Method and system to analytically optimize telehealth practice-based billing processes and revenue while enabling regulatory compliance |
| US12347543B2 (en) | 2019-10-03 | 2025-07-01 | Rom Technologies, Inc. | Systems and methods for using artificial intelligence to implement a cardio protocol via a relay-based system |
| US12347558B2 (en) | 2019-10-03 | 2025-07-01 | Rom Technologies, Inc. | Method and system for using artificial intelligence and machine learning to provide recommendations to a healthcare provider in or near real-time during a telemedicine session |
| US12343180B2 (en) | 2019-10-03 | 2025-07-01 | Rom Technologies, Inc. | Augmented reality placement of goniometer or other sensors |
| US12537088B2 (en) | 2019-10-03 | 2026-01-27 | Rom Technologies, Inc. | System and method for using AI/ML and telemedicine for invasive surgical treatment to determine a cardiac treatment plan that uses an electromechanical machine |
| US20220288460A1 (en) * | 2019-10-03 | 2022-09-15 | Rom Technologies, Inc. | Method and system for using artificial intelligence to assign patients to cohorts and dynamically controlling a treatment apparatus based on the assignment during an adaptive telemedical session |
| US12367959B2 (en) | 2019-10-03 | 2025-07-22 | Rom Technologies, Inc. | System and method for using AI/ML to generate treatment plans to stimulate preferred angiogenesis |
| US12478837B2 (en) | 2019-10-03 | 2025-11-25 | Rom Technologies, Inc. | Method and system for monitoring actual patient treatment progress using sensor data |
| US12380984B2 (en) | 2019-10-03 | 2025-08-05 | Rom Technologies, Inc. | Systems and methods for using artificial intelligence and machine learning to generate treatment plans having dynamically tailored cardiac protocols for users to manage a state of an electromechanical machine |
| US12380985B2 (en) | 2019-10-03 | 2025-08-05 | Rom Technologies, Inc. | Method and system for implementing dynamic treatment environments based on patient information |
| US12469587B2 (en) | 2019-10-03 | 2025-11-11 | Rom Technologies, Inc. | Systems and methods for assigning healthcare professionals to remotely monitor users performing treatment plans on electromechanical machines |
| US12427376B2 (en) | 2019-10-03 | 2025-09-30 | Rom Technologies, Inc. | Systems and methods for an artificial intelligence engine to optimize a peak performance |
| US12424308B2 (en) | 2019-10-03 | 2025-09-23 | Rom Technologies, Inc. | System and method for determining, based on advanced metrics of actual performance of an electromechanical machine, medical procedure eligibility in order to ascertain survivability rates and measures of quality-of-life criteria |
| US12420143B1 (en) | 2019-10-03 | 2025-09-23 | Rom Technologies, Inc. | System and method for enabling residentially-based cardiac rehabilitation by using an electromechanical machine and educational content to mitigate risk factors and optimize user behavior |
| US12420145B2 (en) | 2019-10-03 | 2025-09-23 | Rom Technologies, Inc. | Systems and methods of using artificial intelligence and machine learning for generating alignment plans to align a user with an imaging sensor during a treatment session |
| US12390689B2 (en) | 2019-10-21 | 2025-08-19 | Rom Technologies, Inc. | Persuasive motivation for orthopedic treatment |
| US12562271B2 (en) | 2019-11-06 | 2026-02-24 | Rom Technologies, Inc. | System for remote treatment utilizing privacy controls |
| US12424319B2 (en) | 2019-11-06 | 2025-09-23 | Rom Technologies, Inc. | System for remote treatment utilizing privacy controls |
| US20230158334A1 (en) * | 2020-04-09 | 2023-05-25 | Raysearch Laboratories Ab (Publ) | A method of generating a radiotherapy treatment plan for a patient, a computer program product and a computer system |
| US12370378B2 (en) * | 2020-04-09 | 2025-07-29 | Raysearch Laboratories Ab (Publ) | Method of generating a radiotherapy treatment plan for a patient, a computer program product, and a computer system comprising a machine learning system |
| US12057237B2 (en) | 2020-04-23 | 2024-08-06 | Rom Technologies, Inc. | Method and system for describing and recommending optimal treatment plans in adaptive telemedical or other contexts |
| US12551720B2 (en) | 2020-06-11 | 2026-02-17 | Siemens Healthineers International Ag | Method and apparatus to facilitate administering therapeutic radiation to a patient |
| US11813479B2 (en) * | 2020-06-11 | 2023-11-14 | Siemens Healthineers International Ag | Method and apparatus to facilitate administering therapeutic radiation to a patient |
| US20210387017A1 (en) * | 2020-06-11 | 2021-12-16 | Varian Medical Systems International Ag | Method and Apparatus to Facilitate Administering Therapeutic Radiation to a Patient |
| US12357195B2 (en) | 2020-06-26 | 2025-07-15 | Rom Technologies, Inc. | System, method and apparatus for anchoring an electronic device and measuring a joint angle |
| US20220001205A1 (en) * | 2020-07-02 | 2022-01-06 | Varian Medical Systems International Ag | Methods and apparatus pertaining to radiation treatment plans |
| US11654299B2 (en) * | 2020-07-02 | 2023-05-23 | Siemens Healthineers International Ag | Methods and apparatus pertaining to radiation treatment plans |
| US12100499B2 (en) | 2020-08-06 | 2024-09-24 | Rom Technologies, Inc. | Method and system for using artificial intelligence and machine learning to create optimal treatment plans based on monetary value amount generated and/or patient outcome |
| US12367960B2 (en) | 2020-09-15 | 2025-07-22 | Rom Technologies, Inc. | System and method for using AI ML and telemedicine to perform bariatric rehabilitation via an electromechanical machine |
| US12515104B2 (en) | 2020-10-28 | 2026-01-06 | Rom Technologies, Inc. | Systems and methods for using machine learning to control a rehabilitation and exercise electromechanical device |
| US12076585B2 (en) * | 2021-03-30 | 2024-09-03 | Hitachi, Ltd. | Treatment planning system, treatment planning generation method, and recording medium |
| US20220314027A1 (en) * | 2021-03-30 | 2022-10-06 | Hitachi, Ltd. | Treatment planning system, treatment planning generation method, and recording medium |
| US20230178193A1 (en) * | 2021-11-15 | 2023-06-08 | Koninklijke Philips N.V. | System and method for processing data |
Also Published As
| Publication number | Publication date |
|---|---|
| US20150095043A1 (en) | 2015-04-02 |
Similar Documents
| Publication | Publication Date | Title |
|---|---|---|
| US9827445B2 (en) | Automatic creation and selection of dose prediction models for treatment plans | |
| US10762167B2 (en) | Decision support tool for choosing treatment plans | |
| US12415091B2 (en) | Radiotherapy treatment plans using differentiable dose functions | |
| CN110960805B (en) | Method and apparatus for performing irradiation time optimization for intensity modulated proton therapy | |
| US10857384B2 (en) | Controlling and shaping the dose distribution outside treatment targets in external-beam radiation treatments | |
| US11103726B2 (en) | Creating treatment field using initial field and patient specific geometry and achievable dose | |
| US7801270B2 (en) | Treatment plan optimization method for radiation therapy | |
| CN110114117A (en) | It is manipulated using the interactive dosage for being prioritized constraint | |
| US11278738B2 (en) | Using isodose surfaces for optimizing dose distribution in radiation treatment planning | |
| CN108697905B (en) | Radiation therapy planning apparatus, method and storage medium | |
| EP3524321B1 (en) | Methods to optimize coverage for multiple targets simultaneously for radiation treatments | |
| US12491379B2 (en) | Method and system for treatment planning | |
| US20240374924A1 (en) | Method and system for treatment planning | |
| US12582840B2 (en) | System and method for radiation treatment planning | |
| EP4487906A1 (en) | System and method for radiation treatment planning | |
| Schwarz | Intensity-modulated radiotherapy techniques for prostate, head-and-neck and lung cancer |
Legal Events
| Date | Code | Title | Description |
|---|---|---|---|
| AS | Assignment |
Owner name: VARIAN MEDICAL SYSTEMS, INTERNATIONAL AG, SWITZERL Free format text: ASSIGNMENT OF ASSIGNORS INTEREST;ASSIGNORS:MARCOS, MARIA ISABEL CORDERO;HARTMAN, JOONA;KUUSELA, ESA;AND OTHERS;REEL/FRAME:031508/0441 Effective date: 20130912 |
|
| AS | Assignment |
Owner name: VARIAN MEDICAL SYSTEMS, INTERNATIONAL AG, SWITZERL Free format text: ASSIGNMENT OF ASSIGNORS INTEREST;ASSIGNORS:MARCOS, MARIA ISABEL CORDERO;HARTMAN, JOONA;KUUSELA, ESA;AND OTHERS;REEL/FRAME:031793/0527 Effective date: 20130912 |
|
| STCF | Information on status: patent grant |
Free format text: PATENTED CASE |
|
| CC | Certificate of correction | ||
| MAFP | Maintenance fee payment |
Free format text: PAYMENT OF MAINTENANCE FEE, 4TH YEAR, LARGE ENTITY (ORIGINAL EVENT CODE: M1551); ENTITY STATUS OF PATENT OWNER: LARGE ENTITY Year of fee payment: 4 |
|
| AS | Assignment |
Owner name: SIEMENS HEALTHINEERS INTERNATIONAL AG, SWITZERLAND Free format text: CHANGE OF NAME;ASSIGNOR:VARIAN MEDICAL SYSTEMS INTERNATIONAL AG;REEL/FRAME:066369/0779 Effective date: 20220414 |
|
| MAFP | Maintenance fee payment |
Free format text: PAYMENT OF MAINTENANCE FEE, 8TH YEAR, LARGE ENTITY (ORIGINAL EVENT CODE: M1552); ENTITY STATUS OF PATENT OWNER: LARGE ENTITY Year of fee payment: 8 |