US9806973B2 - Bandwidth analytics in a software defined network (SDN) controlled multi-layer network for dynamic estimation of power consumption - Google Patents
Bandwidth analytics in a software defined network (SDN) controlled multi-layer network for dynamic estimation of power consumption Download PDFInfo
- Publication number
- US9806973B2 US9806973B2 US14/217,825 US201414217825A US9806973B2 US 9806973 B2 US9806973 B2 US 9806973B2 US 201414217825 A US201414217825 A US 201414217825A US 9806973 B2 US9806973 B2 US 9806973B2
- Authority
- US
- United States
- Prior art keywords
- users
- network
- bandwidth usage
- control area
- sdn
- Prior art date
- Legal status (The legal status is an assumption and is not a legal conclusion. Google has not performed a legal analysis and makes no representation as to the accuracy of the status listed.)
- Active, expires
Links
- 238000000034 method Methods 0.000 claims abstract description 62
- 230000002159 abnormal effect Effects 0.000 claims abstract description 39
- 238000012544 monitoring process Methods 0.000 claims abstract description 6
- 230000006399 behavior Effects 0.000 claims description 20
- 238000010248 power generation Methods 0.000 claims description 7
- 238000005070 sampling Methods 0.000 claims description 6
- 230000003287 optical effect Effects 0.000 description 12
- 238000010586 diagram Methods 0.000 description 9
- 230000006870 function Effects 0.000 description 8
- 238000004422 calculation algorithm Methods 0.000 description 7
- 238000004891 communication Methods 0.000 description 6
- 206010000117 Abnormal behaviour Diseases 0.000 description 4
- 230000008859 change Effects 0.000 description 3
- 230000007246 mechanism Effects 0.000 description 3
- 230000005856 abnormality Effects 0.000 description 2
- 238000005516 engineering process Methods 0.000 description 2
- 230000008569 process Effects 0.000 description 2
- 238000012545 processing Methods 0.000 description 2
- 230000001360 synchronised effect Effects 0.000 description 2
- 238000013459 approach Methods 0.000 description 1
- 238000003491 array Methods 0.000 description 1
- 230000005540 biological transmission Effects 0.000 description 1
- 239000000872 buffer Substances 0.000 description 1
- 238000012512 characterization method Methods 0.000 description 1
- 238000004590 computer program Methods 0.000 description 1
- 238000007405 data analysis Methods 0.000 description 1
- 238000013523 data management Methods 0.000 description 1
- 230000000694 effects Effects 0.000 description 1
- 238000005265 energy consumption Methods 0.000 description 1
- 230000007613 environmental effect Effects 0.000 description 1
- 230000001747 exhibiting effect Effects 0.000 description 1
- 239000000835 fiber Substances 0.000 description 1
- 235000019580 granularity Nutrition 0.000 description 1
- 238000007726 management method Methods 0.000 description 1
- 230000006855 networking Effects 0.000 description 1
- 238000002360 preparation method Methods 0.000 description 1
- 230000004044 response Effects 0.000 description 1
- 239000004065 semiconductor Substances 0.000 description 1
- 238000007619 statistical method Methods 0.000 description 1
- 238000013179 statistical model Methods 0.000 description 1
- 239000002699 waste material Substances 0.000 description 1
Images


Classifications
-
- H—ELECTRICITY
- H04—ELECTRIC COMMUNICATION TECHNIQUE
- H04L—TRANSMISSION OF DIGITAL INFORMATION, e.g. TELEGRAPHIC COMMUNICATION
- H04L43/00—Arrangements for monitoring or testing data switching networks
- H04L43/08—Monitoring or testing based on specific metrics, e.g. QoS, energy consumption or environmental parameters
- H04L43/0876—Network utilisation, e.g. volume of load or congestion level
-
- H—ELECTRICITY
- H04—ELECTRIC COMMUNICATION TECHNIQUE
- H04L—TRANSMISSION OF DIGITAL INFORMATION, e.g. TELEGRAPHIC COMMUNICATION
- H04L41/00—Arrangements for maintenance, administration or management of data switching networks, e.g. of packet switching networks
- H04L41/14—Network analysis or design
- H04L41/147—Network analysis or design for predicting network behaviour
-
- H—ELECTRICITY
- H04—ELECTRIC COMMUNICATION TECHNIQUE
- H04L—TRANSMISSION OF DIGITAL INFORMATION, e.g. TELEGRAPHIC COMMUNICATION
- H04L41/00—Arrangements for maintenance, administration or management of data switching networks, e.g. of packet switching networks
- H04L41/40—Arrangements for maintenance, administration or management of data switching networks, e.g. of packet switching networks using virtualisation of network functions or resources, e.g. SDN or NFV entities
-
- H—ELECTRICITY
- H04—ELECTRIC COMMUNICATION TECHNIQUE
- H04L—TRANSMISSION OF DIGITAL INFORMATION, e.g. TELEGRAPHIC COMMUNICATION
- H04L43/00—Arrangements for monitoring or testing data switching networks
- H04L43/20—Arrangements for monitoring or testing data switching networks the monitoring system or the monitored elements being virtualised, abstracted or software-defined entities, e.g. SDN or NFV
-
- Y—GENERAL TAGGING OF NEW TECHNOLOGICAL DEVELOPMENTS; GENERAL TAGGING OF CROSS-SECTIONAL TECHNOLOGIES SPANNING OVER SEVERAL SECTIONS OF THE IPC; TECHNICAL SUBJECTS COVERED BY FORMER USPC CROSS-REFERENCE ART COLLECTIONS [XRACs] AND DIGESTS
- Y04—INFORMATION OR COMMUNICATION TECHNOLOGIES HAVING AN IMPACT ON OTHER TECHNOLOGY AREAS
- Y04S—SYSTEMS INTEGRATING TECHNOLOGIES RELATED TO POWER NETWORK OPERATION, COMMUNICATION OR INFORMATION TECHNOLOGIES FOR IMPROVING THE ELECTRICAL POWER GENERATION, TRANSMISSION, DISTRIBUTION, MANAGEMENT OR USAGE, i.e. SMART GRIDS
- Y04S40/00—Systems for electrical power generation, transmission, distribution or end-user application management characterised by the use of communication or information technologies, or communication or information technology specific aspects supporting them
-
- Y04S40/168—
Definitions
- the present disclosure relates generally to computer networking systems and methods. More particularly, the present disclosure relates to Bandwidth analytics in a Software Defined Network (SDN) Controlled Multi-Layer Network for dynamic estimation of power consumption.
- SDN Software Defined Network
- Electric grid operators are responsible for ensuring that electric supply and demand is always in balance. To meet this responsibility, an interconnected grid is divided into a number of control areas (CA). Electric grid operators monitor any mismatch between generation and load within their responsible control area(s) and continuously adjust supply (generation) to minimize the instantaneous mismatch and to ensure that over time it is near zero. Control areas are clearly defined regions of network topology within which the balancing of generation and load is controlled to ensure system frequency remains within limits. Historically, control areas generally included the assets of individual vertically integrated utilities, but today groups of utility control areas have been integrated into larger footprints and operated at a higher level by Regional Transmission Operators (RTOs). Operators perform Day-Ahead, Current-Day and Hour-Ahead forecasts. See the following websites and screen captures for examples.
- RTOs Regional Transmission Operators
- FIG. 1 is a graph of ERCOT's Load Forecast vs Actual for Jan. 5, 2014
- the difference between the actual System Load and the Current-Day Forecast can be as much as 5% (2,500 MW/hour shortage between 19:00 and 24:00 in this example leading to over a 12,500 MW shortage).
- FIGS. 2 and 3 illustrate graphs of household usages based on the AMI.
- the grid control area operators perform day-ahead, current-day, hour-ahead forecasts but they do not have the capability to represent real-time system operating conditions. Conventionally, the forecasts are based on historical and current system loads and temperatures. Weather data from NOAA National Weather Service stations can be used in the energy use forecast. For the end consumer, “smart” mechanisms to reduce energy consumption are being offered.
- the consumer thermostat offers by Nest (www.nest.com).
- the Nest thermostat utilizes algorithms to automatically set efficient temperatures based on detecting user preferences. While this product benefits the end consumer in lowering their energy bills, it (and other “smart” devices) can provide very accurate data to aid in future power estimates; however such devices are consumer focused.
- FIG. 4 illustrates a data trend graph and data usage table for a typical customer. It would be advantageous to leverage the data collected in real-time or near real-time by the network operators and service providers to enhance the electric grid operator forecasting and to particularly address predicting abnormal usage patterns.
- a computer-implemented method includes monitoring bandwidth usage for a plurality of users in a Software Defined Network (SDN) network, wherein the plurality of users correspond to service addresses in a control area of an electric grid system; detecting abnormal bandwidth usage for a time period for one or more users of the plurality of users; determining whether the abnormal bandwidth usage for the one or more users indicates a power forecast adjustment is needed for the one or more users; and notifying an operator of the control area of the power forecast adjustment based on the determining.
- SDN Software Defined Network
- the computer-implemented method can further include receiving historical data from the operator of the control area for the plurality of users; correlating bandwidth usage behavior for the plurality of users to power usage behavior for the plurality of users; and determining the power forecast adjustment based on the correlating.
- the computer-implemented method can further include characterizing bandwidth usage type for the one or more users; and detecting a condition of the one or more users based on the characterizing.
- the condition can include any of home on a work day, home from school on a school day, away from home, and returning to home.
- the computer-implemented method can further include correlating the plurality of users based on unique identifiers in the SDN network to the service addresses for the control area.
- the unique identifiers can include any of Internet Protocol addresses, Media Access Control Address, and Virtual Local Area Network identifiers.
- the plurality of users can include a subset of users in the control area, and wherein the operator utilizes statistical sampling based on the notifying for the power forecast adjustment.
- the computer-implemented method can further include adjusting electrical power generation by the operator responsive to the notifying.
- the computer-implemented method can be implemented by a controller operating an SDN application.
- a controller in another exemplary embodiment, includes a network interface, a data store, and a processor, each communicatively coupled therebetween; and memory storing instructions that, when executed, cause the processor to: monitor bandwidth usage for a plurality of users in a Software Defined Network (SDN) network, wherein the plurality of users correspond to service addresses in a control area of an electric grid system; detect abnormal bandwidth usage for a time period for one or more users of the plurality of users; determine whether the abnormal bandwidth usage for the one or more users indicates a power forecast adjustment is needed for the one or more users; and notify an operator of the control area of the power forecast adjustment based on the determining.
- SDN Software Defined Network
- the condition can include any of home on a work day, home from school on a school day, away from home, and returning to home.
- the instructions that, when executed, can further cause the processor to correlate the plurality of users based on unique identifiers in the SDN network to service addresses for the control area.
- the unique identifiers can include any of Internet Protocol addresses, Media Access Control Address, and Virtual Local Area Network identifiers.
- the plurality of users can include a subset of users in the control area, and wherein the operator utilizes statistical sampling based on the notifying for the power forecast adjustment.
- the instructions that, when executed, can further cause the processor to adjust electrical power generation by the operator responsive to the notifying.
- the controller can include an SDN controller operating SDN applications.
- a Software Defined Network includes a plurality of network elements providing network access to a plurality of users each uniquely identified by a unique identifier; and a server operating an SDN application and communicatively coupled to the plurality of network elements; wherein the SDN application is configured to: monitor bandwidth usage for the plurality of users, wherein the plurality of users correspond to service addresses in a control area of an electric grid system; detect abnormal bandwidth usage for a time period for one or more users of the plurality of users; determine whether the abnormal bandwidth usage for the one or more users indicates a power forecast adjustment is needed for the one or more users; and notify an operator of the control area of the power forecast adjustment based on the determining.
- SDN Software Defined Network
- FIG. 1 is a graph of an electrical grid operator's Load Forecast versus Actual for a specific day
- FIGS. 2 and 3 are graphs of household usages for electrical power based on the AMI
- FIG. 4 is a data trend graph and data usage table for a typical customer subscribing to a service provider's network access
- FIG. 5 is a network diagram of an exemplary SDN Internet Service Provider (ISP) network
- FIG. 6 is a block diagram of functional components of the SDN controller in the SDN network of FIG. 5 ;
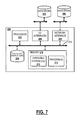
- FIG. 7 is a block diagram of a server which may be used for the SDN controller of FIG. 6 ;
- FIG. 8 is a logical diagram of an electrical grid network overlaid with associated service providers
- FIG. 9 are graphs of exemplary customers in a service provider's network overlapping a control area in the electrical grid network of FIG. 8 illustrating historical and current data usage;
- FIG. 10 is a graph of one of the customers in FIG. 9 with abnormal behavior characterizing the current data usage
- FIG. 11 is a graph for power usage of the customer in FIG. 10 in the afternoon of the same day from FIGS. 9 and 10 ;
- FIG. 12 is a flowchart of a service provider-based method for dynamic estimation of power consumption based on correlating current data usage
- FIGS. 13 and 14 are tables of temperature conditions for an exemplary use case of the service provider-based method of FIG. 12 ;
- FIG. 15 is a graph of historical normal/presence hourly power usage provided by the control area operator for the exemplary use case of FIGS. 13 and 14 ;
- FIG. 16 is a table of temperature conditions for a similar most recent past day used by the control area operator for “away” (school day), for the purpose of forecasting for the exemplary use case of FIGS. 13-15 ;
- FIG. 17 is a graph of historical away hourly power usage provided by the control area operator for the exemplary use case of FIGS. 13-16 ;
- FIGS. 18-22 are graphs of hourly power usage provided by the control area operator for a second use case.
- the present disclosure relates to Bandwidth analytic systems and methods in a Software Defined Network (SDN) Controlled Multi-Layer Network for dynamic estimation of power consumption.
- the systems and methods can include a software defined network (SDN), a controller adaption layer, an SDN controller, and an SDN application method to measure the bandwidth usage, to determine the content of the bandwidth, and to improve electric grid system load forecasts in real-time or near real-time.
- SDN Software Defined Network
- SDN controller software defined network
- SDN application method to measure the bandwidth usage, to determine the content of the bandwidth, and to improve electric grid system load forecasts in real-time or near real-time.
- the systems and methods allow service providers to correlate data usage, in both content type and quantity, with a mechanism to accurately predict household power usage in real-time or near real-time. Service providers can offer this information to control area operators on a subscription basis. Control area operators can employ these estimates in their forecasting mechanism in order to fine-tune their power generation, i.e. to accurately predict
- a network diagram illustrates an exemplary SDN Internet Service Provider (ISP) network 10 .
- the ISP network 10 is shown for illustration purposes to describe SDN functionality at Layers 0 , 1 , 2 , and 3 .
- SDN network configuration at Layers 0 , 1 , 2 , and 3 is contemplated.
- the ISP network 10 is a SDN network which includes an SDN controller 60 with the ability to centrally program provisioning of forwarding in the network 10 in order for more flexible and precise control over network resources to support new services.
- OpenFlow (www.openflow.org) is an implementation of this which requires a special OpenFlow interface 62 from the SDN controller 60 , via mediation software 64 , to each switch 70 , 72 , 74 in the network 10 in order to provision the forwarding table at each switch along a connection path in order to instantiate the forwarding behavior needed for the connection.
- OpenFlow is described, for example, in the OpenFlow Switch Speciation, Version 1.1.0 (February 2011)—Version 1.3.0 (June 2012), the contents of which are incorporated by reference herein.
- Other SDN protocols besides OpenFlow are also contemplated with the systems and methods described herein.
- the ISP network 10 includes an OpenFlow packet switch 70 , various packet/optical switches 72 , and packet switches 74 with the switches 70 , 72 each communicatively coupled to the SDN controller 60 via the OpenFlow interface 62 and the mediation software 64 at any of Layers 0 - 2 (L 0 being DWDM, L 1 being OTN, and L 2 being Ethernet).
- L 0 being DWDM
- L 1 being OTN
- L 2 being Ethernet
- the switches 70 , 72 , 74 are located at various sites including an Ethernet Wide Area Network (WAN) 80 , a carrier cloud Central Office (CO) and data center 82 , an enterprise data center 84 , a Reconfigurable Optical Add/Drop Multiplexer (ROADM) ring 86 , a switched OTN site 88 , another enterprise data center 90 , a central office 92 , and another carrier cloud Central Office (CO) and data center 94 .
- WAN Wide Area Network
- CO carrier cloud Central Office
- ROADM Reconfigurable Optical Add/Drop Multiplexer
- the switches 70 , 72 , 74 can operate, via SDN, at Layers 0 - 3 .
- the OpenFlow packet switch 70 for example, can be a large-scale Layer 2 Ethernet switch that operates, via the SDN controller 60 , at Layer 2 (L 2 ).
- the packet/optical switches 72 can operate at any of Layers 0 - 2 in combination.
- the packet/optical switches 72 can provide wavelength connectivity such as via DWDM, ROADMs, etc.
- the packet/optical switches 72 can provide time division multiplexing (TDM) layer connectivity such as via Optical Transport Network (OTN), Synchronous Optical Network (SONET), Synchronous Digital Hierarchy (SDH), etc.
- TDM time division multiplexing
- OTN Optical Transport Network
- SONET Synchronous Optical Network
- SDH Synchronous Digital Hierarchy
- the packet/optical switches 72 can provide Ethernet packet switching.
- An exemplary configuration of the packet/optical switches 72 and the OpenFlow packet switch 70 is illustrated in FIG. 5 .
- the packet switches 74 can be traditional Ethernet switches that are not controlled by the SDN controller 60 .
- the ISP network 10 can include various end user access technologies 100 , such as, without limitation, cable modems, digital subscriber loop (DSL), wireless, fiber-to-the-X (e.g., home, premises, curb, etc.), and the like.
- end user access technologies 100 such as, without limitation, cable modems, digital subscriber loop (DSL), wireless, fiber-to-the-X (e.g., home, premises, curb, etc.), and the like.
- DSL digital subscriber loop
- fiber-to-the-X e.g., home, premises, curb, etc.
- each end user will have a unique identifier that allows the ISP network 10 to collect analytics such as shown in FIG. 4 .
- the SDN controller 60 and associated applications thereon are continually monitoring bandwidth usage over time in the ISP network 10 for each end user and their associated access technologies 100 .
- the unique identifiers can include, without limitation, Internet Protocol (IP) addresses, Media Access Control (MAC) addresses, Virtual Local Area Network (VLAN) identifiers, user account numbers, and the like.
- IP Internet Protocol
- MAC Media Access Control
- VLAN Virtual Local Area Network
- the service provider operating the ISP network 10 has a physical location or address associated with each end user, i.e. a service address.
- the systems and methods include an SDN application which tracks individual end users' real-time or near real-time bandwidth usage, correlates this information with the individual end users' service address, and provides this data, such as via a subscription service, to electrical grid control area operators.
- the electrical grid control area operators can utilize this data in their forecasting algorithms in order to fine-tune their power generation, i.e. to accurately predict abnormal usage patterns and accuracy improvements of very small percentages result in large savings.
- a fundamental aspect of the systems and methods includes the concept that data usage behavior can be an accurate predictor of user behavior as described herein.
- current data usage behavior is an extremely accurate and easily determined value in the ISP network 10 that can determine abnormal usage behavior (e.g., being home on a weekday from work) that can enable the electrical grid control area operators to plug holes related to abnormal usage behavior in their existing forecasting algorithms.
- a block diagram illustrates functional components of the SDN controller 60 .
- the SDN controller 60 can be a server or the like such as illustrated in FIG. 7 and the functional components can be implemented in software executed on the server.
- the SDN controller 60 includes an infrastructure layer 102 , a control layer 104 , and an application layer 106 .
- the infrastructure layer 102 is communicatively coupled to network devices such as the switches 70 , 72 via a control plane interface 110 such as OpenFlow.
- the infrastructure layer 102 allows communication between the SDN controller 60 and the network devices.
- the control layer 104 includes SDN control software 112 with a plurality of network services 114 .
- the control layer 104 provides SDN functionality to manage network services through abstraction of lower level functionality.
- the application layer 106 communicates to the control layer 104 through various Application Programming Interfaces (APIs) 116 .
- the application layer 106 provides end user connectivity to the SDN such as software modules and/or functions responsible for creating desired path and flow connections on the physical network through various business applications 118 .
- the systems and methods for dynamic estimation of power consumption are implemented as one of the business applications 118 .
- a block diagram illustrates a server 200 which may be used to realize the SDN controller 60 , in other systems, or standalone.
- the server 200 may be a digital computer that, in terms of hardware architecture, generally includes a processor 202 , input/output (I/O) interfaces 204 , a network interface 206 , a data store 208 , and memory 210 .
- I/O input/output
- FIG. 7 depicts the server 200 in an oversimplified manner, and a practical embodiment may include additional components and suitably configured processing logic to support known or conventional operating features that are not described in detail herein.
- the components ( 202 , 204 , 206 , 208 , and 210 ) are communicatively coupled via a local interface 212 .
- the local interface 212 may be, for example but not limited to, one or more buses or other wired or wireless connections, as is known in the art.
- the local interface 212 may have additional elements, which are omitted for simplicity, such as controllers, buffers (caches), drivers, repeaters, and receivers, among many others, to enable communications. Further, the local interface 212 may include address, control, and/or data connections to enable appropriate communications among the aforementioned components.
- the processor 202 is a hardware device for executing software instructions.
- the processor 202 may be any custom made or commercially available processor, a central processing unit (CPU), an auxiliary processor among several processors associated with the server 200 , a semiconductor-based microprocessor (in the form of a microchip or chip set), or generally any device for executing software instructions.
- the processor 202 is configured to execute software stored within the memory 210 , to communicate data to and from the memory 210 , and to generally control operations of the server 200 pursuant to the software instructions.
- the I/O interfaces 204 may be used to receive user input from and/or for providing system output to one or more devices or components.
- I/O interfaces 204 may include, for example, a serial port, a parallel port, a small computer system interface (SCSI), a serial ATA (SATA), a fibre channel, Infiniband, iSCSI, a PCI Express interface (PCI-x), an infrared (IR) interface, a radio frequency (RF) interface, and/or a universal serial bus (USB) interface.
- SCSI small computer system interface
- SATA serial ATA
- PCI-x PCI Express interface
- IR infrared
- RF radio frequency
- USB universal serial bus
- the network interface 206 may be used to enable the server 200 to communicate on a network, such as the Internet, a wide area network (WAN), a local area network (LAN), and the like, etc.
- the network interface 206 may include, for example, an Ethernet card or adapter (e.g., 10BaseT, Fast Ethernet, Gigabit Ethernet, 10 GbE) or a wireless local area network (WLAN) card or adapter (e.g., 802.11a/b/g/n).
- the network interface 206 may include address, control, and/or data connections to enable appropriate communications on the network.
- a data store 208 may be used to store data.
- the data store 208 may include any of volatile memory elements (e.g., random access memory (RAM, such as DRAM, SRAM, SDRAM, and the like)), nonvolatile memory elements (e.g., ROM, hard drive, tape, CDROM, and the like), and combinations thereof. Moreover, the data store 208 may incorporate electronic, magnetic, optical, and/or other types of storage media.
- the data store 1208 may be located internal to the server 200 such as, for example, an internal hard drive connected to the local interface 212 in the server 200 . Additionally in another embodiment, the data store 208 may be located external to the server 200 such as, for example, an external hard drive connected to the I/O interfaces 204 (e.g., SCSI or USB connection). In a further embodiment, the data store 208 may be connected to the server 200 through a network, such as, for example, a network attached file server.
- a network such as, for example, a network attached file server.
- the memory 210 may include any of volatile memory elements (e.g., random access memory (RAM, such as DRAM, SRAM, SDRAM, etc.)), nonvolatile memory elements (e.g., ROM, hard drive, tape, CDROM, etc.), and combinations thereof. Moreover, the memory 210 may incorporate electronic, magnetic, optical, and/or other types of storage media. Note that the memory 210 may have a distributed architecture, where various components are situated remotely from one another, but can be accessed by the processor 202 .
- the software in memory 210 may include one or more software programs, each of which includes an ordered listing of executable instructions for implementing logical functions.
- the software in the memory 210 includes a suitable operating system (O/S) 214 and one or more programs 216 .
- O/S operating system
- the operating system 214 essentially controls the execution of other computer programs, such as the one or more programs 216 , and provides scheduling, input-output control, file and data management, memory management, and communication control and related services.
- the one or more programs 216 may be configured to implement the various processes, algorithms, methods, techniques, etc. described herein.
- a logical diagram illustrates an electrical grid network 300 overlaid with associated service providers 302 .
- the logical diagram is meant to convey geographical location.
- the electrical grid network 300 is divided into control areas 304 .
- the electrical grid network 300 includes four control areas 304 - 1 , 304 - 2 , 304 - 3 , 304 - 4 each being a geographic area that is serviced by an electrical operator.
- the electrical grid network 300 is serviced by four exemplary service providers 302 - 1 , 302 - 2 , 302 - 3 , 302 - 4 .
- FIG. 8 illustrates the logical division of the control areas 304 - 1 , 304 - 2 , 304 - 3 , 304 - 4 , and the service providers can span multiple control areas. However, it is noted that the service providers 302 - 1 , 302 - 2 , 302 - 3 , 302 - 4 , taken collectively, substantially cover all of the electrical grid network 300 geographically.
- each control area operator is to generate exactly the amount of power needed with no waste or shortage.
- day-ahead and current day and/or hour-ahead forecasts are calculated using proprietary systems. Even with historical data and environmental (e.g. temperature) data, the forecast and actual system load can easily differ by 5% (2,500 MW) in one operator. This inability to account for “abnormal” or non-deterministic customer behavior drives a significant portion of this missed estimation.
- the systems and methods provide a forecasting service from the service providers 302 - 1 , 302 - 2 , 302 - 3 , 302 - 4 , to operators of the control areas 304 - 1 , 304 - 2 , 304 - 3 , 304 - 4 as described herein.
- the service providers 302 - 1 , 302 - 2 , 302 - 3 , 302 - 4 run the systems and methods described herein, such as in their SDN controller, and provide forecasting service to the control area operators.
- the control area 304 - 1 operator can subscribe to the forecasting service from the service providers 302 - 1 , 302 - 2 , 302 - 3 .
- the subscription implies that control area 304 - 1 operator makes their customers' historical power usage data and/or their forecasts available to the service providers 302 - 1 , 302 - 2 , 302 - 3 .
- the control area 304 - 1 operator subscribes to the forecasting service from the service providers 302 - 1 , 302 - 2 , 302 - 3 , these service providers 302 - 1 , 302 - 2 , 302 - 3 start using the forecasting service to measure and characterize their customers' bandwidth usage. For example, consider customers 1 and 2 are served by the service provider 302 - 1 . Note, practical embodiments of the forecasting service likely will include thousands of customers or more, but for ease of illustration, the customers 1 and 2 are described herein. In this case, the service provider 302 - 1 measures and characterizes customers 1 and 2 's bandwidth usage, such as illustrated in FIG. 9 , for example in 15 minute increments although other granularities are also contemplated.
- the customer bandwidth usage is compared against the historical behavior. For customer 1 , there is no significant change detected.
- the service provider 302 - 1 marks the customer 1 as normal and power consumption; forecast adjustment is not needed. For the customer 2 , there is a significant change detected.
- the service provider 302 - 1 can further characterize the current bandwidth usage for the customer 2 , such as illustrated in FIG. 10 .
- the service provider 302 - 1 marks the customer 2 as abnormal and power consumption adjustment is needed by the control area 304 - 1 operator.
- the VPN traffic can be indicative of the customer 2 working from home.
- the service provider 302 - 1 decides that the customer 2 is most likely to continue the VPN traffic until 17:00, i.e. the customer 2 is likely working from home.
- the service provider 302 - 1 up the historical power usage pattern for customer 2 from the control area 304 - 1 operator provided data.
- the forecasting system predicts the power usage for the next period and provides the data to the control area 304 - 1 operator. For example, FIG.
- FIG 11 illustrates a graph for the customer 2 in the afternoon of the same day from FIGS. 9 and 10 .
- the historical power usage for an equivalent day has the customer 2 away at work during the day with power usage increasing around 17:00.
- a power adjustment over the historical power is needed all day.
- the forecasting service can streamline forecasting algorithms to more accurately detect abnormal conditions.
- the forecasting service can work with a number of factors to characterize and adjust the control area operator's forecast.
- exemplary factors can include:
- the control area 304 - 1 operator utilizes the service provider 302 - 1 provided data, and makes the incremental adjustment to its forecast for the next period. Since the control area 304 - 1 operator may not receive estimated usage for all of its customers, a statistical analysis of the provided samples can allow a more accurate estimate than without this information. For example, using the forecasting service, it is not necessary for the control area 304 - 1 operator to receive data for all of the customers, but rather a statistical sample is more than enough to improve forecasting accuracy.
- a flowchart illustrates a service provider-based method 400 for dynamic estimation of power consumption based on correlating current data usage.
- the service provider-based method 400 can be implemented by the service providers 302 - 1 , 302 - 2 , 302 - 3 , 302 - 4 such as through the SDN controller 60 and an associated business application 118 .
- the service provider-based method 400 includes correlating users based on unique identifiers to service addresses (step 402 ).
- the service provider has a correlation between a unique identifier on the service provider's network (e.g., IP address, MAC address, VLAN ID, etc.) and a physical service address. This is important as the objective of the service provider-based method 400 is to detect abnormal bandwidth usage at a particular time and provide this information to a control area operator so that the abnormal bandwidth usage can be used to adjust forecasting based on the physical service address.
- the service provider-based method 400 includes receiving historical data from associated control area operator for the service addresses (step 404 ).
- the service provider-based method 400 can be a subscription service that is subscribed to by the associated control area operator.
- the associated control area operator is configured to provide data to the service provider of historical power usage for the service addresses.
- the service provider can store this information and use it later for charactering the bandwidth usage to detect abnormal behavior. Additionally, the service provider can request this information on an ongoing basis, such as upon detecting an abnormality for a particular customer.
- the service provider also has historical bandwidth usage since the service provider provides network access to the customers.
- the service provider-based method 400 includes correlating the users' bandwidth usage behavior to the users' power usage behavior (step 406 ).
- the service provider adapts guidelines for normal and abnormal behavior, from a power usage perspective, based on bandwidth usage. There are numerous parameters which can be accounted for here such as, for example, day of the week, school day or not, average temperature, and the like.
- the service provider can build an expectation for the customers—on a weekday during the school year, this customer expects to do X power based on the bandwidth usage. Now, if the service provider notices a change in the bandwidth usage on a similarly situated day, the service provider can expect that the X power may not be accurate. This is how bandwidth usage is tied to power usage.
- Bandwidth usage is a convenient metric that is already tracked in real-time or near real-time for other purposes, e.g. metering, statistical multiplexing, etc. The systems and methods utilize this convenient metric to further improve power usage forecasting.
- bandwidth usage can give an indication of user activity at the service address—e.g., streaming video/audio may lead to an indication the customers are home being entertained, VPN connectivity may lead to an indication the customers are working from home, and the like. Such indicators are not available in the context of the AMI and power usage.
- the service provider-based method 400 includes monitoring the users' bandwidth usage over time (step 408 ).
- the steps 402 , 404 , 406 are generally preparation steps that are performed offline or before (although the steps 404 , 406 can also be performed on an ongoing basis as well).
- the step 408 is an ongoing monitoring step where the service provider is looking at individual customers to detect abnormal behavior in bandwidth usage that could lead to different power usage from expected. This is the information that the service provider seeks to convey to the control area operator to streamline the power usage forecasting.
- the service provider-based method 400 includes characterizing bandwidth usage type for the users with abnormal bandwidth usage patterns (step 410 ).
- the service provider-based method 400 looks to seek if some information can be gleaned from the abnormal bandwidth usage patterns.
- Various abnormal bandwidth usage patterns can include, for example, working from home on a work day, home from school on a school day, away on vacation, returning from vacation, etc. These abnormal bandwidth usage patterns are something the control area operators are unaware of in their power usage forecasts, but can be detected by the service provider and relayed to the control area operators.
- the service provider-based method 400 includes notifying the control area operator of the users with the abnormal bandwidth usage patterns based on the characterized bandwidth usage type (step 412 ).
- the service provider notifies the control area operator of various customers who are exhibiting abnormal patterns.
- This can also include various categories of the abnormal patterns (working from home on a work day, home from school on a school day, away on vacation, returning from vacation, etc.).
- the control area operator can include this information in their forecasting model to improve accuracy. Note, the control area operator may receive this information for a sampling of the customers, and develop statistical models based thereon. Also, it is not impractical for the control area operator and the service provider to exchange this information about a large subset of the customers or even all of the customers.
- the service provider-based method 400 is described as follows with two exemplary use cases. These are presented for illustration purposes, and those of ordinary skill in the art will appreciate other use cases are also contemplated.
- the control area operator and the service provider are engaged in business-to-business (B2B) relationship, i.e. the service provider utilizes one of more of the servers 200 to implement the service provider-based method 400 and the control area operator utilizes one of more of the servers 200 to implement a forecasting algorithm, and each of the servers 200 from the service provider and the control area operator are communicatively coupled there between for data exchange.
- B2B business-to-business
- the service providers utilize the systems and methods to perform analytics on the customers' historical data and each customer is associated with a specific bandwidth usage profile.
- a first customer's bandwidth usage is profiled using historical usage data as follows:
- the first customer's thermostats are programmed by the customer (settings for winter) as follows:
- Thermostat 1 Upstairs, located in the hallway, at the top of the staircase.
- the service provider-based method 400 can request (or already have) the first customer's power usage histories from control area operator for the 9th hour and with similar conditions such as temperature [e.g. @ 16 F].
- the usage history for both customer normal/presence and customer away were or could be provided by the control area operator.
- the customer normal/presence was determined to be a most recent past no school weekday with a similar temperature profile.
- FIG. 13 illustrates conditions at the service address for the first customer on Jan. 22, 2014 whereas FIG. 14 illustrates conditions at the service address for a similar day (no school) for the purposes of forecasting “normal/presence”.
- FIG. 15 illustrates exemplary historical normal/presence hourly power usage [temperature 16 F] provided by the control area operator for the first customer.
- FIG. 16 illustrates conditions for a similar most recent past day used by the control area operator for “away” (school day), for the purpose of forecasting.
- FIG. 17 illustrates exemplary historical away hourly power usage [temperature 16 F] provided by the control area operator for the first customer.
- the service provider-based method 400 already determined that the first customer was normal/presence because of unexpected bandwidth usage at 9:05. Using data provided by the control area operator, it would forecast 1 kWh usage for 9th hour. That is no adjustment is needed because FIG. 15 matches FIG. 17 for the 9th hour.
- FIG. 15 shows 1 kWh usage for the 11th hour whereas FIG. 17 shows 0 kWh usage for the 11th hour thereby indicating the adjustment of 1 kWh is need for the 11th hour for the first customer.
- FIG. 15 shows 1 kWh usage for the 13th hour whereas FIG. 17 shows 0 kWh usage for the 13th hour thereby indicating the adjustment of 1 kWh is need for the 13th hour for the first customer.
- the service provider-based method 400 based on detecting the abnormal bandwidth usage as a proxy for normal/presence energy usage, is able to forecast a 2 kWh accuracy over the 5 hour period. Again, this would not be possible using the historical power usage plus temperature forecasting alone as currently used by the control area operators. Results for this use case are illustrated in the following table:
- a bandwidth usage profile using historical usage data as follows:
- FIG. 18 is a graph of power usage for the second customer with normal/presence for the whole day on Dec. 15, 2013.
- the power usages is less than 1 kWh for more than two hours at a time.
- FIG. 19 is a graph of power usage with the second customer away from 1 pm to 10 pm on Dec. 13, 2013.
- FIG. 20 is a graph of power usage with the second customer away starting at 9 am on Dec. 20, 2013.
- FIGS. 21 and 22 are graphs of power usage with the second customer away the whole day on Dec. 21, 2013 and Dec. 22, 2013, respectively.
- the service provider-based method 400 is able to provide away forecast by detecting when the second customer is away based on bandwidth usage.
- processors such as microprocessors, digital signal processors, customized processors, and field programmable gate arrays (FPGAs) and unique stored program instructions (including both software and firmware) that control the one or more processors to implement, in conjunction with certain non-processor circuits, some, most, or all of the functions of the methods and/or systems described herein.
- processors such as microprocessors, digital signal processors, customized processors, and field programmable gate arrays (FPGAs) and unique stored program instructions (including both software and firmware) that control the one or more processors to implement, in conjunction with certain non-processor circuits, some, most, or all of the functions of the methods and/or systems described herein.
- FPGAs field programmable gate arrays
- unique stored program instructions including both software and firmware
- some exemplary embodiments may be implemented as a non-transitory computer-readable storage medium having computer readable code stored thereon for programming a computer, server, appliance, device, etc. each of which may include a processor to perform methods as described and claimed herein.
- Examples of such computer-readable storage mediums include, but are not limited to, a hard disk, an optical storage device, a magnetic storage device, a ROM (Read Only Memory), a PROM (Programmable Read Only Memory), an EPROM (Erasable Programmable Read Only Memory), an EEPROM (Electrically Erasable Programmable Read Only Memory), Flash memory, and the like.
- software can include instructions executable by a processor that, in response to such execution, cause a processor or any other circuitry to perform a set of operations, steps, methods, processes, algorithms, etc.
Abstract
Description
-
- Day of the week. For example, it is Monday.
- Is it a school day? Yes.
- Does the historical bandwidth usage indicate that normal bandwidth usage? No.
- Does the current bandwidth characterization indicate continued abnormal usage? Yes.
- Retrieve the customer's (
customer 2 in this example) forecast based on historical power usage for an equivalent normal day. That is a Monday, school day with the outside temperature in the same range. For example, between 9:00 and 17:00, the expected power usage is around 1 kWh. - Retrieve the customer's forecast historical power usage for the day (with equivalent outside temperature and home owner present).
- Make adjustment to the forecast for the customer's power usage. For example at 9:00, instead of <1 kWh normal, predict a 2 kWh usage based on historical data analysis.
- Provide this delta information between normal and abnormal usage to the control area operator (
operator 1 in this example).
-
- Substantially no bandwidth is used between the hours of 11 pm to 6 am.
- During school days, normally, substantially no bandwidth is used between 7 am to 4 pm.
- On other days, bandwidth usage occurs between 6 am to 11 pm.
- Daily bandwidth usage range from 0.62 Gb/s to 7.54 Gb·s.
- Multiple bandwidth streams detected.
| Wake | 5:15 am | Heat 68 F. | ||
| Leave | 8:00 | Heat | 60 F. | |
| Return | 4:30 pm | Heat 68 F. | ||
| Sleep | 10:00 pm | Heat 67 F. | ||
| Wake | 6:00 am | Heat 66 F. | ||
| Leave | 8:00 am | Heat 58 F. | ||
| Return | 4:00 pm | Heat 66 F. | ||
| Sleep | 9:00 pm | Heat 61 F. | ||
| 9:00 | 10:00 | 11:00 | 12:00 | 13:00 | ||
| Without the |
1 |
0 |
0 |
1 |
0 kWh | |
| provider-based | ||||||
| |
||||||
| With the |
1 |
0 |
1 |
1 |
1 kWh | |
| provider-based | No | No | Adjust- | No | Adjust- | |
| |
adjust- | adjust- | ment of | adjust- | ment of | |
| | ment | 1 kWh | ment | 1 kWh | ||
| Actual | 1 |
0 |
1 |
1 |
1 kWh | |
-
- Bandwidth usage is detected daily between 8 am to midnight.
- Daily bandwidth usage range from 0.2 G to 2.3 G.
- Multiple bandwidth streams detected.
This second use case is substantially the inverse of first use case. In this second use case, the service provider-basedmethod 400 detects no bandwidth usage and employs the “away” energy usage forecast. In this household, when normal/presence, the energy usage is 1 kWh at most hours and no more than 2 hours with 0 kWh.
Claims (11)
Priority Applications (1)
| Application Number | Priority Date | Filing Date | Title |
|---|---|---|---|
| US14/217,825 US9806973B2 (en) | 2014-03-18 | 2014-03-18 | Bandwidth analytics in a software defined network (SDN) controlled multi-layer network for dynamic estimation of power consumption |
Applications Claiming Priority (1)
| Application Number | Priority Date | Filing Date | Title |
|---|---|---|---|
| US14/217,825 US9806973B2 (en) | 2014-03-18 | 2014-03-18 | Bandwidth analytics in a software defined network (SDN) controlled multi-layer network for dynamic estimation of power consumption |
Publications (2)
| Publication Number | Publication Date |
|---|---|
| US20150271043A1 US20150271043A1 (en) | 2015-09-24 |
| US9806973B2 true US9806973B2 (en) | 2017-10-31 |
Family
ID=54143124
Family Applications (1)
| Application Number | Title | Priority Date | Filing Date |
|---|---|---|---|
| US14/217,825 Active 2035-06-07 US9806973B2 (en) | 2014-03-18 | 2014-03-18 | Bandwidth analytics in a software defined network (SDN) controlled multi-layer network for dynamic estimation of power consumption |
Country Status (1)
| Country | Link |
|---|---|
| US (1) | US9806973B2 (en) |
Cited By (3)
| Publication number | Priority date | Publication date | Assignee | Title |
|---|---|---|---|---|
| CN109982385A (en) * | 2017-12-27 | 2019-07-05 | 中国移动通信集团公司 | Network intelligence equalization methods and device based on LTE type of service feature |
| US10608774B2 (en) | 2018-07-27 | 2020-03-31 | At&T Intellectual Property I, L.P. | Network switch and optical transponder connectivity verification for wavelength division multiplexing network |
| US11361294B2 (en) | 2020-05-14 | 2022-06-14 | Ciena Corporation | Systems and methods for creating and activating a license |
Families Citing this family (9)
| Publication number | Priority date | Publication date | Assignee | Title |
|---|---|---|---|---|
| US20150043911A1 (en) * | 2013-08-07 | 2015-02-12 | Nec Laboratories America, Inc. | Network Depth Limited Network Followed by Compute Load Balancing Procedure for Embedding Cloud Services in Software-Defined Flexible-Grid Optical Transport Networks |
| WO2017219173A1 (en) * | 2016-06-20 | 2017-12-28 | Telefonaktiebolaget Lm Ericsson (Publ) | Method and device for determining resource utilization |
| US10949233B2 (en) | 2016-06-22 | 2021-03-16 | Ciena Corporation | Optimized virtual network function service chaining with hardware acceleration |
| US10169028B2 (en) * | 2016-12-13 | 2019-01-01 | Ciena Corporation | Systems and methods for on demand applications and workflow management in distributed network functions virtualization |
| CN108199906B (en) * | 2018-02-07 | 2021-03-30 | 深圳市风云实业有限公司 | Abnormal traffic processing method and device in SDN framework and user terminal |
| CN109039833B (en) * | 2018-09-30 | 2022-11-22 | 网宿科技股份有限公司 | Method and device for monitoring bandwidth state |
| CN111431760B (en) * | 2020-02-28 | 2021-07-06 | 深圳市风云实业有限公司 | Method for measuring bandwidth utilization rate of port in switching chip |
| US11128539B1 (en) | 2020-05-05 | 2021-09-21 | Ciena Corporation | Utilizing images to evaluate the status of a network system |
| CN113055221B (en) * | 2020-12-15 | 2022-12-23 | 国网冀北电力有限公司经济技术研究院 | Typical bandwidth demand measuring and calculating method for power communication network transmission network based on region division |
Citations (30)
| Publication number | Priority date | Publication date | Assignee | Title |
|---|---|---|---|---|
| US20090281679A1 (en) * | 2008-05-09 | 2009-11-12 | Taft Jeffrey D | Intelligent monitoring of an electrical utility grid |
| US20120022707A1 (en) * | 2003-08-08 | 2012-01-26 | Electric Power Group, Llc | Wide-area, real-time monitoring and visualization system |
| US20120029720A1 (en) * | 2010-07-29 | 2012-02-02 | Spirae, Inc. | Dynamic distributed power grid control system |
| US20120082159A1 (en) | 2010-10-05 | 2012-04-05 | Cisco Technology, Inc. | System and method for providing smart grid communications and management |
| US20120226796A1 (en) * | 2011-03-01 | 2012-09-06 | Morgan Christopher Edwin | Systems and methods for generating optimized resource consumption periods for multiple users on combined basis |
| US20120310424A1 (en) * | 2011-05-31 | 2012-12-06 | Cisco Technology, Inc. | Control federation for utility grids |
| WO2013106923A1 (en) | 2012-01-20 | 2013-07-25 | Energy Aware Technology Inc. | System and method of compiling and organizing power consumption data and converting such data into one or more user actionable formats |
| US20130259465A1 (en) | 2011-07-07 | 2013-10-03 | Ciena Corporation | Ethernet private local area network systems and methods |
| US20130265886A1 (en) | 2011-09-30 | 2013-10-10 | Gigamon Llc | Systems and methods for implementing a traffic visibility network |
| US8588991B1 (en) | 2012-07-31 | 2013-11-19 | Causam Holdings, LLC | System, method, and apparatus for electric power grid and network management of grid elements |
| US20130310996A1 (en) * | 2010-01-08 | 2013-11-21 | International Business Machines Corporation | Power profile management |
| US20130318243A1 (en) | 2012-05-23 | 2013-11-28 | Brocade Communications Systems, Inc. | Integrated heterogeneous software-defined network |
| US20130315580A1 (en) | 2012-02-13 | 2013-11-28 | Ciena Corporation | Software defined networking photonic routing systems and methods |
| US20130326250A1 (en) | 2012-05-31 | 2013-12-05 | At&T Intellectual Property I, Lp | Managing power consumption of electronic devices responsive to usage forecast |
| US20140215077A1 (en) * | 2013-01-26 | 2014-07-31 | Lyatiss, Inc. | Methods and systems for detecting, locating and remediating a congested resource or flow in a virtual infrastructure |
| US20140215058A1 (en) * | 2013-01-26 | 2014-07-31 | Lyatiss, Inc. | Methods and systems for estimating and analyzing flow activity and path performance data in cloud or distributed systems |
| US20140215465A1 (en) * | 2013-01-28 | 2014-07-31 | Uri Elzur | Traffic and/or workload processing |
| US20140280488A1 (en) * | 2013-03-15 | 2014-09-18 | Cisco Technology, Inc. | Automatic configuration of external services based upon network activity |
| US20140371941A1 (en) * | 2013-06-18 | 2014-12-18 | The Regents Of The University Of Colorado, A Body Corporate | Software-defined energy communication networks |
| US20150039764A1 (en) * | 2013-07-31 | 2015-02-05 | Anton Beloglazov | System, Method and Computer Program Product for Energy-Efficient and Service Level Agreement (SLA)-Based Management of Data Centers for Cloud Computing |
| US20150039734A1 (en) * | 2013-08-05 | 2015-02-05 | The Trustees Of The University Of Pennsylvania | Methods, systems, and computer readable media for enabling real-time guarantees in publish-subscribe middleware using dynamically reconfigurable networks |
| US20150094871A1 (en) * | 2013-09-27 | 2015-04-02 | International Business Machines Corporation | Managing devices in micro-grids |
| US20150135176A1 (en) * | 2013-04-30 | 2015-05-14 | Empire Technology Development Llc | Reactive loop sensing in multi-datacenter deployments |
| US20150163162A1 (en) * | 2013-12-10 | 2015-06-11 | International Business Machines Corporation | Software-defined networking single-source enterprise workload manager |
| US20150171953A1 (en) * | 2013-12-13 | 2015-06-18 | Futurewei Technologies, Inc. | Software-Defined Network Infrastructure Having Virtual Range Extenders |
| US20150188837A1 (en) * | 2013-12-26 | 2015-07-02 | Futurewei Technologies, Inc. | Hierarchical Software-Defined Network Traffic Engineering Controller |
| US20150207677A1 (en) * | 2012-12-18 | 2015-07-23 | Juniper Networks, Inc. | Subscriber management and network service integration for software-defined networks having centralized control |
| US20150229661A1 (en) * | 2011-11-07 | 2015-08-13 | Netflow Logic Corporation | Method and system for confident anomaly detection in computer network traffic |
| US20150263906A1 (en) * | 2014-03-14 | 2015-09-17 | Avni Networks Inc. | Method and apparatus for ensuring application and network service performance in an automated manner |
| US20150263519A1 (en) * | 2014-03-17 | 2015-09-17 | Nec Corporation | Demand area power system building system, virtual electrical grid building apparatus, power transmission/reception unit, demand area power system building method, and program |
-
2014
- 2014-03-18 US US14/217,825 patent/US9806973B2/en active Active
Patent Citations (34)
| Publication number | Priority date | Publication date | Assignee | Title |
|---|---|---|---|---|
| US8401710B2 (en) | 2003-08-08 | 2013-03-19 | Electric Power Group, Llc | Wide-area, real-time monitoring and visualization system |
| US20120022707A1 (en) * | 2003-08-08 | 2012-01-26 | Electric Power Group, Llc | Wide-area, real-time monitoring and visualization system |
| US20090281679A1 (en) * | 2008-05-09 | 2009-11-12 | Taft Jeffrey D | Intelligent monitoring of an electrical utility grid |
| US20130310996A1 (en) * | 2010-01-08 | 2013-11-21 | International Business Machines Corporation | Power profile management |
| US20120029720A1 (en) * | 2010-07-29 | 2012-02-02 | Spirae, Inc. | Dynamic distributed power grid control system |
| US20120082048A1 (en) | 2010-10-05 | 2012-04-05 | Cisco Technology, Inc. | System and method for providing smart grid communications and management |
| US20120082159A1 (en) | 2010-10-05 | 2012-04-05 | Cisco Technology, Inc. | System and method for providing smart grid communications and management |
| US20120226796A1 (en) * | 2011-03-01 | 2012-09-06 | Morgan Christopher Edwin | Systems and methods for generating optimized resource consumption periods for multiple users on combined basis |
| US20120310424A1 (en) * | 2011-05-31 | 2012-12-06 | Cisco Technology, Inc. | Control federation for utility grids |
| US20120310434A1 (en) | 2011-05-31 | 2012-12-06 | Cisco Technology, Inc. | Variable topology distributed intelligence for utility grid control operation services |
| US20130259465A1 (en) | 2011-07-07 | 2013-10-03 | Ciena Corporation | Ethernet private local area network systems and methods |
| US20130265886A1 (en) | 2011-09-30 | 2013-10-10 | Gigamon Llc | Systems and methods for implementing a traffic visibility network |
| US20150229661A1 (en) * | 2011-11-07 | 2015-08-13 | Netflow Logic Corporation | Method and system for confident anomaly detection in computer network traffic |
| WO2013106923A1 (en) | 2012-01-20 | 2013-07-25 | Energy Aware Technology Inc. | System and method of compiling and organizing power consumption data and converting such data into one or more user actionable formats |
| US20130315580A1 (en) | 2012-02-13 | 2013-11-28 | Ciena Corporation | Software defined networking photonic routing systems and methods |
| US20130318243A1 (en) | 2012-05-23 | 2013-11-28 | Brocade Communications Systems, Inc. | Integrated heterogeneous software-defined network |
| US20130326250A1 (en) | 2012-05-31 | 2013-12-05 | At&T Intellectual Property I, Lp | Managing power consumption of electronic devices responsive to usage forecast |
| US20140039699A1 (en) * | 2012-07-31 | 2014-02-06 | Joseph W. Forbes, Jr. | System, method, and apparatus for electric power grid and network management of grid elements |
| US8588991B1 (en) | 2012-07-31 | 2013-11-19 | Causam Holdings, LLC | System, method, and apparatus for electric power grid and network management of grid elements |
| US20150207677A1 (en) * | 2012-12-18 | 2015-07-23 | Juniper Networks, Inc. | Subscriber management and network service integration for software-defined networks having centralized control |
| US20140215077A1 (en) * | 2013-01-26 | 2014-07-31 | Lyatiss, Inc. | Methods and systems for detecting, locating and remediating a congested resource or flow in a virtual infrastructure |
| US20140215058A1 (en) * | 2013-01-26 | 2014-07-31 | Lyatiss, Inc. | Methods and systems for estimating and analyzing flow activity and path performance data in cloud or distributed systems |
| US20140215465A1 (en) * | 2013-01-28 | 2014-07-31 | Uri Elzur | Traffic and/or workload processing |
| US20140280488A1 (en) * | 2013-03-15 | 2014-09-18 | Cisco Technology, Inc. | Automatic configuration of external services based upon network activity |
| US20150135176A1 (en) * | 2013-04-30 | 2015-05-14 | Empire Technology Development Llc | Reactive loop sensing in multi-datacenter deployments |
| US20140371941A1 (en) * | 2013-06-18 | 2014-12-18 | The Regents Of The University Of Colorado, A Body Corporate | Software-defined energy communication networks |
| US20150039764A1 (en) * | 2013-07-31 | 2015-02-05 | Anton Beloglazov | System, Method and Computer Program Product for Energy-Efficient and Service Level Agreement (SLA)-Based Management of Data Centers for Cloud Computing |
| US20150039734A1 (en) * | 2013-08-05 | 2015-02-05 | The Trustees Of The University Of Pennsylvania | Methods, systems, and computer readable media for enabling real-time guarantees in publish-subscribe middleware using dynamically reconfigurable networks |
| US20150094871A1 (en) * | 2013-09-27 | 2015-04-02 | International Business Machines Corporation | Managing devices in micro-grids |
| US20150163162A1 (en) * | 2013-12-10 | 2015-06-11 | International Business Machines Corporation | Software-defined networking single-source enterprise workload manager |
| US20150171953A1 (en) * | 2013-12-13 | 2015-06-18 | Futurewei Technologies, Inc. | Software-Defined Network Infrastructure Having Virtual Range Extenders |
| US20150188837A1 (en) * | 2013-12-26 | 2015-07-02 | Futurewei Technologies, Inc. | Hierarchical Software-Defined Network Traffic Engineering Controller |
| US20150263906A1 (en) * | 2014-03-14 | 2015-09-17 | Avni Networks Inc. | Method and apparatus for ensuring application and network service performance in an automated manner |
| US20150263519A1 (en) * | 2014-03-17 | 2015-09-17 | Nec Corporation | Demand area power system building system, virtual electrical grid building apparatus, power transmission/reception unit, demand area power system building method, and program |
Non-Patent Citations (1)
| Title |
|---|
| Ye Yan et al., "A Survey on Smart Grid Communication Infrastructures: Motivations, Requirements and Challenges," IEEE Communications Surveys & Tutorials, Accepted for Publication, Apr. 25, 2011. |
Cited By (6)
| Publication number | Priority date | Publication date | Assignee | Title |
|---|---|---|---|---|
| CN109982385A (en) * | 2017-12-27 | 2019-07-05 | 中国移动通信集团公司 | Network intelligence equalization methods and device based on LTE type of service feature |
| CN109982385B (en) * | 2017-12-27 | 2021-02-09 | 中国移动通信集团公司 | Network intelligent balancing method and device based on LTE service type characteristics |
| US10608774B2 (en) | 2018-07-27 | 2020-03-31 | At&T Intellectual Property I, L.P. | Network switch and optical transponder connectivity verification for wavelength division multiplexing network |
| US11012174B2 (en) | 2018-07-27 | 2021-05-18 | At&T Intellectual Property I, L.P. | Network switch and optical transponder connectivity verification for wavelength division multiplexing network |
| US11329751B2 (en) | 2018-07-27 | 2022-05-10 | At&T Intellectual Property I, L.P. | Network switch and optical transponder connectivity verification for wavelength division multiplexing network |
| US11361294B2 (en) | 2020-05-14 | 2022-06-14 | Ciena Corporation | Systems and methods for creating and activating a license |
Also Published As
| Publication number | Publication date |
|---|---|
| US20150271043A1 (en) | 2015-09-24 |
Similar Documents
| Publication | Publication Date | Title |
|---|---|---|
| US9806973B2 (en) | Bandwidth analytics in a software defined network (SDN) controlled multi-layer network for dynamic estimation of power consumption | |
| US10809288B2 (en) | Distributed smart grid processing | |
| CA2870080C (en) | Network node failure predictive system | |
| US11605036B2 (en) | System and methods for power system forecasting using deep neural networks | |
| AU2008222794B2 (en) | Energy switch router | |
| US20140052304A1 (en) | Dynamic enforcement of power management policy and methods thereof | |
| US20120326883A1 (en) | Distributed meter data management | |
| US20150286507A1 (en) | Method, node and computer program for enabling automatic adaptation of resource units | |
| US20120233473A1 (en) | Power Management in Networks | |
| US10819637B2 (en) | Determination and indication of network traffic congestion | |
| DK177857B1 (en) | Monitoring System | |
| US20120116724A1 (en) | Sensor data transmission frequency controller using sensor situation information | |
| JP2017530671A (en) | Method and apparatus for remote electrical load management | |
| US20140330955A1 (en) | Monitoring the Health of a Home Area Network | |
| JP2012118982A (en) | System and method for estimating demand response in electric power systems | |
| Batra et al. | Data driven energy efficiency in buildings | |
| Ghosh et al. | PLEMS: Plug load energy management solution for enterprises | |
| CN104067560A (en) | Identifying network communication patterns | |
| US20120290651A1 (en) | Nodal data processing system and method | |
| JP6707646B2 (en) | System and method for dealing with outages in utility systems | |
| US10051569B2 (en) | Methods for enterprise based socially aware energy budget management and devices thereof | |
| Mikkola et al. | Near real time energy monitoring for end users: Requirements and sample applications | |
| EP3953717A1 (en) | Method for detecting energy consumption fraud in an electricity supply service | |
| Stănică et al. | IoT cloud solution for efficient electricity consumption | |
| Miškuf et al. | Smart metering IoT solution based on NodeMCU for more accurate energy consumption analysis |
Legal Events
| Date | Code | Title | Description |
|---|---|---|---|
| AS | Assignment |
Owner name: CIENA CORPORATION, MARYLAND Free format text: ASSIGNMENT OF ASSIGNORS INTEREST;ASSIGNORS:HTAY, AUNG;HUDGINS, PAUL;KORE, MALLIKARJUNAPPA;REEL/FRAME:032462/0910 Effective date: 20140313 |
|
| AS | Assignment |
Owner name: DEUTSCHE BANK AG NEW YORK BRANCH, NEW YORK Free format text: SECURITY INTEREST;ASSIGNOR:CIENA CORPORATION;REEL/FRAME:033329/0417 Effective date: 20140715 |
|
| AS | Assignment |
Owner name: BANK OF AMERICA, N.A., AS ADMINISTRATIVE AGENT, NO Free format text: PATENT SECURITY AGREEMENT;ASSIGNOR:CIENA CORPORATION;REEL/FRAME:033347/0260 Effective date: 20140715 |
|
| STCF | Information on status: patent grant |
Free format text: PATENTED CASE |
|
| AS | Assignment |
Owner name: CIENA CORPORATION, MARYLAND Free format text: RELEASE BY SECURED PARTY;ASSIGNOR:DEUTSCHE BANK AG NEW YORK BRANCH;REEL/FRAME:050938/0389 Effective date: 20191028 |
|
| AS | Assignment |
Owner name: BANK OF AMERICA, N.A., AS COLLATERAL AGENT, ILLINO Free format text: PATENT SECURITY AGREEMENT;ASSIGNOR:CIENA CORPORATION;REEL/FRAME:050969/0001 Effective date: 20191028 |
|
| AS | Assignment |
Owner name: CIENA CORPORATION, MARYLAND Free format text: RELEASE BY SECURED PARTY;ASSIGNOR:BANK OF AMERICA, N.A.;REEL/FRAME:065630/0232 Effective date: 20231024 |