US9792091B2 - Quantitative evaluation and optimization of user interface software design - Google Patents
Quantitative evaluation and optimization of user interface software design Download PDFInfo
- Publication number
- US9792091B2 US9792091B2 US14/568,135 US201414568135A US9792091B2 US 9792091 B2 US9792091 B2 US 9792091B2 US 201414568135 A US201414568135 A US 201414568135A US 9792091 B2 US9792091 B2 US 9792091B2
- Authority
- US
- United States
- Prior art keywords
- module
- design
- user
- time
- elements
- Prior art date
- Legal status (The legal status is an assumption and is not a legal conclusion. Google has not performed a legal analysis and makes no representation as to the accuracy of the status listed.)
- Active, expires
Links
Images


Classifications
-
- G—PHYSICS
- G06—COMPUTING; CALCULATING OR COUNTING
- G06F—ELECTRIC DIGITAL DATA PROCESSING
- G06F8/00—Arrangements for software engineering
- G06F8/20—Software design
-
- G—PHYSICS
- G06—COMPUTING; CALCULATING OR COUNTING
- G06Q—INFORMATION AND COMMUNICATION TECHNOLOGY [ICT] SPECIALLY ADAPTED FOR ADMINISTRATIVE, COMMERCIAL, FINANCIAL, MANAGERIAL OR SUPERVISORY PURPOSES; SYSTEMS OR METHODS SPECIALLY ADAPTED FOR ADMINISTRATIVE, COMMERCIAL, FINANCIAL, MANAGERIAL OR SUPERVISORY PURPOSES, NOT OTHERWISE PROVIDED FOR
- G06Q10/00—Administration; Management
- G06Q10/06—Resources, workflows, human or project management; Enterprise or organisation planning; Enterprise or organisation modelling
- G06Q10/063—Operations research, analysis or management
- G06Q10/0637—Strategic management or analysis, e.g. setting a goal or target of an organisation; Planning actions based on goals; Analysis or evaluation of effectiveness of goals
-
- G—PHYSICS
- G06—COMPUTING; CALCULATING OR COUNTING
- G06F—ELECTRIC DIGITAL DATA PROCESSING
- G06F8/00—Arrangements for software engineering
- G06F8/30—Creation or generation of source code
- G06F8/38—Creation or generation of source code for implementing user interfaces
Definitions
- the present disclosure relates generally to software design, and specifically to quantitative evaluation and optimization of user interface and design processes.
- the software development cycle may include the following stages: define, design, develop, and deliver.
- the design stage is an abstraction of user and/or system activities of the process.
- the design stage may include architectures, algorithms, and user interfaces.
- the design stage allows users to carry out the defined process over information technology or IT infrastructures.
- the define stage and the design stage may have some overlap, which means the define stage may take certain IT factors into account and the design stage can help refine the software process.
- Tasks may be divided into smaller sub-tasks or sub-processes. Different algorithms may be used, as well as different data structures. Different user interface or UI elements may be used for the same task or sub-task (e.g., checkbox vs. radio box).
- a complete software design specification may be based on the choices of these options. These choices may have great impact on the general performance of the software, which includes usability, utility, and total time that users need to spend on the software to finish the process, etc.
- a design step in a software process is chosen.
- the software process may be evaluated with different design elements, and time penalties for the different design elements may be determined during the evaluation.
- a design element of the design step may then be changed to one of the different design elements with the lowest time penalty.
- FIG. 1 illustrates an exemplary process diagram
- FIG. 2 illustrates an exemplary system
- FIG. 3 illustrates an exemplary graph of a penalty function over finish time of a sub-process
- FIG. 4 illustrates an exemplary data flow
- FIG. 5 illustrates another exemplary data flow
- FIG. 6 illustrates an exemplary flow of optimization processes for software development
- FIG. 7 illustrates an exemplary computing system to implement in accordance with the technologies described herein.
- Described herein are a system and method to provide quantitative measure of efficiency of user interface or software design process, optimization of user interface or software design process, adaptive design optimization for different devices; and integration with user feedback and reflection of user behavior.
- the term user may refer to a developer, customer, or agent.
- FIG. 1 shows an example process diagram 100 .
- a process is a collection of structured activities or tasks that produce a specific result (e.g., service and product).
- the process may be carried out by multiple persons or users 102 .
- the structure of a process is usually defined at the define stage of software development and represents a basic logic of a business process, which is relatively stable.
- the process 100 includes sub-processes 104 .
- a sub-process 104 is a series of user actions and related system actions.
- a sub-process 104 is performed by one person or user 102 .
- User actions are mainly about understanding the user interface or UI, and making proper interactions 106 .
- Interaction elements or interactions 106 that are chosen at design stage have great impact on user 102 actions.
- System actions are related to computation of processors and data transfer. Performance of system actions are decided by computation elements chosen at the design stage.
- a computation 108 step may be triggered by the interactions 106 , and the user 102 may need to wait for the system to finish the computation 108 in order to carry out the next round of interactions 106 .
- Process 100 may be considered as having a three layer structure. Process 100 may be considered as a first layer. Process 100 is made of a second layer of sub-processes 104 . Sub-processes 104 are made up of a third layer of interaction 106 steps and computation 108 steps.
- Process 100 may be defined as having a basic structure of a business process and is relatively stable (not readily changed). The process 100 may be carried out by multiple users 102 . In this description, the set of process 100 is referred to as P, and indexed by p.
- Sub-process 104 has a sequential structure and may be carried by one person or user 102 .
- a sub-process 104 may be part of a different process (other than process 100 ).
- the sub-process 104 may be achieved through different designs.
- the set of sub-processes 104 is referred to as S, indexed by s; the set of sub-processes 104 in process p is SUB p ; the penalty function for the finish time of each sub-process s is PEN s .
- Interaction 106 step defines a series of user 102 interactions with the system. Interaction 106 may be achieved through different interaction elements (i.e., one interaction element for one interaction step).
- the set of interaction 106 steps in sub-process s is ISTP s .
- the set of interaction elements is l, indexed by i.
- For each interaction 106 step istp ⁇ ISTP s the set of possible interaction elements is IO istp , and the chosen interaction element may be denoted as i istp .
- the time distribution used on interaction element i may be determined by the user 102 role r and experience level l, as denoted by FI irl .
- Computation 108 step defines a series of system computations and data transfers. Computation 108 step may be achieved through different computation elements (i.e., one computation element for one computation step).
- the set of computation 108 steps in sub-process s is CSTP s .
- the set of computation elements is C, indexed by c.
- the set of possible computation elements is CO cstp and the chosen computation element may be denoted as c cstp .
- the time used on computation element c may be determined by the size of related data and the configuration of hardware, as denoted by a function TC c (SZ o , CF o ).
- An organization includes an IT system and personnel or users of different roles and experience levels.
- the set of types of organizations is defined as O, and indexed by o.
- the number of each organization type o may be defined as N o .
- the number of executions of each process p for each organization type o in a fixed period of time may be defined as NE op .
- the percentage of execution for user of each role r and each experience level l is PER osrl .
- the size of data in the IT system may be defined as SZ o .
- Hardware configuration of the IT system may be defined as CF o .
- the set of roles may be defined as R, and indexed as r.
- the set of experience levels may be defined as L, and indexed by l.
- the weight for user of each role r and experience level l in each organization o may be defined as w orl .
- FIG. 2 shows an example system 200 .
- the system 200 includes a process module 202 , a customer module 204 , a simulation and evaluation module 206 , and an optimization module 208 .
- the process module 202 models process and sub-process 210 , interaction elements 212 , and computation elements 214 .
- the process module 202 receives structures of process designs from a manual process design module 216 .
- the customer module 204 models the behaviors of organizations using the software, including IT system behaviors and user behaviors.
- the customer module 204 receives input from manual configuration module 218 , testing module 220 , and user feedback module 222 .
- the input from manual configuration module 218 is an estimation of system behaviors and user behaviors.
- the input from testing module 220 may include system behaviors and user behaviors collected through the testing stage.
- the input from user feedback module 222 may include system behaviors and user behaviors collected through the execution of business processes.
- the customer module 204 sends system related information, including data size and hardware configuration, to the process module 202 to get the time used on computation elements 214 .
- the customer module 204 also sends user related information to the process module 202 , such as role and experience level, to get the time used on interaction elements 212 .
- the simulation and evaluation module 206 receives information from the process module 202 and the customer module 204 , and sends the results to a visualization and analysis module 224 .
- the customer module 204 includes organization module 226 .
- the organization module 226 includes IT system 228 and user 230 modules.
- the optimization module 208 receives information from the process module 202 and the customer module 204 , and computes the optimal choices for interaction elements 212 and computation elements 214 , and sends the results back to the process module 202 to optimize sub-processes 210 .
- the time distribution and time penalty of a user with a role r and experience level l in an organization type o to finish a sub-process s may be denoted as FS orls , and determined as follows.
- i istp For each interaction step istp ⁇ ISTP s , its chosen interaction element is i istp .
- Sampling once from its time distribution FI (i istp )rl gives one instance of interaction time for a user of role r and experience level l to finish the interaction element i istp .
- the sampled time could be denoted as TI istp .
- TS orls ⁇ istp ⁇ ISTP s TI istp + ⁇ cstp ⁇ CSTP s TC c istp ( SZ O ,CF O ) Equation 1
- NS a considerable number of times
- TS orls the same amount of TS orls may be generated.
- the distribution is an approximation to the exact distribution. Generally speaking, more sampling times may lead to more accurate approximation.
- the distribution of TS orls may be used as FS orls .
- FIG. 3 shows an example graph 300 of a penalty function of experience level L 302 over finish time t 304 of a sub-process.
- the penalty is 0 when the finish time is lower than a certain threshold T 306 .
- Graph 300 shows that users can be more focused and assured of efficiency of the whole process, if the sub-process can be finished relatively quickly.
- the penalty function may also be a linear function.
- the expected time penalty may be approximated as defined by the following Equation 2.
- PENOSRL orls ⁇ NS ⁇ PEN S ⁇ ( TS orls ) NS Equation ⁇ ⁇ 2
- FIG. 4 shows an example related data flow 400 between the modules.
- the information “Role, Experience Level, Data Size, and Hardware Configuration” 402 is provided by customer module 204 to process module 202 .
- Interaction elements 212 provide “Interaction Time” 404 to simulation and evaluation module 206 .
- Computation elements 214 provide “Computation Time” 406 to simulation and evaluation module 206 .
- the time distribution of an organization of type o to finish a process may be denoted as FP op and determined as follows.
- sampling once from the percentage of execution PER osrl for user of each role r and each experience level l on sub-process s and organization type o gives a user of role r and experience level l.
- sampling once from FS orls gives the time for one execution of sub-process s.
- the time may be denoted as TS s .
- a graph may be constructed according to the structure of process p.
- Each sub-process s ⁇ SUB p may be treated as a node with execution time TS s .
- a start node and an end node may be added to the graph. The start node connects to the nodes without inbound arcs and the end node connects to the nodes without outbound arcs.
- the execution time of both nodes is 0.
- the following pseudo code listing may define such a function.
- EndTime(Node s) if Node s is the start node then return 0 else for all q in Prerequisite(s) do preEndTime[q] ⁇ EndTime(Node s) end for return TS s + max(preEndTime[q]) end if end function
- TP op EndTime(EndNode).
- the time distribution of an organization of type o to finish a process p shows an aspect of the process' efficiency. Prolonged processes are more vulnerable to disruptions.
- FIG. 5 shows an example related data flow 500 between the modules.
- the information “Percentage of execution for each role and each experience level” 502 is provided by the organization module 226 of customer module 204 to simulation and evaluation module 206 .
- Process module 202 provides “Process structure” 504 to simulation and evaluation module 206 .
- the weighted total time to finish a process p for an organization of type o may be defined by the following Equation 3.
- WTOP op ⁇ rinR ⁇ linL ⁇ s ⁇ SUB p mean( FS orls ) w orl PER osrl Equation 3
- WTOP op is the total time of all users to finish a process p for an organization of type o.
- the weighted total time for an organization of type o to finish all type p processes in a certain period of time could be defined by the following Equation 4.
- WTO op WTOP op NE op Equation 4
- the weighted total time for all users to finish all type p processes in a certain period of time may be defined by the following Equation 5.
- WT p ⁇ oinO WTO op N o Equation 5
- a high WT p may indicate a process redesign potential to improve overall user efficiency.
- the weighted total time penalty to finish a sub-process s for an organization of type o may be determined as follows. A search is performed for the set of processes, PS s which contain sub-process s.
- a determination may be made as to optimization of a sub-process s for an organization type o or for all users.
- the objectives are to minimize PENOS os and PENS s respectively.
- optimization of a sub-process s for an organization of type o and for users may be realized with the following. Optimization of sub-process s may involve choosing the proper combination of interaction elements and computation elements for each interaction step and each computation step. The optimal combination could be reached through a “greedy” process. For each “greedy” step, an interaction step or a computation step is randomly chosen. Without loss generality and assuming an interaction step is chosen, evaluation is performed as to the weighted total time penalties for designs using different interaction elements for this step while fixing other design elements. The interaction element with the lowest weighted total time penalty is chosen for this interaction step. The “greedy” process may be continued until no further improvement may be found. When optimizing for organization type o, the weighted total time penalty used for optimization is PENOS os . When optimizing for all users, the weighted total time penalty used for optimization is PENS s .
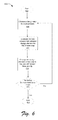
- FIG. 6 shows an exemplary process 600 for implementing, at least in part, the technology described herein.
- process 600 depicts an example flow of optimization processes for software development.
- the process 600 may be performed by a computing device.
- An example architecture of such a computer device is described below with reference to FIG. 7 .
- process 600 begins.
- choosing a design step in a sub-process is performed.
- evaluating the sub-process with different design elements for the chosen design step is performed.
- Implementing the described technologies may provide a quantitative measure of efficiency of UI/software design process.
- Business processes include a sequence of tasks, which are carried out by users of different roles and experiences.
- the efficiency of software design is assessed through massive simulations of user behaviors under various business scenarios.
- To simulate the overall user efficiency of an organization a certain amount of artificial agents are generated to simulate the general behaviors of employees or users of the organization.
- Each agent or user may have several properties, including role and experience level.
- Implementing the described technologies may provide optimization of UI/software design process. There may be many design options at different aspects of a software system. It may be difficult to strike a balance among conflicting design targets (e.g., usability versus utility). Different design targets may lead to varying efficiencies for different roles. For example, concise UI may improve the efficiency of inexperienced users, but may decrease the efficiency of experienced users. The overall efficiency may be improved through choosing the optimized design elements.
- design targets e.g., usability versus utility
- Implementing the described technologies may further provide adaptive design optimization for different devices. For example, more and more mobile devices have been introduced to enterprises. Business processes may not only be carried out on computers (e.g., personal computers), but may also be carried out on various mobile devices. This can bring great flexibility to businesses. However, the interaction with mobile devices is different from PCs (e.g., touch screen versus keyboard or mouse). It may not be as simple to use PC design elements for mobile devices. The described technologies allow for optimization of design elements to be extended to different devices.
- Implementing the described technologies may further provide relatively easier integration with a user feedback system and quick reflection of user behavior, after software is delivered to the customer(s).
- User behaviors may be modelled through user statistics collected under real business scenarios.
- User statistics may include users' operation time, background running time, data transfer time, and loading time of UI for each sub-process of different business processes. Troubleshooting and pin pointing problems may be performed quicker and be indicative of potential direction of design improvement. In addition, frequently used processes may be identified. Improvements may be prioritized in next or future round of development cycle. Actual user statistics can help to model user behaviors more accurately. The evaluation of efficiency would be more accurate and reliable.
- user statistics could be collected in real-time. The changes in user behavior could be reflected in hours, instead of months. And the evolution of software could be guided in user-centered manner instead of through a bunch of bug fixes.
- FIG. 7 illustrates an exemplary system 700 that may implement, at least in part, the technologies described herein.
- the computer system 700 includes one or more processors, such as processor 704 .
- Processor 704 can be a special-purpose processor or a general-purpose processor.
- Processor 704 is connected to a communication infrastructure 702 (for example, a bus or a network).
- a communication infrastructure 702 for example, a bus or a network.
- the computer system 700 may also be called a client device.
- Computer system 700 also includes a main memory 706 , preferably Random Access Memory (RAM), containing possibly inter alia computer software and/or data 708 .
- main memory 706 preferably Random Access Memory (RAM)
- RAM Random Access Memory
- Computer system 700 may also include a secondary memory 710 .
- Secondary memory 710 may include, for example, a hard disk drive 712 , a removable storage drive 714 , a memory stick, etc.
- a removable storage drive 714 may comprise a floppy disk drive, a magnetic tape drive, an optical disk drive, a flash memory, or the like.
- a removable storage drive 714 reads from and/or writes to a removable storage unit 716 in a well-known manner.
- a removable storage unit 716 may comprise a floppy disk, a magnetic tape, an optical disk, etc. which is read by and written to by removable storage drive 714 .
- removable storage unit 716 includes a computer usable storage medium 718 having stored therein possibly inter alia computer software and/or data 720 .
- secondary memory 710 may include other similar means for allowing computer programs or other instructions to be loaded into computer system 700 .
- Such means may include, for example, a removable storage unit 724 and an interface 722 .
- Examples of such means may include a program cartridge and cartridge interface (such as that found in video game devices), a removable memory chip (such as an Erasable Programmable Read-Only Memory (EPROM), or Programmable Read-Only Memory (PROM)) and associated socket, and other removable storage units 724 and interfaces 722 which allow software and data to be transferred from the removable storage unit 724 to computer system 700 .
- EPROM Erasable Programmable Read-Only Memory
- PROM Programmable Read-Only Memory
- Computer system 700 may also include an input interface 726 and a range of input devices 728 such as, possibly inter alia, a keyboard, a mouse, etc.
- Computer system 700 may also include an output interface 730 and a range of output devices 732 such as, possibly inter alia, a display, one or more speakers, etc.
- Computer system 700 may also include a communications interface 734 .
- Communications interface 734 allows software and/or data 738 to be transferred between computer system 700 and external devices.
- Communications interface 734 may include a modem, a network interface (such as an Ethernet card), a communications port, a Personal Computer Memory Card International Association (PCMCIA) slot and card, or the like.
- Software and/or data 738 transferred via communications interface 734 are in the form of signals 736 which may be electronic, electromagnetic, optical, or other signals capable of being received by communications interface 734 . These signals 736 are provided to communications interface 734 via a communications path 740 .
- Communications path 740 carries signals and may be implemented using a wire or cable, fiber optics, a phone line, a cellular phone link, a Radio Frequency (RF) link or other communication channels.
- RF Radio Frequency
- computer-program medium generally refer to media such as removable storage unit 716 , removable storage unit 724 , and a hard disk installed in hard disk drive 712 .
- Computer program medium and computer usable medium can also refer to memories, such as main memory 706 and secondary memory 710 , which can be memory semiconductors (e.g. Dynamic Random Access Memory (DRAM) elements, etc.).
- main memory 706 and secondary memory 710 can be memory semiconductors (e.g. Dynamic Random Access Memory (DRAM) elements, etc.).
- DRAM Dynamic Random Access Memory
- Computer programs are stored in main memory 706 and/or secondary memory 710 . Such computer programs, when executed, enable computer system 700 to implement the present technology described herein. In particular, the computer programs, when executed, enable processor 704 to implement the processes of aspects of the above. Accordingly, such computer programs represent controllers of the computer system 700 . Where the technology described herein is implemented, at least in part, using software, the software may be stored in a computer program product and loaded into computer system 700 using removable storage drive 714 , interface 722 , hard disk drive 712 or communications interface 734 .
- the technology described herein may be implemented as computer program products comprising software stored on any computer useable medium. Such software, when executed in one or more data processing devices, causes data processing device(s) to operate as described herein.
- Embodiments of the technology described herein may employ any computer useable or readable medium, known now or in the future. Examples of computer useable mediums include, but are not limited to, primary storage devices (e.g., any type of random access memory), secondary storage devices (e.g., hard drives, floppy disks, Compact Disc Read-Only Memory (CD-ROM) disks, Zip disks, tapes, magnetic storage devices, optical storage devices, Microelectromechanical Systems (MEMS), and nanotechnological storage device, etc.).
- primary storage devices e.g., any type of random access memory
- secondary storage devices e.g., hard drives, floppy disks, Compact Disc Read-Only Memory (CD-ROM) disks, Zip disks, tapes, magnetic storage devices, optical storage devices, Microelectr
- a computing system may take the form of any combination of one or more of inter alia a wired device, a wireless device, a mobile phone, a feature phone, a smartphone, a tablet computer (such as for example an iPadTM), a mobile computer, a handheld computer, a desktop computer, a laptop computer, a server computer, an in-vehicle (e.g., audio, navigation, etc.) device, an in-appliance device, a Personal Digital Assistant (PDA), a game console, a Digital Video Recorder (DVR) or Personal Video Recorder (PVR), a cable system or other set-top-box, an entertainment system component such as a television set, etc.
- PDA Personal Digital Assistant
- DVR Digital Video Recorder
- PVR Personal Video Recorder
- the word “exemplary” is used herein to mean serving as an example, instance, or illustration. Any aspect or design described herein as exemplary is not necessarily to be construed as preferred or advantageous over other aspects or designs. Rather, use of the word “exemplary” is intended to present concepts and techniques in a concrete fashion.
- the term “technology,” for instance, may refer to one or more devices, apparatuses, systems, methods, articles of manufacture, and/or computer-readable instructions as indicated by the context described herein.
- the term “or” is intended to mean an inclusive “or” rather than an exclusive “or.” That is, unless specified otherwise or clear from context, “X employs A or B” is intended to mean any of the natural inclusive permutations. That is, if X employs A; X employs B; or X employs both A and B, then “X employs A or B” is satisfied under any of the foregoing instances.
- the articles “a” and “an” as used in this application and the appended claims should generally be construed to mean “one or more,” unless specified otherwise or clear from context to be directed to a singular form.
- One or more embodiments described herein may be implemented fully or partially in software and/or firmware.
- This software and/or firmware may take the form of instructions contained in or on a non-transitory computer-readable storage medium. Those instructions may then be read and executed by one or more processors to enable performance of the operations described herein.
- the instructions may be in any suitable form, such as but not limited to source code, compiled code, interpreted code, executable code, static code, dynamic code, and the like.
- Such a computer-readable medium may include any tangible non-transitory medium for storing information in a form readable by one or more computers, such as but not limited to read only memory (ROM); random access memory (RAM); magnetic disk storage media; optical storage media; a flash memory, etc.
Abstract
Disclosed herein are technologies for quantitative evaluation and optimization of user interface and software design. In one implementation, a design step in a software process is chosen. The software process may be evaluated with different design elements, and time penalties for the different design elements may be determined during the evaluation. A design element of the design step may then be changed to one of the different design elements with the lowest time penalty.
Description
The present disclosure relates generally to software design, and specifically to quantitative evaluation and optimization of user interface and design processes.
The software development cycle may include the following stages: define, design, develop, and deliver. In the define stage, tasks, roles and related dependencies of the execution process are modelled. The design stage is an abstraction of user and/or system activities of the process. In the design stage, the specification of software realization of the process is created. The design stage may include architectures, algorithms, and user interfaces. The design stage allows users to carry out the defined process over information technology or IT infrastructures. The define stage and the design stage may have some overlap, which means the define stage may take certain IT factors into account and the design stage can help refine the software process.
There are various possible options for process definition and software design. Tasks may be divided into smaller sub-tasks or sub-processes. Different algorithms may be used, as well as different data structures. Different user interface or UI elements may be used for the same task or sub-task (e.g., checkbox vs. radio box). A complete software design specification may be based on the choices of these options. These choices may have great impact on the general performance of the software, which includes usability, utility, and total time that users need to spend on the software to finish the process, etc.
In typical software design practices, choices as to design elements may be made by different users, based on their experience and qualitative criteria. Problems may occur when the design elements made by different users are put together. Some of these problems may not be detected until later stages. For example, the integration of tasks may create a prolonged process in which users need to be involved in a number of interactions with the software system. For example, users may get lost or make mistakes after too many pop-up windows and button clicks. Even if a user is able to finish the total process, the time may be too long and costly, drastically reducing the efficiency of the user. If these problems are found during the develop stage or after the software is delivered to customers, the cost of fixing the problems may be great. Great effort and cost may be needed to change the existing design and implementation. Sometimes systematic fixes are not possible and only workarounds may be applied. This may alleviate the problems to limited degrees; however, may make the system unnecessarily complicated. This may also lead to problems in future iterations of the software. Even if problems from poor choices of design elements are addressed at a relatively earlier stage, there may be difficulty in finding a direction to improve current software design, since these problems are usually results of multiple factors (e.g., a combination of several design elements). In other words, adjusting only one factor may not necessarily solve the problem.
Disclosed herein are technologies for quantitative evaluation and optimization of user interface and software design. In one implementation, a design step in a software process is chosen. The software process may be evaluated with different design elements, and time penalties for the different design elements may be determined during the evaluation. A design element of the design step may then be changed to one of the different design elements with the lowest time penalty.
With these and other advantages and features that will become hereinafter apparent, further information may be obtained by reference to the following detailed description and appended claims, and to the figures attached hereto.
The Detailed Description references the accompanying figures. In the figures, the left-most digit(s) of a reference number identifies the figure in which the reference number first appears. The same numbers are used throughout the drawings to reference like features and components.
Described herein are a system and method to provide quantitative measure of efficiency of user interface or software design process, optimization of user interface or software design process, adaptive design optimization for different devices; and integration with user feedback and reflection of user behavior. The term user may refer to a developer, customer, or agent.
The process 100 includes sub-processes 104. A sub-process 104 is a series of user actions and related system actions. A sub-process 104 is performed by one person or user 102. User actions are mainly about understanding the user interface or UI, and making proper interactions 106. Interaction elements or interactions 106 that are chosen at design stage have great impact on user 102 actions. System actions are related to computation of processors and data transfer. Performance of system actions are decided by computation elements chosen at the design stage. After the user 102 finishes a full interaction 106 step, a computation 108 step may be triggered by the interactions 106, and the user 102 may need to wait for the system to finish the computation 108 in order to carry out the next round of interactions 106.
Efficiencies of processes may be evaluated through the simulations of different organizations' user behaviors and system behaviors. Therefore, the organization may also be defined. An organization includes an IT system and personnel or users of different roles and experience levels.
For an organization, the set of types of organizations is defined as O, and indexed by o. The number of each organization type o may be defined as No. The number of executions of each process p for each organization type o in a fixed period of time may be defined as NEop. For each sub-process s in each organization type o, the percentage of execution for user of each role r and each experience level l is PERosrl.
For an information technology or IT system, the size of data in the IT system may be defined as SZo. Hardware configuration of the IT system may be defined as CFo.
For a user, the set of roles may be defined as R, and indexed as r. The set of experience levels may be defined as L, and indexed by l. The weight for user of each role r and experience level l in each organization o may be defined as worl.
The process module 202 models process and sub-process 210, interaction elements 212, and computation elements 214. The process module 202 receives structures of process designs from a manual process design module 216.
The customer module 204 models the behaviors of organizations using the software, including IT system behaviors and user behaviors. The customer module 204 receives input from manual configuration module 218, testing module 220, and user feedback module 222. The input from manual configuration module 218 is an estimation of system behaviors and user behaviors. The input from testing module 220 may include system behaviors and user behaviors collected through the testing stage. The input from user feedback module 222 may include system behaviors and user behaviors collected through the execution of business processes. The customer module 204 sends system related information, including data size and hardware configuration, to the process module 202 to get the time used on computation elements 214. The customer module 204 also sends user related information to the process module 202, such as role and experience level, to get the time used on interaction elements 212.
The simulation and evaluation module 206 receives information from the process module 202 and the customer module 204, and sends the results to a visualization and analysis module 224. The customer module 204 includes organization module 226. The organization module 226 includes IT system 228 and user 230 modules.
The optimization module 208 receives information from the process module 202 and the customer module 204, and computes the optimal choices for interaction elements 212 and computation elements 214, and sends the results back to the process module 202 to optimize sub-processes 210.
The time distribution and time penalty of a user with a role r and experience level l in an organization type o to finish a sub-process s may be denoted as FSorls, and determined as follows.
For each interaction step istpεISTPs, its chosen interaction element is iistp. Sampling once from its time distribution FI(i istp )rl gives one instance of interaction time for a user of role r and experience level l to finish the interaction element iistp. The sampled time could be denoted as TIistp.
For each computation step cstpεCSTPs, its chosen computation element is cistp. For an organization of type o, the time needed to finish computation element cistp is defined as TCc istp (SZO, CFO).
Therefore, for one sampling of the time for a user of role r and experience level l in organization of type o, to finish a sub-process s, is to sum the time used for each interaction element and each computation element as defined by the following Equation 1.
TS orls=ΣistpεISTPs TI istp+ΣcstpεCSTP s TC c istp (SZ O ,CF O) Equation 1
TS orls=ΣistpεISTP
Applying the above steps for a considerable number of times, which may be denoted as NS, and usually larger than 100, the same amount of TSorls may be generated. The distribution is an approximation to the exact distribution. Generally speaking, more sampling times may lead to more accurate approximation. The distribution of TSorls may be used as FSorls.
The time distribution of an organization of type o to finish a process may be denoted as FPop and determined as follows.
For each sub-process sεSUBp, sampling once from the percentage of execution PERosrl for user of each role r and each experience level l on sub-process s and organization type o gives a user of role r and experience level l. Then sampling once from FSorls gives the time for one execution of sub-process s. The time may be denoted as TSs.
A graph may be constructed according to the structure of process p. Each sub-process sεSUBp may be treated as a node with execution time TSs. A start node and an end node may be added to the graph. The start node connects to the nodes without inbound arcs and the end node connects to the nodes without outbound arcs. The execution time of both nodes is 0. The following pseudo code listing may define such a function.
| function EndTime(Node s) | |||
| if Node s is the start node then | |||
| return 0 | |||
| else | |||
| for all q in Prerequisite(s) do | |||
| preEndTime[q] ← EndTime(Node s) | |||
| end for | |||
| return TSs + max(preEndTime[q]) | |||
| end if | |||
| end function | |||
In this sampling instance, the time to finish the process p is given by TPop=EndTime(EndNode). By applying the above steps for a considerable number of times, the same amount of TPop may be generated. Its distribution is an approximation to the exact distribution. The distribution of TPop may be used as FPop.
The time distribution of an organization of type o to finish a process p shows an aspect of the process' efficiency. Prolonged processes are more vulnerable to disruptions.
The weighted total time to finish a process p for an organization of type o may be defined by the following Equation 3.
WTOP op=ΣrinRΣlinLΣsεSUBp mean(FS orls)w orl PER osrl Equation 3
WTOP op=ΣrinRΣlinLΣsεSUB
If worl=1, WTOPop is the total time of all users to finish a process p for an organization of type o. The weighted total time for an organization of type o to finish all type p processes in a certain period of time could be defined by the following Equation 4.
WTO op =WTOP op NE op Equation 4
WTO op =WTOP op NE op Equation 4
Therefore, if process p is time consuming and is executed frequently in an organization, it is important to improve the efficiency of process p. Improvement may be indicated by WTOop.
The weighted total time for all users to finish all type p processes in a certain period of time may be defined by the following Equation 5.
WT p=ΣoinO WTO op N o Equation 5
WT p=ΣoinO WTO op N o Equation 5
A high WTp may indicate a process redesign potential to improve overall user efficiency.
The weighted total time penalty to finish a sub-process s for an organization of type o may be determined as follows. A search is performed for the set of processes, PSs which contain sub-process s. The total time penalty to finish a sub-process s for an organization of type o may be defined by the following Equation 6:
PENOS os=ΣpinPSs ΣrinRΣlinL NE op PENOSRL orls PER osrl w orl Equation 6
PENOS os=ΣpinPS
If worl=1, users of different roles and different experience levels are treated equally. The weighted total time penalty to finish a sub-process s for all users may be defined by the following Equation 7.
PENS s=ΣoinO PENOS os N o Equation 7
PENS s=ΣoinO PENOS os N o Equation 7
From Equation 7, a determination may be made as to optimization of a sub-process s for an organization type o or for all users. The objectives are to minimize PENOSos and PENSs respectively.
The optimization of a sub-process s for an organization of type o and for users, may be realized with the following. Optimization of sub-process s may involve choosing the proper combination of interaction elements and computation elements for each interaction step and each computation step. The optimal combination could be reached through a “greedy” process. For each “greedy” step, an interaction step or a computation step is randomly chosen. Without loss generality and assuming an interaction step is chosen, evaluation is performed as to the weighted total time penalties for designs using different interaction elements for this step while fixing other design elements. The interaction element with the lowest weighted total time penalty is chosen for this interaction step. The “greedy” process may be continued until no further improvement may be found. When optimizing for organization type o, the weighted total time penalty used for optimization is PENOSos. When optimizing for all users, the weighted total time penalty used for optimization is PENSs.
At 602, process 600 begins.
At 604, choosing a design step in a sub-process is performed.
At 606, evaluating the sub-process with different design elements for the chosen design step is performed.
At 610, changing the design element of the step to the one with the lowest time penalty is performed.
At 612, determining whether any further improvement is required for all the steps is performed.
If no further improvement is needed, following the Yes branch of 612, at 614, the process 600 ends. If further improvement is needed, following the No branch of 612, the process goes back to 604.
The following benefits therefore may be realized. Implementing the described technologies may provide a quantitative measure of efficiency of UI/software design process. Business processes include a sequence of tasks, which are carried out by users of different roles and experiences. The efficiency of software design is assessed through massive simulations of user behaviors under various business scenarios. To simulate the overall user efficiency of an organization, a certain amount of artificial agents are generated to simulate the general behaviors of employees or users of the organization. Each agent or user may have several properties, including role and experience level.
Implementing the described technologies may provide optimization of UI/software design process. There may be many design options at different aspects of a software system. It may be difficult to strike a balance among conflicting design targets (e.g., usability versus utility). Different design targets may lead to varying efficiencies for different roles. For example, concise UI may improve the efficiency of inexperienced users, but may decrease the efficiency of experienced users. The overall efficiency may be improved through choosing the optimized design elements.
Implementing the described technologies may further provide adaptive design optimization for different devices. For example, more and more mobile devices have been introduced to enterprises. Business processes may not only be carried out on computers (e.g., personal computers), but may also be carried out on various mobile devices. This can bring great flexibility to businesses. However, the interaction with mobile devices is different from PCs (e.g., touch screen versus keyboard or mouse). It may not be as simple to use PC design elements for mobile devices. The described technologies allow for optimization of design elements to be extended to different devices.
Implementing the described technologies may further provide relatively easier integration with a user feedback system and quick reflection of user behavior, after software is delivered to the customer(s). User behaviors may be modelled through user statistics collected under real business scenarios. User statistics may include users' operation time, background running time, data transfer time, and loading time of UI for each sub-process of different business processes. Troubleshooting and pin pointing problems may be performed quicker and be indicative of potential direction of design improvement. In addition, frequently used processes may be identified. Improvements may be prioritized in next or future round of development cycle. Actual user statistics can help to model user behaviors more accurately. The evaluation of efficiency would be more accurate and reliable. When the software is deployed through cloud service, user statistics could be collected in real-time. The changes in user behavior could be reflected in hours, instead of months. And the evolution of software could be guided in user-centered manner instead of through a bunch of bug fixes.
In alternative implementations, secondary memory 710 may include other similar means for allowing computer programs or other instructions to be loaded into computer system 700. Such means may include, for example, a removable storage unit 724 and an interface 722. Examples of such means may include a program cartridge and cartridge interface (such as that found in video game devices), a removable memory chip (such as an Erasable Programmable Read-Only Memory (EPROM), or Programmable Read-Only Memory (PROM)) and associated socket, and other removable storage units 724 and interfaces 722 which allow software and data to be transferred from the removable storage unit 724 to computer system 700.
As used in this document, the terms “computer-program medium,” “computer-usable medium,” and “computer-readable medium” generally refer to media such as removable storage unit 716, removable storage unit 724, and a hard disk installed in hard disk drive 712. Computer program medium and computer usable medium can also refer to memories, such as main memory 706 and secondary memory 710, which can be memory semiconductors (e.g. Dynamic Random Access Memory (DRAM) elements, etc.). These computer program products are means for providing software to computer system 700.
Computer programs (also called computer control logic) are stored in main memory 706 and/or secondary memory 710. Such computer programs, when executed, enable computer system 700 to implement the present technology described herein. In particular, the computer programs, when executed, enable processor 704 to implement the processes of aspects of the above. Accordingly, such computer programs represent controllers of the computer system 700. Where the technology described herein is implemented, at least in part, using software, the software may be stored in a computer program product and loaded into computer system 700 using removable storage drive 714, interface 722, hard disk drive 712 or communications interface 734.
The technology described herein may be implemented as computer program products comprising software stored on any computer useable medium. Such software, when executed in one or more data processing devices, causes data processing device(s) to operate as described herein. Embodiments of the technology described herein may employ any computer useable or readable medium, known now or in the future. Examples of computer useable mediums include, but are not limited to, primary storage devices (e.g., any type of random access memory), secondary storage devices (e.g., hard drives, floppy disks, Compact Disc Read-Only Memory (CD-ROM) disks, Zip disks, tapes, magnetic storage devices, optical storage devices, Microelectromechanical Systems (MEMS), and nanotechnological storage device, etc.).
A computing system may take the form of any combination of one or more of inter alia a wired device, a wireless device, a mobile phone, a feature phone, a smartphone, a tablet computer (such as for example an iPad™), a mobile computer, a handheld computer, a desktop computer, a laptop computer, a server computer, an in-vehicle (e.g., audio, navigation, etc.) device, an in-appliance device, a Personal Digital Assistant (PDA), a game console, a Digital Video Recorder (DVR) or Personal Video Recorder (PVR), a cable system or other set-top-box, an entertainment system component such as a television set, etc.
In the above description of exemplary implementations, for purposes of explanation, specific numbers, materials configurations, and other details are set forth in order to better explain the present invention, as claimed. However, it will be apparent to one skilled in the art that the claimed invention may be practiced using different details than the exemplary ones described herein. In other instances, well-known features are omitted or simplified to clarify the description of the exemplary implementations.
The inventors intend the described exemplary implementations to be primarily examples. The inventors do not intend these exemplary implementations to limit the scope of the appended claims. Rather, the inventors have contemplated that the claimed invention might also be embodied and implemented in other ways, in conjunction with other present or future technologies.
Moreover, the word “exemplary” is used herein to mean serving as an example, instance, or illustration. Any aspect or design described herein as exemplary is not necessarily to be construed as preferred or advantageous over other aspects or designs. Rather, use of the word “exemplary” is intended to present concepts and techniques in a concrete fashion. The term “technology,” for instance, may refer to one or more devices, apparatuses, systems, methods, articles of manufacture, and/or computer-readable instructions as indicated by the context described herein.
As used in this application, the term “or” is intended to mean an inclusive “or” rather than an exclusive “or.” That is, unless specified otherwise or clear from context, “X employs A or B” is intended to mean any of the natural inclusive permutations. That is, if X employs A; X employs B; or X employs both A and B, then “X employs A or B” is satisfied under any of the foregoing instances. In addition, the articles “a” and “an” as used in this application and the appended claims should generally be construed to mean “one or more,” unless specified otherwise or clear from context to be directed to a singular form.
Note that the order in which the processes are described is not intended to be construed as a limitation, and any number of the described process blocks can be combined in any order to implement the processes or an alternate process. Additionally, individual blocks may be deleted from the processes without departing from the spirit and scope of the subject matter described herein.
One or more embodiments described herein may be implemented fully or partially in software and/or firmware. This software and/or firmware may take the form of instructions contained in or on a non-transitory computer-readable storage medium. Those instructions may then be read and executed by one or more processors to enable performance of the operations described herein. The instructions may be in any suitable form, such as but not limited to source code, compiled code, interpreted code, executable code, static code, dynamic code, and the like. Such a computer-readable medium may include any tangible non-transitory medium for storing information in a form readable by one or more computers, such as but not limited to read only memory (ROM); random access memory (RAM); magnetic disk storage media; optical storage media; a flash memory, etc.
Claims (20)
1. A method for optimizing software design performed by one or more computing devices, comprising:
choosing a design step in a software process;
evaluating the software process with different design elements by repeatedly determining a sum of times used for an interaction step and a computation step of the software process to determine at least one time distribution of a user to finish the software process, wherein the time used for the interaction step is sampled from a time distribution for a user of a particular role and experience level to finish the interaction step, and the time used for the computation step is determined based on size of related data and configuration of hardware used to perform the computation step;
determining time penalties for the different design elements during the evaluation; and
changing a design element of the design step to one of the different design elements with the lowest time penalty.
2. The method of claim 1 , wherein the software process is a sub-process, and the design elements are one or more of user actions and/or system actions.
3. The method of claim 1 , wherein the evaluating comprises using user actions.
4. The method of claim 1 , further comprises generating artificial agents to simulate user behavior and evaluating the software process based on the simulated user behavior.
5. The method of claim 1 , wherein the evaluating comprises accounting for organization type and sub-processes in an organization using the software process.
6. The method of claim 5 , wherein the organization comprises users and an information technology system.
7. The method of claim 1 , wherein the evaluating determines efficiencies of different organizations and users.
8. The method of claim 1 , wherein determining the time penalties is based on a set threshold time value.
9. The method of claim 1 , wherein the software process is applied to more than one computing device type.
10. A device comprising:
one or more processors;
a process module configured to the one or more processors that receives structures of a software process;
a customer module configured to the one or more processors that models behavior of users that use the software process; and
a simulation and evaluation module configured to the one or more processors that receives data from the process module and the customer module, wherein the simulation and evaluation module evaluates the software process with different design elements by
repeatedly determining a sum of times used for an interaction step and a computation step of the software process to determine at least one time distribution of a user to finish the software process, wherein the time used for the interaction step is sampled from a time distribution for a user of a particular role and experience level to finish the interaction step, and the time used for the computation step is determined based on size of related data and configuration of hardware used to perform the computation step, and
determining efficiencies for different design elements of the software process based on the data from the process module and the customer module.
11. The device of claim 10 , wherein the process module comprises an interaction element and a computation element.
12. The device of claim 10 , wherein the process module is configured to receive software process structures from a process design module.
13. The device of claim 10 , wherein the customer module comprises an organization element, an information technology system element and a user element.
14. The device of claim 10 , wherein the customer module is configured to receive information from a manual configuration module, a testing module, and a user feedback module.
15. The device of claim 10 , wherein the customer module sends to the process module one or more of the following information: user role, user experience level, data size, or hardware configuration.
16. The device of claim 10 , wherein the customer module sends to the simulation and evaluation module one or more of the following information: percentage of execution for user role or user experience level.
17. The device of claim 10 further comprising a visualization and analysis module that receives the efficiencies from the simulation and evaluation module.
18. The device of claim 10 further comprising an optimization module configured to receive information from the process module and the customer module, and compute optimal choices for the design elements.
19. One or more computer-readable media storing processor-executable instructions that when executed cause one or more processors to perform operations that provide for optimization of software process comprising:
choosing a design step in a sub-process of the software process;
evaluating the sub-process with different design elements for the chosen design step by repeatedly determining a sum of times used for an interaction step and a computation step of the sub-process to determine at least one time distribution of a user to finish the sub-process, wherein the time used for the interaction step is sampled from a time distribution for a user of a particular role and experience level to finish the interaction step, and the time used for the computation step is determined based on size of related data and configuration of hardware used to perform the computation step; and
changing a design element of the design step to one of the different design elements with a lowest time penalty.
20. The one or more computer-readable media of claim 19 further comprising determining if other design steps are to be improved.
Priority Applications (1)
| Application Number | Priority Date | Filing Date | Title |
|---|---|---|---|
| US14/568,135 US9792091B2 (en) | 2014-12-12 | 2014-12-12 | Quantitative evaluation and optimization of user interface software design |
Applications Claiming Priority (1)
| Application Number | Priority Date | Filing Date | Title |
|---|---|---|---|
| US14/568,135 US9792091B2 (en) | 2014-12-12 | 2014-12-12 | Quantitative evaluation and optimization of user interface software design |
Publications (2)
| Publication Number | Publication Date |
|---|---|
| US20160170713A1 US20160170713A1 (en) | 2016-06-16 |
| US9792091B2 true US9792091B2 (en) | 2017-10-17 |
Family
ID=56111214
Family Applications (1)
| Application Number | Title | Priority Date | Filing Date |
|---|---|---|---|
| US14/568,135 Active 2035-04-16 US9792091B2 (en) | 2014-12-12 | 2014-12-12 | Quantitative evaluation and optimization of user interface software design |
Country Status (1)
| Country | Link |
|---|---|
| US (1) | US9792091B2 (en) |
Families Citing this family (1)
| Publication number | Priority date | Publication date | Assignee | Title |
|---|---|---|---|---|
| US9792091B2 (en) * | 2014-12-12 | 2017-10-17 | Sap Se | Quantitative evaluation and optimization of user interface software design |
Citations (18)
| Publication number | Priority date | Publication date | Assignee | Title |
|---|---|---|---|---|
| US20020188717A1 (en) * | 2001-06-08 | 2002-12-12 | International Business Machines Corporation | Method and apparatus for modeling the performance of Web page retrieval |
| US20050289561A1 (en) * | 2004-06-29 | 2005-12-29 | International Business Machines Corporation | Computer implemented modeling and analysis of an application user interface |
| US20060235690A1 (en) * | 2005-04-15 | 2006-10-19 | Tomasic Anthony S | Intent-based information processing and updates |
| US20060235691A1 (en) * | 2005-04-15 | 2006-10-19 | Tomasic Anthony S | Intent-based information processing and updates in association with a service agent |
| US7509629B2 (en) * | 2004-05-14 | 2009-03-24 | International Business Machines Corporation | Method for system and architecture design using unified modeling language (UML) |
| US20090112621A1 (en) * | 2007-10-30 | 2009-04-30 | Searete Llc, A Limited Liability Corporation Of The State Of Delaware | Computational user-health testing responsive to a user interaction with advertiser-configured content |
| US20100050152A1 (en) * | 2002-11-14 | 2010-02-25 | Sap Ag | Modeling system for graphic user interface |
| US7673287B2 (en) * | 2005-10-11 | 2010-03-02 | Sap Ag | Testing usability of a software program |
| US20100131916A1 (en) * | 2008-11-21 | 2010-05-27 | Uta Prigge | Software for modeling business tasks |
| US20110041117A1 (en) * | 2009-08-13 | 2011-02-17 | Accenture Global Services Gmbh | Compositional modeling of integrated systems using event-based legacy applications |
| US20120260230A1 (en) * | 2011-04-07 | 2012-10-11 | Infosys Technologies Ltd. | Early analysis of software design diagrams |
| US20120324359A1 (en) * | 2010-02-18 | 2012-12-20 | Sa Ignite, Inc. | Systems and Methods for Monitoring and Enhancing Software Applications |
| US8621420B2 (en) * | 2007-12-18 | 2013-12-31 | International Business Machines Corporation | Modeling user perceived use case affinity |
| US8631338B2 (en) * | 2008-08-10 | 2014-01-14 | International Business Machines Corporation | Generating universal graphical user interface element and relation |
| US20140032514A1 (en) * | 2012-07-25 | 2014-01-30 | Wen-Syan Li | Association acceleration for transaction databases |
| US20140101024A1 (en) * | 2012-10-04 | 2014-04-10 | Sap Ag | Predicting financial outcome |
| US20150120600A1 (en) * | 2013-10-31 | 2015-04-30 | Sap Ag | Time and location based delivery optimization |
| US20160170713A1 (en) * | 2014-12-12 | 2016-06-16 | Tianyu Luwang | Quantitative evaluation and optimization of user interface software design |
-
2014
- 2014-12-12 US US14/568,135 patent/US9792091B2/en active Active
Patent Citations (20)
| Publication number | Priority date | Publication date | Assignee | Title |
|---|---|---|---|---|
| US20020188717A1 (en) * | 2001-06-08 | 2002-12-12 | International Business Machines Corporation | Method and apparatus for modeling the performance of Web page retrieval |
| US20100050152A1 (en) * | 2002-11-14 | 2010-02-25 | Sap Ag | Modeling system for graphic user interface |
| US7509629B2 (en) * | 2004-05-14 | 2009-03-24 | International Business Machines Corporation | Method for system and architecture design using unified modeling language (UML) |
| US20050289561A1 (en) * | 2004-06-29 | 2005-12-29 | International Business Machines Corporation | Computer implemented modeling and analysis of an application user interface |
| US7350190B2 (en) * | 2004-06-29 | 2008-03-25 | International Business Machines Corporation | Computer implemented modeling and analysis of an application user interface |
| US20060235690A1 (en) * | 2005-04-15 | 2006-10-19 | Tomasic Anthony S | Intent-based information processing and updates |
| US20060235691A1 (en) * | 2005-04-15 | 2006-10-19 | Tomasic Anthony S | Intent-based information processing and updates in association with a service agent |
| US7673287B2 (en) * | 2005-10-11 | 2010-03-02 | Sap Ag | Testing usability of a software program |
| US20090112621A1 (en) * | 2007-10-30 | 2009-04-30 | Searete Llc, A Limited Liability Corporation Of The State Of Delaware | Computational user-health testing responsive to a user interaction with advertiser-configured content |
| US8621420B2 (en) * | 2007-12-18 | 2013-12-31 | International Business Machines Corporation | Modeling user perceived use case affinity |
| US8631338B2 (en) * | 2008-08-10 | 2014-01-14 | International Business Machines Corporation | Generating universal graphical user interface element and relation |
| US20100131916A1 (en) * | 2008-11-21 | 2010-05-27 | Uta Prigge | Software for modeling business tasks |
| US20110041117A1 (en) * | 2009-08-13 | 2011-02-17 | Accenture Global Services Gmbh | Compositional modeling of integrated systems using event-based legacy applications |
| US20120324359A1 (en) * | 2010-02-18 | 2012-12-20 | Sa Ignite, Inc. | Systems and Methods for Monitoring and Enhancing Software Applications |
| US20120260230A1 (en) * | 2011-04-07 | 2012-10-11 | Infosys Technologies Ltd. | Early analysis of software design diagrams |
| US20140032514A1 (en) * | 2012-07-25 | 2014-01-30 | Wen-Syan Li | Association acceleration for transaction databases |
| US9110969B2 (en) * | 2012-07-25 | 2015-08-18 | Sap Se | Association acceleration for transaction databases |
| US20140101024A1 (en) * | 2012-10-04 | 2014-04-10 | Sap Ag | Predicting financial outcome |
| US20150120600A1 (en) * | 2013-10-31 | 2015-04-30 | Sap Ag | Time and location based delivery optimization |
| US20160170713A1 (en) * | 2014-12-12 | 2016-06-16 | Tianyu Luwang | Quantitative evaluation and optimization of user interface software design |
Also Published As
| Publication number | Publication date |
|---|---|
| US20160170713A1 (en) | 2016-06-16 |
Similar Documents
| Publication | Publication Date | Title |
|---|---|---|
| US9311602B2 (en) | Driving an interactive decision service from a forward-chaining rule engine | |
| US8306788B2 (en) | Computer-implemented systems and methods for executing stochastic discrete event simulations for design of experiments | |
| US11928620B2 (en) | Method for estimating amount of task objects required to reach target completed tasks | |
| US11367010B2 (en) | Quantum computer simulator characterization | |
| US11379943B2 (en) | Optimizing compilation of shaders | |
| Sutton et al. | Bayesian inference for queueing networks and modeling of internet services | |
| US10430320B2 (en) | Prioritization of test cases | |
| US20170364824A1 (en) | Contextual evaluation of process model for generation and extraction of project management artifacts | |
| US10496514B2 (en) | System and method for parallel processing prediction | |
| CN107656864A (en) | A kind of Mobile solution automated testing method based on probabilistic model | |
| Francese et al. | On the use of requirements measures to predict software project and product measures in the context of Android mobile apps: A preliminary study | |
| US20190130326A1 (en) | Optimizing software deployment by simulating workloads and production systems to evaluate capacity needs of customer | |
| US8423980B1 (en) | Methods for handling inlined functions using sample profiles | |
| US9792091B2 (en) | Quantitative evaluation and optimization of user interface software design | |
| US20140172488A1 (en) | Synthesis of a schedule representation from a process model | |
| CN105224449A (en) | The method of testing of the application program on mobile terminal and device | |
| Bosse et al. | Predicting availability and response times of IT services | |
| US8108238B1 (en) | Flexible project governance based on predictive analysis | |
| US20160283878A1 (en) | System and method to use multi-factor capacity constraints for product-based release and team planning | |
| US9256405B1 (en) | Code generation based on regional upsampling-based delay insertion | |
| US20160004982A1 (en) | Method and system for estimating the progress and completion of a project based on a bayesian network | |
| Shams et al. | App Cost Estimation: Evaluating Agile Environments | |
| Ali et al. | Estimation of project size using user stories | |
| Klepper et al. | Impact of Hypothesis-Driven Development on Effectiveness, Quality, and Efficiency in Innovation Projects | |
| CN116149978A (en) | Service interface testing method and device, electronic equipment and storage medium |
Legal Events
| Date | Code | Title | Description |
|---|---|---|---|
| AS | Assignment |
Owner name: SAP SE, GERMANY Free format text: ASSIGNMENT OF ASSIGNORS INTEREST;ASSIGNORS:LUWANG, TIANYU;LI, WEN-SYAN;SIGNING DATES FROM 20141208 TO 20141211;REEL/FRAME:034484/0543 |
|
| STCF | Information on status: patent grant |
Free format text: PATENTED CASE |
|
| MAFP | Maintenance fee payment |
Free format text: PAYMENT OF MAINTENANCE FEE, 4TH YEAR, LARGE ENTITY (ORIGINAL EVENT CODE: M1551); ENTITY STATUS OF PATENT OWNER: LARGE ENTITY Year of fee payment: 4 |