US9664816B2 - Fracture detection and characterization using resistivity images - Google Patents
Fracture detection and characterization using resistivity images Download PDFInfo
- Publication number
- US9664816B2 US9664816B2 US14/390,065 US201314390065A US9664816B2 US 9664816 B2 US9664816 B2 US 9664816B2 US 201314390065 A US201314390065 A US 201314390065A US 9664816 B2 US9664816 B2 US 9664816B2
- Authority
- US
- United States
- Prior art keywords
- image
- fracture
- feature
- formation
- magnetic dipole
- Prior art date
- Legal status (The legal status is an assumption and is not a legal conclusion. Google has not performed a legal analysis and makes no representation as to the accuracy of the status listed.)
- Active, expires
Links
- 238000012512 characterization method Methods 0.000 title claims abstract description 5
- 238000001514 detection method Methods 0.000 title description 2
- 230000015572 biosynthetic process Effects 0.000 claims abstract description 100
- 230000004044 response Effects 0.000 claims abstract description 81
- 238000000034 method Methods 0.000 claims abstract description 28
- 206010017076 Fracture Diseases 0.000 description 97
- 238000005755 formation reaction Methods 0.000 description 78
- 238000005259 measurement Methods 0.000 description 37
- 238000005553 drilling Methods 0.000 description 25
- 238000010586 diagram Methods 0.000 description 17
- 230000000875 corresponding effect Effects 0.000 description 15
- 230000006698 induction Effects 0.000 description 11
- 238000012545 processing Methods 0.000 description 11
- 238000004891 communication Methods 0.000 description 9
- 230000008569 process Effects 0.000 description 8
- 238000003860 storage Methods 0.000 description 7
- 229930195733 hydrocarbon Natural products 0.000 description 6
- 150000002430 hydrocarbons Chemical class 0.000 description 6
- 230000008901 benefit Effects 0.000 description 4
- 239000012530 fluid Substances 0.000 description 4
- 239000011435 rock Substances 0.000 description 4
- 238000011161 development Methods 0.000 description 3
- 238000012935 Averaging Methods 0.000 description 2
- 230000009471 action Effects 0.000 description 2
- 239000003086 colorant Substances 0.000 description 2
- 230000002596 correlated effect Effects 0.000 description 2
- 230000006870 function Effects 0.000 description 2
- 238000004519 manufacturing process Methods 0.000 description 2
- 230000010363 phase shift Effects 0.000 description 2
- 238000012800 visualization Methods 0.000 description 2
- 239000004215 Carbon black (E152) Substances 0.000 description 1
- 206010016970 Foot fracture Diseases 0.000 description 1
- 230000002776 aggregation Effects 0.000 description 1
- 238000004220 aggregation Methods 0.000 description 1
- 230000004075 alteration Effects 0.000 description 1
- 238000013459 approach Methods 0.000 description 1
- 230000005540 biological transmission Effects 0.000 description 1
- 239000000969 carrier Substances 0.000 description 1
- 230000008859 change Effects 0.000 description 1
- 239000012141 concentrate Substances 0.000 description 1
- 239000004020 conductor Substances 0.000 description 1
- 238000010276 construction Methods 0.000 description 1
- 230000001276 controlling effect Effects 0.000 description 1
- 238000005520 cutting process Methods 0.000 description 1
- 238000013461 design Methods 0.000 description 1
- 230000000694 effects Effects 0.000 description 1
- 230000005284 excitation Effects 0.000 description 1
- 238000001914 filtration Methods 0.000 description 1
- 238000002347 injection Methods 0.000 description 1
- 239000007924 injection Substances 0.000 description 1
- 230000014759 maintenance of location Effects 0.000 description 1
- 239000000463 material Substances 0.000 description 1
- 230000007246 mechanism Effects 0.000 description 1
- 238000012986 modification Methods 0.000 description 1
- 230000004048 modification Effects 0.000 description 1
- 239000012811 non-conductive material Substances 0.000 description 1
- -1 oil and gas Chemical class 0.000 description 1
- 230000003287 optical effect Effects 0.000 description 1
- 239000013307 optical fiber Substances 0.000 description 1
- 230000010287 polarization Effects 0.000 description 1
- 238000005070 sampling Methods 0.000 description 1
- 230000035945 sensitivity Effects 0.000 description 1
- 238000004088 simulation Methods 0.000 description 1
- 239000000243 solution Substances 0.000 description 1
- 238000012360 testing method Methods 0.000 description 1
- 238000012546 transfer Methods 0.000 description 1
- 230000032258 transport Effects 0.000 description 1
- XLYOFNOQVPJJNP-UHFFFAOYSA-N water Substances O XLYOFNOQVPJJNP-UHFFFAOYSA-N 0.000 description 1
Images


Classifications
-
- G01V20/00—
-
- G—PHYSICS
- G01—MEASURING; TESTING
- G01V—GEOPHYSICS; GRAVITATIONAL MEASUREMENTS; DETECTING MASSES OR OBJECTS; TAGS
- G01V99/00—Subject matter not provided for in other groups of this subclass
- G01V99/005—Geomodels or geomodelling, not related to particular measurements
-
- E—FIXED CONSTRUCTIONS
- E21—EARTH DRILLING; MINING
- E21B—EARTH DRILLING, e.g. DEEP DRILLING; OBTAINING OIL, GAS, WATER, SOLUBLE OR MELTABLE MATERIALS OR A SLURRY OF MINERALS FROM WELLS
- E21B47/00—Survey of boreholes or wells
- E21B47/02—Determining slope or direction
- E21B47/022—Determining slope or direction of the borehole, e.g. using geomagnetism
- E21B47/0228—Determining slope or direction of the borehole, e.g. using geomagnetism using electromagnetic energy or detectors therefor
-
- E—FIXED CONSTRUCTIONS
- E21—EARTH DRILLING; MINING
- E21B—EARTH DRILLING, e.g. DEEP DRILLING; OBTAINING OIL, GAS, WATER, SOLUBLE OR MELTABLE MATERIALS OR A SLURRY OF MINERALS FROM WELLS
- E21B47/00—Survey of boreholes or wells
-
- E—FIXED CONSTRUCTIONS
- E21—EARTH DRILLING; MINING
- E21B—EARTH DRILLING, e.g. DEEP DRILLING; OBTAINING OIL, GAS, WATER, SOLUBLE OR MELTABLE MATERIALS OR A SLURRY OF MINERALS FROM WELLS
- E21B47/00—Survey of boreholes or wells
- E21B47/01—Devices for supporting measuring instruments on drill bits, pipes, rods or wirelines; Protecting measuring instruments in boreholes against heat, shock, pressure or the like
-
- E21B47/122—
-
- E—FIXED CONSTRUCTIONS
- E21—EARTH DRILLING; MINING
- E21B—EARTH DRILLING, e.g. DEEP DRILLING; OBTAINING OIL, GAS, WATER, SOLUBLE OR MELTABLE MATERIALS OR A SLURRY OF MINERALS FROM WELLS
- E21B47/00—Survey of boreholes or wells
- E21B47/12—Means for transmitting measuring-signals or control signals from the well to the surface, or from the surface to the well, e.g. for logging while drilling
- E21B47/13—Means for transmitting measuring-signals or control signals from the well to the surface, or from the surface to the well, e.g. for logging while drilling by electromagnetic energy, e.g. radio frequency
-
- G—PHYSICS
- G01—MEASURING; TESTING
- G01V—GEOPHYSICS; GRAVITATIONAL MEASUREMENTS; DETECTING MASSES OR OBJECTS; TAGS
- G01V3/00—Electric or magnetic prospecting or detecting; Measuring magnetic field characteristics of the earth, e.g. declination, deviation
- G01V3/18—Electric or magnetic prospecting or detecting; Measuring magnetic field characteristics of the earth, e.g. declination, deviation specially adapted for well-logging
- G01V3/26—Electric or magnetic prospecting or detecting; Measuring magnetic field characteristics of the earth, e.g. declination, deviation specially adapted for well-logging operating with magnetic or electric fields produced or modified either by the surrounding earth formation or by the detecting device
- G01V3/28—Electric or magnetic prospecting or detecting; Measuring magnetic field characteristics of the earth, e.g. declination, deviation specially adapted for well-logging operating with magnetic or electric fields produced or modified either by the surrounding earth formation or by the detecting device using induction coils
-
- G—PHYSICS
- G01—MEASURING; TESTING
- G01V—GEOPHYSICS; GRAVITATIONAL MEASUREMENTS; DETECTING MASSES OR OBJECTS; TAGS
- G01V3/00—Electric or magnetic prospecting or detecting; Measuring magnetic field characteristics of the earth, e.g. declination, deviation
- G01V3/18—Electric or magnetic prospecting or detecting; Measuring magnetic field characteristics of the earth, e.g. declination, deviation specially adapted for well-logging
- G01V3/30—Electric or magnetic prospecting or detecting; Measuring magnetic field characteristics of the earth, e.g. declination, deviation specially adapted for well-logging operating with electromagnetic waves
-
- G—PHYSICS
- G01—MEASURING; TESTING
- G01V—GEOPHYSICS; GRAVITATIONAL MEASUREMENTS; DETECTING MASSES OR OBJECTS; TAGS
- G01V3/00—Electric or magnetic prospecting or detecting; Measuring magnetic field characteristics of the earth, e.g. declination, deviation
- G01V3/38—Processing data, e.g. for analysis, for interpretation, for correction
-
- E—FIXED CONSTRUCTIONS
- E21—EARTH DRILLING; MINING
- E21B—EARTH DRILLING, e.g. DEEP DRILLING; OBTAINING OIL, GAS, WATER, SOLUBLE OR MELTABLE MATERIALS OR A SLURRY OF MINERALS FROM WELLS
- E21B43/00—Methods or apparatus for obtaining oil, gas, water, soluble or meltable materials or a slurry of minerals from wells
- E21B43/25—Methods for stimulating production
- E21B43/26—Methods for stimulating production by forming crevices or fractures
Definitions
- the present disclosure relates generally to well drilling operations and, more particularly, to fracture detection and characterization using resistivity images.
- Hydrocarbons such as oil and gas
- subterranean formations that may be located onshore or offshore.
- the development of subterranean operations and the processes involved in removing hydrocarbons from a subterranean formation are complex.
- subterranean operations involve a number of different steps such as, for example, drilling a wellbore at a desired well site, treating the wellbore to optimize production of hydrocarbons, and performing the necessary steps to produce and process the hydrocarbons from the subterranean formation.
- Measurements of the subterranean formation may be made throughout the operations to characterize the formation and aide in making operational decisions.
- One example measurement corresponds to the electrical resistivity (or its inverse conductivity) of the formation, which can be used to determine whether the formation or a layer of the formation is likely to contain hydrocarbons. Natural fractures or cracks within the formation may skew the measurements, however, reducing the accuracy of the calculated resistivity and the decisions made based on the calculated resistivity.
- FIG. 1 is a diagram showing an illustrative logging while drilling environment, according to aspects of the present disclosure.
- FIG. 2 is a diagram showing an illustrative wireline logging environment, according to aspects of the present disclosure.
- FIG. 3 is a diagram of an example information handling system, according to aspects of the present disclosure.
- FIG. 4 is a diagram of an example resistivity logging tool, according to aspects of the present disclosure.
- FIG. 5 is a diagram of an example control system for a resistivity logging tool, according to aspects of the present disclosure.
- FIG. 6 is a diagram of example azimuthal bins for measurements taken using a resistivity logging tool, according to aspects of the present disclosure.
- FIG. 7 is a diagram of a model of an example resistivity logging tool in a formation with at least one fracture, according to aspects of the present disclosure.
- FIG. 8 are graphs illustrating example propagation resistivity images, according to aspects of the present disclosure.
- FIG. 9 are graphs illustrating example propagation resistivity images, according to aspects of the present disclosure.
- FIG. 10 is a graph illustrating phase resistivity values, according to aspects of the present disclosure.
- FIG. 11 is a graph illustrating phase resistivity values, according to aspects of the present disclosure.
- FIG. 12 is a graph illustrating the azimuthal response of two bins of a resistivity logging apparatus to a resistive fracture in a conductive formation, according to aspects of the present disclosure.
- FIG. 13 is a graph illustrating an example azimuthal resistivity response, according to aspects of the present disclosure.
- FIG. 14 illustrates graphs showing example reoriented propagation resistivity images of fractures, according to aspects of the present disclosure.
- FIG. 15 is flow diagram illustrating an example process, according to aspects of the present disclosure.
- an information handling system may include any instrumentality or aggregate of instrumentalities operable to compute, classify, process, transmit, receive, retrieve, originate, switch, store, display, manifest, detect, record, reproduce, handle, or utilize any form of information, intelligence, or data for business, scientific, control, or other purposes.
- an information handling system may be a personal computer, a network storage device, or any other suitable device and may vary in size, shape, performance, functionality, and price.
- the information handling system may include random access memory (RAM), one or more processing resources such as a central processing unit (CPU) or hardware or software control logic, ROM, and/or other types of nonvolatile memory.
- Additional components of the information handling system may include one or more disk drives, one or more network ports for communication with external devices as well as various input and output (I/O) devices, such as a keyboard, a mouse, and a video display.
- the information handling system may also include one or more buses operable to transmit communications between the various hardware components. It may also include one or more interface units capable of transmitting one or more signals to a controller, actuator, or like device.
- Computer-readable media may include any instrumentality or aggregation of instrumentalities that may retain data and/or instructions for a period of time.
- Computer-readable media may include, for example, without limitation, storage media such as a direct access storage device (e.g., a hard disk drive or floppy disk drive), a sequential access storage device (e.g., a tape disk drive), compact disk, CD-ROM, DVD, RAM, ROM, electrically erasable programmable read-only memory (EEPROM), and/or flash memory; as well as communications media such wires, optical fibers, microwaves, radio waves, and other electromagnetic and/or optical carriers; and/or any combination of the foregoing.
- storage media such as a direct access storage device (e.g., a hard disk drive or floppy disk drive), a sequential access storage device (e.g., a tape disk drive), compact disk, CD-ROM, DVD, RAM, ROM, electrically erasable programmable read-only memory (EEPROM), and/or flash memory
- Embodiments of the present disclosure may be applicable to horizontal, vertical, deviated, or otherwise nonlinear wellbores in any type of subterranean formation. Embodiments may be applicable to injection wells as well as production wells, including hydrocarbon wells. Embodiments may be implemented using a tool that is made suitable for testing, retrieval and sampling along sections of the formation. Embodiments may be implemented with tools that, for example, may be conveyed through a flow passage in tubular string or using a wireline, slickline, coiled tubing, downhole robot or the like.
- MWD Measurement-while-drilling
- LWD Logging-while-drilling
- Devices and methods in accordance with certain embodiments may be used in one or more of wireline (including wireline, slickline, and coiled tubing), downhole robot, MWD, and LWD operations.
- Couple or “couples” as used herein are intended to mean either an indirect or a direct connection.
- a first device couples to a second device, that connection may be through a direct connection or through an indirect mechanical or electrical connection via other devices and connections.
- the term “communicatively coupled” as used herein is intended to mean either a direct or an indirect communication connection.
- Such connection may be a wired or wireless connection such as, for example, Ethernet or LAN.
- wired and wireless connections are well known to those of ordinary skill in the art and will therefore not be discussed in detail herein.
- a first device communicatively couples to a second device, that connection may be through a direct connection, or through an indirect communication connection via other devices and connections.
- FIG. 1 is a diagram of a subterranean drilling system 100 , according to aspects of the present disclosure.
- the drilling system 100 comprises a drilling platform 2 positioned at the surface 102 .
- the surface 102 comprises the top of a formation 104 containing one or more rock strata or layers 18 a - c , and the drilling platform 2 may be in contact with the surface 102 .
- the surface 102 may be separated from the drilling platform 2 by a volume of water.
- the drilling system 100 comprises a derrick 4 supported by the drilling platform 2 and having a traveling block 6 for raising and lowering a drill string 8 .
- a kelly 10 may support the drill string 8 as it is lowered through a rotary table 12 .
- a drill bit 14 may be coupled to the drill string 8 and driven by a downhole motor and/or rotation of the drill string 8 by the rotary table 12 . As bit 14 rotates, it creates a borehole 16 that passes through one or more rock strata or layers 18 .
- a pump 20 may circulate drilling fluid through a feed pipe 22 to kelly 10 , downhole through the interior of drill string 8 , through orifices in drill bit 14 , back to the surface via the annulus around drill string 8 , and into a retention pit 24 . The drilling fluid transports cuttings from the borehole 16 into the pit 24 and aids in maintaining integrity or the borehole 16 .
- the drilling system 100 may comprise a bottom hole assembly (BHA) coupled to the drill string 8 near the drill bit 14 .
- the BHA may comprise various downhole measurement tools and sensors and LWD and MWD elements, including a resistivity logging tool 26 .
- the resistivity logging tool 26 may comprise a plurality of transmitters and receivers (e.g., antennas capable of receiving and/or transmitting one or more electromagnetic signals) such as magnetic dipoles that are axially spaced along the length of the tool and positioned at different angles with respect to the tool 26 .
- the resistivity logging tool 26 may collect measurements relating to the resistivity of the formation 104 , i.e., how strongly the formation 104 opposes a flow of electric current.
- the orientation and position of the tool 26 may be tracked using, for example, an azimuthal orientation indicator, which may include magnetometers, inclinometers, and/or accelerometers, though other sensor types such as gyroscopes may be used in some embodiments.
- an azimuthal orientation indicator which may include magnetometers, inclinometers, and/or accelerometers, though other sensor types such as gyroscopes may be used in some embodiments.
- the resistivity measurements may be associated with a particular azimuthal orientation through azimuthal binning, as will be described below.
- the tools and sensors of the BHA including the resistivity logging tool 26 may be communicably coupled to a telemetry element 28 .
- the telemetry element 28 may transfer measurements from the resistivity logging tool 26 to a surface receiver 30 and/or to receive commands from the surface receiver 30 .
- the telemetry element 28 may comprise a mud pulse telemetry system, and acoustic telemetry system, a wired communications system, a wireless communications system, or any other type of communications system that would be appreciated by one of ordinary skill in the art in view of this disclosure.
- some or all of the measurements taken at the resistivity logging tool 26 may also be stored within the tool 26 or the telemetry element 28 for later retrieval at the surface 102 .
- the drilling system 100 may comprise an information handling system 32 positioned at the surface 102 .
- the information handling system 32 may be communicably coupled to the surface receiver 30 and may receive measurements from the resistivity logging tool 26 and/or transmit commands to the resistivity logging tool 26 though the surface receiver 30 .
- the information handling system 32 may also receive measurements from the resistivity logging tool 26 when the tool 26 is retrieved at the surface 102 .
- the information handling system 32 may process the measurements to determine certain characteristics of the formation 104 , including the location and characteristics of fractures within the formation 104 .
- the drill string 8 may be removed from the borehole 16 as shown in FIG. 2 .
- measurement/logging operations can be conducted using a wireline tool 34 , i.e., an instrument that is suspended into the borehole 16 by a cable 15 having conductors for transporting power to the tool and telemetry from the tool body to the surface 102 .
- the wireline tool 34 may include a resistivity logging tool 36 having transmitters and receivers similar to those described above in relation to the resistivity logging tool 26 .
- the resistivity logging tool 36 may be communicatively coupled to the cable 15 .
- a logging facility 44 (shown in FIG.
- the resistivity logging tool 36 may collect measurements from the resistivity logging tool 36 , and may include computing facilities (including, e.g., an information handling system) for controlling, processing, storing, and/or visualizing the measurements gathered by the resistivity logging tool 36 .
- the computing facilities may be communicatively coupled to the logging/measurement tool 36 by way of the cable 15 .
- the information handling system 32 may serve as the computing facilities of the logging facility 44 .
- FIGS. 1 and 2 show a formation 104 one or more rock strata or layers 18 a - c .
- Each of the strata 18 a - c may have different physical and electrical characteristics.
- some of the strata may be generally conductive while others may be generally resistive.
- some may be generally porous while some may be non-porous.
- natural fractures or cracks may be located within strata 18 a - c .
- the borehole 16 intersects a fracture 106 in layer 18 b .
- Fracture 106 may have different characteristics than the rock layer in which it is located, and the different characteristics may skew the measurements of the strata.
- layer 18 b may comprise a resistive layer
- yet fracture 106 may contain conductive fluids
- layer 18 b may comprise a conductive layer
- yet fracture 106 may contain resistive fluids. Identifying, characterizing, and accounting for these fractures may, therefore, improve the resulting measurements of the formation 104 generally and the strata 18 a - c in particular.
- FIG. 3 is a block diagram showing an example information handling system 300 , according to aspects of the present disclosure.
- Information handling system 300 may be used with the drilling system described above.
- the information handling system 300 may comprise a processor or CPU 301 that is communicatively coupled to a memory controller hub or north bridge 302 .
- Memory controller hub 302 may include a memory controller for directing information to or from various system memory components within the information handling system, such as RAM 303 , storage element 306 , and hard drive 307 .
- the memory controller hub 302 may be coupled to RAM 303 and a graphics processing unit 304 .
- Memory controller hub 302 may also be coupled to an I/O controller hub or south bridge 305 .
- I/O hub 305 is coupled to storage elements of the computer system, including a storage element 306 , which may comprise a flash ROM that includes a basic input/output system (BIOS) of the computer system. I/O hub 305 is also coupled to the hard drive 307 of the computer system. I/O hub 305 may also be coupled to a Super I/O chip 308 , which is itself coupled to several of the I/O ports of the computer system, including keyboard 309 and mouse 310 . The information handling system 300 further may be communicably coupled to one or more elements of a drilling system though the chip 308 as well as a visualization mechanism, such as a computer monitor or display.
- a storage element 306 which may comprise a flash ROM that includes a basic input/output system (BIOS) of the computer system.
- BIOS basic input/output system
- I/O hub 305 is also coupled to the hard drive 307 of the computer system.
- I/O hub 305 may also be coupled to a Super I/O chip 308
- the information handling system(s) used in the subterranean drilling systems described above may include software components that process and characterize data.
- software or software components may comprise a set of instructions stored within a computer readable medium that, when executed by a processor coupled to the computer readable medium, cause the processor to perform certain actions. According to aspects of the present disclosure, the actions may be performed with respect to measurements from a resistivity logging tool to identify and characterize fractures within a formation.
- FIGS. 4A and 4B illustrate example resistivity logging tools, according to aspects of the present disclosure.
- FIG. 4A shows a resistivity logging tool 400 that may be used as an LWD/MWD tool or within a wireline arrangement, described above, and may comprise at least one magnetic dipole transmitter and at least one magnetic dipole receiver.
- the tool 400 comprises transmitters T 1 -T 3 and T 1 ′-T 3 ′ and receivers R 1 -R 3 axially spaced along the length of the tool 400 .
- the transmitters T 1 -T 3 and T 1 ′-T 3 ′ may be coaxial, as shown, and/or tilted with respect to a tool body 410 .
- the receivers R 1 -R 3 may be tilted and axially spaced apart from the transmitters T 1 -T 3 and T 1 ′-T 3 ′ and from each other with respect to the tool body 410 . Because the receivers R 1 -R 3 may be tilted, measurements taken with them may be azimuthally sensitive.
- the transmitters T 1 -T 3 and T 1 ′-T 3 and receivers R 1 -R 3 may comprise dipole antennas that may be mounted in recesses in the tool body 410 and protected by a non-conductive material or a material with non-conducting apertures.
- the transmitters T 1 -T 3 and T 1 ′-T 3 ′ comprise symmetric coaxial transmitter antennas T 1 -T 1 ′, T 2 -T 2 ′, and T 3 -T 3 ′ spaced at 16-inch increments from a center 420 of the two receivers R 1 and R 2
- the transmitters T 3 -T 3 ′ each may be located 16 inches from the center 420
- the transmitters T 2 -T 2 ′ each may be located 32 inches from the center 420
- the transmitters T 1 -T 1 ′ each may be located at 48 inches from the center 420 .
- Receivers R 1 and R 2 may be spaced four inches from each other and tilted at a 45 degree angle with respect to a longitudinal axis of the tool body 410 .
- receiver R 3 may be located 64 inches from the center 420 .
- tools 450 - 460 illustrate tools with different orientations of receivers R 1 and R 2 and transmitters T 1 and T 1 ′.
- the transmitters and receivers may be parallel, perpendicular, and/or co-located with each other.
- either or both of the receivers R 1 and R 2 and transmitters T 1 and T 1 ′ may be tilted with respect to the axis of the tool.
- the distance between a transmitter and a receiver is positively correlated with the range of measurement and negatively correlated with the measurement resolution. Accordingly, having transmitters and receivers located at various distances balances the range and resolution of the tool, with the particular distances chosen based on characteristics of the formation in which the tool will be introduced.
- FIG. 5 is a diagram of an example control system 500 for a resistivity logging tool, according to aspects of the present disclosure.
- the system 500 comprises a system control center 502 that may function as the primary controller for the tool.
- the system control center 302 may comprise an information handling system, and may be communicably coupled to transmitters 1 -N through transmitter electronics 504 and communicably coupled to receivers 1 -M through receiver electronics 506 .
- the transmitters 1 -N and receivers 1 -M may comprise coaxial or tilted magnetic dipoles, similar to those described above with reference to FIG. 4 .
- the transmitter electronics 504 and receiver electronics 506 may comprise circuit boards to which some or all of the transmitters 1 -N and receivers 1 -M are coupled.
- the system control center 502 may trigger the transmitter electronics 504 to generate a time-varying electromagnetic (EM) signal through one or more of the transmitters 1 -N.
- the transmitter electronics 504 may trigger each of the transmitters 1 -N independently, selecting a transmitter based on the transmitter's orientation (e.g., distance) with respect to the receivers.
- the time-varying EM signal may be a sinusoidal signal, its phase, amplitude, and frequency set at a desired value.
- the system control center 502 may cause one transmitter to transmit multiple time-varying EM signals, each with a different phase, amplitude, and/or frequency.
- the system control center 502 may cause each of the transmitters 1 -N to transmit a different time-varying EM signal, with different phases, amplitudes, and/or frequencies.
- Other transmission schemes are possible, as would be appreciated by one of ordinary skill in the art in view of this disclosure.
- the time-varying EM signals generated by one or more of the transmitters 1 -N may excite the formation surrounding the tool, and one or more of the receivers 1 -M may measure the response of the formation to the time-varying EM signals.
- one or more of the receivers 1 -M may be tuned to measure a response within a frequency band containing the transmitted time-varying EM signal.
- the system control center 502 may receive the measured responses from the receivers 1 -M through the receiver electronics 506 and may transmit the measured responses to the data acquisition unit 508 . For a specific transmitter excitation, measured responses from multiple receivers can be received at the same time.
- multiple transmitters 1 -N can be excited at the same time and they can be time, frequency or jointly multiplexed for latter demultiplexing operation at the receivers.
- the measured responses may be digitized, stored in a data buffer 510 , processed at data processing unit 512 , and sent to the surface 514 through a communication unit 316 , which may comprise a downhole telemetry system.
- the responses from the receivers 1 -M may be measured with respect to the signals from the transmitters 1 -N that generated the responses. In certain embodiments, this may include comparing the measured responses to the transmitters signals. The comparison may be made, for example, downhole in the data processing unit 512 , or at an information handling system at the surface. When the comparison is made downhole, the system control unit 502 may communicate the phase, amplitude, and frequency of the transmitted time-varying EM signals to the data processing unit 512 , which may compare the time-varying EM signals to the measured responses from the receivers 1 -M.
- the data processing unit 512 may determine the phase and amplitude of the measured responses, and compare the determined phase and amplitude of the measured responses to the phase and amplitude of the corresponding transmitted time-varying EM signal.
- the amplitude of the measured response may comprise an amplitude ratio or amplitude difference with respect to the transmitted time-varying EM signal
- the phase of the measured response may comprise a phase shift or difference with respect to the transmitted time-varying EM signal.
- the phase and amplitude of the measured responses may be used to identify and characterize fractures within the formation surrounding the tool.
- Resistivity logging tools similar to those described above may be azimuthally sensitive based on the azimuthal orientation of the tilted receiver and/or transmitter.
- the azimuthal direction in which the tool is directed may be referred to as the tool face angle.
- the tool face angle may be identified, for example, using orientation sensors described above.
- the measured responses may be divided into a plurality of azimuthal “bins” according to the tool face angle associated within the measured responses.
- FIG. 6 is a diagram of example bins, according to aspects of the present disclosure. Each “bin” may correspond to a range of tool face angles for the resistivity logging tool, with each bin range equal to 360/M and M equal to the number of bins. In the embodiment shown, there are 32 total bins, each corresponding to 11.25 degrees of the formation surrounding the tool. Each bin may comprise amplitudes and phases for measured responses captured when the tool face was oriented within the corresponding angular range.
- the arrow 602 may identify the current tool face angle for a tool and the bin (bin 3 ) in which measured responses taken at that tool face angle will be stored.
- the bins may be numbered to identify the bins with respect to one another.
- bin 1 corresponds to a zero degree tool face angle, perpendicular to the axis of the tool, with bin 17 corresponding to a 180 degree tool face angle, opposite bin 1 .
- the bin numbering may be changed to reduce the computational burden of identifying and characterizing a formation fracture.
- measurements for each of the bins may be calculated based on the measured response of the formation in one azimuthal orientation.
- the tilted magnetic dipoles have the greatest azimuthal sensitivity in one azimuthal direction, the tilted magnetic dipole may also collect responses regarding the formation in other azimuthal directions.
- the formation response measured by a magnetic dipole in a first azimuthal direction may be processed, and the response contributions from the formation in other azimuthal angles may be extracted, adjusted, and segregated into azimuthal bins, similar to those described above.
- a resistivity logging tool may comprise at least one transmitter T 1 and at least two receivers R 1 and R 2 , with time-varying EM signals transmitted by the transmitter T 1 causing formation responses to be measured at receivers R 1 and R 2 along the tool.
- the time-varying EM signals transmitted by transmitter T 1 and the measured responses at the receivers R 1 and R 2 may be characterized by amplitude and phase values.
- a R1T1 (k) comprises the amplitude of the measured response from receiver R 1 to a signal generated by the source T 1 at the k th bin position;
- a R2T1 (k) comprises the amplitude of the measured response from receiver R 2 to a signal generated by the source T 1 at the k th bin position;
- ⁇ R1T1 (k) comprises the phase of the measured response from receiver R 1 to a signal generated by the source T 1 at the k th bin position;
- ⁇ R2T1 (k) comprises the phase of the measured response from receiver R 1 to a signal generated by the source T 1 at the k th bin position.
- a resistivity value for the bin may be calculated using a look-up table or an inversion algorithm and the values calculated using equations (1) and (2).
- processing the measured responses may further comprise calculating at least one of a compensated signal for the bins using the phase shift and attenuation information, and using the calculated compensated signal to calculate a resistivity value for each bin.
- a compensated signal may be generated by averaging together the responses for at least one symmetric pair of transmitters.
- a resistivity value for the bin may be calculated using a look-up table or an inversion algorithm and the values calculated using equations (3) and (4).
- an averaged compensated value may be calculated by averaging together the compensated values from at least two symmetric pairs of transmitters. For example, assuming a resistivity logging tool comprises symmetric pairs T 1 -T 1 ′ and T 2 -T 2 ′, equations (1)-(4) may be used to calculate attenuation and phase values and compensated values for each transmitter and symmetric pair, respectively, and compensated values for the symmetric pairs T 1 -T 1 ′ and T 2 -T 2 ′ may be averaged together. A look-up table or inversion algorithm may also be used to calculate a resistivity value for the bin based on the averaged compensated value.
- the resistivity values for each one of the bins may be calculated using a look-up table or inversion algorithm and a geo-signal.
- a geo-signal may be calculated by taking the difference between the phase or log amplitude for one bin and the average phase or log amplitude for all of the bins at a given axial location.
- a geo-signal may be calculated for a receiver R 1 and transmitter T 1 using the following equations:
- FIG. 7 is a diagram of an example resistivity logging tool in a formation with at least one fracture, according to aspects of the present disclosure.
- the tool 700 is positioned within the formation 710 along an axis 720 corresponding to the longitudinal axis of the tool 700 .
- the tool 700 may comprise a LWD/MWD tool or a wireline tool.
- the formation 710 comprises a fracture 730 through which the tool 700 is passing.
- the tool 700 may be oriented at a “dip angle” 740 with respect to the fracture 730 , corresponding to the angle between the axis 720 and the fracture 730 .
- the tool 700 may take at least one azimuthally sensitive formation response measurement of the formation 710 , which may be used to calculate resistivity values for the formation 710 , as described above.
- azimuthally sensitive formation response measurements may be taken at more than one axial location along the axis 720 , corresponding to depths of the formation.
- the azimuthally sensitive measurements may be taken constantly, or near-constantly, to provide detailed 360 degree measurements of the formation 710 at each depth encountered by the tool.
- azimuthally and axially limited measurements may be taken from which 360 degree measurements at multiple depths may be calculated.
- the resistivity values calculated using the measurements may change as the tool 700 nears the fracture 730 , and the fracture 730 may be identified and characterized based of the changing resistivity values.
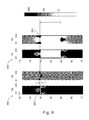
- FIG. 8 is a diagram illustrating example propagation resistivity images 800 and 850 .
- the images 800 and 850 comprise graphs that plot the resistivity values of the formation in terms of depth of the formation in feet (y-axes) and azimuthal orientation by bin number (x-axes).
- each of the images 800 and 850 comprises an Rp section and a Ra section, corresponding to the resistivity values calculated using the phase measurements and amplitude measurements from the resistivity logging tools, respectively.
- the images 800 and 850 illustrate resistive features in an otherwise homogenously conductive formation.
- Image 800 for example, identifies a resistive 1.2 inch fracture 802 at a depth of 50 feet in the conductive formation.
- Image 850 in contrast, identifies a 10 foot resistive layer 804 of the otherwise homogenous formation.
- FIG. 9 illustrates similar images 900 and 950 to those in FIG. 8 , except that the 1.2 inch fracture 902 in image 900 comprises a conductive 1.2 inch fracture in an otherwise homogenously resistive formation, and 10 foot layer 904 comprises a conductive layer in the resistive formation.
- the resistive and conductive portions of the images are identifiable through their corresponding resistivity values.
- the darker colors are associated with higher resistivity values and the lighter colors are associated within lower resistivity values.
- fractures may be identified. For example, a first set of resistivity values that are higher that the resistivity values in adjacent depths and azimuthal orientations may indicate a resistive fracture in a conductive formation, illustrated by the dark section within the otherwise light background in FIG. 8 . Conversely, a second set of resistivity values that are lower that the resistivity values in adjacent depths and azimuthal orientations may indicate a conductive fracture in a resistive formation, illustrated by the light section within the otherwise dark background in FIG. 9 .
- filters may be applied to the induction or propagation resistivity images to cancel the polarization effect on the boundaries of the fracture and to enhance the resistivity contrast between the fracture and the surrounding formation.
- One example filter is a binary filter than utilizes a threshold level and sets at a first value any resistivity value below the threshold and sets at a second value any resistivity value above the threshold.
- FIGS. 10 and 11 are charts illustrating phase resistivity values as a solid line and filtered phase resistivity values as a dashed line for a 0.9 foot fracture at 21 feet of depth. As can be seen, the filtered resistivity values provide a step contrast at the top of the fracture and the bottom of the fracture with respect to the depth in the formation, with the fracture in FIG.
- the step contrast of the filtered resistivity values may simplify the image processing techniques needed to located and characterize a fracture.
- the azimuthal angle between the fracture and the tool also may be determined from the filtered resistivity values and/or induction or propagation resistivity images, although filtering is not required.
- the azimuthal angle may be determined by identifying the bin in which the fracture is first detected.
- FIG. 12 is a diagram illustrating the azimuthal response of two bins of a resistivity logging apparatus to a resistive fracture in a conductive formation, according to aspects of the present disclosure.
- the two bins comprise a Rup bin, corresponding to the bin pointed away from the fracture, and an Rdn bin opposite the Rup bin and pointed toward the fracture.
- FIG. 12 further plots the average resistivity value for the tool Ravg.
- the Rdn bin when the tool nears an upper boundary of a resistive fracture, the Rdn bin will show an increased resistivity value before the Rup bin, due to its azimuthal position with respect to the fracture. As the tool approaches the lower boundary of the fracture, the resistivity value of the Rdn bin will drop due to the surrounding conductive formation, while the resistivity value for the Rup bin will increase. Accordingly, the measurement directly up, or away from the fracture will represent the minimum resistivity response from the fracture and the measurement directly down, or towards the fracture will represent the maximum resistivity value.
- the azimuthal angle may be determined by identifying resistivity maximums and minimum with respect to axial locations in the borehole.
- FIG. 13 is a diagram illustrating an example azimuthal resistivity response at one depth within a borehole, according to aspects of the present disclosure.
- the azimuthal resistivity response is a waveform with a minimum corresponding to a zero angle and a maximum corresponding to a 180 degree angle, opposite the zero angle.
- the facture may be azimuthally located at either the maximum or minimum resistivity value in the graph.
- a curve fitting method may be used to generate the substantially sine-wave shape and to smooth the responses to better identify the maximum and minimum resistivity values with respect to azimuthal angle. Similar responses may be generated throughout a fracture bed, and the combined results may be used to accurately identify the azimuthal angle of the fracture.
- the bins may be renumbered so that the upper boundary of the fracture is located at bin 1 and the lower boundary is opposite bin 1 .
- Rup or Rdn may be set to correspond to bin 1 and the other one of Rup or Rdn may be set to correspond to the bin opposite bin 1 .
- the induction or propagation resistivity images may be plotted with respect to the azimuthal orientation of the resistivity values by bin number. By renumbering the bins, the induction or propagation resistivity images for different fractures may have similarly positioned induction or propagation resistivity images. Example shifted propagation resistivity images are shown in FIG. 14 , where the upper boundaries of the fracture are positioned in bin 1 , and the lower boundaries are positioned in the middle of the plot.
- Shifting the bin numbering may simplify the computational requirements to identify and characterize the fractures. For example, if image or data processing algorithms are used, standardizing the location of the upper and lower boundaries of the fracture may simplify the algorithm. Likewise, pattern matching techniques may be used to identify fractures and determine their characteristics, including their size, shape, average resistivity values, edge locations, and orientation. If the upper and lower boundaries are similarly positioned within the induction or propagation resistivity images, the algorithms may be designed to look in designated places for the upper and lower boundaries, instead of searching within the induction or propagation resistivity images for the boundaries. Calculating the size of the fracture from the induction or propagation resistivity images may be similarly simplified.
- one pattern matching technique may comprise constructing a synthetic fracture image using model fracture characteristics.
- the synthetic fracture image may be compared to the identified fracture in the induction or propagation resistivity image, and the model fracture characteristics may be adjusted until the synthetic fracture image matches the fracture within a pre-determined threshold.
- the pattern matching technique may comprise determining a set of potential fracture characteristics combinations, and for each combination of potential fracture characteristics, generating a model fracture image, correlating at least one characteristic of the modeled resistivity image with identified fracture, and determining a correlation value.
- the fracture characteristic with the higher correlation value may be selected.
- the fracture model may be a 1D, 2D or 3D simulation of electromagnetic wave propagation in downhole environment. It may be based on finite-difference, finite-element, method of moment and integral equation methods. The fracture parameters that produce the best matching are accepted as the solution.
- FIG. 15 is a flow diagram of an example process, according to aspects of the present disclosure.
- Step 1501 may comprise positioning a magnetic dipole transmitter and a magnetic dipole receiver within a borehole in a subterranean formation. At least one of the magnetic dipole transmitter and the magnetic dipole receiver being tiled with respect to an axis of the borehole. In certain embodiments, both of the magnetic dipole transmitter and the magnetic dipole receiver may be tilted with respect to the axis of the borehole.
- the magnetic dipole transmitter and the magnetic dipole receiver may be coupled, for example, to a wireline tool or a LWD element of a drilling assembly.
- Step 1502 may comprise generating a time-varying EM signal with the magnetic dipole transmitter
- step 1503 may comprise measuring a response of the formation to the time-varying EM signal using the magnetic dipole receiver.
- the response may include at least two depths of a formation and at least two azimuthal orientations of the formation with respect to the axis of the borehole.
- the response may comprise amplitude, phase, and attenuation values of the formation to the EM signal.
- measuring the response may comprise receiving a first measurement from the magnetic dipole receiver corresponding to a first azimuthal orientation with respect to the axis of the borehole and calculating a second measurement corresponding to a second azimuthal orientation with respect to the axis of the borehole.
- Step 1504 may comprise generating an image of the formation based, at least in part, on the response.
- the response may be divided into azimuthal bins, and each depth or layer of the borehole or formation may have a separate group of azimuthal bins.
- the image of the formation may be generated by plotting a visualization of the azimuthally- and depth-oriented response values.
- generating the first image of the formation based, at least in part, on the response and the synthetic fracture image comprises generating the first image of the formation using at least one of phase values from the response, amplitude values from the response, attenuation values from the response, and resistivity values calculated using at least one of the phase values, amplitude values, and attenuation values from the response.
- calculating the separate resistivity values may comprise calculating at least one of a geosignal and a compensated signal for each of the azimuthal bins and determining the separate resistivity value for each of the plurality of bins using the calculated geosignal or compensated signal and at least one of a look-up table and an inversion algorithm.
- Step 1505 may comprise determining at least one fracture characteristic based, at least on part, on the first image and a synthetic fracture image.
- determining at least one fracture characteristic based, at least on part, on the first image and the synthetic fracture image may comprise constructing the synthetic fracture image using model fracture characteristics and comparing the synthetic fracture image to feature in the first image.
- the feature in the first image may comprise a portion or section of the first image that is suspected of containing a fracture.
- the model fracture characteristics may be adjusted until the synthetic fracture image matches the feature within a threshold.
- determining at least one fracture characteristic based, at least on part, on the first image and the synthetic fracture image may comprise determining a set of potential model fracture characteristics combinations and for each combination of potential model fracture characteristics, generating a synthetic fracture image, correlating a first feature of the synthetic image with a second feature in the first image, and determining a correlation value.
- the feature of the first image may comprise a portion of the first image. The potential model fracture characteristic with the highest correlation value may then be selected as the fracture characteristic for the first image.
- correlating the first feature of the synthetic image with the second feature in the first image may include determining a type of the second feature.
- a type of the second feature may be determined by determining if the second feature comprises one of a first set of resistivity values that are higher than the resistivity values at adjacent depths in the formation, and a second set of resistivity values that are lower than the resistivity values at adjacent depths in the formation.
- An azimuthal shift and a depth shift between the first feature and second feature may be determined.
- An azimuthal orientation of the second feature may be identified by determining a first azimuthal orientation pointing away from the second feature and a second azimuthal orientation pointing toward the second feature based on the type of the second feature.
- One of the first image and the synthetic fracture image so that the first feature and second feature are aligned in azimuth and depth.
- the methods described above may be implemented in a system with a magnetic dipole transmitter and receiver and an information handling system communicably coupled to the magnetic dipole receivers.
- the information handling system may comprise a processor and a set of instructions that when executed by the processor cause the processor to generate a time-varying electromagnetic (EM) signal with the magnetic dipole transmitter; measure a response of the formation to the time-varying EM signal using the magnetic dipole receiver, the response comprising at least two depths of a formation and at least two azimuthal orientations of the formation with respect to the axis of the tool body; generate a first image of the formation based, at least in part, on the response; and determine at least one fracture characteristic based, at least on part, on the first image and a synthetic fracture image.
- the fracture characteristic may comprise at least one of a presence of a fracture and/or the shape, size, average resistivity value, and/or edge location of the fracture.
Abstract
Description
ΔA T1(k)=20 log(A R1T1(k))−20 log(A R2T1(k)) Equation (1)
ΔφT1(k)=φR1T1(k)−φR2T1(k) Equation (2)
where A* comprises amplitude, φ* comprises phase, R* comprises a receiver, T* comprises a transmitter, and k comprises the bin number. In particular, AR1T1(k) comprises the amplitude of the measured response from receiver R1 to a signal generated by the source T1 at the kth bin position; AR2T1(k) comprises the amplitude of the measured response from receiver R2 to a signal generated by the source T1 at the kth bin position; φR1T1(k) comprises the phase of the measured response from receiver R1 to a signal generated by the source T1 at the kth bin position; and φR2T1(k) comprises the phase of the measured response from receiver R1 to a signal generated by the source T1 at the kth bin position. A resistivity value for the bin may be calculated using a look-up table or an inversion algorithm and the values calculated using equations (1) and (2).
ΔA T1T1′(k)=(ΔA T1(k)+ΔA T1′(k)/2 Equation (3)
ΔφT1T1′(k)=(ΔφT1(k)+ΔφT1′(k))/2 Equation (4)
A resistivity value for the bin may be calculated using a look-up table or an inversion algorithm and the values calculated using equations (3) and (4).
where geo* comprises a geosignal, att* comprises attenuation, *pha comprises phase, A* comprises amplitude, φ* comprises phase, R* comprises a receiver, T* comprises a transmitter, and k comprises the bin number, and m comprises the total number of bins.
Claims (18)
Applications Claiming Priority (1)
| Application Number | Priority Date | Filing Date | Title |
|---|---|---|---|
| PCT/US2013/073520 WO2015084390A1 (en) | 2013-12-06 | 2013-12-06 | Fracture detection and characterization using resistivity images |
Publications (2)
| Publication Number | Publication Date |
|---|---|
| US20160282512A1 US20160282512A1 (en) | 2016-09-29 |
| US9664816B2 true US9664816B2 (en) | 2017-05-30 |
Family
ID=53273936
Family Applications (1)
| Application Number | Title | Priority Date | Filing Date |
|---|---|---|---|
| US14/390,065 Active 2034-09-03 US9664816B2 (en) | 2013-12-06 | 2013-12-06 | Fracture detection and characterization using resistivity images |
Country Status (8)
| Country | Link |
|---|---|
| US (1) | US9664816B2 (en) |
| CN (1) | CN105637176B (en) |
| AR (1) | AR098657A1 (en) |
| AU (1) | AU2013406709B2 (en) |
| CA (1) | CA2927137C (en) |
| GB (1) | GB2534501B (en) |
| NO (1) | NO20160557A1 (en) |
| WO (1) | WO2015084390A1 (en) |
Cited By (3)
| Publication number | Priority date | Publication date | Assignee | Title |
|---|---|---|---|---|
| US20190249546A1 (en) * | 2018-02-08 | 2019-08-15 | Saudi Arabian Oil Company | Data processing system for mapping fracture length using downhole ground penetrating radar |
| US10725194B2 (en) | 2016-05-12 | 2020-07-28 | Halliburton Energy Services, Inc. | Electromagnetic (EM) defect detection methods and systems with enhanced inversion options |
| US11353347B2 (en) * | 2017-03-22 | 2022-06-07 | Texas Instruments Incorporated | Ultrasonic flow meter and excitation method |
Families Citing this family (17)
| Publication number | Priority date | Publication date | Assignee | Title |
|---|---|---|---|---|
| US10570704B2 (en) * | 2014-10-14 | 2020-02-25 | Landmark Graphics Corporation | Automated fracture planning methods for multi-well fields |
| CA2961145C (en) * | 2014-10-17 | 2021-05-18 | Landmark Graphics Corporation | Casing wear prediction using integrated physics-driven and data-driven models |
| US10371851B2 (en) * | 2014-10-21 | 2019-08-06 | Schlumberger Technology Corporation | Method for formation fracture characterization in highly inclined wells using multiaxial induction well logging instruments |
| US20160124108A1 (en) * | 2014-10-30 | 2016-05-05 | Schlumberger Technology Corporation | Inversion Technique For Fracture Characterization In Highly Inclined Wells Using Multiaxial Induction Measurements |
| US10508535B2 (en) | 2014-10-30 | 2019-12-17 | Schlumberger Technology Corporation | Method for steering a well path perpendicular to vertical fractures for enhanced production efficiency |
| WO2016167811A1 (en) * | 2015-04-17 | 2016-10-20 | Halliburton Energy Services, Inc. | Rotary actuator for actuating mechanically operated inflow control devices |
| US10392919B2 (en) * | 2016-03-23 | 2019-08-27 | Baker Hughes, A Ge Company, Llc | Simulated core sample estimated from composite borehole measurement |
| US10782438B2 (en) | 2016-05-03 | 2020-09-22 | Halliburton Energy Services, Inc. | Formation dip determination using resistivity imaging tool |
| AU2016425805A1 (en) * | 2016-10-04 | 2019-03-14 | Halliburton Energy Services, Inc. | Tunable dipole moment for formation measurements |
| WO2019071340A1 (en) | 2017-10-10 | 2019-04-18 | Cenovus Energy Inc. | System, method and apparatus for creating virtual point sources within a hydrocarbon formation |
| CN107942393B (en) * | 2017-11-02 | 2018-10-23 | 中国科学院地质与地球物理研究所 | One kind is with brill orientation acoustic logging collecting method |
| US10947841B2 (en) * | 2018-01-30 | 2021-03-16 | Baker Hughes, A Ge Company, Llc | Method to compute density of fractures from image logs |
| US10564310B2 (en) * | 2018-02-27 | 2020-02-18 | Baker Hughes, A Ge Company, Llc | Dielectric logging with broadband excitation |
| WO2019177574A1 (en) * | 2018-03-12 | 2019-09-19 | Halliburton Energy Services, Inc. | Formation resistivity evaluation system |
| US11899155B2 (en) | 2018-06-08 | 2024-02-13 | Cenovus Energy Inc. | System, method and apparatus for reduced water usage for fracturing hydrocarbon wells with three-dimensional imaging of the formation from a single borehole |
| CN111561266B (en) * | 2019-01-29 | 2022-05-17 | 中国石油化工股份有限公司 | Stratum crack identification method and system |
| CN110487634A (en) * | 2019-09-05 | 2019-11-22 | 安徽理工大学 | The System and method for of core strain, resistivity DCO detailed checkout under a kind of stress state |
Citations (14)
| Publication number | Priority date | Publication date | Assignee | Title |
|---|---|---|---|---|
| US6163155A (en) | 1999-01-28 | 2000-12-19 | Dresser Industries, Inc. | Electromagnetic wave resistivity tool having a tilted antenna for determining the horizontal and vertical resistivities and relative dip angle in anisotropic earth formations |
| US20030184302A1 (en) | 2002-03-26 | 2003-10-02 | Dzevat Omeragic | Electromagnetic resistivity instrument having look ahead capability |
| US20040124841A1 (en) | 2002-12-31 | 2004-07-01 | Dzevat Omeragic | System and method for locating a fracture in an earth formation |
| WO2007013883A2 (en) | 2004-10-04 | 2007-02-01 | Hexion Specialty Chemicals Inc. | Method of estimating fracture geometry, compositions and articles used for the same |
| US20080062814A1 (en) * | 2006-09-12 | 2008-03-13 | Schlumberger Technology Corporation | Discriminating natural fracture- and stress-induced sonic anisotropy using a combination of image and sonic logs |
| WO2008115229A1 (en) | 2007-03-16 | 2008-09-25 | Halliburton Energy Services, Inc. | Robust inversion systems and methods for azimuthally sensitive resistivity logging tools |
| WO2009006975A2 (en) | 2007-07-12 | 2009-01-15 | Services Petroliers Schlumberger | A tool for downhole formation evaluation |
| US7659722B2 (en) | 1999-01-28 | 2010-02-09 | Halliburton Energy Services, Inc. | Method for azimuthal resistivity measurement and bed boundary detection |
| GB2467415A (en) | 2009-01-29 | 2010-08-04 | Schlumberger Holdings | Method and system to estimate fracture aperture in horizontal wells |
| US20100232259A1 (en) | 2006-12-04 | 2010-09-16 | Schlumberger Technology Corporation | Fracture clusters identification |
| US20100312534A1 (en) | 2008-02-28 | 2010-12-09 | Shiyu Xu | Rock Physics Model For Simulating Seismic Response In Layered Fractured Rocks |
| US20120133367A1 (en) | 2009-08-20 | 2012-05-31 | Halliburton Energy Services, Inc. | Fracture Characterization Using Directional Electromagnetic Resistivity Measurements |
| US20130027044A1 (en) | 2009-09-21 | 2013-01-31 | Gerald Minerbo | Imaging using directional resistivity measurements |
| US20130201795A1 (en) | 2011-12-20 | 2013-08-08 | Conocophillips Company | Fracture identification from azimuthal migrated seismic data |
Family Cites Families (7)
| Publication number | Priority date | Publication date | Assignee | Title |
|---|---|---|---|---|
| US5243521A (en) * | 1988-10-03 | 1993-09-07 | Schlumberger Technology Corporation | Width determination of fractures intersecting a borehole |
| US20120192640A1 (en) * | 2006-06-02 | 2012-08-02 | Chanh Cao Minh | Borehole Imaging and Formation Evaluation While Drilling |
| CN101012748B (en) * | 2007-02-02 | 2011-08-10 | 中国石化集团胜利石油管理局测井公司 | Wellface scanning imagery logging device with microresistivity |
| CN101681048B (en) * | 2007-06-18 | 2011-05-18 | 夏普株式会社 | Liquid crystal display device |
| CA2700684C (en) * | 2007-11-30 | 2016-02-09 | Exxonmobil Upstream Research Company | Method for reservoir fracture and cross beds detection using tri- axial/multi-component resistivity anisotropy measurements |
| CN102071931B (en) * | 2010-12-29 | 2014-01-15 | 中国石油天然气集团公司 | Eight-arm omnibearing three-dimensional lateral logging method and logging instrument |
| US9261620B2 (en) * | 2011-11-09 | 2016-02-16 | Micah Thomas Mangione | Apparatus, method and system for mapping fracture features in hydraulically fractured strata using functional proppant properties |
-
2013
- 2013-12-06 GB GB1605556.8A patent/GB2534501B/en not_active Expired - Fee Related
- 2013-12-06 CA CA2927137A patent/CA2927137C/en not_active Expired - Fee Related
- 2013-12-06 CN CN201380080202.5A patent/CN105637176B/en not_active Expired - Fee Related
- 2013-12-06 AU AU2013406709A patent/AU2013406709B2/en not_active Ceased
- 2013-12-06 US US14/390,065 patent/US9664816B2/en active Active
- 2013-12-06 WO PCT/US2013/073520 patent/WO2015084390A1/en active Application Filing
-
2014
- 2014-12-05 AR ARP140104559A patent/AR098657A1/en active IP Right Grant
-
2016
- 2016-04-06 NO NO20160557A patent/NO20160557A1/en not_active Application Discontinuation
Patent Citations (15)
| Publication number | Priority date | Publication date | Assignee | Title |
|---|---|---|---|---|
| US7659722B2 (en) | 1999-01-28 | 2010-02-09 | Halliburton Energy Services, Inc. | Method for azimuthal resistivity measurement and bed boundary detection |
| US6163155A (en) | 1999-01-28 | 2000-12-19 | Dresser Industries, Inc. | Electromagnetic wave resistivity tool having a tilted antenna for determining the horizontal and vertical resistivities and relative dip angle in anisotropic earth formations |
| US20030184302A1 (en) | 2002-03-26 | 2003-10-02 | Dzevat Omeragic | Electromagnetic resistivity instrument having look ahead capability |
| US20040124841A1 (en) | 2002-12-31 | 2004-07-01 | Dzevat Omeragic | System and method for locating a fracture in an earth formation |
| WO2007013883A2 (en) | 2004-10-04 | 2007-02-01 | Hexion Specialty Chemicals Inc. | Method of estimating fracture geometry, compositions and articles used for the same |
| US20080062814A1 (en) * | 2006-09-12 | 2008-03-13 | Schlumberger Technology Corporation | Discriminating natural fracture- and stress-induced sonic anisotropy using a combination of image and sonic logs |
| US20100232259A1 (en) | 2006-12-04 | 2010-09-16 | Schlumberger Technology Corporation | Fracture clusters identification |
| WO2008115229A1 (en) | 2007-03-16 | 2008-09-25 | Halliburton Energy Services, Inc. | Robust inversion systems and methods for azimuthally sensitive resistivity logging tools |
| WO2009006975A2 (en) | 2007-07-12 | 2009-01-15 | Services Petroliers Schlumberger | A tool for downhole formation evaluation |
| US20100307741A1 (en) * | 2007-07-12 | 2010-12-09 | Laurent Mosse | Tool for downhole formation evaluation |
| US20100312534A1 (en) | 2008-02-28 | 2010-12-09 | Shiyu Xu | Rock Physics Model For Simulating Seismic Response In Layered Fractured Rocks |
| GB2467415A (en) | 2009-01-29 | 2010-08-04 | Schlumberger Holdings | Method and system to estimate fracture aperture in horizontal wells |
| US20120133367A1 (en) | 2009-08-20 | 2012-05-31 | Halliburton Energy Services, Inc. | Fracture Characterization Using Directional Electromagnetic Resistivity Measurements |
| US20130027044A1 (en) | 2009-09-21 | 2013-01-31 | Gerald Minerbo | Imaging using directional resistivity measurements |
| US20130201795A1 (en) | 2011-12-20 | 2013-08-08 | Conocophillips Company | Fracture identification from azimuthal migrated seismic data |
Non-Patent Citations (2)
| Title |
|---|
| International Preliminary Report on Patentability issued in related Application No. PCT/US2013/073520, mailed Jun. 16, 2016 (6 pages). |
| International Search Report and Written Opinion issued in related PCT Application No. PCT/US2013/073520 mailed Sep. 1, 2014, 9 pages. |
Cited By (6)
| Publication number | Priority date | Publication date | Assignee | Title |
|---|---|---|---|---|
| US10725194B2 (en) | 2016-05-12 | 2020-07-28 | Halliburton Energy Services, Inc. | Electromagnetic (EM) defect detection methods and systems with enhanced inversion options |
| US11353347B2 (en) * | 2017-03-22 | 2022-06-07 | Texas Instruments Incorporated | Ultrasonic flow meter and excitation method |
| US20190249546A1 (en) * | 2018-02-08 | 2019-08-15 | Saudi Arabian Oil Company | Data processing system for mapping fracture length using downhole ground penetrating radar |
| US20190249545A1 (en) * | 2018-02-08 | 2019-08-15 | Saudi Arabian Oil Company | Apparatus for mapping fracture length using downhole ground penetrating radar |
| US10570727B2 (en) * | 2018-02-08 | 2020-02-25 | Saudi Arabian Oil Company | Data processing system for mapping fracture length using downhole ground penetrating radar |
| US10577925B2 (en) * | 2018-02-08 | 2020-03-03 | Saudi Arabian Oil Company | Apparatus for mapping fracture length using downhole ground penetrating radar |
Also Published As
| Publication number | Publication date |
|---|---|
| CN105637176B (en) | 2018-09-18 |
| CA2927137C (en) | 2018-05-01 |
| US20160282512A1 (en) | 2016-09-29 |
| AU2013406709A1 (en) | 2016-04-28 |
| CN105637176A (en) | 2016-06-01 |
| AU2013406709B2 (en) | 2016-09-15 |
| AR098657A1 (en) | 2016-06-01 |
| WO2015084390A1 (en) | 2015-06-11 |
| NO20160557A1 (en) | 2016-04-06 |
| GB2534501B (en) | 2016-09-28 |
| GB2534501A (en) | 2016-07-27 |
| CA2927137A1 (en) | 2015-06-11 |
Similar Documents
| Publication | Publication Date | Title |
|---|---|---|
| US9664816B2 (en) | Fracture detection and characterization using resistivity images | |
| US9869172B2 (en) | Downhole multi-pipe scale and corrosion detection using conformable sensors | |
| US10061047B2 (en) | Downhole inspection with ultrasonic sensor and conformable sensor responses | |
| US9103928B2 (en) | Methods and systems for analyzing formation properties when performing subterranean operations | |
| US10641917B2 (en) | Pipe and borehole imaging tool with multi-component conformable sensors | |
| US10132954B2 (en) | Downhole tool with radial array of conformable sensors for downhole detection and imaging | |
| US9341053B2 (en) | Multi-layer sensors for downhole inspection | |
| US10094948B2 (en) | High resolution downhole flaw detection using pattern matching | |
| CA3034756C (en) | Tunable dipole moment for formation measurements | |
| WO2019133738A1 (en) | Real-time inversion of array dielectric downhole measurements with advanced search for intial values to eliminate non-uniqueness | |
| US9933543B2 (en) | Downhole inspection, detection, and imaging using conformable sensors | |
| US9650888B2 (en) | Multi-mode measurements with a downhole tool using conformable sensors | |
| US9823380B2 (en) | Compensated borehole and pipe survey tool with conformable sensors |
Legal Events
| Date | Code | Title | Description |
|---|---|---|---|
| AS | Assignment |
Owner name: HALLIBURTON ENERGY SERVICES, INC., TEXAS Free format text: ASSIGNMENT OF ASSIGNORS INTEREST;ASSIGNORS:DONDERICI, BURKAY;TANG, YUMEI;SIGNING DATES FROM 20131218 TO 20140106;REEL/FRAME:031897/0211 |
|
| AS | Assignment |
Owner name: HALLIBURTON ENERGY SERVICES, INC., TEXAS Free format text: ASSIGNMENT OF ASSIGNORS INTEREST;ASSIGNORS:DONDERICI, BURKAY;TANG, YUMEI;SIGNING DATES FROM 20131218 TO 20140106;REEL/FRAME:033869/0727 |
|
| STCF | Information on status: patent grant |
Free format text: PATENTED CASE |
|
| MAFP | Maintenance fee payment |
Free format text: PAYMENT OF MAINTENANCE FEE, 4TH YEAR, LARGE ENTITY (ORIGINAL EVENT CODE: M1551); ENTITY STATUS OF PATENT OWNER: LARGE ENTITY Year of fee payment: 4 |