US9563947B2 - Measurement system for medical images - Google Patents
Measurement system for medical images Download PDFInfo
- Publication number
- US9563947B2 US9563947B2 US14/110,011 US201214110011A US9563947B2 US 9563947 B2 US9563947 B2 US 9563947B2 US 201214110011 A US201214110011 A US 201214110011A US 9563947 B2 US9563947 B2 US 9563947B2
- Authority
- US
- United States
- Prior art keywords
- region
- measurement tool
- medical image
- measurement
- slice
- Prior art date
- Legal status (The legal status is an assumption and is not a legal conclusion. Google has not performed a legal analysis and makes no representation as to the accuracy of the status listed.)
- Active, expires
Links
- 238000005259 measurement Methods 0.000 title claims abstract description 286
- 238000000034 method Methods 0.000 claims abstract description 75
- 238000001514 detection method Methods 0.000 claims abstract description 62
- 230000006870 function Effects 0.000 claims description 69
- 238000001914 filtration Methods 0.000 claims description 14
- 238000002059 diagnostic imaging Methods 0.000 claims description 11
- 230000002457 bidirectional effect Effects 0.000 claims description 10
- 238000003708 edge detection Methods 0.000 claims description 3
- 238000004458 analytical method Methods 0.000 claims description 2
- 238000012549 training Methods 0.000 claims description 2
- 206010028980 Neoplasm Diseases 0.000 abstract description 24
- 238000004590 computer program Methods 0.000 abstract description 5
- 210000001519 tissue Anatomy 0.000 description 12
- 210000000056 organ Anatomy 0.000 description 6
- 230000002159 abnormal effect Effects 0.000 description 5
- 238000013459 approach Methods 0.000 description 5
- 238000002595 magnetic resonance imaging Methods 0.000 description 5
- 230000011218 segmentation Effects 0.000 description 5
- 210000003484 anatomy Anatomy 0.000 description 3
- 238000004364 calculation method Methods 0.000 description 3
- 238000002591 computed tomography Methods 0.000 description 3
- 238000002604 ultrasonography Methods 0.000 description 3
- 230000008901 benefit Effects 0.000 description 2
- 210000000988 bone and bone Anatomy 0.000 description 2
- 239000003814 drug Substances 0.000 description 2
- 238000003384 imaging method Methods 0.000 description 2
- 230000003902 lesion Effects 0.000 description 2
- 230000008569 process Effects 0.000 description 2
- 230000004044 response Effects 0.000 description 2
- 208000008771 Lymphadenopathy Diseases 0.000 description 1
- 230000006978 adaptation Effects 0.000 description 1
- 201000011510 cancer Diseases 0.000 description 1
- 210000000038 chest Anatomy 0.000 description 1
- 238000004891 communication Methods 0.000 description 1
- 208000031513 cyst Diseases 0.000 description 1
- 238000003745 diagnosis Methods 0.000 description 1
- 201000010099 disease Diseases 0.000 description 1
- 208000037265 diseases, disorders, signs and symptoms Diseases 0.000 description 1
- 238000005516 engineering process Methods 0.000 description 1
- 238000011156 evaluation Methods 0.000 description 1
- 230000003993 interaction Effects 0.000 description 1
- 230000002452 interceptive effect Effects 0.000 description 1
- 238000011835 investigation Methods 0.000 description 1
- 210000001165 lymph node Anatomy 0.000 description 1
- 208000018555 lymphatic system disease Diseases 0.000 description 1
- 239000003550 marker Substances 0.000 description 1
- 239000011159 matrix material Substances 0.000 description 1
- 230000002685 pulmonary effect Effects 0.000 description 1
- 238000011160 research Methods 0.000 description 1
- 238000007493 shaping process Methods 0.000 description 1
- 238000010561 standard procedure Methods 0.000 description 1
- 230000000007 visual effect Effects 0.000 description 1
- 238000012800 visualization Methods 0.000 description 1
Images


Classifications
-
- G—PHYSICS
- G06—COMPUTING; CALCULATING OR COUNTING
- G06T—IMAGE DATA PROCESSING OR GENERATION, IN GENERAL
- G06T7/00—Image analysis
- G06T7/60—Analysis of geometric attributes
- G06T7/62—Analysis of geometric attributes of area, perimeter, diameter or volume
-
- A—HUMAN NECESSITIES
- A61—MEDICAL OR VETERINARY SCIENCE; HYGIENE
- A61B—DIAGNOSIS; SURGERY; IDENTIFICATION
- A61B6/00—Apparatus or devices for radiation diagnosis; Apparatus or devices for radiation diagnosis combined with radiation therapy equipment
- A61B6/46—Arrangements for interfacing with the operator or the patient
- A61B6/461—Displaying means of special interest
- A61B6/463—Displaying means of special interest characterised by displaying multiple images or images and diagnostic data on one display
-
- A—HUMAN NECESSITIES
- A61—MEDICAL OR VETERINARY SCIENCE; HYGIENE
- A61B—DIAGNOSIS; SURGERY; IDENTIFICATION
- A61B6/00—Apparatus or devices for radiation diagnosis; Apparatus or devices for radiation diagnosis combined with radiation therapy equipment
- A61B6/46—Arrangements for interfacing with the operator or the patient
- A61B6/467—Arrangements for interfacing with the operator or the patient characterised by special input means
-
- A—HUMAN NECESSITIES
- A61—MEDICAL OR VETERINARY SCIENCE; HYGIENE
- A61B—DIAGNOSIS; SURGERY; IDENTIFICATION
- A61B8/00—Diagnosis using ultrasonic, sonic or infrasonic waves
- A61B8/46—Ultrasonic, sonic or infrasonic diagnostic devices with special arrangements for interfacing with the operator or the patient
- A61B8/461—Displaying means of special interest
-
- A—HUMAN NECESSITIES
- A61—MEDICAL OR VETERINARY SCIENCE; HYGIENE
- A61B—DIAGNOSIS; SURGERY; IDENTIFICATION
- A61B8/00—Diagnosis using ultrasonic, sonic or infrasonic waves
- A61B8/46—Ultrasonic, sonic or infrasonic diagnostic devices with special arrangements for interfacing with the operator or the patient
- A61B8/467—Ultrasonic, sonic or infrasonic diagnostic devices with special arrangements for interfacing with the operator or the patient characterised by special input means
- A61B8/469—Ultrasonic, sonic or infrasonic diagnostic devices with special arrangements for interfacing with the operator or the patient characterised by special input means for selection of a region of interest
-
- G—PHYSICS
- G06—COMPUTING; CALCULATING OR COUNTING
- G06T—IMAGE DATA PROCESSING OR GENERATION, IN GENERAL
- G06T19/00—Manipulating 3D models or images for computer graphics
-
- G—PHYSICS
- G06—COMPUTING; CALCULATING OR COUNTING
- G06T—IMAGE DATA PROCESSING OR GENERATION, IN GENERAL
- G06T7/00—Image analysis
- G06T7/0002—Inspection of images, e.g. flaw detection
- G06T7/0012—Biomedical image inspection
-
- G06T7/0051—
-
- G—PHYSICS
- G06—COMPUTING; CALCULATING OR COUNTING
- G06T—IMAGE DATA PROCESSING OR GENERATION, IN GENERAL
- G06T7/00—Image analysis
- G06T7/50—Depth or shape recovery
-
- G—PHYSICS
- G06—COMPUTING; CALCULATING OR COUNTING
- G06T—IMAGE DATA PROCESSING OR GENERATION, IN GENERAL
- G06T7/00—Image analysis
- G06T7/60—Analysis of geometric attributes
-
- A—HUMAN NECESSITIES
- A61—MEDICAL OR VETERINARY SCIENCE; HYGIENE
- A61B—DIAGNOSIS; SURGERY; IDENTIFICATION
- A61B8/00—Diagnosis using ultrasonic, sonic or infrasonic waves
- A61B8/46—Ultrasonic, sonic or infrasonic diagnostic devices with special arrangements for interfacing with the operator or the patient
- A61B8/467—Ultrasonic, sonic or infrasonic diagnostic devices with special arrangements for interfacing with the operator or the patient characterised by special input means
-
- G—PHYSICS
- G06—COMPUTING; CALCULATING OR COUNTING
- G06T—IMAGE DATA PROCESSING OR GENERATION, IN GENERAL
- G06T2207/00—Indexing scheme for image analysis or image enhancement
- G06T2207/20—Special algorithmic details
- G06T2207/20092—Interactive image processing based on input by user
- G06T2207/20101—Interactive definition of point of interest, landmark or seed
-
- G—PHYSICS
- G06—COMPUTING; CALCULATING OR COUNTING
- G06T—IMAGE DATA PROCESSING OR GENERATION, IN GENERAL
- G06T2207/00—Indexing scheme for image analysis or image enhancement
- G06T2207/30—Subject of image; Context of image processing
- G06T2207/30004—Biomedical image processing
- G06T2207/30096—Tumor; Lesion
-
- G—PHYSICS
- G06—COMPUTING; CALCULATING OR COUNTING
- G06T—IMAGE DATA PROCESSING OR GENERATION, IN GENERAL
- G06T2210/00—Indexing scheme for image generation or computer graphics
- G06T2210/41—Medical
Definitions
- the present invention concerns the measurement of structures within images, the images being generated in the field of medicine.
- a variety of technologies can be used to provide medical images. Typical modern sources of medical images are ultrasound scans, CT scans and MRI scans.
- the size of healthy tissue may be determined in order, for example, to measure growth in children.
- These estimates may also serve, for example, to monitor the growth of abnormal tissue. Both the size of abnormal tissue, and the spacing between abnormal tissue and healthier tissue, may be of interest.
- a single entity such as an organ, bone or tumour.
- a ‘structure’ that may be measured on an image may in fact be a single entity, or even a spacing between two different entities.
- Radiologists may obtain measurements directly from the hard copy of the image, using callipers or a ruler.
- a 3-d image from a scan typically includes a large volume of data points.
- image describes the collection of all these data points.
- an ‘image’ will mean a 3-d image, but some embodiments of the present invention are applicable to 2-d images, such as those often obtained from ultrasound scans.
- a user will normally view only one individual 2 dimensional ‘slice’ through the 3-d image.
- An image slice from a 3-d image is simply a 2-d representation, consisting of those data points that lie on a particular 2-d plane through the 3-d image.
- a typical 3-d image such as one from an MRI scan, will have a matrix of regularly spaced data points.
- the MRI-scan may have data points whose centres are spaced by 1 millimeter in the x- and y-directions across any plane of the scan. Consecutive planes may, for example, be parallel and separated by 7 millimeters.
- Medical imaging workstations commonly provide tools for obtaining the required measurements directly from the displayed image slices.
- Examples of the tools available on medical imaging workstations are digital callipers or a digital ruler.
- the user When working with such tools, the user is typically required to select and then click onto two reference points on the image slice.
- the workstation then calculates the real-world distance between the two reference points, and reports the result in cm or mm.
- real-world means the distance on the object that was scanned, rather than the distance across the screen.
- FIG. 1 generally illustrates a conventional ruler, available on current medical imaging workstations.
- reference 100 indicates a medical image slice.
- Image slice 100 is displayed on a screen 105 , which may be part of a medical imaging workstation.
- Reference 110 indicates schematically the outer edge of a portion of medical image slice 100 , i.e. of the object that was scanned.
- Reference 110 may, for example, indicate the outer edge of a torso.
- Reference 112 shows a structure, also in cross-sectional view, that is located on medical image slice 100 .
- Structure 112 might be a tumour, but might instead be an organ. Only portions of the tumour or organ that lie in the plane of the image slice 100 will be visible. Other portions that lie in neighbouring image slices, will not be visible on slice 100 .
- Reference 120 shows a linear ruler, which is unidirectional.
- a user has aligned linear ruler 120 between points 130 and 140 on structure 112 , having selected these points as being of significance.
- the user has identified points 130 and 140 as being the end points of the longest axis or diameter of structure 112 .
- the linear ruler 120 then provides a readout of the distance between points 130 and 140 .
- the readout is shown as 28 mm on FIG. 1 .
- the numerical value of the measurement may be superimposed on the displayed slice 100 , adjacent to the linear ruler 120 , as shown in FIG. 1 .
- the measurement may be displayed elsewhere on the screen, or recorded elsewhere, such as in a table accessible by viewing another screen.
- a virtual protractor This tool requires the user to click and drag either end of a pair of ‘hinged’ lines to the appropriate locations on the medical image. The workstation then reports the angular measurement.
- Such tools as the virtual ruler and virtual protractor almost exclusively operate in 2D images, or in 2D slices extracted from 3D images.
- the types of measurement of interest on a medical image may include:
- the ‘WHO’ standard requires that both the long and short axes of each tumour be measured.
- the other method is the ‘RECIST’ standard.
- the ‘RECIST’ standard requires only measurement of the long axis of each tumour.
- RECIST 1.1 the measurement of the short axis is used for assessing lymph-nodes, instead of the measurement of the long axis.
- the digital ruler and calliper tools provided on medical imaging workstations require the user to carry out either two or three manual steps. These steps are the following sequence, with at least step 1 and one of steps 2 or 3 being necessary:
- Step 1 Manually select the slice, i.e. the particular 2-d image from amongst all the image data or images that were taken of the structure. Normally, the 2-d image slice that is selected will be the one that appears to have the longest tumour dimension.
- Step 2 On screen, define the start and finish of the long axis measurement, and use a ruler or digital callipers to make the measurement.
- the user must judge the appropriate locations in the slice at which to specify the control points of the measurement tool, in order to obtain the required measurement. For some features, this is relatively straightforward. However, for other features, the true boundary may be unclear. The result is variability in the measurements obtained, for example by different users, even when those users are experienced.
- the interface for the interaction required typically a computer mouse, may be hard to control precisely, leading to inaccurate placement or variability even between the same user making a measurement twice.
- the screen resolution at which the slice and interactive tool location are displayed may affect the accuracy to which the control point can be placed.
- the approximate axis placement and direction may be easily discernable to the user.
- Automated and semi-automated volumetric approaches attempt to overcome the limitations of ruler based approaches. They achieve this by enabling the user to define a 2-d or 3-d segmentation of the object requiring measurement, for example a tumour. The volume and maximum dimensions can then be derived from such segmentations.
- Consistency of control point placement for measurements over a series of images is also important. This need applies to a series of images that are obtained by one technique at the same time, and to such a series obtained at different times. It also applies to multiple images obtained by different techniques, such as MRI and CT scans, whether during an investigation at one point in time or on different occasions.
- a fourth aspect of the invention comprises a computer program in accordance with appended claim 28 .
- a fifth aspect of the invention comprises a computer-readable medium in accordance with appended claim 29 .
- the method and system of the invention enable the measurement of a parameter of a structure on a medical image, based on features of interest.
- the parameter may, for example, be distance, angle, area or volume.
- the method and system of the invention optimise the placement of the respective ends of a measurement tool, displayed on an image slice.
- the invention may perform measurements between ‘control points’ that lie within a single displayed slice of a larger medical image.
- the invention may instead locate and make a measurement from one or more control points that do not lie in the displayed slice. If the invention selects a control point that lies in a slice of the image that was not originally displayed, then a new slice may be displayed that does include all the control points. Thus the invention may lead to the display of a new slice of a medical image that shows the most important dimension of a structure of interest, even if the originally displayed slice was in a different plane.
- the invention may increase the accuracy and/or the repeatability, i.e. consistency, of measurements of tumours, and measurements of the spacing within or between various structures on a medical image.
- the system of the invention may be included in a medical imaging workstation.
- the method of the invention may be applied to multiple images.
- a computer program and computer readable medium are also provided.
- FIG. 1 shows a measurement tool in accordance with the prior art.
- FIG. 2 shows a view of a measurement tool in accordance with an embodiment of the invention.
- FIG. 3 shows a subsequent view of the measurement tool of FIG. 2 .
- FIG. 5 shows plan views of five successive slices of a medical image, to which the invention may be applied.
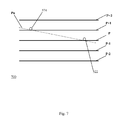
- FIG. 7 shows an expanded side elevation view of the planes shown in FIGS. 5 and 6 .
- FIG. 8 shows a bidirectional measurement tool in accordance with an embodiment of the invention.
- FIG. 9 shows a subsequent view of the bidirectional measurement tool of FIG. 8 .
- FIG. 10 shows a protractor in accordance with an embodiment of the invention.
- FIG. 11 shows a subsequent view of the protractor of FIG. 10 .
- FIGS. 12-15 show examples of local search area adaption, weighting and filtering in accordance with various embodiments of the invention.
- FIG. 16 is a flow chart showing a detailed example of the method that may be used with measurement tools of the forms generally illustrated in FIGS. 2-9 .
- FIG. 18 is a flow chart showing a detailed example of the method of the invention when a constraint is in force.
- FIG. 19 is a flow chart showing a detailed example of the method of the invention applied to multiple images, with a constraint.
- FIG. 20 shows an embodiment of a system in accordance with the invention.
- the invention provides a method of measuring a parameter of a structure on a medical image.
- images are obtained through a variety of digital scanning processes, such as ultrasound scans, CT scans and MRI scans.
- the medical image is displayed as a ‘soft copy’. Normally, the image will have been obtained by a 3-d scan. For an image that has been captured in 3-d, the display will be of a particular ‘slice’ through the 3-d image. If only a 2-d image was captured, that 2-d image is displayed. Henceforth, reference will be made to the image ‘slice’, to cover both these possibilities.
- a measurement tool comprising at least two ends is displayed on the image slice.
- a user of the system can move the ends of the measurement tool to positions in proximity to corresponding features of interest.
- the features of interest are part of the structure.
- the measurement tool may only appear on the display when the user has already selected locations for the ends of the tool, close to the features of interest.
- a computer mouse, tracker ball or touch screen may be used to move the ends of the measurement tool, or to select the locations where the ends of the tool are to appear.
- FIGS. 2-4 2-d Implementations of the Invention
- FIG. 2 shows an embodiment of the invention.
- An image slice 200 is displayed on a screen.
- the screen shown as reference 105 in FIG. 1 has been omitted from FIG. 2 and subsequent FIGS. 3-15 .
- Measurement tool 220 is displayed on the image slice.
- Measurement tool 220 has first end 230 and second end 240 .
- Structure 212 may in reality take various forms, depending on its nature and the resolution of the imaging system used to obtain the medical image.
- structure 212 may be a well defined and continuous structure such as that shown as 112 on FIG. 1 , or may alternatively be barely visible at all. Structure 212 shown on FIG. 2 is an example between these extremes.
- First end 230 of measurement tool 220 is shown in proximity to first part 214 .
- First part 214 constitutes or includes a first feature of interest.
- Second end 240 of measurement tool 220 is shown in proximity to second part 216 .
- Second part 216 constitutes or includes a second feature of interest.
- the locations of the first end 230 and second end 240 may be chosen by a user, who is interested in obtaining a measurement of a parameter of structure 212 .
- the parameter of interest may, for example, be a length. That length may be the length of the long axis of structure 212 .
- measurement tool 220 may provide a measurement that is useful in calculating an area or a volume.
- first end 230 and second end 240 will only approximate to the locations of the corresponding parts 214 and 216 of structure 212 .
- the locations of first end 230 and second end 240 act as initial ‘control points’, to which further steps of the method of the invention are applied.
- each region comprises one of the ends of the measurement tool. So, when viewed on the displayed image slice, a region would have one of the measurement tool's ends within its perimeter.
- each region in its broadest sense, requires that each region have a known spatial relationship to one of the ends of the measurement tool. So the invention can also be implemented by defining a region that does not include either end of the measurement tool within its perimeter. Instead, a region would be defined at some fixed or variable distance away from the end of the measurement tool. The remainder of this description focuses on examples where each region does include one end of the measurement tool.
- the point detection function may therefore be applied twice, i.e. in two regions, each region encompassing one end of the measurement tool.
- the measurement tool may have more than two ends, and the automated point detection function may be applied to one or more ends.
- Region 250 encloses first end 230 of measurement tool 220 , and is shown as a dotted oval. The location of region 250 is determined by the location and orientation of first end 230 of measurement tool 220 .
- the automated point detection function acts to identify a selected point within each region to which it is applied.
- the selected point is the point that optimises the placement of the respective end of the measurement tool.
- the automated point detection function identifies the point within the region that has the highest likelihood of being the feature of interest.
- the point having the highest likelihood of being the feature of interest is then selected as the selected point.
- the parameter measurement then proceeds with one end of the measurement tool being on that selected point. This embodiment is illustrated in FIG. 3 , which is described below.
- the automated point detection function may instead filter potential features within the region. This step of filtering results in a sub-set of one or more candidate features of interest, within the region. The automated point detection function then identifies the one candidate feature from the sub-set that optimises the output of the measurement tool. For example, if the measurement tool is measuring a length of the structure on the displayed slice of the medical image, then the automated point detection function will identify the particular candidate feature that maximises the length of the measurement tool. This particular candidate feature therefore becomes the ‘selected point’ for the region. This embodiment is illustrated in FIG. 4 , which is described below after the discussion of FIG. 3 .
- FIG. 3 illustrates the embodiment of the invention in which the automated point detection function identifies the point within the region that has the highest likelihood of being the feature of interest.
- FIG. 3 shows the result of applying the automated point detection function to a displayed slice of a medical image 300 .
- Perimeter 310 , first part 314 , second part 316 and third part 318 of structure 312 on FIG. 3 generally correspond to the similarly number features on medical image 200 shown on FIG. 2 .
- the automated point detection function has identified a point 330 , on first part 314 of structure 312 .
- Point 330 is the point in region 250 shown on FIG. 2 that has the highest likelihood of being the feature of interest.
- the first end of measurement tool 320 has actually moved to point 330 , which may enable a user to see more clearly where point 330 is on medical image 300 .
- the first end of measurement tool 320 could stay in the location shown by point 230 in FIG. 2 .
- another indication such as a circle, arrow or other visual marker may be used to indicate the point 330 to the user.
- Point 330 provides a more accurate placement of the first end of measurement tool 320 on the first part 314 of structure 322 , for the purposes of measuring a parameter, which may lead to greater accuracy and/or consistency in calculating various parameters of structure 312 .
- a measurement of the parameter of structure 312 is performed, using point 330 .
- the second end of the measurement tool 320 has moved to a point 340 on the second part 316 of structure 312 .
- Point 340 was identified by applying the automated point detection function to a second region, which enclosed second end 240 of measurement tool 220 on FIG. 2 .
- the measurement of the parameter of structure 312 may thus be performed using both points 330 and 340 . However, if only point 330 is identified, and not point 340 , then the parameter measurement would instead be based on point 330 and the location shown as 240 on FIG. 2 . The method of the invention would provide maximum accuracy in calculating parameters of structure 312 when both points 330 and 340 can be identified.
- the automated point detection function may comprise an assessment of object edge likelihood. If such an assessment is made, then the result may involve identifying the location of the point having the highest object edge likelihood, within each region. This approach may lead to a placement of one or both ends of the measurement tool 320 at a point or points that are substantially more accurate than the original locations of the first and second ends 230 , 240 chosen by the user and as shown in FIG. 2 .
- the automated point detection function may comprise an assessment of the rate of intensity variation, the selected point being the point where the rate of intensity variation is maximum.
- FIG. 4 illustrates the embodiment of the automated point detection function that:
- FIG. 4 shows just the measurement tool 410 displayed on an image slice 400 , without further detail of the image slice.
- the automated point detection function is applied in a circular region 412 around the location at which a user has placed first end 420 of measurement tool 410 .
- the automated point detection function identifies a subset of points 422 , 424 and 426 , which are candidate features.
- the automated point detection function identifies candidate feature 424 as being the candidate feature within region 412 that optimises the output of the measurement tool.
- the measurement tool is measuring a length of the structure on the displayed slice of the medical image. Choosing candidate feature 424 maximises the length of the measurement tool, so this particular candidate feature therefore becomes the ‘selected point’ for the region.
- the measurement tool has been shown in a second location, after application of the point detection function, as reference 440 . The leftmost end of the measurement tool 440 is on selected point 424 .
- the automated point detection function is also applied in a circular region 414 around the location at which a user has placed second end 430 of measurement tool 410 .
- the automated point detection function identifies a subset of only one candidate feature, at point 432 , which meets the selection criteria. Examples of possible selection criteria are discussed later. So point 432 becomes the ‘selected point’ in region 414 .
- measurement tool 440 In its second location, measurement tool 440 has been shown with its rightmost end on selected point 432 .
- the result of applying the automated point detection function in regions 412 and 414 of FIG. 4 is to reposition the measurement tool to location 440 , from its initial location 410 .
- the length measurement is thereby optimised.
- FIGS. 1-4 above shows a single displayed slice of a medical image.
- the automated point detection function is applied in a region 250 , 412 or 414 that is a two dimensional area of the displayed slice of the medical image.
- the region lies in the same plane as the displayed slice of the medical image, and is a two dimensional area. So each selected point 330 , 340 lies within the displayed slice of the medical image and, in the optimised placement, the ends of the measurement tool lie within the plane of the displayed slice of the medical image.
- a further embodiment of the invention may utilise to its advantage the 3-d nature of the medical image data.
- a 3-d image includes data points that lie in slices that are above and/or below the displayed slice of the medical image.
- the automated point detection function may be applied in a 3-d region, rather than the 2-d region 250 , 412 , 414 shown in FIGS. 2 and 4 .
- This further embodiment may be implemented either to select the single best point, or a sub-set of one or more candidate features of interest.
- the automated point detection function is still applied to regions of a medical image that surround the ends of a measurement tool, or have a fixed spatial relationship to the ends. However, each region encompasses a 3-d volume of the medical image. Each region comprises part of the displayed slice of the medical image, and part of at least one other slice of the medical image. These regions will be referred to henceforth as ‘3-d regions’.
- the automated point detection function identifies a selected point within one of the image slices that optimises the placement of the respective end of the measurement tool. As a result, one or more ends of the measurement tool may need to be placed within other slices of the medical image than the displayed slice.
- One advantage of such an approach is that it allows placement of the measurement tool in a plane that differs from the plane of the originally displayed image slice. So, for example, the longest dimension of a structure may be identified and measured, even if that dimension does not lie in the plane of the single image slice that was originally chosen for display by the user.
- At least one end of the measurement tool may be moved to the point selected by the automated point detection function. If at least one end of the measurement tool does not lie within the displayed slice, then this may also involve displaying a new slice of the medical image.
- the new slice comprises the ends of the measurement tool, but may not be parallel to the image slice that was originally chosen for display by the user.
- FIG. 5 shows the invention applied to a 3-d region of the medical image.
- FIG. 5 it is useful to consider the two dimensional region 250 shown in FIG. 2 .
- a three dimensional region around the end of the measurement tool 220 in FIG. 2 might be created by rotating the oval region 250 about the axis of measurement tool 220 .
- Such a 3-d region might have its widest plane in the plane of the displayed slice of the medical image.
- the 3-d region would intersect successively smaller areas of other slices of the medical image, which lay above or below the displayed slice.
- FIG. 5 shows views of five successive slices of a medical image. Four vertical lines have been included on FIG. 5 to divide up the five successive slices.
- the slice labelled ‘P’ in the centre of FIG. 5 is the initially displayed slice of the medical image.
- Slice ‘P+1’ lies immediately above slice ‘P’, and slice ‘P+2’ lies above slice ‘P+1’.
- Slice ‘P ⁇ 1’ lies below slice ‘P’, and slice ‘P ⁇ 2’ lies below slice ‘P ⁇ 1’. Only slice ‘P’ is visible on the display screen of the medical imaging workstation. However, the data for the other four slices is held as part of the medical image.
- Slice P includes a measurement tool 510 .
- Region 512 surrounds end 520 of measurement tool 510 .
- Region 514 surrounds end 530 of measurement tool 510 .
- Regions 512 and 514 are both 3-d regions. Region 554 represents the intersection of region 512 with plane ‘P+1’, and region 556 represents the intersection of region 514 with plane ‘P+1’.
- Region 550 represents the intersection of region 512 with plane ‘P+2’
- region 552 represents the intersection of region 514 with plane ‘P+2’.
- Region 560 represents the intersection of region 512 with plane ‘P ⁇ 1’
- region 562 represents the intersection of region 514 with plane ‘P ⁇ 1’
- Region 564 represents the intersection of region 512 with plane ‘P ⁇ 2’
- region 566 represents the intersection of region 514 with plane ‘P ⁇ 2’.
- the automated point detection function When the automated point detection function is applied to the 3-d region represented by references 512 , 550 , 554 , 560 and 564 , it identifies two candidate features of interest, at points 522 and 572 . Point 522 lies in plane P, and point 572 lies in plane P+1, and these two features make up the sub-set of candidate features for the region.
- the automated point detection function when applied to the 3-d region represented by references 514 , 552 , 556 , 562 and 566 , it identifies two candidate features of interest, at points 532 and 574 . Point 532 lies in plane P, and point 574 lies in plane P+1, and these two features make up the sub-set of candidate features for the region.
- dashed line 540 represents the optimised position of the measurement tool.
- the length of the measurement tool is being maximised, and the measurement tool joins points 522 and 532 .
- dashed line 570 in plane P+1 represents the optimised position of the measurement tool.
- the measurement tool joins points 572 and 574 .
- the measurement tool can lie in any plane, then the measurement tool's length is optimised when it connects point 522 in plane P to point 574 in plane P+1.
- the view displayed to the user may then be changed from that shown in FIG. 5 as plane P, to that shown as view 600 in FIG. 6 , described below.
- the embodiment of FIG. 5 may result only in the selection of a single point in each of regions 512 and 514 that has the highest likelihood of being the feature of interest. These may turn out to be points 532 and 572 , for example.
- the point detection function may be applied to only one of regions 512 and 514 .
- FIG. 6 shows a new plane Pn.
- Plane Pn has been generated from data in the medical image, but does not lie in a plane parallel to any of the slices shown in FIG. 5 .
- Pn contains both points 522 and 574 , from FIG. 5 . These points have been reproduced on FIG. 6 , with the same numbering.
- Measurement tool 610 has been drawn on plane Pn. Measurement tool 610 is longer than either of measurement tools 540 and 570 shown in FIG. 5 . Thus the length of the measurement tool has been optimised. The display provided to the user can be changed to display the plane Pn in which the optimum measurement lies.
- FIG. 7 shows an expanded side elevation view of the planes shown in FIGS. 5 and 6 .
- Plane P in the centre of FIG. 7 is the plane of the image slice that is initially displayed to the user, as explained in connection with FIG. 5 .
- Planes P+2, P+1, P ⁇ 1, P ⁇ 2, represent slices of the image that are not displayed to the user, but which are included in the image data available to the system of the invention.
- a new slice of the image represented by plane Pn may be displayed to the user.
- the measurement tool 610 shown on FIG. 6 lies in plane Pn, and connects points 522 and 574 .
- Region 250 in FIG. 2 and the various regions in FIGS. 4-6 have been shown as ovals, with their long axis aligned with measurement tool 220 . However, other forms of region may be used. In general terms, the shape and size of region may be selected to ensure that the search by the automated point detection function occurs in an area or volume that does not extend very significantly away from the direction along which the measurement tool lies.
- each region may be made three dimensional using various approaches. If region 250 in FIG. 2 had been a rectangle, for example, the rectangle could be either:
- the assessment of object edge likelihood may be achieved in a variety of ways. These may include the following list, but other assessment methodologies are also possible. The assessment techniques listed below may be used alone, or in combination:
- the size of the region may be adjusted in a variety of ways.
- the adjustment may be based on the expected error or accuracy of the location of the end of the measurement tool.
- the adjustment of each region may depend on at least one of:
- the assessment of object edge likelihood can be filtered or weighted to take account of prior expectation or knowledge.
- the assessment of object edge likelihood may be filtered or weighted on the basis of the direction of the measurement tool, so that edges lying normal to the direction of measurement tool are considered of higher likelihood than those parallel to the direction of measurement tool.
- the size or shape of a basic initial search region may be adjusted to be larger in a direction parallel to the measurement tool than in a direction perpendicular to the measurement tool. This has been done with region 250 shown in FIG. 2 .
- the method of the invention may be used to calculate parameters from scan data in various situations.
- the method of the invention may be used with, or in, any of the following:
- FIG. 8 shows a medical image 800 .
- Perimeter 810 , and the first part 814 and third part 818 of structure 812 on FIG. 8 generally correspond to the similarly numbered features on medical images 200 and 300 shown on FIGS. 2 and 3 .
- Second part 816 of structure 812 on FIG. 8 is more extensive than the second parts 216 and 316 shown on FIGS. 2 and 3 .
- Measurement tool 820 on FIG. 8 is ‘bidirectional’.
- Bidirectional measurement tool 820 comprises a first section 822 and a second section 824 .
- First section 822 and second section 824 are two sections 822 and 824 :
- First section 822 has a first end 822 A and a second end 822 B.
- Second section 824 has a third end 824 A and a fourth end 824 B.
- FIG. 9 corresponds to FIG. 8 .
- the three parts of the structure 812 shown on FIG. 8 have had their reference signs and labels omitted from structure 912 in FIG. 9 , in order to simplify the figure.
- first section 822 and second section 824 of bidirectional measurement tool 820 shown on FIG. 8 and the four ends of the measurement tool, have not been labelled on bidirectional measurement tool 820 in FIG. 9 .
- FIG. 9 shows first region 952 , second region 954 , third region 956 and fourth region 958 . Each of these regions is circular, and encompasses one of the ends of the bidirectional measurement tool 920 . Each of regions 952 , 954 , 956 and 958 defines a portion of the medical image in which a search is made by a point detection function.
- the point detection function has identified four points, one in each of the four regions 952 , 954 , 956 and 958 . Each point is labelled 922 C, 922 D, 924 C and 924 D.
- the ends of the bidirectional measurement tool 920 have not moved or ‘snapped’ to the points 922 C, 922 D, 924 C and 924 D identified in each of regions 952 , 954 , 956 and 958 . However, this may occur. Whether or not such movement occurs, the method of the invention may use any or all of points 922 C, 922 D, 924 C and 924 D in performing a measurement of a parameter of structure 912 .
- the method of the invention as applied in FIG. 9 may select potential edge locations by filtering the edge likelihood, to give binary edge/not edge detection.
- This filtering can be performed by applying a threshold to the likelihood, for example.
- the method comprises a search of all nearby edge locations in the or each region, to optimise the measurement as required. For example, for the long axis, the system would find the pair of edge points that gives the longest in plane measurement. The system may then move the ends of the measurement tool to the optimal locations.
- the bidirectional measurement tool shown in FIGS. 8 and 9 may be particularly useful for obtaining measurements of the long axis and the short axis of a structure, such as a tumour. These measurements can then be used in the WHO/RECIST techniques described in the Background section above.
- the measurement tool may be a protractor.
- the protractor may comprise two measurement arms connected at a hinge, the two arms lying at an angle to each other. The angle swept out by the hinge varies.
- FIG. 10 shows a medical image 1000 .
- a structure 1012 Within the perimeter 1010 is a structure 1012 .
- Structure 1012 is an anatomical feature within the medical image.
- the lower, central portion of structure 1012 has a generally V-shape.
- Protractor 1020 is arranged adjacent to the central portion of structure 1012 .
- Protractor 1020 has a first measurement arm 1022 and a second measurement arm 1024 , which are joined at hinge 1026 .
- the initial alignment of first measurement arm 1022 and second measurement arm 1024 may be chosen by a user.
- an automated point detection function is applied to at least one region of medical image 1010 .
- Each region comprises the end of one of the measurement arms.
- the automated point detection function may comprise an assessment of object edge likelihood.
- the assessment of object edge likelihood may be filtered or weighted on the basis of the direction of the corresponding measurement arm of protractor tool 1020 .
- the region may be shaped, on the basis of the direction of the measurement arm.
- Such shaping, filtering or weighting therefore, can include the following more detailed options:
- Object edges lying parallel to the direction of the at least one arm may be considered to be of higher likelihood than those perpendicular to the direction of the arm, using weighting or filtering to achieve this.
- the shape of at least one region around the location of the end of at least one arm may be adjusted in dependence on the initial direction of the arm, whereby the region is larger in a direction perpendicular to the arm.
- hinge 1026 of protractor 1020 may move either to:
- FIG. 11 shows a further view of the measurement tool of FIG. 10 .
- Medical image 1100 comprises perimeter 1110 and structure 1112 .
- the first measurement arm 1122 and the second measurement arm 1124 of protractor 1120 have moved or snapped to orientations that lie parallel to portions of the structure 1112 .
- the angle between the first and second measurement arms may be displayed on the screen in the vicinity of the protractor. Entirely as an illustrative numerical example, an angle of 105 degrees is shown on FIG. 11 .
- FIGS. 2-3 and 8-11 show the application of the method of the invention to a single slice from the medical image, i.e. from the data obtained in a medical scan.
- FIGS. 4-7 show the application of the method of the invention to a region that spans multiple slices from the medical image.
- data may be obtained:
- the method of the invention may be applied to multiple medical images that have been obtained at different times, or on one occasion by multiple machines or with multiple settings on one machine.
- the method of the invention may further comprise:
- the ruler measurements should be taken on image planes having the same orientation for each image in a series.
- the user would indicate which rulers should be linked, and thus have the constraint applied to them.
- the method could involve automatically applying a constraint, or the user could specify which constraint should be applied to the measurement.
- the selected points i.e. the control point positions for all linked measurement tools
- the selected points would be chosen according to the search methods described above.
- the optimisation would take account of the additional optimisation criteria.
- the invention may provide a notification to a user when the additional constraint cannot be applied to at least one of the linked measurement tools. This might occur for constraints that cannot be sensibly optimised.
- the constraint could be a condition that rulers should be drawn on image planes having the same orientation. This is only possible if the image slices that are available meet this criterion, and none were taken in a different orientation.
- the user's initial selection of approximate control points may exclude optimisation, i.e. it is not possible to carry out the optimisation, from where the user started. Once notified of the problem, the user could then adjust the measurement tool or tools as needed, until the constraint is met, or the constraint could be automatically optimised.
- a user may inspect the result and adjust if necessary. So the points identified by the point detection function may be altered or over-ridden by a user.
- the user may adjust the weighting or filtering and then re-apply the method using the revised weighting or filtering criteria. Hence the method of the present invention may be applied iteratively.
- FIGS. 12-15 show various different examples of 2-d local search area adaption, weighting and filtering in accordance with embodiments of the invention. Corresponding 3-d versions of the search area adaptation also apply.
- FIG. 12 a shows a portion of a measurement tool 1220 .
- Reference 1250 indicates a uniform region, of circular shape, which constitutes the search area for the object recognition function of the invention in this embodiment.
- FIG. 12 b shows a portion of a measurement tool 1230 .
- Reference 1260 indicates the region that constitutes the search area for the object recognition function of the invention in this embodiment. Region 1260 is shaped according to the direction of the measurement tool 1230 , but is uniform, so is not weighted or filtered.
- FIG. 13 a shows a portion of a measurement tool 1320 .
- Reference 1350 indicates a distance weighted region, which constitutes the search area for the object recognition function of the invention in this embodiment. Within distance weighted region 1350 , concentric rings with successively thinner lines are shown to illustrate successively lower weightings.
- FIG. 13 b shows an adaption of FIG. 13 a .
- a portion of a measurement tool 1330 is shown on FIG. 13 b .
- Reference 1360 indicates a region weighted both by distance from the end of the measurement tool, and shaped and weighted according to the direction of the measurement tool 1330 . Hence region 1360 is both weighted and shaped.
- Region 1360 constitutes the search area for the object recognition function of the invention in this embodiment. Within region 1360 , concentric ovals with successively thinner lines are shown to illustrate successively lower weightings.
- FIG. 14 a shows a portion of a measurement arm 1420 of a protractor tool.
- Reference 1450 constitutes the search area for the object recognition function of the invention in this embodiment.
- Region 1450 is a uniform search area, whose shape is elongated in a direction perpendicular to the direction of protractor measurement arm 1420 .
- FIG. 14 b shows a portion of a measurement arm 1430 of a protractor tool.
- Reference 1460 constitutes the search area for the object recognition function of the invention in this embodiment.
- Region 1460 is a uniform search area.
- the shape of search area 1460 is determined by the protractor hinge location and the length or radius of the measurement arm 1430 .
- FIG. 15 a shows a portion of a measurement arm 1520 of a protractor tool.
- Reference 1550 constitutes the search area for the object recognition function of the invention in this embodiment.
- Region 1550 is a uniform search area.
- the shape of search area 1550 is generally rectangular, and search area lies along one side of measurement arm 1520 .
- FIG. 15 b shows a portion of a measurement arm 1530 of a protractor tool.
- Reference 1560 constitutes the search area for the object recognition function of the invention in this embodiment.
- Region 1560 is a uniform search area.
- the search area provided by region 1560 is generally fan shaped.
- Region 1560 may taper back to any point along the measurement arm, and may lie on both sides or on one side of measurement arm 1530 .
- FIG. 16 is a flow chart showing a detailed example of a method that may be used with measurement tools of the forms generally illustrated in FIGS. 2-9 . Each of steps 1-6 of the flowchart of FIG. 16 occurs in sequence.
- FIG. 17 is a flow chart showing a detailed example of the method that may be used with the protractor generally illustrated in FIGS. 10 and 11 .
- the example illustrated in FIG. 17 involves the calculation of object edge likelihood within each of two regions and in addition at the hinge point of the protractor.
- Step 4 may optionally comprise weighting, e.g. by distance from, and/or orientation of, each portion of the region, relative to the location where the ends or measurement arms of the protractor were initially placed. This weighting may also involve the direction of the measurement arm.
- step 6 the position of the hinge may be adjusted according to the local image orientation that has been found, i.e. in accordance with the final directions of the measurement arms.
- FIG. 18 is a flow chart showing a detailed example of the method of the invention when a constraint is in force.
- the edge likelihoods are converted into probable edges, to provide the sub-set of candidate features. See in particular step 5 of FIG. 18 .
- FIG. 19 is a flow chart showing a detailed example of the method of the invention applied when a constraint is in force.
- the method is applied simultaneously to multiple displayed slices, from multiple images.
- the method may be applied to multiple measurement tools displayed on a single image.
- Step 8 of FIG. 19 shows a successful outcome.
- the system is able to calculate one or more parameters. This calculation uses the points for the ends of the measurement tools that are derived in steps 6 and 7.
- the user may intervene in response to the warning. For example, the user might alter the constraint, or one or more images may be removed from the set of images. The user may return to step 2.
- the invention comprises a computer program, comprising computer-executable code.
- the computer-executable code When executed on a computer system, the computer-executable code causes the computer system to perform a method according to any of the preceding embodiments of the invention.
- a computer-readable medium is provided, storing such a computer program.
- the system comprises a display 2010 , for displaying a soft copy of a medical image 2020 .
- a module 2030 is capable of displaying, and or adapted to display, a measurement tool 2040 on the medical image 2020 .
- Measurement tool 2040 comprises at least two ends.
- the user interface 2050 , 2060 allows a user to place each of the at least two ends of measurement tool 2040 in proximity to a corresponding feature of interest on the medical image 2020 .
- the features of interest form part of the structure. Features of interest forming a structure are shown, for example, in FIGS. 2-11 .
- Module 2030 is further capable of, and/or adapted to:
- the automated point detection function is capable of identifying, and or adapted to identify, a selected point within the region that optimises the placement of the respective end of the measurement tool.
- the selected point may be the point within the one region having the highest likelihood of being the corresponding feature of interest.
- the selected point may however be selected from a sub-set of candidate features, identified within the region, the selected point optimising the measurement from amongst the candidate features.
- the system of FIG. 20 may be implemented in a workstation.
- a workstation may be capable of implementing any of the methods described above.
Landscapes
- Engineering & Computer Science (AREA)
- Health & Medical Sciences (AREA)
- Life Sciences & Earth Sciences (AREA)
- Physics & Mathematics (AREA)
- Medical Informatics (AREA)
- General Health & Medical Sciences (AREA)
- Nuclear Medicine, Radiotherapy & Molecular Imaging (AREA)
- Radiology & Medical Imaging (AREA)
- Theoretical Computer Science (AREA)
- General Physics & Mathematics (AREA)
- Molecular Biology (AREA)
- Veterinary Medicine (AREA)
- Pathology (AREA)
- Biophysics (AREA)
- Biomedical Technology (AREA)
- Heart & Thoracic Surgery (AREA)
- Surgery (AREA)
- Animal Behavior & Ethology (AREA)
- Public Health (AREA)
- Computer Vision & Pattern Recognition (AREA)
- High Energy & Nuclear Physics (AREA)
- Optics & Photonics (AREA)
- Human Computer Interaction (AREA)
- Geometry (AREA)
- Quality & Reliability (AREA)
- Computer Graphics (AREA)
- Computer Hardware Design (AREA)
- General Engineering & Computer Science (AREA)
- Software Systems (AREA)
- Apparatus For Radiation Diagnosis (AREA)
- Magnetic Resonance Imaging Apparatus (AREA)
Applications Claiming Priority (3)
| Application Number | Priority Date | Filing Date | Title |
|---|---|---|---|
| GB201105725A GB2489709B (en) | 2011-04-05 | 2011-04-05 | Measurement system for medical images |
| GB1105725.4 | 2011-04-05 | ||
| PCT/EP2012/056098 WO2012136669A2 (fr) | 2011-04-05 | 2012-04-03 | Système de mesure pour images médicales |
Publications (2)
| Publication Number | Publication Date |
|---|---|
| US20140029815A1 US20140029815A1 (en) | 2014-01-30 |
| US9563947B2 true US9563947B2 (en) | 2017-02-07 |
Family
ID=44071960
Family Applications (1)
| Application Number | Title | Priority Date | Filing Date |
|---|---|---|---|
| US14/110,011 Active 2032-05-08 US9563947B2 (en) | 2011-04-05 | 2012-04-03 | Measurement system for medical images |
Country Status (4)
| Country | Link |
|---|---|
| US (1) | US9563947B2 (fr) |
| EP (1) | EP2695138B1 (fr) |
| GB (1) | GB2489709B (fr) |
| WO (1) | WO2012136669A2 (fr) |
Families Citing this family (14)
| Publication number | Priority date | Publication date | Assignee | Title |
|---|---|---|---|---|
| GB2475722B (en) * | 2009-11-30 | 2011-11-02 | Mirada Medical | Measurement system for medical images |
| KR102078390B1 (ko) | 2012-07-30 | 2020-02-17 | 삼성전자 주식회사 | 멀티 터치를 통한 기하학적 도형을 그리는 방법 및 장치 |
| WO2015049684A1 (fr) * | 2013-10-02 | 2015-04-09 | Given Imaging Ltd. | Système et procédé d'estimation de la taille d'objets in vivo |
| US10028649B2 (en) * | 2013-12-02 | 2018-07-24 | Welch Allyn, Inc. | Digital colposcope system |
| JP2017537677A (ja) | 2014-11-06 | 2017-12-21 | ザ プロクター アンド ギャンブル カンパニー | 予ひずみ状積層体及びその作製方法 |
| KR102293915B1 (ko) * | 2014-12-05 | 2021-08-26 | 삼성메디슨 주식회사 | 초음파 이미지 처리 방법 및 이를 위한 초음파 장치 |
| WO2016149632A1 (fr) * | 2015-03-18 | 2016-09-22 | Bio1 Systems, Llc | Dispositif et procédé d'évaluation de plaie numérique |
| EP3770807B1 (fr) * | 2015-05-04 | 2023-11-01 | Smith, Andrew Dennis | Estimation de réponse tumorale assistée par ordinateur et évaluation de la charge tumorale vasculaire |
| CN109069122B (zh) * | 2016-05-12 | 2022-03-29 | 富士胶片索诺声公司 | 确定医学图像中的结构的尺寸的系统和方法 |
| KR20180085247A (ko) | 2017-01-18 | 2018-07-26 | 삼성메디슨 주식회사 | 초음파 영상 장치 및 초음파 영상 표시 방법 |
| EP3582733B1 (fr) | 2017-02-16 | 2022-08-17 | The Procter & Gamble Company | Articles absorbants avec des substrats ayant des motifs répétitifs d'ouvertures comprenant une pluralité d'unités récurrentes |
| US11308618B2 (en) | 2019-04-14 | 2022-04-19 | Holovisions LLC | Healthy-Selfie(TM): a portable phone-moving device for telemedicine imaging using a mobile phone |
| CN111553903B (zh) * | 2020-04-29 | 2024-03-08 | 北京优视魔方科技有限公司 | 一种用于病灶区域图像的自适应度量方法和装置 |
| CN111882570A (zh) * | 2020-07-28 | 2020-11-03 | 浙江水晶光电科技股份有限公司 | 边缘定位方法、装置、存储介质及电子设备 |
Citations (10)
| Publication number | Priority date | Publication date | Assignee | Title |
|---|---|---|---|---|
| JPH04358290A (ja) | 1991-06-04 | 1992-12-11 | Toshiba Corp | 図形計測装置 |
| JP2921078B2 (ja) | 1990-09-30 | 1999-07-19 | 株式会社島津製作所 | Mri装置 |
| WO2005055008A2 (fr) | 2003-11-26 | 2005-06-16 | Viatronix Incorporated | Systemes et procedes pour la segmentation, la visualisation et l'analyse automatisees d'images medicales |
| WO2005071527A2 (fr) | 2004-01-19 | 2005-08-04 | Koninklijke Philips Electronics N.V. | Procede et appareil pour obtenir une fonctionnalite de mesure flexible pour des images medicales |
| US20060171580A1 (en) * | 2005-01-31 | 2006-08-03 | Charles Blanford | Enhanced video metrology tool |
| US7539332B1 (en) * | 2003-09-19 | 2009-05-26 | Compumed, Inc. | Method and system for automatically identifying regions of trabecular bone tissue and cortical bone tissue of a target bone from a digital radiograph image |
| US20090180677A1 (en) * | 2008-01-16 | 2009-07-16 | Yuanzhong Li | Method, apparatus, and program for measuring sizes of tumor regions |
| US20100215245A1 (en) * | 2007-09-17 | 2010-08-26 | Koninklijke Philips Electronics N.V. | Caliper for measuring objects in an image |
| US7856132B2 (en) * | 2004-05-28 | 2010-12-21 | Koninklijke Philips Electronics N.V. | Method, a computer program, an apparatus and an imaging system for image processing |
| US8036436B2 (en) * | 2006-10-10 | 2011-10-11 | Cedara Software Corp. | System and method for segmenting a region in a medical image |
-
2011
- 2011-04-05 GB GB201105725A patent/GB2489709B/en active Active
-
2012
- 2012-04-03 WO PCT/EP2012/056098 patent/WO2012136669A2/fr active Application Filing
- 2012-04-03 EP EP12716295.6A patent/EP2695138B1/fr active Active
- 2012-04-03 US US14/110,011 patent/US9563947B2/en active Active
Patent Citations (11)
| Publication number | Priority date | Publication date | Assignee | Title |
|---|---|---|---|---|
| JP2921078B2 (ja) | 1990-09-30 | 1999-07-19 | 株式会社島津製作所 | Mri装置 |
| JPH04358290A (ja) | 1991-06-04 | 1992-12-11 | Toshiba Corp | 図形計測装置 |
| US7539332B1 (en) * | 2003-09-19 | 2009-05-26 | Compumed, Inc. | Method and system for automatically identifying regions of trabecular bone tissue and cortical bone tissue of a target bone from a digital radiograph image |
| WO2005055008A2 (fr) | 2003-11-26 | 2005-06-16 | Viatronix Incorporated | Systemes et procedes pour la segmentation, la visualisation et l'analyse automatisees d'images medicales |
| WO2005071527A2 (fr) | 2004-01-19 | 2005-08-04 | Koninklijke Philips Electronics N.V. | Procede et appareil pour obtenir une fonctionnalite de mesure flexible pour des images medicales |
| US20080228061A1 (en) * | 2004-01-19 | 2008-09-18 | Koninklijke Philips Electronic, N.V. | Method and Apparatus Providing Flexible Measurement Functionality for Medical Images |
| US7856132B2 (en) * | 2004-05-28 | 2010-12-21 | Koninklijke Philips Electronics N.V. | Method, a computer program, an apparatus and an imaging system for image processing |
| US20060171580A1 (en) * | 2005-01-31 | 2006-08-03 | Charles Blanford | Enhanced video metrology tool |
| US8036436B2 (en) * | 2006-10-10 | 2011-10-11 | Cedara Software Corp. | System and method for segmenting a region in a medical image |
| US20100215245A1 (en) * | 2007-09-17 | 2010-08-26 | Koninklijke Philips Electronics N.V. | Caliper for measuring objects in an image |
| US20090180677A1 (en) * | 2008-01-16 | 2009-07-16 | Yuanzhong Li | Method, apparatus, and program for measuring sizes of tumor regions |
Non-Patent Citations (2)
| Title |
|---|
| IPO Search Report and Written Opinion for GB1105725.4, completed Jul. 13, 2011. |
| PCT Search Report and Written Opinion for PCT/EP2012/056098, completed Aug. 21, 2012. |
Also Published As
| Publication number | Publication date |
|---|---|
| WO2012136669A3 (fr) | 2013-01-17 |
| EP2695138B1 (fr) | 2019-08-21 |
| GB2489709B (en) | 2013-07-31 |
| WO2012136669A9 (fr) | 2013-02-07 |
| GB201105725D0 (en) | 2011-05-18 |
| EP2695138A2 (fr) | 2014-02-12 |
| GB2489709A (en) | 2012-10-10 |
| WO2012136669A2 (fr) | 2012-10-11 |
| US20140029815A1 (en) | 2014-01-30 |
Similar Documents
| Publication | Publication Date | Title |
|---|---|---|
| US9563947B2 (en) | Measurement system for medical images | |
| EP3210163B1 (fr) | Segmentation de région d'intérêt expédié par le suivi du regard | |
| US8160320B2 (en) | Medical image display apparatus, method and program, and recording medium for the program | |
| US8077948B2 (en) | Method for editing 3D image segmentation maps | |
| CN100553561C (zh) | 在ct血管造影术中分割结构的方法及设备 | |
| US8150120B2 (en) | Method for determining a bounding surface for segmentation of an anatomical object of interest | |
| CN104346821B (zh) | 用于医学成像的自动规划 | |
| CA2776186C (fr) | Affichage de l'image d'une ligne mediane d'une structure tubulaire | |
| EP2120208A1 (fr) | Procédé et système de segmentation de lésion | |
| US20070064982A1 (en) | Clinical review and analysis work flow for lung nodule assessment | |
| US20130257910A1 (en) | Apparatus and method for lesion diagnosis | |
| CN105027163A (zh) | 扫描区域确定装置 | |
| US8150121B2 (en) | Information collection for segmentation of an anatomical object of interest | |
| US20090129642A1 (en) | Image processing device and a control method and control program thereof | |
| US10535189B2 (en) | Image display of a centerline of tubular structure | |
| EP2577604B1 (fr) | Système de traitement pour images d'examen par balayage médical | |
| US20110243402A1 (en) | Measurement system for medical images | |
| US8520923B2 (en) | Reporting organ volume for a medical digital image | |
| US9361711B2 (en) | Lesion-type specific reconstruction and display of digital breast tomosynthesis volumes | |
| EP2601637B1 (fr) | Système et procédé de segmentation multi-modalité d'un tissu interne avec rétroaction en direct | |
| JP5073484B2 (ja) | 画像処理をするための方法、コンピュータプログラム、装置及びイメージングシステム | |
| US9082193B2 (en) | Shape-based image segmentation | |
| Cucchiara et al. | An image analysis approach for automatically re-orienteering CT images for dental implants | |
| EP4216160A1 (fr) | Procédés et systèmes de régularisation de segmentation 3d d'image en temps réel | |
| US20230342994A1 (en) | Storage medium, image identification method, image identification device |
Legal Events
| Date | Code | Title | Description |
|---|---|---|---|
| AS | Assignment |
Owner name: MIRADA MEDICAL LIMITED, UNITED KINGDOM Free format text: ASSIGNMENT OF ASSIGNORS INTEREST;ASSIGNORS:KADIR, TIMOR;GOODING, MARK;REEL/FRAME:031357/0228 Effective date: 20130930 |
|
| STCF | Information on status: patent grant |
Free format text: PATENTED CASE |
|
| MAFP | Maintenance fee payment |
Free format text: PAYMENT OF MAINTENANCE FEE, 4TH YR, SMALL ENTITY (ORIGINAL EVENT CODE: M2551); ENTITY STATUS OF PATENT OWNER: SMALL ENTITY Year of fee payment: 4 |
|
| AS | Assignment |
Owner name: BOSTON SCIENTIFIC SCIMED, INC., MINNESOTA Free format text: ASSIGNMENT OF ASSIGNORS INTEREST;ASSIGNOR:MIRADA MEDICAL LIMITED;REEL/FRAME:067332/0543 Effective date: 20240325 |