US9497136B1 - Method and system for providing usage metrics to manage utilzation of cloud computing resources - Google Patents
Method and system for providing usage metrics to manage utilzation of cloud computing resources Download PDFInfo
- Publication number
- US9497136B1 US9497136B1 US13/247,505 US201113247505A US9497136B1 US 9497136 B1 US9497136 B1 US 9497136B1 US 201113247505 A US201113247505 A US 201113247505A US 9497136 B1 US9497136 B1 US 9497136B1
- Authority
- US
- United States
- Prior art keywords
- application
- cloud computing
- user
- reserved
- computing resources
- Prior art date
- Legal status (The legal status is an assumption and is not a legal conclusion. Google has not performed a legal analysis and makes no representation as to the accuracy of the status listed.)
- Active, expires
Links
Images


Classifications
-
- H—ELECTRICITY
- H04—ELECTRIC COMMUNICATION TECHNIQUE
- H04L—TRANSMISSION OF DIGITAL INFORMATION, e.g. TELEGRAPHIC COMMUNICATION
- H04L47/00—Traffic control in data switching networks
- H04L47/70—Admission control; Resource allocation
-
- G—PHYSICS
- G06—COMPUTING; CALCULATING OR COUNTING
- G06F—ELECTRIC DIGITAL DATA PROCESSING
- G06F9/00—Arrangements for program control, e.g. control units
- G06F9/06—Arrangements for program control, e.g. control units using stored programs, i.e. using an internal store of processing equipment to receive or retain programs
- G06F9/44—Arrangements for executing specific programs
- G06F9/455—Emulation; Interpretation; Software simulation, e.g. virtualisation or emulation of application or operating system execution engines
- G06F9/45533—Hypervisors; Virtual machine monitors
- G06F9/45558—Hypervisor-specific management and integration aspects
-
- G—PHYSICS
- G06—COMPUTING; CALCULATING OR COUNTING
- G06F—ELECTRIC DIGITAL DATA PROCESSING
- G06F9/00—Arrangements for program control, e.g. control units
- G06F9/06—Arrangements for program control, e.g. control units using stored programs, i.e. using an internal store of processing equipment to receive or retain programs
- G06F9/46—Multiprogramming arrangements
- G06F9/50—Allocation of resources, e.g. of the central processing unit [CPU]
- G06F9/5061—Partitioning or combining of resources
- G06F9/5072—Grid computing
-
- H—ELECTRICITY
- H04—ELECTRIC COMMUNICATION TECHNIQUE
- H04L—TRANSMISSION OF DIGITAL INFORMATION, e.g. TELEGRAPHIC COMMUNICATION
- H04L41/00—Arrangements for maintenance, administration or management of data switching networks, e.g. of packet switching networks
- H04L41/50—Network service management, e.g. ensuring proper service fulfilment according to agreements
- H04L41/5003—Managing SLA; Interaction between SLA and QoS
- H04L41/5009—Determining service level performance parameters or violations of service level contracts, e.g. violations of agreed response time or mean time between failures [MTBF]
- H04L41/5012—Determining service level performance parameters or violations of service level contracts, e.g. violations of agreed response time or mean time between failures [MTBF] determining service availability, e.g. which services are available at a certain point in time
-
- H—ELECTRICITY
- H04—ELECTRIC COMMUNICATION TECHNIQUE
- H04L—TRANSMISSION OF DIGITAL INFORMATION, e.g. TELEGRAPHIC COMMUNICATION
- H04L47/00—Traffic control in data switching networks
- H04L47/70—Admission control; Resource allocation
- H04L47/78—Architectures of resource allocation
-
- H—ELECTRICITY
- H04—ELECTRIC COMMUNICATION TECHNIQUE
- H04L—TRANSMISSION OF DIGITAL INFORMATION, e.g. TELEGRAPHIC COMMUNICATION
- H04L47/00—Traffic control in data switching networks
- H04L47/70—Admission control; Resource allocation
- H04L47/83—Admission control; Resource allocation based on usage prediction
-
- G—PHYSICS
- G06—COMPUTING; CALCULATING OR COUNTING
- G06F—ELECTRIC DIGITAL DATA PROCESSING
- G06F9/00—Arrangements for program control, e.g. control units
- G06F9/06—Arrangements for program control, e.g. control units using stored programs, i.e. using an internal store of processing equipment to receive or retain programs
- G06F9/44—Arrangements for executing specific programs
- G06F9/455—Emulation; Interpretation; Software simulation, e.g. virtualisation or emulation of application or operating system execution engines
- G06F9/45533—Hypervisors; Virtual machine monitors
- G06F9/45558—Hypervisor-specific management and integration aspects
- G06F2009/45591—Monitoring or debugging support
-
- G—PHYSICS
- G06—COMPUTING; CALCULATING OR COUNTING
- G06F—ELECTRIC DIGITAL DATA PROCESSING
- G06F9/00—Arrangements for program control, e.g. control units
- G06F9/06—Arrangements for program control, e.g. control units using stored programs, i.e. using an internal store of processing equipment to receive or retain programs
- G06F9/46—Multiprogramming arrangements
- G06F9/50—Allocation of resources, e.g. of the central processing unit [CPU]
- G06F9/5005—Allocation of resources, e.g. of the central processing unit [CPU] to service a request
- G06F9/5027—Allocation of resources, e.g. of the central processing unit [CPU] to service a request the resource being a machine, e.g. CPUs, Servers, Terminals
-
- H—ELECTRICITY
- H04—ELECTRIC COMMUNICATION TECHNIQUE
- H04L—TRANSMISSION OF DIGITAL INFORMATION, e.g. TELEGRAPHIC COMMUNICATION
- H04L41/00—Arrangements for maintenance, administration or management of data switching networks, e.g. of packet switching networks
- H04L41/22—Arrangements for maintenance, administration or management of data switching networks, e.g. of packet switching networks comprising specially adapted graphical user interfaces [GUI]
-
- H—ELECTRICITY
- H04—ELECTRIC COMMUNICATION TECHNIQUE
- H04L—TRANSMISSION OF DIGITAL INFORMATION, e.g. TELEGRAPHIC COMMUNICATION
- H04L41/00—Arrangements for maintenance, administration or management of data switching networks, e.g. of packet switching networks
- H04L41/50—Network service management, e.g. ensuring proper service fulfilment according to agreements
- H04L41/508—Network service management, e.g. ensuring proper service fulfilment according to agreements based on type of value added network service under agreement
- H04L41/5096—Network service management, e.g. ensuring proper service fulfilment according to agreements based on type of value added network service under agreement wherein the managed service relates to distributed or central networked applications
-
- H—ELECTRICITY
- H04—ELECTRIC COMMUNICATION TECHNIQUE
- H04L—TRANSMISSION OF DIGITAL INFORMATION, e.g. TELEGRAPHIC COMMUNICATION
- H04L67/00—Network arrangements or protocols for supporting network services or applications
- H04L67/01—Protocols
- H04L67/10—Protocols in which an application is distributed across nodes in the network
- H04L67/1001—Protocols in which an application is distributed across nodes in the network for accessing one among a plurality of replicated servers
- H04L67/1004—Server selection for load balancing
- H04L67/1008—Server selection for load balancing based on parameters of servers, e.g. available memory or workload
-
- H—ELECTRICITY
- H04—ELECTRIC COMMUNICATION TECHNIQUE
- H04L—TRANSMISSION OF DIGITAL INFORMATION, e.g. TELEGRAPHIC COMMUNICATION
- H04L67/00—Network arrangements or protocols for supporting network services or applications
- H04L67/01—Protocols
- H04L67/10—Protocols in which an application is distributed across nodes in the network
- H04L67/1001—Protocols in which an application is distributed across nodes in the network for accessing one among a plurality of replicated servers
- H04L67/1031—Controlling of the operation of servers by a load balancer, e.g. adding or removing servers that serve requests
Definitions
- the present invention relates to the field of information technology, including, more particularly, to systems and techniques for simplifying access to different applications.
- IT information technology
- An IT department is responsible for upkeep, maintenance, and security of networks. This may include analyzing the computer and information needs of their organizations from an operational and strategic perspective and determining immediate and long-range personnel and resource requirements.
- FIG. 1 shows a block diagram of a client-server system and network in which an embodiment of the invention may be implemented.
- FIG. 2 shows a more detailed diagram of an exemplary client or computer which may be used in an implementation of the invention.
- FIG. 3 shows a system block diagram of a client computer system.
- FIG. 4 shows a data source or data service in the form of a database system.
- FIG. 5 shows a block diagram of an environment in which a management console system that collects data from other systems may be implemented.
- FIG. 6 shows an overall flow for generating a dashboard display of the management console system.
- FIG. 7 shows a more detailed block diagram of the management console system.
- FIG. 8 shows an example of a dashboard screen of the management console system.
- FIG. 9 shows a block diagram of cloud computing resources of an organization and the different groups that provide and use such resources.
- FIG. 10 shows a block diagram of components of a system for utilization tracking and notification of cloud resources.
- FIG. 11 shows a flow for utilization tracking and notification of cloud resources.
- FIG. 12 shows a flow for calculating a resource utilization ratio.
- FIG. 13 shows a block diagram of an application execution mapping system including monitoring agents to monitor application execution.
- FIG. 14 shows a block diagram of a first configuration of the monitoring agents.
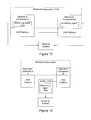
- FIG. 15 shows a block diagram of a second configuration of the monitoring agents.
- FIG. 16 shows a block diagram of a third configuration of the monitoring agents.
- FIG. 17 shows a block diagram of a fourth configuration of the monitoring agents.
- FIG. 18 shows a more detailed block diagram of the application execution mapping system.
- FIG. 19 shows a flow for building an application execution map.
- FIG. 20 shows a dashboard display of the management console application including an updated application execution map.
- FIG. 21 shows a dashboard display of the management console application including another embodiment of an application execution map.
- FIG. 22 shows a block diagram of the management console application including another embodiment of an updated application execution map.
- FIG. 1 is a simplified block diagram of a distributed computer network 100 .
- Computer network 100 includes a number of client systems 113 , 116 , and 119 , and a server system 122 coupled to a communication network 124 via a plurality of communication links 128 .
- Communication network 124 provides a mechanism for allowing the various components of distributed network 100 to communicate and exchange information with each other.
- Communication network 124 may itself be comprised of many interconnected computer systems and communication links.
- Communication links 128 may be hardwire links, optical links, satellite or other wireless communications links, wave propagation links, or any other mechanisms for communication of information.
- Various communication protocols may be used to facilitate communication between the various systems shown in FIG. 1 . These communication protocols may include TCP/IP, HTTP protocols, wireless application protocol (WAP), vendor-specific protocols, customized protocols, and others.
- communication network 124 is the Internet, in other embodiments, communication network 124 may be any suitable communication network including a local area network (LAN), a wide area network (WAN), a wireless network, a intranet, a private network, a public network, a switched network, and combinations of these, and the like.
- Distributed computer network 100 in FIG. 1 is merely illustrative of an embodiment and is not intended to limit the scope of the invention as recited in the claims.
- more than one server system 122 may be connected to communication network 124 .
- a number of client systems 113 , 116 , and 119 may be coupled to communication network 124 via an access provider (not shown) or via some other server system.
- Client systems 113 , 116 , and 119 typically request information from a server system which provides the information. For this reason, server systems typically have more computing and storage capacity than client systems. However, a particular computer system may act as both a client or a server depending on whether the computer system is requesting or providing information. Additionally, although aspects of the invention have been described using a client-server environment, it should be apparent that the invention may also be embodied in a stand-alone computer system. Aspects of the invention may be embodied using a client-server environment or a cloud-computing environment.
- Client systems 113 , 116 , and 119 enable users to access and query information stored by server system 122 .
- a “Web browser” application executing on a client system enables users to select, access, retrieve, or query information stored by server system 122 .
- Examples of web browsers include the Internet Explorer browser program provided by Microsoft Corporation, and the Firefox browser provided by Mozilla Foundation, and others.
- FIG. 2 shows an exemplary client or server system.
- a user interfaces with the system through a computer workstation system, such as shown in FIG. 2 .
- FIG. 2 shows a computer system 201 that includes a monitor 203 , screen 205 , cabinet 207 , keyboard 209 , and mouse 211 .
- Mouse 211 may have one or more buttons such as mouse buttons 213 .
- Cabinet 207 houses familiar computer components, some of which are not shown, such as a processor, memory, mass storage devices 217 , and the like.
- Mass storage devices 217 may include mass disk drives, floppy disks, magnetic disks, optical disks, magneto-optical disks, fixed disks, hard disks, CD-ROMs, recordable CDs, DVDs, recordable DVDs (e.g., DVD-R, DVD+R, DVD-RW, DVD+RW, HD-DVD, or Blu-ray Disc), flash and other nonvolatile solid-state storage (e.g., USB flash drive), battery-backed-up volatile memory, tape storage, reader, and other similar media, and combinations of these.
- mass disk drives floppy disks, magnetic disks, optical disks, magneto-optical disks, fixed disks, hard disks, CD-ROMs, recordable CDs, DVDs, recordable DVDs (e.g., DVD-R, DVD+R, DVD-RW, DVD+RW, HD-DVD, or Blu-ray Disc), flash and other nonvolatile solid-state storage (e.g., USB flash drive), battery-backed-up volatile memory
- a computer-implemented or computer-executable version of the invention may be embodied using, stored on, or associated with computer-readable medium or non-transitory computer-readable medium.
- a computer-readable medium may include any medium that participates in providing instructions to one or more processors for execution. Such a medium may take many forms including, but not limited to, nonvolatile, volatile, and transmission media.
- Nonvolatile media includes, for example, flash memory, or optical or magnetic disks.
- Volatile media includes static or dynamic memory, such as cache memory or RAM.
- Transmission media includes coaxial cables, copper wire, fiber optic lines, and wires arranged in a bus. Transmission media can also take the form of electromagnetic, radio frequency, acoustic, or light waves, such as those generated during radio wave and infrared data communications.
- a binary, machine-executable version, of the software of the present invention may be stored or reside in RAM or cache memory, or on mass storage device 217 .
- the source code of the software may also be stored or reside on mass storage device 217 (e.g., hard disk, magnetic disk, tape, or CD-ROM).
- code may be transmitted via wires, radio waves, or through a network such as the Internet.
- FIG. 3 shows a system block diagram of computer system 201 .
- computer system 201 includes monitor 203 , keyboard 209 , and mass storage devices 217 .
- Computer system 201 further includes subsystems such as central processor 302 , system memory 304 , input/output (I/O) controller 306 , display adapter 308 , serial or universal serial bus (USB) port 312 , network interface 318 , and speaker 320 .
- a computer system includes additional or fewer subsystems.
- a computer system could include more than one processor 302 (i.e., a multiprocessor system) or a system may include a cache memory.
- Arrows such as 322 represent the system bus architecture of computer system 201 . However, these arrows are illustrative of any interconnection scheme serving to link the subsystems. For example, speaker 320 could be connected to the other subsystems through a port or have an internal direct connection to central processor 302 .
- the processor may include multiple processors or a multicore processor, which may permit parallel processing of information.
- Computer system 201 shown in FIG. 2 is but an example of a suitable computer system. Other configurations of subsystems suitable for use will be readily apparent to one of ordinary skill in the art.
- Computer software products may be written in any of various suitable programming languages, such as C, C++, C#, Pascal, Fortran, Perl, Matlab (from MathWorks), SAS, SPSS, JavaScript, AJAX, Java, SQL, and XQuery (a query language that is designed to process data from XML files or any data source that can be viewed as XML, HTML, or both).
- the computer software product may be an independent application with data input and data display modules.
- the computer software products may be classes that may be instantiated as distributed objects.
- the computer software products may also be component software such as Java Beans (from Oracle Corporation) or Enterprise Java Beans (EJB from Oracle Corporation).
- the present invention provides a computer program product which stores instructions such as computer code to program a computer to perform any of the processes or techniques described.
- An operating system for the system may be one of the Microsoft Windows® family of operating systems (e.g., Windows 95, 98, Me, Windows NT, Windows 2000, Windows XP, Windows XP x64 Edition, Windows Vista, Windows 7, Windows CE, Windows Mobile), Linux, HP-UX, UNIX, Sun OS, Solaris, Mac OS X, Alpha OS, AIX, IRIX32, or IRIX64. Other operating systems may be used.
- Microsoft Windows is a trademark of Microsoft Corporation.
- the computer may be connected to a network and may interface to other computers using this network.
- the network may be an intranet, interne, or the Internet, among others.
- the network may be a wired network (e.g., using copper), telephone network, packet network, an optical network (e.g., using optical fiber), or a wireless network, or any combination of these.
- data and other information may be passed between the computer and components (or steps) of the system using a wireless network using a protocol such as Wi-Fi (IEEE standards 802.11, 802.11a, 802.11b, 802.11e, 802.11g, 802.11i, and 802.11n, just to name a few examples).
- Wi-Fi IEEE standards 802.11, 802.11a, 802.11b, 802.11e, 802.11g, 802.11i, and 802.11n, just to name a few examples.
- signals from a computer may be transferred, at least in part, wirelessly to components or other computers.
- a user accesses a system on the World Wide Web (WWW) through a network such as the Internet.
- WWW World Wide Web
- the Web browser is used to download web pages or other content in various formats including HTML, XML, text, PDF, and postscript, and may be used to upload information to other parts of the system.
- the Web browser may use uniform resource identifiers (URLs) to identify resources on the Web and hypertext transfer protocol (HTTP) in transferring files on the Web.
- URLs uniform resource identifiers
- HTTP hypertext transfer protocol
- FIG. 4 shows a data source or data service in the form of a database system.
- a database may be part of a database management system.
- One suitable database management system architecture is a three-tiered architecture as shown.
- a first tier is the core of a database management system, a central storage 401 that holds or stores a database or repository 403 .
- the database typically resides on one or more hard drives, and is generally part of a larger computer system.
- the information may be stored in the database in a variety of formats.
- An example is an Extensible Markup Language (XML) database.
- An XML database is a data persistence software system that allows data to be stored in XML format.
- RDMS relational database management system which uses tables to store the information.
- database servers 405 are instances of a program that interacts with the database. Each instance of a database server may, among other features, independently query the database and store information in the database. Depending on the implementation, the database servers 405 may or may not include user-friendly interfaces, such as graphical user interfaces.
- a third tier is an application server 407 .
- the application server provides the user interfaces to the database servers.
- the application server may be a web application server on the Internet or any other network.
- the application server may also be a virtual database server or a virtual directory server.
- the application server may provide user-friendly mechanisms and interfaces for accessing the database through the database servers.
- a web browser 409 is utilized to access the application server.
- FIG. 5 shows a block diagram in which a management console system 505 of the invention may be implemented.
- the system includes an integration server 510 , a management console database 515 coupled to the integration server, and a management console application 520 coupled to the database.
- the management console application includes several subsystems, components, modules, or interfaces such as an identity and role management component 525 , an application/data access interface 530 , and a user interface component 535 .
- the system provides a central cloud management console which streamlines formerly complex, time consuming, and error prone operations.
- the system communicates with external systems 540 , 545 , or both and presents the data generated by the systems through a single cloud management application program.
- the example of FIG. 5 shows two external systems. It should be appreciated, however, that there can be any number of external systems coupled to central cloud management system 505 , such as one, two, three, four, five, or more than five systems.
- systems 540 , 545 or both are combined into a single management console system 505 .
- a first application 550 from system 545 includes a cloud resource utilization tracking application.
- a second application 555 from system 540 includes an application execution mapping application. Resource reservation, tracking, and billing, as well as application and infrastructure mapping, control, and monitoring are typically orders of magnitude more complex in a cloud environment than in a data center running well-controlled applications.
- this specific implementation provides a centralized management console or system with high availability on a distributed system.
- the management console includes identity management system for centralized authentication and authorization or role management.
- identity management system for centralized authentication and authorization or role management.
- This system can manage the data flow on the cloud from within the application and to/from the external applications to manage the complete workflow (e.g., request to billing and service).
- the management console can act as a dashboard providing information on storage, network, utilization of resources, and helps to track resources such as virtual machines, storage, and the like on the cloud more efficiently.
- the console can act as a backbone to complete a business workflow and can help to minimize or reduce cost and time and increase quality. Centralizing cloud management can increase security which is desirable in cloud offerings. Having a centralized management console can reduce the number of different applications an organization may have, reduce maintenance difficulties and turnaround “time to customer,” for providing a service, resolving a problem, or both.
- a single management console for the private cloud, with monitoring and configuration of clustering, load balancing and high availability, server load reporting, and in general cloud inventory and load (e.g., network, routers, applications, and so forth).
- There may be a distributed mapping infrastructure providing dynamic maps of application execution, resource usage, user activity tracking or general cloud map. Dynamic mapping can be a building block for the management console and the resource tracking services.
- the centralized management console system obtains data from external systems such as application execution mapping 555 , cloud resource utilization tracking 550 , or both.
- the system may be web-enabled.
- data integration from the one or more different external systems is provided through integration server 510 .
- Integration server 510 may be referred to as a web method integration server. This server can push data to management console application database 515 running this console through database insert/update triggers from the other external system databases, such as databases 560 and 565 .
- a specific implementation of the system is with cloud resource utilization and tracking and application execution mapping. It should be appreciated, however, that the system may instead or additionally communicate with other types of applications such as customer relationship management (CRM) applications, supply chain management applications, risk and compliance management applications, and so forth.
- CRM customer relationship management
- a feature of system 505 includes “always-on” connectivity using clustered high-availability (HA) environments to help ensure no downtime for the cloud or private cloud. There can be load balancers, firewall setup and security settings for authentication and authorization.
- system 505 is implemented using VMware for virtualization.
- Cloud connectivity can help to ensure business continuity.
- cloud services as described in this application may implement high availability technologies and capabilities such as active/active clustering, dynamic server load balancing and ISP load balancing within the network infrastructure.
- a centralized management and network system built with network architecture for cloud services can help business continuity which is desirable for many organizations.
- a centralized or single management console can also ease administration and reduce security threats.
- human error is a large facture in network security threat facing both physical and virtual computing environments.
- organizations deploy additional network devices to secure their virtual networks. By doing this, organizations may exponentially increase their risk.
- Device management, administration, monitoring and configuration becomes more tedious and less organized.
- a central or single management console to manage, monitor and configure the devices can help to reduce security threats and ease administration.
- Identity and role management component 525 provides authentication and authorization to each of the intercommunicating applications.
- the centralized management console may be a web application which provides role-based access to applications.
- the component provides single sign-on (SSO) access.
- SSO single sign-on
- Single sign-on (SSO) is a property of access control of multiple related, but independent software systems. Through the SSO feature, a user can log in once and gain access to all systems without being prompted to log in again at each of them.
- a single sign-on configuration may include prompting the user for a user name and password, be based on Kerberos, smart card, one-time password (OTP) token, integrated Windows authentication, or combinations of these.
- OTP one-time password
- authentication is via a biometric authentication.
- Biometric authentication includes techniques for recognizing humans based upon one or more intrinsic physical or behavioral traits. Some examples of biometric characteristics include fingerprint, face recognition, DNA, palm print, hand geometry, iris recognition, typing rhythm, or voice.
- GUI graphical user interface
- FIG. 8 shows an example of a GUI.
- the interface may be referred to as a display, view, window, or dashboard.
- the interface includes a web page that is displayed within a browser.
- the interface may include graphical icons, elements, visual indicators, controls, user-controls, widgets, and the like.
- FIG. 6 shows an overflow diagram 605 for generating a centralized management console dashboard.
- a step 610 the system receives data from one or more external systems or applications.
- the data is stored in a database of the management console application.
- a step 620 the system receives and authorizes a request to access the management console application.
- the system displays an interactive dashboard.
- receiving data from the one or more external applications is implemented through database triggers.
- a database trigger is procedural code that is automatically executed in response to certain events on a particular table or view in a database.
- a trigger can be activated whenever a specified event, such as an insert event, delete event, or update event, occurs on a particular table.
- a trigger may have an activation time, such as before, after, or instead of the triggering event.
- triggers are procedures, which are stored in a database, and can be executed or “fired” when a table is modified.
- a trigger can specify a series of actions to be automatically performed when a specific event occurs.
- a mapping between one or more fields of an external database to one or more fields of the management console database there is a mapping between one or more fields of an external database to one or more fields of the management console database.
- An event occurs at the external database involving the one or more fields of the external database.
- the event data is transmitted to and stored in the one or more fields of the management console database (step 615 ).
- customer ABC reserves or rents 100 virtual machines (VMs) on a private cloud for some of his offerings.
- VMs virtual machines
- a user e.g., IT administrator
- can log into the management console application such as by entering a user name and password.
- the system permits, allows, or authorizes the access to the management console application.
- the system displays an interactive dashboard.
- the dashboard may include data generated by the one or more external applications.
- the management console application accesses management console database 515 which may include data collected from the one or more external applications.
- the dashboard may further include user-selectable controls to permit the user to interact with the external applications through the management console application.
- FIG. 7 shows a block diagram of a specific implementation of the centralized management console system shown in FIG. 5 .
- the system can centralize access to and data from any number of systems such as a first system 720 , and a second system 725 .
- the first system includes a rent-a-cloud service
- the second system includes a cloud dashboard having an application execution map.
- the management console application allows consolidating of other products and adding value above what each individual products can provide. For example, resource reservation can be done using an external infrastructure, the resulting reserved set of resource is then communicated back into the management console and dynamically tracked during its lifetime. Data can be fed into an external billing and reporting system.
- the single console simplifies IT operations. Authorization and access management is more secure as it is done in a single place.
- the mapping infrastructure is also useful outside of the management console to get a more precise idea of application execution (e.g., debug, resource consumption, or security concerns). More particularly, resource reservation is generally not subsequently linked to resource usage monitoring (in a dynamic environment) and resource billing. High availability and clustering configuration and monitoring are usually application specific.
- Dynamic application maps usually rely on diffusion networks and network monitoring. They are not capable of providing accurate maps of highly distributed applications executing in multiple different environments (e.g., cloud+data center+customer premises+remote database access, etc.).
- rent-a-cloud provides a service that enables an end-user to rent IT resources in a self-service way and supports authorization process control.
- This service may track resource delivery by human input, an automatic way, or both so that a cloud administrator (e.g., private cloud administrator) can know who is occupying which resource.
- a cloud administrator e.g., private cloud administrator
- cloud dashboard provides maps or application execution maps which can be used during application development and debug to get a better picture or determine where an application is executing.
- Usage of an application execution map is not limited to the cloud environment, and when an application executes inside and outside the cloud, the map can show all the nodes.
- implementation is done by network sniffing, installation of agents on participating machines, application instrumentation, or combinations of these. The methods can be combined as different environments have different constraints.
- a map centralization service can be offered in the cloud or elsewhere.
- FIG. 8 shows an example of a dashboard 805 of the management console system.
- the dashboard may be displayed as a Web page within a browser window.
- the dashboard may be an interactive dashboard. For example, a user may be able to click on a dashboard element to drill-down and see detail information or drill-up to see summary information.
- User-input controls may be provided which allow for sorting and filtering.
- This example of the dashboard includes a resource utilization and tracking section 810 and an application execution map section 815 .
- the resource utilization and tracking section includes a table 820 and a set of charts 822 .
- Table 820 includes columns 825 A-F.
- Column 825 A lists users.
- Column 825 B identifies the resources reserved by the users.
- Column 825 C identifies the period for which the user reserved the resource.
- Column 825 D displays metrics indicating utilization of the resource.
- Column 825 E displays status to indicate whether or not utilization of the resource has fallen below a threshold level.
- Column 825 F includes user-input controls to allow the logged in user to select an action.
- the table may include a user-input control 827 that allows the user to select a particular view or filter to, for example, view current reservations, view upcoming reservations, view reservations for a particular time period, show under-utilized resources, show resources by resource type (e.g., virtual machines versus storage), show resource reservations by user, show resource reservations by department, and so forth.
- a user-input control 827 that allows the user to select a particular view or filter to, for example, view current reservations, view upcoming reservations, view reservations for a particular time period, show under-utilized resources, show resources by resource type (e.g., virtual machines versus storage), show resource reservations by user, show resource reservations by department, and so forth.
- the dashboard data may be customized for a particular user or user role.
- dashboard 805 is displayed showing the various resources that the IT administrator “John” is responsible for and the status of those resources.
- the IT administrator can see that there is a user “Tim” who has reserved 100 virtual machines for the period Oct. 1, 2010 to Jul. 7, 2011.
- the IT administrator can further see that Tim's current utilization of the resource is 60 percent.
- the utilization may be calculated as a ratio of an amount of resources used to an amount of resources reserved.
- the IT administrator can see that there is a user “Jenn” who has reserved 500 GB of storage for the period Sep. 8, 2010 to Mar. 5, 2011.
- the IT administrator can further see that Jenn's current utilization of the resource is 90%.
- a 60 percent utilization may be below a threshold utilization level.
- an organization may set a policy that users have at least 80 percent utilization of resources that they reserve. This can help to encourage efficient use of resources.
- a utilization of 60 percent is below the 80 percent threshold utilization level.
- status 825 E displays a particular visual indicator to indicate that utilization is below the threshold level.
- the visual indicator can include a color (e.g., red or green), shape (e.g., square, triangle, or circle), text, icon, pattern, shade, or combinations of these.
- a red visual indicator 827 A (as shown by the filled-in circle in the figure) can indicate that usage of the reserved resource has fallen below the threshold utilization level.
- a green visual indicator 827 B (as shown by the unfilled circle in the figure) can indicate that usage of the reserved resource is above the threshold utilization level.
- the action column (column 825 F) permits the IT administrator to select an action related to the reserved resource. For example, the IT administrator may select an action “Send Notification,” “Reclaim,” or “Apply Chargeback.”
- the action “Send Notification” sends a notification to Tim, Tim's manager, or both to inform them that the reserved resource is being under-utilized and that they may want to consider releasing at least some portion of the reserved resource so that the resource can be made available to other users.
- the action “Reclaim” reclaims at least a portion of the reserved resource so that the resource can be made available to other users.
- the action “Apply Chargeback” can be used to apply a charge to the user's department based on the reserved resources.
- the central management console application communicates or passes the selected action to an external system (e.g., resource utilization and tracking) for the external system to fulfill.
- Charts 822 provide a graphical summary of current resource utilization such as utilization of storage, virtual machines, or network bandwidth. Such resource utilization may be generated by resource utilization and tracking system 545 for display in the dashboard of the central management console system. As shown in FIG. 8 , there can be a first chart 835 A, second chart 835 B, and a third chart 835 C. It should be appreciated, however, that there can be any number of charts. In this example the charts are pie charts. However, there may instead or additionally be other types of charts such as bar charts, graphs (e.g., line graphs), and the like.
- first chart 835 A is a pie chart that summarizes utilization of storage.
- Chart 835 A includes first and second slices 840 and 845 , respectively.
- the first slice corresponds to the portion of total storage that is available or unreserved.
- the second slice corresponds to the portion of total storage that has been reserved. In this example, 60 percent of the organization's storage has been reserved and 40 percent is available (e.g., available for users to reserve).
- the second slice may be displayed using a first visual indicator to indicate that the reserved resource (e.g., storage) is being used efficiently.
- the second slice is shown unfilled to indicate the first visual indicator. If the reserved resource was being used inefficiently, the second slice may be displayed using a second visual indicator, different from the first visual indicator, to indicate that the reserved resource is being used inefficiently.
- FIG. 835 B which summarizes utilization of virtual machines.
- a third slice 850 corresponds to the portion of total virtual machines that are available.
- a fourth slice 855 corresponds to the portion of virtual machines that have been reserved.
- the fourth slice is displayed using the second visual indicator to indicate that the reserved resource (e.g., virtual machines) are being used inefficiently.
- the fourth slice is shown filled to indicate the second visual indicator. If the reserved resource was being used efficiently, the fourth slice would be displayed using the first visual indicator.
- Application execution map section 815 includes a user-selectable control 830 and an application execution map 835 .
- User-selectable control 830 permits the user (e.g., IT administrator John) to select an application to map.
- application execution map 837 is displayed showing the nodes or machines on which the selected application is executing.
- Application execution map 837 includes icons or symbols to represent first, second, and third nodes 862 A, B, and C, respectively, and first, second, and third communication links 863 A, B, and C, respectively, between the nodes.
- the map may further include a legend 865 , user controls 870 , node details section 875 , or combinations of these.
- the nodes represent the machines that are participating in executing the application.
- a participating node may include a server machine that is hosting or executing a component of the application or a client machine that is communicating with the server machine.
- the nodes are represented graphically as circles. It should be appreciated, however, that other icons, graphical objects, or shapes may instead be used such as squares, triangles, rectangles, stars, and so forth. Further, the map may include different icons or shapes. For example, an icon of a first type (e.g., circle) may represent a server that is hosting an application component. An icon of a second type (e.g., square), different from the first type, may represent a client computer that is making a request to the server, where the client computer does not have a monitoring agent installed.
- the communication links are represented as lines or bars extending from one node to another node. Displaying the communication links is optional and is not included in some embodiments.
- User controls section 870 provides one or more user controls for controlling the information displayed on the application execution map. Examples of user controls include dropdown lists, filters, radio buttons, check boxes, buttons, and the like. There can be controls for zooming in and out, panning, or both. There can be a communications link toggle control that allows the user to toggle the display of the communication links, i.e., to show or hide the communication links. As a specific example, there may be a filter. The filter can be used to show or hide specific nodes. Filtering may be based on an IP address associated with a node, type of node (e.g., server node versus client node), or both.
- a map containing a large number of nodes may be displayed using aggregation on some nodes, and allowing the user to expand the parts that are of interest. For example, all nodes participating in an application that live in a given data center could initially be represented as a single node on the application map, and when/if the user chooses to, expanded to show individual nodes (aggregation could be explicit by configuration for some IP address ranges or done automatically by common network address prefix, for example same first 3 bytes of an IPv4 address). Aggregation could be triggered if the application map is large enough, so that small maps are displayed node by node.
- a user may select dynamically what to display or not on the map. For example, as discussed above, seeing all client nodes might or might not be of interest, so this is something that the user can easily trigger on/off or toggle.
- application nodes may be typed (e.g., “client” being different than “server” or “DB,” etc).
- Some nodes may be displayed on the map even if they are not currently participating, for example a database known to be accessed by the application (even if it was not recently accessed by the application). Thus, some nodes might have a special status such as “display when not part of the application” that is configurable at the node agent level or at the application or map level.
- Node details section 875 can provide details about a specific node or machine that is participating in executing the application.
- the details can include configuration information, operating system version, memory usage, processor usage, disk space or disk usage, or any computer parameter or combination of parameters.
- a detail such as memory usage may be displayed in a graphical form such as via a bar chart or pie chart.
- the application execution map may be an interactive map.
- the user may be able to select via a pointing device a particular node and the details about the particular node will be displayed in the node details section.
- the node details section may be implemented as a pop-up dialog box, as a window separate from the window displaying the application execution map, or as a frame within the window displaying the application execution map.
- Application execution mapping is further described below in the discussion accompanying FIGS. 13-22 and in U.S. patent application No. 13/245,390 which is incorporated by reference.
- Sections 810 and 815 shown on dashboard 805 are merely examples of some of the information that may be included on a dashboard of the management console system. It should be appreciated that a dashboard may instead or additionally include other sections such as a notifications section.
- the notifications section can display a list of resource reservation requests for the IT administrator to review.
- FIG. 9 shows an environment in which system 545 as shown in FIG. 5 may be implemented.
- System 545 may be referred to as a rent-a-cloud service through which resource utilization and tracking is provided to central management console system 505 .
- FIG. 9 there is an organization 905 having cloud computing resources 910 .
- the resources are managed by one or more resource providing groups 915 and are available for use by one or more resource consuming groups 920 .
- Cloud computing can be used to describe a delivery model for information technology (IT) services.
- Cloud computing can provide network access to a shared pool of computing resources which can be hardware resources, software resources, or both. More particularly, cloud computing resources can include processing 925 (e.g., CPU processing), storage 930 , memory 935 , and virtual machines 940 . Other examples of resources include network bandwidth, services, software, or application programs—just to name a few examples.
- Physical resources such as processors, storage, and memory can be combined via virtualization software to form a virtual machine (VM).
- a virtual machine is a software implementation of a physical machine (i.e., a computer) that executes programs like a physical machine.
- a virtual machine is a software abstraction of a physical computer system that is installed as a “guest” on a “host” hardware platform.
- a resource represents a logical object that is capable of providing to the user some IT functions, such as computing and storage.
- a resource is a virtual machine that can provide to the user some capabilities such as computing and storage.
- such resources are typically provided or managed by an IT department 945 .
- the IT department may be responsible for purchasing or leasing additional resources as needed, such as from external third parties 947 , configuring the resources, and providing the resources to other departments in the organization such as operations 950 , research and development (R&D) 955 , and finance 960 .
- a system and technique for a self-service model through which a user in a group (e.g., R&D group) requests or applies for use of IT or cloud computing resources.
- Some benefits of the model include standardizing the process for requesting and authorizing IT services, improved efficiency and quality of IT services, simplified user operations, and an improved user experience.
- a system and technique is provided for utilization notifications and a “pay for what you use” billing feature which can reduce resource waste and save the organization money.
- a resource rental component that supports an authorization process and enables the end-user to rent IT resources online easily, an end-user resource utilization tracking component that crosses the elastic cloud environment, a policy-based notification component to identify a potential resource as a reclaim target, and a “pay for what you use” feature to enable IT as service charge back.
- FIG. 10 shows a block diagram of components of an IT resource rental and utilization tracking system 1005 .
- This system may include several components, subcomponents, subsystems, or modules.
- the system includes an infrastructure or computing resources 1010 , resource application and delivery 1015 , resource utilization tracking 1020 , human resources (HR) 1025 , tenant management 1030 , tenant resource tracking 1035 , billing and charging 1040 , policy-based waste notification 1045 , and a presentation layer 1050 through which users, employees, managers, or groups such as tenants 1055 , department IT administrators 1060 , and corporate IT administrators 1065 may interact with the system.
- Arrows between the various components indicate communications or exchanges of information between the components.
- these components are internal to the utilization tracking and notification of cloud resources system.
- one or more of the components are external to the system.
- the system may interface, such as via an API, with an external HR system, an external billing and charging system, and so forth.
- IT infrastructure 1010 provides IT services for supporting the various users, groups, departments, or business units of an organization such as corporate operation, R&D, finance, etc.
- the IT system may be built on a hybrid cloud that leverages capabilities of both a private cloud and public cloud.
- a public cloud can refer to cloud infrastructure that is made available to the general public or a large industry group.
- the cloud infrastructure may be owned by an organization selling cloud services.
- a private cloud can refer to a cloud infrastructure that is operated solely for an organization. It may be managed by the organization or a third party and may exist on premise or off premise.
- a hybrid cloud may refer to a cloud infrastructure that is a composition or combination of two or more clouds (e.g., private or public) that remain unique entities but are bound together by standardized or proprietary technology that enables data and application portability (e.g., cloud bursting for load balancing between clouds).
- the IT infrastructure may include computing resources such as that shown in FIG. 9 and described in the discussion above accompanying FIG. 9 .
- Resource application and delivery 1015 includes an IT application by which an employee can apply for IT resources (e.g., computing or cloud computing resources).
- the application includes a configurable authentication process or a configurable approval process workflow to authorize use of the resources.
- a process for an employee to apply for or request a resource such as a virtual machine may include: 1) Employee initializes a resource to apply for an application. 2) The employee's manager is asked to approve. 3) The department IT administrator checks the available resources and delivers resource.
- an employee requests computing resources by completing an application or request.
- the system forwards the request to the employee's manager or supervisor.
- resource application and delivery 1015 may exchange information with HR 1025 to identify the employee's manager.
- the system forwards the request to an IT administrator.
- the IT administrator can use the system to check whether or not the resource is available for the employee. If the resource is available, the IT administrator can use the system to allocate the resource to the employee such as indicating that the resource has been assigned or reserved for the employee.
- Resource utilization tracking 1020 collects the utilization data from the IT infrastructure (e.g., corporate IT infrastructure) for the resources. In a specific implementation, the data is used to calculate one or more utility ratios, such as a utility ratio of CPU utilization, of storage utilization, or both. In a specific implementation, resource utilization tracking 1020 can monitor usage of the allocated resource and calculate metrics to measure how efficiently the allocated resources are being used.
- IT infrastructure e.g., corporate IT infrastructure
- utility ratios such as a utility ratio of CPU utilization, of storage utilization, or both.
- resource utilization tracking 1020 can monitor usage of the allocated resource and calculate metrics to measure how efficiently the allocated resources are being used.
- HR system 1025 maintains the employment hierarchy of the corporation, such as employee A belongs to department B and employee A's manager is employee C.
- Tenant management 1030 manages an inventory for recording the resource allocation information. By this system, people can be aware of who is occupying what resources.
- Tenant resource tracking 1035 provides a utilization summary of resources that were allocated to a tenant.
- Billing and charging 1040 may be based on a “pay for resources” charging strategy. The system can charge a tenant by the allocated resources.
- Policy-based waste notification 1045 enables people (e.g., users, employees, or managers) to receive notification when there may be waste of a resource or some potential waste happened.
- the notification may be based on a configurable trigger policy. For example a department manager will receive an email from the system when the utility ratio of some resource is lower than a threshold in his department. The notification may show an amount of money the wasted resource cost.
- Presentation layer 1050 provides techniques for interacting with the end-user, for example email delivery, a GUI application, and any program interfaces.
- FIG. 11 shows an overall flow diagram 1105 for resource rental and utilization tracking.
- the system displays an online form or Web page for a user to request rental of computing resources.
- the request is received and routed for approval (step 1115 ). If the request is approved (step 1120 ), computing resources are allocated to the user (step 1130 ).
- the system monitors usage of the resource.
- the system may apply a chargeback of the resources.
- the system provides usage statistics.
- the system determines whether usage of the resource has fallen below a threshold level. If usage has fallen below the threshold level, the system may generate an alert (step 1145 ), reclaim the resource (step 1150 ), or both.
- an online form or Web page is displayed to the user through presentation layer 1050 ( FIG. 10 ) of the system so that the user can make a resource request.
- the form may include any number of various sections and input boxes for the user to input information.
- the header section may include input boxes or fields for the user's name, contact information (e.g., phone number, or e-mail address), location (e.g., building number, or office location), department (e.g., R&D), supervisor, and so forth.
- Some of the information may be pre-populated. For example, there may be a login or authentication process where the user enters a username and password. Based on the username, HR system 1025 ( FIG. 10 ) may be consulted to determine the user's department, supervisor, and so forth.
- the resource detail section allows the user to specify the resources to rent. For example, there can be input fields to request a certain number of virtual machines, an amount of storage capacity, memory, processing units or time or CPU capacity or cycles, specific instances, specific configurations, bandwidth or network bandwidth (e.g., 10 Gigabit Ethernet), platform type (e.g., 32-bit versus 64-bit platform), an amount of data transfer (e.g., 1 million input and outputs), and the like.
- the resource detail section includes a field to specify a time, time period, or duration during which the user expects to use the resources.
- the user may request a reservation of 50 virtual machines for the period beginning Oct. 7, 2011 to Mar. 7, 2012; 750 gigabytes of storage for the period beginning Sep. 9, 2011 to Apr. 15, 2012; and so forth.
- a user is not required to specify a reservation time period or the time period may be open-ended.
- the user may request 75 virtual machines for an indefinite period of time.
- the resource request form may include various GUI controls such as dropdown lists, radio buttons, text boxes, buttons, check boxes, and the like.
- the user can click a submit button to submit the request to the system.
- the system receives and routes the request for approval.
- HR system 1025 may be consulted to identify the user's manager or supervisor.
- the system then routes the request to the user's supervisor for approval.
- the approved request may be forwarded to the IT administrator.
- this is merely one example of an approval process.
- There can be multiple levels of approval and multiple people who participate in the approval process. For example, if a large amount of resources is requested, multiple people such as directors, vice presidents, and so forth may be involved in the approval process.
- there is a workflow builder tool that allows an administrator user to specify the approval workflow process. This allows the approval process to be user-configurable to suit the specific procedures and protocols of the organization.
- computing resources are allocated to the user.
- the amount of allocated computing resources may be the same or different from what the user requested. For example, if the user requested 50 virtual machines, but the IT department is unable to provide 50 virtual machines then the user may be allocated a reduced amount of resources (e.g., 40 virtual machines).
- Resource application and delivery 1015 provides an interface through which an IT administrator can allocate or reserve a portion of the computing resources to the requesting user.
- the IT administrator can indicate that 50 virtual machines have been allocated to user A for a particular time period. That is, the administrator may associate the virtual machines with user A for the particular time period. The 50 virtual machines are thus indicated as having been reserved for user A for the particular time period so that they will be unavailable for other users, but available for user A.
- the system can automatically make the associations based on an approved resource rental request.
- the system maintains a record, such as stored in a database, that includes an identification of the user, the portion of computing resources allocated to the user, and a time period for which the portion of computing resources have been reserved.
- a record may be referred to as a reservation. Table A below shows an example of such a record.
- step 1135 the system monitors usage of the allocated resources. Such monitoring can allow the system to apply a chargeback (step 1155 ), provide usage statistics (step 1160 ), determine whether usage has fallen below a threshold level (step 1140 ), or combinations of these.
- monitoring may include analyzing used and available disk space or virtual machines, detecting whether or not a virtual machine has been powered on, determining a number of times a virtual machine has been powered on, detecting whether or not a datastore has been accessed, determining a number of times a datastore has been accessed, measuring the amount of outgoing bandwidth, amount of incoming bandwidth, processing time, the number of requests (e.g., HTTP and HTTPS requests), database calls, and so forth.
- requests e.g., HTTP and HTTPS requests
- a chargeback is an accounting technique that applies the costs of computing resources (e.g., services, hardware, or software) to the business unit that requested the resources.
- a chargeback helps to identify which departments, individuals, or both are responsible for the expenses. This can encourage departments and individuals to make efficient use of resources and in turn can lead to greater profitability of the organization.
- the chargeback is based on a “pay for what you use” policy. For example, if the user used 30 virtual machines, the user (or the user's department) would be charged for 30 virtual machines.
- the chargeback is based on a “pay for what you reserved” policy.
- the user is charged for the resources that the user reserved, even if the user did not use all of the reserved resources. For example, if the user reserved 50 virtual machines, but used 30 virtual machines, the user would be charged for the 50 virtual machines.
- the chargeback is based on a “pay for what you reserved, but did not use” policy. In other words, in this specific implementation, users are not charged for what they used. Rather, in this specific implementation, they are charged for what they did not use. These techniques can be used to help promote the efficient use of resources. Users are encouraged to carefully consider their resource needs because there may be consequences for unused resources.
- the system provides usage statistics such as via dashboard 805 as shown in FIG. 8 . Some examples of usage statistics include amount of storage used, number of virtual machines used, and so forth.
- the system analyzes usage of the allocated resources to determine whether usage has fallen below a threshold or resource utilization level. As shown by a loop 1141 , the system may continuously monitor usage of the resource throughout the resource reservation period, continuously monitor usage of the resource throughout a portion of the resource reservation period, or make regular periodic or random checks of resource usage during the resource reservation period. If the usage has fallen below the threshold level, the system generates an alert (step 1145 ), reclaims the resource (step 1150 ), or both. Usage of a resource that falls below the threshold level may indicate that an allocated resource is not being used efficiently. Thus, the resource may be reclaimed, a portion of the resource may be reclaimed, a duration of time that the resource is reserved for may be reduced or shortened, or combinations of these so that the resource can be made available for other users.
- the threshold level is user-configurable.
- the threshold-level may be implemented as a user-configurable policy.
- An organization may mandate a certain level of resource utilization when resources are allocated to or reserved for use by various departments.
- FIG. 12 there is a flow 1205 for calculating resource utilization.
- the system obtains an amount of resources allocated (or reserved) for the user.
- the system obtains an amount of resources used by the user.
- the system calculates a ratio based on the amount of resources allocated and the amount of resources used. The ratio may be referred to as a utilization ratio.
- resource utilization is calculated as a ratio of resources used to resources allocated.
- resource utilization is calculated as a ratio of resources allocated to resources used.
- any computation may be used to provide an index indicating how efficiently a resource is being used.
- Such a computation may involve addition, subtraction, division, multiplication, or combinations of these.
- a computation may include values corresponding to an amount of resources allocated, an amount of resources used, an amount of resource not used, or combinations of these.
- a resource usage calculation may include a statistical measurement such as an average, arithmetic mean, weighted mean, median, mode, standard deviation, range, or combinations of these.
- a first resource type may be measured against a first threshold.
- Usage of a second resource type may be measured against a second threshold.
- the first and second thresholds may be the same or different.
- the first resource type may be storage and the organization may set a policy that there be 80 percent utilization of allocated storage.
- the second resource type may be virtual machines and the organization may set a policy that there be 70 percent utilization of allocated virtual machines.
- Having different utilization thresholds based on resource type can reflect the different costs of different resource types. For example, if a first type of resource is more expensive than a second type of resource, the organization may impose a higher utilization requirement for the first type of resource than the second type of resource to reflect the added costs of the more expensive resource (i.e., first type of resource). This can help encourage users to be especially aware and carefully estimate their needs when reserving a specific type of resource.
- the system determines whether resource utilization is under a threshold for a period of time, and if so, generates an alert.
- the system periodically samples or calculates a set of usage values indicating usage of the resource. For example, a first usage value indicates usage of the resource at a first time during the sampling time period.
- a second usage value indicates usage of the resource at a second time during the sampling time period.
- a third usage value indicates usage of the resource at a third time during the sampling time period, and so forth.
- the sampling may be performed randomly or at regular times.
- the system if a number of times a usage value falls below a threshold value exceeds a threshold number of times, the system generates an alert.
- the sampling time period may be a rolling time period.
- an alert is generated if a usage value falls below a threshold usage value more than a threshold number of times in a rolling time period.
- the system makes a prediction of the amount of resources expected to be used, and compares the prediction with the allocated amount of resources or a percentage of the allocated amount. If the prediction is less than the allocated amount or less than a percentage of the allocated amount, the system generates an alert.
- the prediction may be based on factors such as a resource usage rate. For example, if based on a current resource usage rate the user is unlikely to use all of their allocated resource, the amount of allocated resource may be reduced, a time period for which the resource has been reserved may be reduced, or both.
- a prediction may instead or additionally be based on a user profile history indicating whether or not the user tends to over or under estimate their use of resources.
- threshold levels may be user-based or calculated dynamically to account for differences in how individual users tend to estimate their use of resources.
- a prediction may be calculated using inferential statistics and may include hypothesis testing, estimation, correlation, extrapolation, interpolation, modeling (e.g., regression analysis), or combinations of these.
- the system may generate an alert or notification to indicate that usage has fallen below a threshold level.
- the alert may include an e-mail, text message, phone call, instant message, dashboard notification, or combinations of these.
- the system transmits the alert to the user's manager or department manager.
- the workflow for sending an alert can be configurable so that an alert may instead or additionally be sent to the user, an IT administrator, or both.
- the alert is not generated if usage is above the threshold level. Not generating the alert can help to prevent, for example, the IT administrator from becoming bombarded with notifications.
- the alert is generated if usage is above the threshold level. Generating such an alert can provide confirmation that the resource is being efficiently used.
- the alert includes an indication of the amount of money the wasted resource cost.
- An alert may include a currency amount (e.g., a dollar figure) representing the difference between a first value corresponding to an amount associated with complete use of the resource and a second value corresponding to an amount associated with actual or predicted use of the resource.
- An alert may instead or additionally include the utilization ratio.
- an alert is transmitted to the user for which the resources were reserved.
- the alert includes a question asking whether or not the user still needs the resource.
- the user may be able indicate their response to the question and transmit the response back to the system.
- the system may or may not reclaim the resource or a portion of the resource. For example, if the user indicates they still need the resource, the system may not reclaim the resource. If the user indicates they no longer need the resource, the system may reclaim the resource.
- the system determines whether usage falls below a threshold level such as whether usage is less than the threshold level, or less than or equal to the threshold level. In other specific implementations, however, the system may determine whether lack of usage or non-usage rises above a threshold level. When lack of usage or non-usage rises above the threshold level, the system may send an alert, reclaim the resource, or both.
- a resource that is being inefficiently used may be reclaimed so that the resource can be made available for other users.
- a virtual machine that has not been powered-on for several weeks may be reclaimed so that the virtual machine can be made available for another user.
- a datastore where only 10 percent is being used may be reclaimed so that the datastore or a portion of the datastore can be made available for another user.
- reclaiming a resource includes reducing an amount of a resource allocated or reserved to a user.
- the resource is reduced to an amount equal or about equal to a threshold utilization ratio.
- a threshold utilization ratio 80 percent for virtual machines (VMs)
- VMs virtual machines
- the system may determine that each of the 40 VMs may not have been powered on during a time period in which the machines were intended to be used by the user (e.g., marked as reserved for the user).
- a resource may include virtual machines where U virtual machines have been allocated to the user.
- the system can determine that V virtual machines are not being used. For example, each of the V virtual machines may not have been powered on during a time period in which the virtual machines were intended to be used by the user (e.g., marked as reserved for the user).
- the number of VMs allocated to the user is reduced to a number W.
- W is a number greater than Y and less than U.
- W is equal to Y.
- the system can update the stored resource reservation records to indicate the new resource allocations.
- Table B shows an example of a resource reservation record from Table A having been updated as a result of reclaiming a resource.
- reclaiming a resource includes reducing an amount of time for which the resource has been allocated to a user.
- a resource may have been allocated to a user for the user to use during a first time period. The system determines that usage of the resource has fallen below a threshold level. A duration of the first time period is reduced to a second time period. That is, a duration of the second time period is less than a duration of the first time period. An ending date of the second time period is before an ending date of the first time period. Upon expiration of the second time period, the resource is made available for other users.
- reclaiming a resource includes reducing an amount of time for which the resource has been allocated to a user, and reducing an amount of the resource allocated to the user.
- an IT resource rental and tracking system for handling resource requests in a standard and automatic way and tracking the resource utilization for intelligent data analysis.
- the system components include (1) process management of IT resource application authorization; (2) an automatic IT resource delivery component; (3) an IT resource utilization dashboard; and (4) a notification system.
- an authorization process may include (a) Employee fills out an application online. Through the online application, the employee may specify details such as resource, rental period, and so forth; (b) Department manager approves; (c) Lab manager approves.
- the system can automatically assign a proper IT resource based on the employee's resource requirements.
- the IT administrator can have a clear overview about how many resources are occupied by a user, department, or business unit as well as resource utilization.
- the system can notify the renter (e.g., employee), administrator, or both. When the system finds that a resource utilization is under a threshold for a period of time, the system can notify the administer, employee, or both.
- a notification to the employee may include a question to ask the employee whether or not he or she still needs the resource.
- Some benefits of the rent-a-cloud service can include (1) Providing a standard and automatic process to address resource requests. Simplifying operations for the resource requester and IT administrator and making resource tracking possible; (2) Reducing waste and saving investment of IT infrastructure; and (3) Providing a pay for utilization solution to enable IT as a service charge system in a company's private cloud environment.
- resources can be associated with people.
- an IT administrator of a department may know the current status of resources allocated to his department, but he may not know the current status of resources allocated to a tenant of department.
- this solution gives users a chance to reevaluate their real IT needs.
- a feature includes potential waste identification.
- people can identify the potential resource waste easier. For example, there may be many IT resources are “sleeping” or not being efficiently used on the user side. However, the IT department may not be aware of such inefficient use and may purchase additional IT equipments. Through the notification, the tenant, IT department, or both can release the over-applied resource and reduce IT cost promptly. Further, corporate IT administrators can identify the potential waste, then take some necessary actions.
- a feature provides cost awareness. This solution helps the user keep in mind that IT resources are not without cost. The user, or the user's department, has to pay for what they applied. By doing this, the user will be encouraged to use the IT resource very carefully and use what they actually need.
- system is also applicable to any type of shared resource where it is desirable to help prevent resource waste. Aspects of the system may be applied to healthcare, manufacturing, financial services, government, and many others.
- FIGS. 13-19 show various embodiments for providing an application execution map to central management console system 505 ( FIG. 5 ). More particularly, FIG. 13 shows a simplified block diagram of system 540 for mapping the execution of an application such as a distributed application 1310 .
- This system includes monitoring agents 1315 and a mapping system 1320 .
- the monitoring agents monitor the distributed application and transmit the monitored data to the mapping system.
- the mapping system builds and displays a map showing the computing nodes that are participating in executing the application.
- a modern application uses or is composed of web applications, specialized servers, databases, content servers, and so forth running on multiple physical machines, virtual machines, or both distributed across one or more data centers or in private or public clouds.
- Clients 1325 connecting to the application may use yet another potentially large set of machines that may de facto participate in the application or execution of the application.
- An example of a distributed application is EMC Documentum provided by EMC Corporation of Hopkinton, Mass.
- a distributed application utilizes the resources of multiple machines or at least multiple process spaces, by separating the application functionality into groups of tasks that can be deployed in a wide variety of configurations.
- a distributed application is divided up into three or more tiers. Components in each of these perform a specific type of processing.
- Each tier may include multiple computing systems for scaling and a server load balancer may be used to balance the load across the multiple computing systems.
- a feature of the invention provides a dynamic execution map of an application or distributed application.
- the map may include the participating machines (be they local or in the cloud), the communication links between the machines, other information (e.g., communication volumes and profile, machine load, etc.), or combinations of these.
- the map is updated in “real time” or near real-time as machines come and go. Given that dynamism is at the foundation of cloud computing, it is generally not possible to statically provide such a map.
- a monitoring agent is deployed, loaded, or installed onto a computing machine (e.g., server) which executes a component of the distributed application ( FIG. 14 ).
- a monitoring agent is embodied as a code module that is integrated with the distributed application ( FIG. 15 ).
- a monitoring agent is implemented as a sniffer or network sniffer ( FIG. 16 ).
- FIG. 14 shows a block diagram of a specific implementation where monitoring agents are programs on servers on which various components of a distributed application 1405 may be executing.
- the distributed application includes application components A and B executing on hardware platforms 1410 A and 1410 B.
- a network connects the hardware platforms.
- a monitoring agent 1415 A on hardware platform 1410 A monitors the execution of application component A and reports or transmits information about the execution to mapping system 1320 .
- a monitoring agent 1415 B on hardware platform 1410 B monitors the execution of application component B and reports or transmits information about the execution to mapping system 1320 .
- the mapping system aggregates the reported information to build and display an application execution map on dashboard 805 as discussed in this application.
- the monitoring agents are programs that are separate from the distributed application.
- the distributed application may execute independently of the monitoring agents.
- the monitoring agents may be loaded into memory of the hardware platform before the distributed application is executed on the hardware platform.
- the monitoring agents may be installed after the distributed application is executing so that the execution can then be monitored.
- FIG. 15 shows a block diagram of another specific implementation where a monitoring agent 1505 is implemented as a piece of code that is integrated with a distributed application 1510 . That is, the monitoring agent is implemented as an integrated application module or code module within the distributed application. This configuration of the monitoring agent may be referred to as application instrumentation.
- the monitoring agent can be executing (integrated into the application) on each node on which the application is running.
- This monitoring infrastructure (the agents in cooperation with the mapping system) can be used to aggregate general application activity.
- the application through the monitoring agent is designed to report on its execution state.
- the application may include an application programming interface (API) which a monitoring service at a remote server can communicate with to determine whether or not the application is executing and where the application is executing. That is, the application may be written with a piece of code or code module to help monitor what the application is doing and report that information.
- API application programming interface
- having one agent per application node may be simpler for the application developer to integrate.
- FIG. 16 shows a block diagram of another specific implementation where a monitoring agent 1605 is implemented as or within a sniffer or network sniffer 1610 .
- the sniffer may be used for detecting communication links.
- a sniffer may be implemented as hardware, software, or a combination of hardware and software.
- the sniffer can analyze traffic flowing into and out of a computer system. As data streams flow across the network, the sniffer can capture each packet and decode the packet's raw data to determine the values of various fields in the packet. The sniffer can report on network activities related to the application being monitored.
- monitoring agent configurations shown in FIGS. 14-16 may be implemented in any combination.
- monitoring agents are configured as shown in FIGS. 14 and 15 .
- Monitoring agents are configured as shown in FIGS. 14 and 16 .
- Monitoring agents are configured as shown in FIGS. 15 and 16 .
- FIG. 17 shows a block diagram of another specific implementation of a monitoring agent configuration.
- a monitoring agent 1705 is configured as an application program that is separate from a distributed application 1710 .
- a monitoring agent 1715 is configured as integrated with the distributed application.
- a monitoring agent 1720 is configured as a sniffer 1725 .
- FIGS. 14-17 The various monitoring agent configurations shown in FIGS. 14-17 and discussed above are designed to address the different scenarios or environments in which a system for building an application execution map may be implemented.
- application instrumentation is desirable to monitor an application when the application code is controlled, as the instrumentation will work in most or all environments (no requirements from the hosting infrastructure).
- Application instrumentation may be difficult if the application is provided by a third party and does not include provisions for instrumentation (e.g., legacy code).
- Network sniffing or a separate monitoring agent installed on a machine can be provided on an execution environment (for example by a cloud provider) without having to impose any constraint on the executing applications.
- Network sniffing may be difficult on non-diffusion networks. For example a node in a virtual private network (VPN) usually cannot see the network traffic of other nodes, while a node on an Ethernet cable can see the traffic of the neighbors.
- Network sniffing may be difficult if there are insufficient access rights on a machine which may prevent the sniffer or monitoring agent from looking at network activity of other nodes. In some environments or separate running processes, it may be difficult to install a monitoring agent as a separate program on a machine.
- VPN virtual private network
- FIG. 18 shows a more detailed block diagram of application execution mapping system 540 shown in FIGS. 5 and 13 .
- a set of data centers 1805 having network computing systems 1807 on which a distributed application may be executed.
- monitoring agents configured as an application program separate from the distributed application (e.g., monitoring agent 1875 A), configured as network sniffers 1810 , configured as integrated code modules 1812 with the distributed application, or combinations of these.
- clients 1815 and a central collection server 1820 includes an aggregation program 1822 and an application execution mapping tool 1823 of the mapping system.
- a database 1857 for storing application execution data collected by the various monitoring agents is coupled to the central collection server.
- a network 1825 is coupled between the data centers, clients, and central collection server.
- a data center is a facility used to house computer systems.
- a data center can occupy one room of a building, one or more floors, or an entire building.
- a data center may be remote from another data center. For example, a distance between two data centers may range from about several hundred meters to many thousands of kilometers.
- a data center, such as a data center 1830 may include any number of network computer systems such as servers which are typically mounted in rack cabinets. In the example shown in FIG. 18 , data center 1830 includes network computer systems 1835 A-C.
- the computer system such as computer system 1835 A, includes a physical hardware platform 1840 A having one or more components such as that shown in FIGS. 2-3 .
- the hardware platform may include a user interface, one or more processors, a network interface, mass storage, and memory.
- some embodiments may not include the user interface or the user interface may not be connected directly to the hardware platform. For example, user interaction may be automated or occur remotely.
- a computer system may (or may not) be configured with a set of virtual machines 1837 .
- computer system 1835 A includes a virtual machine 1845 A which provides an environment for hosting applications.
- the virtual machine can include a guest operating system 1850 , guest applications running on the guest operating system, and virtual resources 1855 including virtual hardware 1860 and virtual disks 1865 .
- the virtual resources refer to the resources allocated to the virtual machine and are mapped to the hardware platform.
- the virtual resources may further include virtual processors, virtual system memory, and various virtual devices.
- a distributed application may include any number of application components such as first, second, and third application components A, B, and C, respectively.
- first application component A of the distributed application is executing on machine or virtual machine 1845 A.
- Second application component B is executing on a different machine or virtual machine 1845 B.
- Third application component C is executing on a machine 1835 C that does not include a virtual machine.
- the application components may be executing simultaneously or concurrently on the respective machines.
- a physical or virtual machine that is executing an application or component of an application may be referred to as a participating machine or node.
- FIG. 18 is merely one example of how a distributed application may be executing.
- Components, portions, modules, subsystems, processes, or parts of a distributed application may be executing on different virtual machines on the same computing system or hardware platform, different physical machines in the same or different data center, and so forth.
- One component of a distributed application may be executing on a virtual machine and another component of the distributed application may be executing on a physical machine or not within a virtual machine.
- One component of a distributed application may be executing within one data center and another component of the distributed application may be executing within another data center, remote from the one data center.
- One or more clients 1815 may be connected to the one or more machines which are executing the distributed application.
- a client may be sending requests (e.g., HTTP requests) for content and presenting the responses provided by the application system to a user.
- requests e.g., HTTP requests
- Such a client machine may also be referred to as a participating node.
- a dynamic execution map is built using information collected from network sniffers or network sniffing for detecting communication links (one sniffer per shared medium may be sufficient), a network monitoring agent on participating machines, application programming interface (API) and explicit application integration, log monitoring and data extraction, and the like, or combinations of these.
- a specific embodiment may include monitoring agents, network sniffers, and application code modules inserted into the application to monitor application execution.
- Another specific embodiment may include monitoring agents, but not network sniffers, application code modules, or both.
- Another specific embodiment may include network sniffers, but not monitoring agents, application code modules, or both.
- Another specific embodiment may include application code modules, but not monitoring agents, network sniffers, or both.
- a server receiving a connection from a client can have the client added to the application map.
- the client is not impacted.
- the mechanism is implemented through a distributed logging framework.
- a monitoring agent 1875 A can be distributed and installed on computer system 1835 A to detect when an application or a component of the application is executing.
- virtual machine 1845 A has been provisioned with monitoring agent 1875 A.
- computer system 1835 A is provisioned with a single instance of the monitoring agent where the agent is outside of the VM.
- the monitoring agent can identify on which virtual machine of computer system 1835 A that application component A is executing. Because such an agent is outside the VM, the agent may be collecting information similar to that of the sniffing monitoring agent such as network traffic. Instead or additionally, through an API or other collaboration with the VM vendor, the monitoring agent may discover application execution activities within the VM.
- the monitoring agent may run as a background application or process.
- the monitoring agent may use any technique or combination of techniques to detect when an application is executing.
- the monitoring agent may monitor log directories expected to be used by the application when the application is executing, check if a process having a name of the application executable is running, check the output of the operating system's tasklist to see if it contains the application process name, and so forth.
- FIG. 18 further shows a monitoring agent 1812 configured as a code module that is integrated with the distributed application, and a monitoring agent embodied as a network sniffer.
- mapping system 1320 ( FIG. 13 ) includes collection server 1820 , aggregation program 1822 , mapping tool 1823 , and a database 1857 to store data about application execution.
- Aggregation program 1822 at central collection server 1820 is responsible for aggregating the application execution data collected from the monitoring agents (e.g., monitoring agent programs, sniffers, and application code modules integrated with the application).
- the collected application data may be stored in database 1857 .
- Database 1857 may be a disk based database or an in memory database. An in memory database may be better suited to changing dynamic data.
- Application execution mapping tool 1823 retrieves the application data stored in the monitoring database and uses the information to build a map for management dashboard 805 that shows machines or nodes that are participating in executing the application.
- the map includes the communication links between the nodes, additional information (e.g., communication volumes and profile, machine load, etc.), or both.
- FIGS. 8 and 20-22 show some examples of application execution maps that may be created by the application execution mapping tool to show nodes or the location of nodes that are participating in execution of the distributed application.
- FIG. 19 shows an overall flow diagram 1905 for building an application execution map for dashboard 805 .
- application execution data identifying or indicating nodes participating in executing the application is collected from the various monitoring agents and stored.
- the application execution mapping tool analyzes the stored application execution data to determine which nodes are participating in execution of the application.
- the tool builds and displays a map showing the participating nodes.
- the tool may determine that a node previously participating in executing the application is no longer participating in executing the application, determine that a new node or a node not previously participating in executing the application is now participating in executing the application, or both.
- the tool updates the map.
- the monitoring agents e.g., monitoring agent programs, sniffers or integrated application modules
- the monitoring agents are explicitly told what they monitor (e.g., what is the application they are looking at, in addition of what to monitor on the system) and they can serve as “anchors” for the map.
- a monitoring agent receives a first instruction and a second instruction.
- the first instruction identifies one or more specific applications to be monitored.
- the second instruction identifies events, processes, or operations related to the specific application that should be monitored.
- monitoring agents 1875 A, 1810 sniffers
- an explicit code fragment 1812 included as part of the application or combinations of these that are each told that they are monitoring a specific application (a single or different applications).
- a map or multiple maps can be built by following all the links detected by the various agents and creating a graph of participating nodes.
- a transitive closure is used to create the map. Care is taken to not merge all applications into a single big application if a shared resource such as a database system is used by multiple applications.
- the graph is assigned to be the execution graph of the application or applications that are explicitly configured for some of the agents. For example, if the transitive closure contains somewhere an explicit sniffer configuration for application A, then it is a map for application A. If it contains both explicit configuration for application A and B, then it is a map for both.
- aggregation program 1822 aggregates, collects and stores application execution data.
- the application execution data is collected on a periodic basis such as at a specified time or at specified time intervals.
- the monitoring agent programs, sniffers, integrated application code modules, or combinations of these may be configured to automatically report or transmit application status information at a regular time or time interval to the central collection server.
- This allows the mapping tool to quickly build, on-demand, the application execution map because the data used to build the map will have already been previously collected and stored at the server. For example, when the mapping tool receives a request, such as from a user, for the application execution map to be displayed the map can be quickly constructed because there is no need to wait for the application execution data from the various nodes to traverse the network.
- the time interval at which application execution data is collected can range from about 1 second to about 30 seconds, from about 1 minute to about 30 minutes, from about 1 hour to about 6 hours, or from about 12 hours to about 24 hours.
- application execution data may be collected once every 30 seconds, once every 30 minutes, or once every hour. More frequent collections can provide a more accurate “real-time” map of where the application is executing.
- frequent transmissions of collected application execution data may potentially clog the network. So, generally, the frequency of collections, frequency of transmissions, or both will be based on factors such as desired mapping accuracy, available network bandwidth, and the like.
- An agent may collect at a high frequency (say machine load every minute) but send to the collection server at a lower frequency (every 10 minutes send the last 10 load measures). Having data collected frequently, but transmitted less frequently can provide a balance or compromise between having an accurate application execution map and helping to prevent network congestion.
- a monitoring agent may be configured to report application execution status when the agent detects that the application is executing and not report status when the application is not executing.
- the agent may be configured to report status even if the application is not executing. Receiving an actual confirmation that an application is not executing can help to ensure that the application execution map is accurately drawn.
- the application execution data is collected on an as-needed basis.
- the mapping tool in response to a user request to display the map, can send a request to the various monitoring agents to report application execution data.
- the displayed application execution map may include a refresh button that the user can click to refresh the map.
- Agents may use an aggregated technique for reporting their states (report to a local node that aggregates local messages then sends them to the main collection server or to another higher level aggregator). This can be useful for large networks to help prevent too high of a load on the collection server and for security reasons where some nodes do not directly have access to the “outside” world and need to explicitly pass through some form of gateway.
- Some specific examples of the type of application execution data that may be collected and stored in database 1857 include a machine or node identifier such as an address or Internet Protocol (IP) address of the node participating in executing the application, a timestamp indicating when the data was received, the type of network or communication link used or connected to the node (e.g., personal area network (PAN), local area network (LAN), wide area network (WAN), communication protocol, and the like), bandwidth usage, resource usage, or combinations of these.
- IP Internet Protocol
- Resource usage may include resources used by the executing application such as CPU usage, memory usage, disk space usage, communication volumes and profile, machine load, and the like.
- the collected data may include computer or node configuration information collected by a monitoring agent such as processor speed, processor details (e.g., processor manufacturer), memory capacity and memory details (e.g., type of RAM, available RAM), total disk space, free disk space, operating system, other applications that may be installed at the node, other applications at the node that are executing, and the like.
- processor speed processor details
- memory capacity and memory details e.g., type of RAM, available RAM
- total disk space e.g., free disk space, operating system, other applications that may be installed at the node, other applications at the node that are executing, and the like.
- monitoring agents report the connections between nodes participating in the application, so an agent can report the couples of nodes that are communicating (if the agent is bound to a specific node then the list of couples amounts to a list of external nodes with which the agent application node is communicating).
- the basic data for building the map can be extended with network throughput/usage or latency.
- explicit agents i.e., code added into the application or code executing on a node, but not network sniffing
- it is possible to report any value (key/value pairs) desired by the application developer accessible either in the application process or on the system where the agent is executing).
- the central collection server 1820 may aggregate values reported by multiple agents.
- the collected data may include several different data types.
- the basic collected data include node names or IP addresses which can be of a “graph” nature, and aggregating them includes building a map. Some numerical values, such as quantity of resources consumed, for example size of files stored, could be aggregated by adding them. Care is taken to report each consumed resource only once.
- Other data such as security certificates or login credentials may be aggregated, where aggregation includes eliminating non-unique values in order to get a list of unique security certificated/login credentials used by the application. As discussed, machine load and other data could be reported as well.
- machine load type of value may be aggregated, because application code may be moving around nodes and being executed in different places at different times (cloud computing), and the possibility of multiple agents reporting a given value is anticipated and dealt with correctly. For example, it can be desirable to add loads of different machines to get the total load, but it is generally not desirable to add the load of a given machine multiple times.
- an agent may check if the network connection with the given node is still open even if no data is exchanged.
- the mapping tool analyzes the collected application execution data to determine which nodes are participating in executing the application, identify the communication links between the nodes, or both. For example, the mapping tool may scan application execution database 1857 to identify those nodes that are participating in executing the application. As an example, consider Table C below which shows some of the information that may be collected and stored application execution database 1857 .
- Table C includes columns Node Address and Time.
- the Node Address column lists the IP address associated with the node.
- a monitoring agent at a node detects when the application is executing. Upon detecting the execution, the monitoring agent reports or transmits an IP address associated with the node to the central collection server.
- the Time column lists the time at which the server received the IP address from the reporting node. Alternatively, the time can be the time at which the monitoring agent detected the application execution.
- the tool compares the time with a current time.
- the tool may calculate a difference or absolute difference between the time and the current time. If the difference is within a pre-determined duration or threshold time or time window, the tool determines that the reporting node is participating in executing the application. For example, the difference may be less than the threshold duration. The difference may be less than or equal to the threshold duration. If the difference is outside the threshold duration the tool determines that the reporting node is not participating in executing the application. For example, the difference may be greater than the threshold duration. The difference may be greater than or equal to the threshold duration.
- the current time is 3:05 p.m. and the threshold time is 5 minutes.
- the threshold time is 5 minutes.
- the difference (103 minutes) is greater than the threshold time (5 minutes). So, the tool determines that the second reporting node having the IP address “66.102.1.44” is not a participating node.
- first, third, and fourth reporting nodes having the IP addresses “64.233.161.18,” “72.14.203.91,” and “209.85.129.18,” respectively, are determined to be participating nodes.
- Second and fifth reporting nodes having the IP addresses “66.102.1.44” and “216.239.37.19,” respectively, are determined to be non-participating nodes.
- a collection node or server may estimate the difference between each node's time and its reference time.
- each node might have a different time setting (e.g., wrong time set, wrong or different time zone and combinations of these). Relying on data reception time might not be sufficient, especially in the context of data aggregators and forwarding as discussed above.
- a monitoring agent such as a monitoring agent program on a server or reporting node, may be configured to report the time zone associated with the reporting node. This allows the collection node to account for a reporting node being in a different time zone than the collection node. Thus, the collection node can make the appropriate time adjustments when determining whether the reporting node is a participating or non-participating node.
- a reporting node may have been configured with the wrong time or the time set at a reporting node may not be according to the Coordinated Universal Time (UTC).
- UTC Coordinated Universal Time
- the system estimates the difference between actual time (the time at the collection server) and the time set on the node. That is, the collection node estimates the skew in clock settings at remote nodes (for all nodes).
- the mapping tool builds and displays a map identifying the location of the participating nodes.
- the map may further display the communication links between the participating nodes, other information such as resource usage information, or both.
- identifying which nodes are currently participating in an application is left as a user configuration in the mapping tool 1823 .
- the user selects the duration a node is still considered active after it has communicated with another application node.
- checking the status of the network connection can be used even when no network activity is detected.
- the time threshold for a node to be considered as part of the application can also depend on past history of the node. If a node has been often participating in the application (many communications detected in the past), its threshold can be increased as it is assumed it is most likely still participating though temporarily inactive. All these considerations can be combined with an “ageing” factor so the influence of a past event on the present diminishes as the time from the event increases.
- factors or attributes that may be used to determine whether a node is currently participating or not participating in executing an application may be based on time, the frequency of past participation, the frequency of recent past participation, or combinations of these.
- a factor may be weighted. For example, more recent participation may be weighted more heavily than less recent participation.
- a method to determine whether a node is participating in executing an application includes receiving a transmission from the node, the transmission being associated with a time.
- the time may be included with the transmission and may be the time of transmission from the node. Alternatively, the time may be the time the transmission is received.
- the method further includes calculating a difference between the time and a reference or current time. Comparing the difference with a user-configurable threshold duration. If the difference is less than the user-configurable threshold duration, determining that the node is participating in executing the application. If the difference is greater than the user-configurable threshold duration, determining that the node is not participating in executing the application.
- a method in another specific implementation, includes receiving first and second transmissions from first and second nodes, respectively.
- the first transmission is associated with a first time.
- the second transmission is associated with a second time.
- the method further includes calculating a first difference between the first time and a reference time. Comparing the first difference with a first threshold duration. If the first difference is less than the first threshold duration, determining that the first node is participating in executing the application. Calculating a second difference between the second time and the reference time. If the second difference is less than a second threshold duration, determining that the second node is participating in executing the application.
- the first threshold duration may be different from the second threshold duration.
- the first threshold duration is greater than the second threshold duration. If the first node has participated in executing the application a fewer number of times than the second node, the first threshold duration is less than the second threshold duration.
- a method to determine whether a node is currently participating in executing an application includes weighting one or more factors.
- a first factor is associated with receiving a transmission from the node, the transmission being associated with a time.
- a second factor is associated with a first frequency indicating a number of times the node previously participated in executing the application during a first time period.
- a third factor is associated with a second frequency indicating a number of times the node previously participated in executing the application during a second time period.
- a beginning time of the second time period is more recent than a beginning time of the first time period. In other words, the beginning time of the second time period is closer to a current time than the beginning time of the first time period.
- the third factor is weighted more heavily than the second factor to indicate that greater weight is given to more recent application execution participation as compared to less recent application execution participation.
- the first factor may be weighted more or less than the second factor, third factor, or both.
- determining “last time of activity” or similar reported by a node may include two separate determinations.
- a first determination may include determining the mapping into “current time” (i.e., time of the collection server) of a timestamp generated by a remote node. In other words, computing the time difference in order to express any timestamp in “collection server time.”
- a second determination may include determining based on “current time timestamps” if a node does belong or not to the application. The second determination may include a confidence evaluation applied to current time timestamps and may include ageing functions or other heuristics.
- the first determination may be solved in a more deterministic way, by estimating the time delta between nodes (repeatedly, as time set on nodes can change at any time).
- the error margin on the first determination may be combined into the heuristics of the second determination.
- a geographic location of the participating node is determined based on the IP address of the participating node.
- the mapping tool may use the IP address of the participating node to perform a look-up or a cross-reference against a location database listing IP addresses of computers and their known corresponding geographical locations.
- a geographical location may include information such as country, region, city, latitude, longitude, ZIP code, area code, county, state, time zone, street or postal address (e.g., address of the data center housing the computing node), or combinations of these.
- the location database may be supplied by an external third-party.
- the external third-party may provide an API that takes as input an IP address submitted by the mapping tool and returns to the mapping tool a geographical location.
- the system can store the geographical location so that the location can be available for future use.
- Geolocation for IP addresses can be available for public IP addresses.
- the location database may be internal to the system.
- a company may have a location database which stores a list of the company's host computer IP addresses and corresponding geographical locations.
- the application execution mapping tool can plot the location on a map and display the map on an electronic screen to a user.
- the map is updated in real-time or near real-time as nodes stop or start participating in executing the application. More particularly, in step 1825 , the application execution mapping tool determines that a node previously participating in executing the application is no longer participating in executing the application. For example, for a previous time period the node may have been participating in executing the application. However, for a current time period or a subsequent time period, i.e., a time period after the previous time period, a determination is made that the node is not participating in executing the application. The determination may be based on receiving information from the monitoring agent associated with the node indicating that the node is not participating in executing the application.
- the determination may be made based on not having received information from the monitoring agent associated with the node.
- a monitoring agent may be configured to report if application execution is detected and to not report if application execution is not detected.
- not having received information from the monitoring agent would indicate that the node is not participating in executing the application.
- step 1935 the system updates the map.
- updating the map includes removing the non-participating node from the map.
- the non-participating node is not visible on the updated map. That is, the non-participating node is omitted from the updated map.
- the map shows participating nodes and non-participating nodes are not shown, are omitted, are hidden, or are not visible.
- Omitting the non-participating nodes from the map can help to reduce clutter. For example, in some cases, there may be many nodes which can potentially participate in executing the application. Further, some of these nodes may be geographically very close to each other such as in the same data center. Thus, when the map is displayed non-participating nodes may be overlapping with participating nodes which can make it difficult to distinguish between non-participating nodes and participating nodes. Distinguishing among the different nodes can be especially difficult if the display screen is small or has a low resolution such as a smartphone or tablet screen.
- updating the map includes changing a visual indicator associated with the node to indicate that the node is not participating in executing the application.
- the non-participating node is visible on the updated map, but there is a visual indicator associated with the node to indicate that the node is not participating in executing the application.
- the visual indicator may be implemented as a shape (e.g., circle or square), icon, color (e.g., red or green), or combinations of these.
- a red indicator adjacent to the node may indicate that the node is not participating in executing the application.
- a green indicator may indicate that the node is participating in executing the application.
- a benefit of displaying both participating nodes and non-participating nodes is that it can give the user a complete picture of the nodes where the application could potentially be executing and the resources or other nodes that are potentially available for executing the application. This can be of assistance in, for example, load balancing, resource provisioning, and so forth.
- step 1930 tool determines that a node not previously participating in executing the application is now participating in executing the application.
- the node may be referred to a new node. For example, for a previous time period the node may have not been participating in executing the application. However, for the current or subsequent time period, a determination is made that the node is participating in executing the application. For example, the determination may be made based on receiving information from the monitoring agent associated with the node indicating that the node is participating in executing the application.
- step 1935 the system updates the map.
- updating the map includes adding the now participating node or new node to the map.
- the new node may not have been visible on the previous map, but is visible on the updated map.
- updating the map includes changing a visual indicator associated with the node to indicate that the node is now participating in executing the application.
- the node is visible on both the previous map and the current or updated map.
- the visual indicator associated with the node indicates that the node is not participating in executing the application.
- the visual indicator indicates that the node is participating in executing the application.
- a visual indicator may be displayed in the color red to indicate that the node is not participating in executing the application.
- the visual indicator may be displayed in the color green to indicate that the node is participating in executing the application.
- FIG. 20 shows a view of dashboard 805 from FIG. 8 where application execution map 837 has been updated.
- the system has determined that one of the nodes (e.g., third node 862 C) is no longer participating in executing the application.
- the third node is omitted or not visible on the updated application execution map.
- a “real-time” use as described in application there is a “real-time” use as described in application.
- the historical view includes an animated map of how an application behaved in the past such as in the past week. Arriving and departing nodes may be visually emphasized by, for example, points popping up and disappearing during the animation.
- the user controls section may include video controls such as play, forward, rewind, and stop buttons.
- a feature of the application execution map includes providing an animated application execution map. This allows the user to graphically see how the participating and non-participating nodes change over time. Such an application execution map may be referred to as an application execution motion chart.
- FIGS. 21-22 show another specific implementation of an application execution map 2105 within a dashboard.
- a visual indicator such as a color associated with a node is used to indicate whether or not a node is participating in executing an application.
- This specific implementation also shows an example where the communication links are hidden or not visible.
- first and second nodes 2110 A and 2110 B are displayed using a first color as indicated by the unfilled circles.
- a third node 2110 C is displayed using a second color, different from the first color, as indicated by the filled circle.
- the first color can indicate that the node is a participating node.
- the second color can indicate that the node is a non-participating node.
- FIG. 22 shows an example of the application execution map in FIG. 21 having been updated.
- the color of third node 2110 C has changed from the first color to the second color as indicated by the unfilled circle to indicate that third node 2110 C is now currently participating in executing the application.
- the map displayed to the user may graphically convey some of the information by using for example different colors for different “freshness” degrees of the information.
- an application execution map may include first and second nodes where each node has been determined to be participating in executing the application. Thus, both nodes are displayed in the same color. However, one of the nodes (e.g., first node) may be displayed in a different shade than the other node (e.g., second node) to indicate that the first node has been found to be participating in executing the application more recently than the second node. For example, the first node may be colored dark red and the second node may be colored light red.
- different colors are used as visual indicators to indicate whether or not a node is participating in executing the application. It should be appreciated, however, that anything that visually distinguishes one node from another node may be used. For example, whether or not a node is participating in executing the application may be indicated by a shape (e.g., square, box, rectangle, or circle), pattern (e.g., checkerboard, solid, or stripes), size, level of saturation (e.g., dark red or light red), color gradient, animation (e.g., nodes that blink are participating in executing the application and nodes that are not blinking or steady are not participating in executing the application), and so forth.
- a shape e.g., square, box, rectangle, or circle
- pattern e.g., checkerboard, solid, or stripes
- size e.g., level of saturation (e.g., dark red or light red)
- color gradient e.g., animation (e.g., nodes that blink are participating in executing the application and
- a type of visual indicator associated with a node may indicate a level of confidence related to whether the node is a participating or non-participating node (see above confidence rating discussion). For example, nodes displayed in green or represented as squares may indicate a high-degree of confidence that the nodes are participating nodes. Nodes displayed in red or represented as triangles may indicate a low-degree of confidence that the nodes are participating nodes.
- the application execution maps shown in FIGS. 8 and 20-22 may be referred to as abstract maps or graphs. Some nodes could have as additional data/attributes their geographical information when available. Such information may be shown through a “properties” dialog box or mouse over information.
- the application execution map is superimposed over a geographical map where the position or layout of the nodes correspond to their geographical locations. For example, an application execution map may be superimposed over a geographical map or outline of the United States, France, China, India, or a world map—just to name a few examples.
- the application execution map may be imposed over a building map or a campus map. For example, if the nodes are local to each other, such as in the same building, the application execution map may be superimposed over a building map.
- the building map may identify the different floors and rooms of a building.
- a geographic location of a node may be based on a particular floor, room, or both of a building.
- a campus map may identify the different buildings in which a node may be found.
- An application execution map can be useful for companies that develop and deliver complex systems and applications that involve a heavily distributed infrastructure, and companies that put a strong emphasis on Cloud computing.
- applications are increasingly distributed with a higher dynamism in the distribution (nodes being frequently added and removed from the system).
- complexity It is desirable that customers be assisted to reduce that perceived complexity.
- Historical monitoring data can also serve to understand how use patterns of a system change over time (how the system scales, when does the load appear, etc).
- the application execution mapping feature can provide a monitoring and mapping infrastructure that is easily integrated into existing systems and applications in the stacks being deployed.
- a company's systems and software can be updated to support the monitoring systems.
- a company's Cloud offering can also integrate such mechanisms (and offer related services) to simplify Cloud deployment for hosted 3rd party applications and make itself a preferred choice for Cloud deployment.
- Distributed application monitoring and mapping could be offered as a service and be itself hosted in the Cloud.
- An application execution mapping system may be deployed in a private cloud, public cloud, community cloud, or hybrid cloud.
- an application execution map is displayed within a cloud services management console which may further include information on cloud resource utilization.
- map usage is not limited to the cloud environment, and when an application executes inside and outside the cloud, the map can show all the nodes.
- implementation is done by network sniffing, installation of agents on participating machines, by application instrumentation, or combinations of these.
- the methods can be combined as different environments have different constraints of what is possible.
- a map centralization service can be offered in the cloud or elsewhere.
Abstract
Description
| TABLE A | ||||
| User | Allocated Resources | | ||
| Madeleine | ||||
| 60 virtual machines | Oct. 7, 2010-Apr. 1, 2011 | |||
| |
500 gigabytes | Oct. 30, 2010-Jun. 7, 2011 | ||
| TABLE B | ||||
| User | Allocated Resources | Time Period | ||
| Madeleine | 48 virtual machines | Oct. 7, 2010-Apr. 1, 2011 | ||
| Leah | 350 gigabytes | Oct. 30, 2010-Jun. 7, 2011 | ||
| TABLE C | |||
| Node Address | Time | ||
| 64.233.161.18 | 3:02 p.m. | ||
| 66.102.1.44 | 1:22 p.m. | ||
| 72.14.203.91 | 3:04 p.m. | ||
| 209.85.129.18 | 3:01 p.m. | ||
| 216.239.37.19 | 2:46 p.m. | ||
Claims (17)
Priority Applications (1)
| Application Number | Priority Date | Filing Date | Title |
|---|---|---|---|
| US13/247,505 US9497136B1 (en) | 2011-09-28 | 2011-09-28 | Method and system for providing usage metrics to manage utilzation of cloud computing resources |
Applications Claiming Priority (1)
| Application Number | Priority Date | Filing Date | Title |
|---|---|---|---|
| US13/247,505 US9497136B1 (en) | 2011-09-28 | 2011-09-28 | Method and system for providing usage metrics to manage utilzation of cloud computing resources |
Publications (1)
| Publication Number | Publication Date |
|---|---|
| US9497136B1 true US9497136B1 (en) | 2016-11-15 |
Family
ID=57235144
Family Applications (1)
| Application Number | Title | Priority Date | Filing Date |
|---|---|---|---|
| US13/247,505 Active 2032-07-03 US9497136B1 (en) | 2011-09-28 | 2011-09-28 | Method and system for providing usage metrics to manage utilzation of cloud computing resources |
Country Status (1)
| Country | Link |
|---|---|
| US (1) | US9497136B1 (en) |
Cited By (117)
| Publication number | Priority date | Publication date | Assignee | Title |
|---|---|---|---|---|
| US20130232254A1 (en) * | 2012-03-02 | 2013-09-05 | Computenext Inc. | Cloud resource utilization management |
| US20140047104A1 (en) * | 2012-08-13 | 2014-02-13 | Verisign, Inc. | Systems and Methods for Load Balancing Using Predictive Routing |
| US20150222548A1 (en) * | 2013-01-25 | 2015-08-06 | Concurix Corporation | Tracing with a Workload Distributor |
| US20160301585A1 (en) * | 2015-04-13 | 2016-10-13 | defend7, Inc. | Real-time tracking and visibility into application communications and component interactions |
| US20170006131A1 (en) * | 2015-06-30 | 2017-01-05 | SkyKick, Inc. | Managing users of cloud services with management tool |
| US9658936B2 (en) | 2013-02-12 | 2017-05-23 | Microsoft Technology Licensing, Llc | Optimization analysis using similar frequencies |
| US9665474B2 (en) | 2013-03-15 | 2017-05-30 | Microsoft Technology Licensing, Llc | Relationships derived from trace data |
| US20170255506A1 (en) * | 2016-03-07 | 2017-09-07 | Dell Software, Inc. | Monitoring, analyzing, and mapping of computing resources |
| US9767006B2 (en) | 2013-02-12 | 2017-09-19 | Microsoft Technology Licensing, Llc | Deploying trace objectives using cost analyses |
| US9772927B2 (en) | 2013-11-13 | 2017-09-26 | Microsoft Technology Licensing, Llc | User interface for selecting tracing origins for aggregating classes of trace data |
| US9804949B2 (en) | 2013-02-12 | 2017-10-31 | Microsoft Technology Licensing, Llc | Periodicity optimization in an automated tracing system |
| US20180004788A1 (en) * | 2012-10-31 | 2018-01-04 | International Business Machines Corporation | Management of memory usage using usage analytics |
| US9864672B2 (en) | 2013-09-04 | 2018-01-09 | Microsoft Technology Licensing, Llc | Module specific tracing in a shared module environment |
| EP3327991A1 (en) * | 2016-11-29 | 2018-05-30 | Alcatel Lucent | Storage of coverage-related information of a telecommunication network |
| US20180167450A1 (en) * | 2016-12-09 | 2018-06-14 | Cisco Technology, Inc. | Adaptive load balancing for application chains |
| US10089773B1 (en) | 2015-06-30 | 2018-10-02 | EMC IP Holding Company LLC | Animated array performance dashboard |
| US10177987B2 (en) * | 2016-07-18 | 2019-01-08 | Capital One Services, Llc | Cloud migration and maintenance controls |
| US10218813B2 (en) * | 2017-01-31 | 2019-02-26 | Salesforce.Com, Inc. | Automatic surge protection of system resources |
| US20190138288A1 (en) * | 2017-11-03 | 2019-05-09 | International Business Machines Corporation | Automatic creation of delivery pipelines |
| US10289440B2 (en) * | 2014-06-30 | 2019-05-14 | Bmc Software, Inc. | Capacity risk management for virtual machines |
| US10313265B1 (en) * | 2012-06-04 | 2019-06-04 | Google Llc | System and methods for sharing memory subsystem resources among datacenter applications |
| WO2019108649A1 (en) * | 2017-11-28 | 2019-06-06 | Hewlett Packard Enterprise Development Lp | Efficiency indexes |
| US20190173903A1 (en) * | 2015-11-30 | 2019-06-06 | International Business Machines Corporation | User state tracking and anomaly detection in software-as-a-service environments |
| US10318392B2 (en) * | 2014-10-06 | 2019-06-11 | Nec Corporation | Management system for virtual machine failure detection and recovery |
| US20190182174A1 (en) * | 2013-08-29 | 2019-06-13 | Ericsson Ab | Method and system to allocate bandwidth based on task deadline in cloud computing networks |
| US20190213514A1 (en) * | 2018-01-10 | 2019-07-11 | Bank Of America Corporation | System for resource utilization analysis & resource alteration |
| US10353732B2 (en) * | 2015-12-21 | 2019-07-16 | International Business Machines Corporation | Software-defined computing system remote support |
| US10353746B2 (en) * | 2014-12-05 | 2019-07-16 | Amazon Technologies, Inc. | Automatic determination of resource sizing |
| US10374970B2 (en) | 2017-02-01 | 2019-08-06 | Microsoft Technology Licensing, Llc | Deploying a cloud service with capacity reservation followed by activation |
| US10395219B1 (en) * | 2015-12-18 | 2019-08-27 | Amazon Technologies, Inc. | Location policies for reserved virtual machine instances |
| US10417036B2 (en) * | 2017-02-24 | 2019-09-17 | Oracle International Corporation | Evaluation techniques for fast access to structured, semi-structured and unstructured data using a virtual machine that provides support for dynamic code generation |
| US10423456B2 (en) * | 2014-07-31 | 2019-09-24 | Hewlett Packard Enterprise Development Lp | Dynamic adjustment of resource utilization thresholds |
| US20190332294A1 (en) * | 2018-04-30 | 2019-10-31 | EMC IP Holding Company LLC | Automated data quality servicing framework for efficient utilization of information technology resources |
| US20190334903A1 (en) * | 2018-04-30 | 2019-10-31 | Paypal, Inc. | Detecting whether to implement one or more security measures on a shared resource |
| US20190349251A1 (en) * | 2018-05-08 | 2019-11-14 | International Business Machines Corporation | Context-based resource allocation with extended user concepts |
| US10552193B2 (en) | 2015-02-04 | 2020-02-04 | Amazon Technologies, Inc. | Security protocols for low latency execution of program code |
| US10554751B2 (en) * | 2016-01-27 | 2020-02-04 | Oracle International Corporation | Initial resource provisioning in cloud systems |
| US10564946B1 (en) | 2017-12-13 | 2020-02-18 | Amazon Technologies, Inc. | Dependency handling in an on-demand network code execution system |
| US10592269B2 (en) | 2014-09-30 | 2020-03-17 | Amazon Technologies, Inc. | Dynamic code deployment and versioning |
| US10623476B2 (en) | 2015-04-08 | 2020-04-14 | Amazon Technologies, Inc. | Endpoint management system providing an application programming interface proxy service |
| US10691498B2 (en) | 2015-12-21 | 2020-06-23 | Amazon Technologies, Inc. | Acquisition and maintenance of compute capacity |
| US10725752B1 (en) | 2018-02-13 | 2020-07-28 | Amazon Technologies, Inc. | Dependency handling in an on-demand network code execution system |
| US10733085B1 (en) | 2018-02-05 | 2020-08-04 | Amazon Technologies, Inc. | Detecting impedance mismatches due to cross-service calls |
| US10776091B1 (en) | 2018-02-26 | 2020-09-15 | Amazon Technologies, Inc. | Logging endpoint in an on-demand code execution system |
| US10776171B2 (en) | 2015-04-08 | 2020-09-15 | Amazon Technologies, Inc. | Endpoint management system and virtual compute system |
| CN111753239A (en) * | 2020-06-23 | 2020-10-09 | 北京奇艺世纪科技有限公司 | Resource distribution method and device, electronic equipment and storage medium |
| US10824484B2 (en) | 2014-09-30 | 2020-11-03 | Amazon Technologies, Inc. | Event-driven computing |
| US10831898B1 (en) | 2018-02-05 | 2020-11-10 | Amazon Technologies, Inc. | Detecting privilege escalations in code including cross-service calls |
| US10853112B2 (en) | 2015-02-04 | 2020-12-01 | Amazon Technologies, Inc. | Stateful virtual compute system |
| US10853046B2 (en) * | 2018-12-13 | 2020-12-01 | Salesforce.Com, Inc. | Deployment of software applications on server clusters |
| US10884802B2 (en) | 2014-09-30 | 2021-01-05 | Amazon Technologies, Inc. | Message-based computation request scheduling |
| US10884722B2 (en) | 2018-06-26 | 2021-01-05 | Amazon Technologies, Inc. | Cross-environment application of tracing information for improved code execution |
| US10884787B1 (en) | 2016-09-23 | 2021-01-05 | Amazon Technologies, Inc. | Execution guarantees in an on-demand network code execution system |
| US10884812B2 (en) | 2018-12-13 | 2021-01-05 | Amazon Technologies, Inc. | Performance-based hardware emulation in an on-demand network code execution system |
| US10891145B2 (en) | 2016-03-30 | 2021-01-12 | Amazon Technologies, Inc. | Processing pre-existing data sets at an on demand code execution environment |
| US10908927B1 (en) | 2019-09-27 | 2021-02-02 | Amazon Technologies, Inc. | On-demand execution of object filter code in output path of object storage service |
| US10915371B2 (en) | 2014-09-30 | 2021-02-09 | Amazon Technologies, Inc. | Automatic management of low latency computational capacity |
| US10938742B1 (en) | 2020-01-31 | 2021-03-02 | Bank Of America Corporation | Multiplexed resource allocation architecture |
| US10942795B1 (en) | 2019-11-27 | 2021-03-09 | Amazon Technologies, Inc. | Serverless call distribution to utilize reserved capacity without inhibiting scaling |
| US10949237B2 (en) | 2018-06-29 | 2021-03-16 | Amazon Technologies, Inc. | Operating system customization in an on-demand network code execution system |
| US10956185B2 (en) | 2014-09-30 | 2021-03-23 | Amazon Technologies, Inc. | Threading as a service |
| US20210126839A1 (en) * | 2019-10-29 | 2021-04-29 | Fannie Mae | Systems and methods for enterprise information technology (it) monitoring |
| US10996961B2 (en) | 2019-09-27 | 2021-05-04 | Amazon Technologies, Inc. | On-demand indexing of data in input path of object storage service |
| US11010188B1 (en) | 2019-02-05 | 2021-05-18 | Amazon Technologies, Inc. | Simulated data object storage using on-demand computation of data objects |
| US11016815B2 (en) | 2015-12-21 | 2021-05-25 | Amazon Technologies, Inc. | Code execution request routing |
| US11023311B2 (en) | 2019-09-27 | 2021-06-01 | Amazon Technologies, Inc. | On-demand code execution in input path of data uploaded to storage service in multiple data portions |
| US11023416B2 (en) | 2019-09-27 | 2021-06-01 | Amazon Technologies, Inc. | Data access control system for object storage service based on owner-defined code |
| WO2021123411A1 (en) * | 2019-12-21 | 2021-06-24 | Koninklijke Kpn N.V. | Managing resource utilization by multiple network slices |
| US11055112B2 (en) | 2019-09-27 | 2021-07-06 | Amazon Technologies, Inc. | Inserting executions of owner-specified code into input/output path of object storage service |
| US11057276B2 (en) * | 2017-10-04 | 2021-07-06 | Servicenow, Inc. | Bulk service mapping |
| US11099917B2 (en) | 2018-09-27 | 2021-08-24 | Amazon Technologies, Inc. | Efficient state maintenance for execution environments in an on-demand code execution system |
| US11099870B1 (en) | 2018-07-25 | 2021-08-24 | Amazon Technologies, Inc. | Reducing execution times in an on-demand network code execution system using saved machine states |
| US11106477B2 (en) | 2019-09-27 | 2021-08-31 | Amazon Technologies, Inc. | Execution of owner-specified code during input/output path to object storage service |
| US11106628B2 (en) * | 2018-11-02 | 2021-08-31 | EMC IP Holding Company LLC | Method, device and computer program product for storing metadata |
| US11115404B2 (en) | 2019-06-28 | 2021-09-07 | Amazon Technologies, Inc. | Facilitating service connections in serverless code executions |
| US11119813B1 (en) | 2016-09-30 | 2021-09-14 | Amazon Technologies, Inc. | Mapreduce implementation using an on-demand network code execution system |
| US11119826B2 (en) | 2019-11-27 | 2021-09-14 | Amazon Technologies, Inc. | Serverless call distribution to implement spillover while avoiding cold starts |
| US11119809B1 (en) | 2019-06-20 | 2021-09-14 | Amazon Technologies, Inc. | Virtualization-based transaction handling in an on-demand network code execution system |
| US11132213B1 (en) | 2016-03-30 | 2021-09-28 | Amazon Technologies, Inc. | Dependency-based process of pre-existing data sets at an on demand code execution environment |
| US11146569B1 (en) | 2018-06-28 | 2021-10-12 | Amazon Technologies, Inc. | Escalation-resistant secure network services using request-scoped authentication information |
| US11159528B2 (en) | 2019-06-28 | 2021-10-26 | Amazon Technologies, Inc. | Authentication to network-services using hosted authentication information |
| US11188391B1 (en) | 2020-03-11 | 2021-11-30 | Amazon Technologies, Inc. | Allocating resources to on-demand code executions under scarcity conditions |
| US11190609B2 (en) | 2019-06-28 | 2021-11-30 | Amazon Technologies, Inc. | Connection pooling for scalable network services |
| US11233706B2 (en) | 2019-05-06 | 2022-01-25 | Bank Of America Corporation | System for multichannel aggregation of electronic data via a centralized integration hub |
| US11243953B2 (en) | 2018-09-27 | 2022-02-08 | Amazon Technologies, Inc. | Mapreduce implementation in an on-demand network code execution system and stream data processing system |
| US11250007B1 (en) | 2019-09-27 | 2022-02-15 | Amazon Technologies, Inc. | On-demand execution of object combination code in output path of object storage service |
| US11263034B2 (en) | 2014-09-30 | 2022-03-01 | Amazon Technologies, Inc. | Low latency computational capacity provisioning |
| US11263220B2 (en) | 2019-09-27 | 2022-03-01 | Amazon Technologies, Inc. | On-demand execution of object transformation code in output path of object storage service |
| US11301305B2 (en) | 2020-01-07 | 2022-04-12 | Bank Of America Corporation | Dynamic resource clustering architecture |
| US20220131931A1 (en) * | 2020-10-23 | 2022-04-28 | Dell Products L.P. | Implementing an intelligent network of distributed compute nodes |
| US11334393B2 (en) | 2020-01-07 | 2022-05-17 | Bank Of America Corporation | Resource cluster chaining architecture |
| US11354169B2 (en) | 2016-06-29 | 2022-06-07 | Amazon Technologies, Inc. | Adjusting variable limit on concurrent code executions |
| US11360976B2 (en) | 2017-08-31 | 2022-06-14 | Oracle International Corporation | Deployment of javascript and typescript stored procedures and user-defined functions into database management systems |
| US11360948B2 (en) | 2019-09-27 | 2022-06-14 | Amazon Technologies, Inc. | Inserting owner-specified data processing pipelines into input/output path of object storage service |
| US11386230B2 (en) | 2019-09-27 | 2022-07-12 | Amazon Technologies, Inc. | On-demand code obfuscation of data in input path of object storage service |
| US11388210B1 (en) | 2021-06-30 | 2022-07-12 | Amazon Technologies, Inc. | Streaming analytics using a serverless compute system |
| US11394761B1 (en) | 2019-09-27 | 2022-07-19 | Amazon Technologies, Inc. | Execution of user-submitted code on a stream of data |
| US11416628B2 (en) | 2019-09-27 | 2022-08-16 | Amazon Technologies, Inc. | User-specific data manipulation system for object storage service based on user-submitted code |
| US11467890B2 (en) | 2014-09-30 | 2022-10-11 | Amazon Technologies, Inc. | Processing event messages for user requests to execute program code |
| US20220337529A1 (en) * | 2018-06-29 | 2022-10-20 | Vmware, Inc. | System and Method for Maximizing Resource Credits Across Shared Infrastructure |
| US11550944B2 (en) | 2019-09-27 | 2023-01-10 | Amazon Technologies, Inc. | Code execution environment customization system for object storage service |
| US11550713B1 (en) | 2020-11-25 | 2023-01-10 | Amazon Technologies, Inc. | Garbage collection in distributed systems using life cycled storage roots |
| US11593270B1 (en) | 2020-11-25 | 2023-02-28 | Amazon Technologies, Inc. | Fast distributed caching using erasure coded object parts |
| US11640469B2 (en) | 2019-06-21 | 2023-05-02 | Ventech Solutions, Inc. | Method and system for cloud-based software security vulnerability diagnostic assessment |
| US11650848B2 (en) * | 2016-01-21 | 2023-05-16 | Suse Llc | Allocating resources for network function virtualization |
| US11657063B2 (en) * | 2017-03-31 | 2023-05-23 | Bmc Software, Inc. | Behavioral analytics in information technology infrasturcture incident management systems |
| US11657414B1 (en) | 2018-06-21 | 2023-05-23 | Optum, Inc. | Systems and methods for quantitatively predicting changes to employee net promoter scores |
| US11656892B1 (en) | 2019-09-27 | 2023-05-23 | Amazon Technologies, Inc. | Sequential execution of user-submitted code and native functions |
| US11714682B1 (en) | 2020-03-03 | 2023-08-01 | Amazon Technologies, Inc. | Reclaiming computing resources in an on-demand code execution system |
| US11729057B1 (en) * | 2022-02-07 | 2023-08-15 | The Bank Of New York Mellon | Application architecture drift detection system |
| US11775640B1 (en) | 2020-03-30 | 2023-10-03 | Amazon Technologies, Inc. | Resource utilization-based malicious task detection in an on-demand code execution system |
| US11861386B1 (en) | 2019-03-22 | 2024-01-02 | Amazon Technologies, Inc. | Application gateways in an on-demand network code execution system |
| US11875173B2 (en) | 2018-06-25 | 2024-01-16 | Amazon Technologies, Inc. | Execution of auxiliary functions in an on-demand network code execution system |
| US11916734B2 (en) | 2019-03-22 | 2024-02-27 | Koninklijke Kpn N.V. | Third party network and network slice management |
| US11941452B2 (en) * | 2012-03-02 | 2024-03-26 | Vmware, Inc. | System to generate a deployment plan for a cloud infrastructure according to logical, multi-tier application blueprint |
| US11943093B1 (en) | 2018-11-20 | 2024-03-26 | Amazon Technologies, Inc. | Network connection recovery after virtual machine transition in an on-demand network code execution system |
| US11968280B1 (en) | 2021-11-24 | 2024-04-23 | Amazon Technologies, Inc. | Controlling ingestion of streaming data to serverless function executions |
Citations (7)
| Publication number | Priority date | Publication date | Assignee | Title |
|---|---|---|---|---|
| US20080086353A1 (en) * | 2006-10-04 | 2008-04-10 | Microsoft Corporation | Server level summary information of resource utilization |
| US7412492B1 (en) * | 2001-09-12 | 2008-08-12 | Vmware, Inc. | Proportional share resource allocation with reduction of unproductive resource consumption |
| US20090293056A1 (en) * | 2008-05-22 | 2009-11-26 | James Michael Ferris | Methods and systems for automatic self-management of virtual machines in cloud-based networks |
| US20100161827A1 (en) * | 2008-12-23 | 2010-06-24 | Griesmer Stephen J | Methods and apparatus to manage port resources |
| US20100251002A1 (en) * | 2009-03-31 | 2010-09-30 | Swaminathan Sivasubramanian | Monitoring and Automated Recovery of Data Instances |
| US8250582B2 (en) * | 2009-09-25 | 2012-08-21 | International Business Machines Corporation | Chargeback reduction planning for information technology management |
| US8478848B2 (en) * | 2010-08-23 | 2013-07-02 | Incontact, Inc. | Multi-tiered media services using cloud computing for globally interconnecting business and customers |
-
2011
- 2011-09-28 US US13/247,505 patent/US9497136B1/en active Active
Patent Citations (7)
| Publication number | Priority date | Publication date | Assignee | Title |
|---|---|---|---|---|
| US7412492B1 (en) * | 2001-09-12 | 2008-08-12 | Vmware, Inc. | Proportional share resource allocation with reduction of unproductive resource consumption |
| US20080086353A1 (en) * | 2006-10-04 | 2008-04-10 | Microsoft Corporation | Server level summary information of resource utilization |
| US20090293056A1 (en) * | 2008-05-22 | 2009-11-26 | James Michael Ferris | Methods and systems for automatic self-management of virtual machines in cloud-based networks |
| US20100161827A1 (en) * | 2008-12-23 | 2010-06-24 | Griesmer Stephen J | Methods and apparatus to manage port resources |
| US20100251002A1 (en) * | 2009-03-31 | 2010-09-30 | Swaminathan Sivasubramanian | Monitoring and Automated Recovery of Data Instances |
| US8250582B2 (en) * | 2009-09-25 | 2012-08-21 | International Business Machines Corporation | Chargeback reduction planning for information technology management |
| US8478848B2 (en) * | 2010-08-23 | 2013-07-02 | Incontact, Inc. | Multi-tiered media services using cloud computing for globally interconnecting business and customers |
Cited By (153)
| Publication number | Priority date | Publication date | Assignee | Title |
|---|---|---|---|---|
| US20130232254A1 (en) * | 2012-03-02 | 2013-09-05 | Computenext Inc. | Cloud resource utilization management |
| US11941452B2 (en) * | 2012-03-02 | 2024-03-26 | Vmware, Inc. | System to generate a deployment plan for a cloud infrastructure according to logical, multi-tier application blueprint |
| US10313265B1 (en) * | 2012-06-04 | 2019-06-04 | Google Llc | System and methods for sharing memory subsystem resources among datacenter applications |
| US10778605B1 (en) * | 2012-06-04 | 2020-09-15 | Google Llc | System and methods for sharing memory subsystem resources among datacenter applications |
| US11876731B2 (en) * | 2012-06-04 | 2024-01-16 | Google Llc | System and methods for sharing memory subsystem resources among datacenter applications |
| US20200382443A1 (en) * | 2012-06-04 | 2020-12-03 | Google Llc | System and Methods for Sharing Memory Subsystem Resources Among Datacenter Applications |
| US10652318B2 (en) * | 2012-08-13 | 2020-05-12 | Verisign, Inc. | Systems and methods for load balancing using predictive routing |
| US20140047104A1 (en) * | 2012-08-13 | 2014-02-13 | Verisign, Inc. | Systems and Methods for Load Balancing Using Predictive Routing |
| US20180004788A1 (en) * | 2012-10-31 | 2018-01-04 | International Business Machines Corporation | Management of memory usage using usage analytics |
| US20200278956A1 (en) * | 2012-10-31 | 2020-09-03 | International Business Machines Corporation | Management of memory usage using usage analytics |
| US11573946B2 (en) * | 2012-10-31 | 2023-02-07 | International Business Machines Corporation | Management of memory usage using usage analytics |
| US10698875B2 (en) * | 2012-10-31 | 2020-06-30 | International Business Machines Corporation | Management of memory usage using usage analytics |
| US10178031B2 (en) * | 2013-01-25 | 2019-01-08 | Microsoft Technology Licensing, Llc | Tracing with a workload distributor |
| US20150222548A1 (en) * | 2013-01-25 | 2015-08-06 | Concurix Corporation | Tracing with a Workload Distributor |
| US9804949B2 (en) | 2013-02-12 | 2017-10-31 | Microsoft Technology Licensing, Llc | Periodicity optimization in an automated tracing system |
| US9767006B2 (en) | 2013-02-12 | 2017-09-19 | Microsoft Technology Licensing, Llc | Deploying trace objectives using cost analyses |
| US9658936B2 (en) | 2013-02-12 | 2017-05-23 | Microsoft Technology Licensing, Llc | Optimization analysis using similar frequencies |
| US9665474B2 (en) | 2013-03-15 | 2017-05-30 | Microsoft Technology Licensing, Llc | Relationships derived from trace data |
| US20190182174A1 (en) * | 2013-08-29 | 2019-06-13 | Ericsson Ab | Method and system to allocate bandwidth based on task deadline in cloud computing networks |
| US11516146B2 (en) * | 2013-08-29 | 2022-11-29 | Ericsson Ab | Method and system to allocate bandwidth based on task deadline in cloud computing networks |
| US9864672B2 (en) | 2013-09-04 | 2018-01-09 | Microsoft Technology Licensing, Llc | Module specific tracing in a shared module environment |
| US9772927B2 (en) | 2013-11-13 | 2017-09-26 | Microsoft Technology Licensing, Llc | User interface for selecting tracing origins for aggregating classes of trace data |
| US10289440B2 (en) * | 2014-06-30 | 2019-05-14 | Bmc Software, Inc. | Capacity risk management for virtual machines |
| US10296364B2 (en) | 2014-06-30 | 2019-05-21 | Bmc Software, Inc. | Capacity risk management for virtual machines |
| US10896055B2 (en) | 2014-06-30 | 2021-01-19 | Bmc Software, Inc. | Capacity risk management for virtual machines |
| US10423456B2 (en) * | 2014-07-31 | 2019-09-24 | Hewlett Packard Enterprise Development Lp | Dynamic adjustment of resource utilization thresholds |
| US10915371B2 (en) | 2014-09-30 | 2021-02-09 | Amazon Technologies, Inc. | Automatic management of low latency computational capacity |
| US10884802B2 (en) | 2014-09-30 | 2021-01-05 | Amazon Technologies, Inc. | Message-based computation request scheduling |
| US11561811B2 (en) | 2014-09-30 | 2023-01-24 | Amazon Technologies, Inc. | Threading as a service |
| US11467890B2 (en) | 2014-09-30 | 2022-10-11 | Amazon Technologies, Inc. | Processing event messages for user requests to execute program code |
| US10592269B2 (en) | 2014-09-30 | 2020-03-17 | Amazon Technologies, Inc. | Dynamic code deployment and versioning |
| US10824484B2 (en) | 2014-09-30 | 2020-11-03 | Amazon Technologies, Inc. | Event-driven computing |
| US10956185B2 (en) | 2014-09-30 | 2021-03-23 | Amazon Technologies, Inc. | Threading as a service |
| US11263034B2 (en) | 2014-09-30 | 2022-03-01 | Amazon Technologies, Inc. | Low latency computational capacity provisioning |
| US10318392B2 (en) * | 2014-10-06 | 2019-06-11 | Nec Corporation | Management system for virtual machine failure detection and recovery |
| US10353746B2 (en) * | 2014-12-05 | 2019-07-16 | Amazon Technologies, Inc. | Automatic determination of resource sizing |
| US11126469B2 (en) | 2014-12-05 | 2021-09-21 | Amazon Technologies, Inc. | Automatic determination of resource sizing |
| US11360793B2 (en) | 2015-02-04 | 2022-06-14 | Amazon Technologies, Inc. | Stateful virtual compute system |
| US10552193B2 (en) | 2015-02-04 | 2020-02-04 | Amazon Technologies, Inc. | Security protocols for low latency execution of program code |
| US10853112B2 (en) | 2015-02-04 | 2020-12-01 | Amazon Technologies, Inc. | Stateful virtual compute system |
| US11461124B2 (en) | 2015-02-04 | 2022-10-04 | Amazon Technologies, Inc. | Security protocols for low latency execution of program code |
| US10776171B2 (en) | 2015-04-08 | 2020-09-15 | Amazon Technologies, Inc. | Endpoint management system and virtual compute system |
| US10623476B2 (en) | 2015-04-08 | 2020-04-14 | Amazon Technologies, Inc. | Endpoint management system providing an application programming interface proxy service |
| US20160301585A1 (en) * | 2015-04-13 | 2016-10-13 | defend7, Inc. | Real-time tracking and visibility into application communications and component interactions |
| US10089773B1 (en) | 2015-06-30 | 2018-10-02 | EMC IP Holding Company LLC | Animated array performance dashboard |
| US20170006131A1 (en) * | 2015-06-30 | 2017-01-05 | SkyKick, Inc. | Managing users of cloud services with management tool |
| US10728107B2 (en) * | 2015-06-30 | 2020-07-28 | SkyKick, Inc. | Managing users of cloud services with management tool |
| US20190173903A1 (en) * | 2015-11-30 | 2019-06-06 | International Business Machines Corporation | User state tracking and anomaly detection in software-as-a-service environments |
| US10673885B2 (en) * | 2015-11-30 | 2020-06-02 | International Business Machines Corporation | User state tracking and anomaly detection in software-as-a-service environments |
| US10395219B1 (en) * | 2015-12-18 | 2019-08-27 | Amazon Technologies, Inc. | Location policies for reserved virtual machine instances |
| US10353732B2 (en) * | 2015-12-21 | 2019-07-16 | International Business Machines Corporation | Software-defined computing system remote support |
| US11243819B1 (en) | 2015-12-21 | 2022-02-08 | Amazon Technologies, Inc. | Acquisition and maintenance of compute capacity |
| US10691498B2 (en) | 2015-12-21 | 2020-06-23 | Amazon Technologies, Inc. | Acquisition and maintenance of compute capacity |
| US11016815B2 (en) | 2015-12-21 | 2021-05-25 | Amazon Technologies, Inc. | Code execution request routing |
| US11650848B2 (en) * | 2016-01-21 | 2023-05-16 | Suse Llc | Allocating resources for network function virtualization |
| US11915051B2 (en) | 2016-01-21 | 2024-02-27 | Suse Llc | Allocating resources for network function virtualization |
| US10554751B2 (en) * | 2016-01-27 | 2020-02-04 | Oracle International Corporation | Initial resource provisioning in cloud systems |
| US20170255506A1 (en) * | 2016-03-07 | 2017-09-07 | Dell Software, Inc. | Monitoring, analyzing, and mapping of computing resources |
| US10891145B2 (en) | 2016-03-30 | 2021-01-12 | Amazon Technologies, Inc. | Processing pre-existing data sets at an on demand code execution environment |
| US11132213B1 (en) | 2016-03-30 | 2021-09-28 | Amazon Technologies, Inc. | Dependency-based process of pre-existing data sets at an on demand code execution environment |
| US11354169B2 (en) | 2016-06-29 | 2022-06-07 | Amazon Technologies, Inc. | Adjusting variable limit on concurrent code executions |
| US11088920B2 (en) | 2016-07-18 | 2021-08-10 | Capital One Services, Llc | Cloud migration and maintenance controls |
| US10177987B2 (en) * | 2016-07-18 | 2019-01-08 | Capital One Services, Llc | Cloud migration and maintenance controls |
| US10637742B2 (en) | 2016-07-18 | 2020-04-28 | Capital One Services, Llc | Cloud migration and maintenance controls |
| US10884787B1 (en) | 2016-09-23 | 2021-01-05 | Amazon Technologies, Inc. | Execution guarantees in an on-demand network code execution system |
| US11119813B1 (en) | 2016-09-30 | 2021-09-14 | Amazon Technologies, Inc. | Mapreduce implementation using an on-demand network code execution system |
| EP3327991A1 (en) * | 2016-11-29 | 2018-05-30 | Alcatel Lucent | Storage of coverage-related information of a telecommunication network |
| US10523568B2 (en) * | 2016-12-09 | 2019-12-31 | Cisco Technology, Inc. | Adaptive load balancing for application chains |
| US20180167450A1 (en) * | 2016-12-09 | 2018-06-14 | Cisco Technology, Inc. | Adaptive load balancing for application chains |
| US10218813B2 (en) * | 2017-01-31 | 2019-02-26 | Salesforce.Com, Inc. | Automatic surge protection of system resources |
| US10374970B2 (en) | 2017-02-01 | 2019-08-06 | Microsoft Technology Licensing, Llc | Deploying a cloud service with capacity reservation followed by activation |
| US10417036B2 (en) * | 2017-02-24 | 2019-09-17 | Oracle International Corporation | Evaluation techniques for fast access to structured, semi-structured and unstructured data using a virtual machine that provides support for dynamic code generation |
| US11657063B2 (en) * | 2017-03-31 | 2023-05-23 | Bmc Software, Inc. | Behavioral analytics in information technology infrasturcture incident management systems |
| US11360976B2 (en) | 2017-08-31 | 2022-06-14 | Oracle International Corporation | Deployment of javascript and typescript stored procedures and user-defined functions into database management systems |
| US11057276B2 (en) * | 2017-10-04 | 2021-07-06 | Servicenow, Inc. | Bulk service mapping |
| US20190138288A1 (en) * | 2017-11-03 | 2019-05-09 | International Business Machines Corporation | Automatic creation of delivery pipelines |
| US10671368B2 (en) * | 2017-11-03 | 2020-06-02 | International Business Machines Corporation | Automatic creation of delivery pipelines |
| WO2019108649A1 (en) * | 2017-11-28 | 2019-06-06 | Hewlett Packard Enterprise Development Lp | Efficiency indexes |
| US10756981B2 (en) | 2017-11-28 | 2020-08-25 | Hewlett Packard Enterprise Development Lp | Efficiency indexes |
| US11463318B2 (en) | 2017-11-28 | 2022-10-04 | Hewlett Packard Enterprise Development Lp | Efficiency indexes |
| US10564946B1 (en) | 2017-12-13 | 2020-02-18 | Amazon Technologies, Inc. | Dependency handling in an on-demand network code execution system |
| US20190213514A1 (en) * | 2018-01-10 | 2019-07-11 | Bank Of America Corporation | System for resource utilization analysis & resource alteration |
| US10755213B2 (en) * | 2018-01-10 | 2020-08-25 | Bank Of America Corporation | System for resource utilization analysis and resource alteration |
| US10831898B1 (en) | 2018-02-05 | 2020-11-10 | Amazon Technologies, Inc. | Detecting privilege escalations in code including cross-service calls |
| US10733085B1 (en) | 2018-02-05 | 2020-08-04 | Amazon Technologies, Inc. | Detecting impedance mismatches due to cross-service calls |
| US10725752B1 (en) | 2018-02-13 | 2020-07-28 | Amazon Technologies, Inc. | Dependency handling in an on-demand network code execution system |
| US10776091B1 (en) | 2018-02-26 | 2020-09-15 | Amazon Technologies, Inc. | Logging endpoint in an on-demand code execution system |
| US20190332294A1 (en) * | 2018-04-30 | 2019-10-31 | EMC IP Holding Company LLC | Automated data quality servicing framework for efficient utilization of information technology resources |
| US10936215B2 (en) * | 2018-04-30 | 2021-03-02 | EMC IP Holding Company LLC | Automated data quality servicing framework for efficient utilization of information technology resources |
| US10931674B2 (en) * | 2018-04-30 | 2021-02-23 | Paypal, Inc. | Detecting whether to implement one or more security measures on a shared resource |
| US20190334903A1 (en) * | 2018-04-30 | 2019-10-31 | Paypal, Inc. | Detecting whether to implement one or more security measures on a shared resource |
| US11171825B2 (en) * | 2018-05-08 | 2021-11-09 | International Business Machines Corporation | Context-based resource allocation with extended user concepts |
| US20190349251A1 (en) * | 2018-05-08 | 2019-11-14 | International Business Machines Corporation | Context-based resource allocation with extended user concepts |
| US11657414B1 (en) | 2018-06-21 | 2023-05-23 | Optum, Inc. | Systems and methods for quantitatively predicting changes to employee net promoter scores |
| US11875173B2 (en) | 2018-06-25 | 2024-01-16 | Amazon Technologies, Inc. | Execution of auxiliary functions in an on-demand network code execution system |
| US10884722B2 (en) | 2018-06-26 | 2021-01-05 | Amazon Technologies, Inc. | Cross-environment application of tracing information for improved code execution |
| US11146569B1 (en) | 2018-06-28 | 2021-10-12 | Amazon Technologies, Inc. | Escalation-resistant secure network services using request-scoped authentication information |
| US20220337529A1 (en) * | 2018-06-29 | 2022-10-20 | Vmware, Inc. | System and Method for Maximizing Resource Credits Across Shared Infrastructure |
| US10949237B2 (en) | 2018-06-29 | 2021-03-16 | Amazon Technologies, Inc. | Operating system customization in an on-demand network code execution system |
| US11099870B1 (en) | 2018-07-25 | 2021-08-24 | Amazon Technologies, Inc. | Reducing execution times in an on-demand network code execution system using saved machine states |
| US11836516B2 (en) | 2018-07-25 | 2023-12-05 | Amazon Technologies, Inc. | Reducing execution times in an on-demand network code execution system using saved machine states |
| US11099917B2 (en) | 2018-09-27 | 2021-08-24 | Amazon Technologies, Inc. | Efficient state maintenance for execution environments in an on-demand code execution system |
| US11243953B2 (en) | 2018-09-27 | 2022-02-08 | Amazon Technologies, Inc. | Mapreduce implementation in an on-demand network code execution system and stream data processing system |
| US11106628B2 (en) * | 2018-11-02 | 2021-08-31 | EMC IP Holding Company LLC | Method, device and computer program product for storing metadata |
| US11943093B1 (en) | 2018-11-20 | 2024-03-26 | Amazon Technologies, Inc. | Network connection recovery after virtual machine transition in an on-demand network code execution system |
| US10884812B2 (en) | 2018-12-13 | 2021-01-05 | Amazon Technologies, Inc. | Performance-based hardware emulation in an on-demand network code execution system |
| US10853046B2 (en) * | 2018-12-13 | 2020-12-01 | Salesforce.Com, Inc. | Deployment of software applications on server clusters |
| US11010188B1 (en) | 2019-02-05 | 2021-05-18 | Amazon Technologies, Inc. | Simulated data object storage using on-demand computation of data objects |
| US11861386B1 (en) | 2019-03-22 | 2024-01-02 | Amazon Technologies, Inc. | Application gateways in an on-demand network code execution system |
| US11916734B2 (en) | 2019-03-22 | 2024-02-27 | Koninklijke Kpn N.V. | Third party network and network slice management |
| US11233706B2 (en) | 2019-05-06 | 2022-01-25 | Bank Of America Corporation | System for multichannel aggregation of electronic data via a centralized integration hub |
| US11119809B1 (en) | 2019-06-20 | 2021-09-14 | Amazon Technologies, Inc. | Virtualization-based transaction handling in an on-demand network code execution system |
| US11714675B2 (en) | 2019-06-20 | 2023-08-01 | Amazon Technologies, Inc. | Virtualization-based transaction handling in an on-demand network code execution system |
| US11640469B2 (en) | 2019-06-21 | 2023-05-02 | Ventech Solutions, Inc. | Method and system for cloud-based software security vulnerability diagnostic assessment |
| US11190609B2 (en) | 2019-06-28 | 2021-11-30 | Amazon Technologies, Inc. | Connection pooling for scalable network services |
| US11115404B2 (en) | 2019-06-28 | 2021-09-07 | Amazon Technologies, Inc. | Facilitating service connections in serverless code executions |
| US11159528B2 (en) | 2019-06-28 | 2021-10-26 | Amazon Technologies, Inc. | Authentication to network-services using hosted authentication information |
| US11250007B1 (en) | 2019-09-27 | 2022-02-15 | Amazon Technologies, Inc. | On-demand execution of object combination code in output path of object storage service |
| US11416628B2 (en) | 2019-09-27 | 2022-08-16 | Amazon Technologies, Inc. | User-specific data manipulation system for object storage service based on user-submitted code |
| US11106477B2 (en) | 2019-09-27 | 2021-08-31 | Amazon Technologies, Inc. | Execution of owner-specified code during input/output path to object storage service |
| US11055112B2 (en) | 2019-09-27 | 2021-07-06 | Amazon Technologies, Inc. | Inserting executions of owner-specified code into input/output path of object storage service |
| US10908927B1 (en) | 2019-09-27 | 2021-02-02 | Amazon Technologies, Inc. | On-demand execution of object filter code in output path of object storage service |
| US11263220B2 (en) | 2019-09-27 | 2022-03-01 | Amazon Technologies, Inc. | On-demand execution of object transformation code in output path of object storage service |
| US10996961B2 (en) | 2019-09-27 | 2021-05-04 | Amazon Technologies, Inc. | On-demand indexing of data in input path of object storage service |
| US11386230B2 (en) | 2019-09-27 | 2022-07-12 | Amazon Technologies, Inc. | On-demand code obfuscation of data in input path of object storage service |
| US11023311B2 (en) | 2019-09-27 | 2021-06-01 | Amazon Technologies, Inc. | On-demand code execution in input path of data uploaded to storage service in multiple data portions |
| US11550944B2 (en) | 2019-09-27 | 2023-01-10 | Amazon Technologies, Inc. | Code execution environment customization system for object storage service |
| US11860879B2 (en) | 2019-09-27 | 2024-01-02 | Amazon Technologies, Inc. | On-demand execution of object transformation code in output path of object storage service |
| US11023416B2 (en) | 2019-09-27 | 2021-06-01 | Amazon Technologies, Inc. | Data access control system for object storage service based on owner-defined code |
| US11360948B2 (en) | 2019-09-27 | 2022-06-14 | Amazon Technologies, Inc. | Inserting owner-specified data processing pipelines into input/output path of object storage service |
| US11656892B1 (en) | 2019-09-27 | 2023-05-23 | Amazon Technologies, Inc. | Sequential execution of user-submitted code and native functions |
| US11394761B1 (en) | 2019-09-27 | 2022-07-19 | Amazon Technologies, Inc. | Execution of user-submitted code on a stream of data |
| US20210126839A1 (en) * | 2019-10-29 | 2021-04-29 | Fannie Mae | Systems and methods for enterprise information technology (it) monitoring |
| US11799741B2 (en) * | 2019-10-29 | 2023-10-24 | Fannie Mae | Systems and methods for enterprise information technology (IT) monitoring |
| US11119826B2 (en) | 2019-11-27 | 2021-09-14 | Amazon Technologies, Inc. | Serverless call distribution to implement spillover while avoiding cold starts |
| US10942795B1 (en) | 2019-11-27 | 2021-03-09 | Amazon Technologies, Inc. | Serverless call distribution to utilize reserved capacity without inhibiting scaling |
| WO2021123411A1 (en) * | 2019-12-21 | 2021-06-24 | Koninklijke Kpn N.V. | Managing resource utilization by multiple network slices |
| US11301305B2 (en) | 2020-01-07 | 2022-04-12 | Bank Of America Corporation | Dynamic resource clustering architecture |
| US11334393B2 (en) | 2020-01-07 | 2022-05-17 | Bank Of America Corporation | Resource cluster chaining architecture |
| US11171881B2 (en) | 2020-01-31 | 2021-11-09 | Bank Of America Corporation | Multiplexed resource allocation architecture |
| US10938742B1 (en) | 2020-01-31 | 2021-03-02 | Bank Of America Corporation | Multiplexed resource allocation architecture |
| US11714682B1 (en) | 2020-03-03 | 2023-08-01 | Amazon Technologies, Inc. | Reclaiming computing resources in an on-demand code execution system |
| US11188391B1 (en) | 2020-03-11 | 2021-11-30 | Amazon Technologies, Inc. | Allocating resources to on-demand code executions under scarcity conditions |
| US11775640B1 (en) | 2020-03-30 | 2023-10-03 | Amazon Technologies, Inc. | Resource utilization-based malicious task detection in an on-demand code execution system |
| CN111753239B (en) * | 2020-06-23 | 2023-09-05 | 北京奇艺世纪科技有限公司 | Resource distribution method and device, electronic equipment and storage medium |
| CN111753239A (en) * | 2020-06-23 | 2020-10-09 | 北京奇艺世纪科技有限公司 | Resource distribution method and device, electronic equipment and storage medium |
| US20220131931A1 (en) * | 2020-10-23 | 2022-04-28 | Dell Products L.P. | Implementing an intelligent network of distributed compute nodes |
| US11757986B2 (en) * | 2020-10-23 | 2023-09-12 | Dell Products L.P. | Implementing an intelligent network of distributed compute nodes |
| US11550713B1 (en) | 2020-11-25 | 2023-01-10 | Amazon Technologies, Inc. | Garbage collection in distributed systems using life cycled storage roots |
| US11593270B1 (en) | 2020-11-25 | 2023-02-28 | Amazon Technologies, Inc. | Fast distributed caching using erasure coded object parts |
| US11388210B1 (en) | 2021-06-30 | 2022-07-12 | Amazon Technologies, Inc. | Streaming analytics using a serverless compute system |
| US11968280B1 (en) | 2021-11-24 | 2024-04-23 | Amazon Technologies, Inc. | Controlling ingestion of streaming data to serverless function executions |
| US11729057B1 (en) * | 2022-02-07 | 2023-08-15 | The Bank Of New York Mellon | Application architecture drift detection system |
Similar Documents
| Publication | Publication Date | Title |
|---|---|---|
| US9497136B1 (en) | Method and system for providing usage metrics to manage utilzation of cloud computing resources | |
| US11368374B1 (en) | System and method for managing virtual and dedicated servers | |
| US9203894B1 (en) | Methods and systems for building an application execution map | |
| US9003019B1 (en) | Methods and systems for utilization tracking and notification of cloud resources | |
| Fatema et al. | A survey of cloud monitoring tools: Taxonomy, capabilities and objectives | |
| JP7088913B2 (en) | Introduce dynamic policies to detect threats and visualize access | |
| CN105308576B (en) | It is determined that the performance capability with monitoring computer resource service | |
| US8745216B2 (en) | Systems and methods for monitoring and controlling a service level agreement | |
| Aceto et al. | Cloud monitoring: A survey | |
| US9582980B2 (en) | Intentional monitoring | |
| AU2011314183B2 (en) | Virtual resource cost tracking with dedicated implementation resources | |
| US8914499B2 (en) | Method and apparatus for event correlation related to service impact analysis in a virtualized environment | |
| EP4137947A1 (en) | Quantifying usage of disparate computing resources as a single unit of measure | |
| US20140278807A1 (en) | Cloud service optimization for cost, performance and configuration | |
| US9559921B2 (en) | Dynamic boundary based monitoring and metering | |
| US20120084113A1 (en) | Virtual resource cost tracking with dedicated implementation resources | |
| US20120084443A1 (en) | Virtual provisioning with implementation resource boundary awareness | |
| US10560353B1 (en) | Deployment monitoring for an application | |
| US9402004B2 (en) | Method and system for managing data usage for a service across multiple devices | |
| Barker et al. | Cloud services brokerage: A survey and research roadmap | |
| US10833960B1 (en) | SLA management in composite cloud solutions using blockchain | |
| US11057280B2 (en) | User interface with expected response times of commands | |
| Clark et al. | Secure monitoring of service level agreements | |
| EP3557507A1 (en) | Third-party network computing resource management | |
| US20200142746A1 (en) | Methods and system for throttling analytics processing |
Legal Events
| Date | Code | Title | Description |
|---|---|---|---|
| AS | Assignment |
Owner name: EMC CORPORATION, MASSACHUSETTS Free format text: ASSIGNMENT OF ASSIGNORS INTEREST;ASSIGNORS:RAMARAO, SHREENIDHI;GINZBURG, ILAN;GUO, FENG;REEL/FRAME:027041/0685 Effective date: 20111011 |
|
| AS | Assignment |
Owner name: CREDIT SUISSE AG, CAYMAN ISLANDS BRANCH, AS COLLATERAL AGENT, NORTH CAROLINA Free format text: SECURITY AGREEMENT;ASSIGNORS:ASAP SOFTWARE EXPRESS, INC.;AVENTAIL LLC;CREDANT TECHNOLOGIES, INC.;AND OTHERS;REEL/FRAME:040134/0001 Effective date: 20160907 Owner name: THE BANK OF NEW YORK MELLON TRUST COMPANY, N.A., AS NOTES COLLATERAL AGENT, TEXAS Free format text: SECURITY AGREEMENT;ASSIGNORS:ASAP SOFTWARE EXPRESS, INC.;AVENTAIL LLC;CREDANT TECHNOLOGIES, INC.;AND OTHERS;REEL/FRAME:040136/0001 Effective date: 20160907 Owner name: CREDIT SUISSE AG, CAYMAN ISLANDS BRANCH, AS COLLAT Free format text: SECURITY AGREEMENT;ASSIGNORS:ASAP SOFTWARE EXPRESS, INC.;AVENTAIL LLC;CREDANT TECHNOLOGIES, INC.;AND OTHERS;REEL/FRAME:040134/0001 Effective date: 20160907 Owner name: THE BANK OF NEW YORK MELLON TRUST COMPANY, N.A., A Free format text: SECURITY AGREEMENT;ASSIGNORS:ASAP SOFTWARE EXPRESS, INC.;AVENTAIL LLC;CREDANT TECHNOLOGIES, INC.;AND OTHERS;REEL/FRAME:040136/0001 Effective date: 20160907 |
|
| AS | Assignment |
Owner name: EMC IP HOLDING COMPANY LLC, MASSACHUSETTS Free format text: ASSIGNMENT OF ASSIGNORS INTEREST;ASSIGNOR:EMC CORPORATION;REEL/FRAME:040203/0001 Effective date: 20160906 |
|
| STCF | Information on status: patent grant |
Free format text: PATENTED CASE |
|
| AS | Assignment |
Owner name: THE BANK OF NEW YORK MELLON TRUST COMPANY, N.A., T Free format text: SECURITY AGREEMENT;ASSIGNORS:CREDANT TECHNOLOGIES, INC.;DELL INTERNATIONAL L.L.C.;DELL MARKETING L.P.;AND OTHERS;REEL/FRAME:049452/0223 Effective date: 20190320 Owner name: THE BANK OF NEW YORK MELLON TRUST COMPANY, N.A., TEXAS Free format text: SECURITY AGREEMENT;ASSIGNORS:CREDANT TECHNOLOGIES, INC.;DELL INTERNATIONAL L.L.C.;DELL MARKETING L.P.;AND OTHERS;REEL/FRAME:049452/0223 Effective date: 20190320 |
|
| AS | Assignment |
Owner name: THE BANK OF NEW YORK MELLON TRUST COMPANY, N.A., TEXAS Free format text: SECURITY AGREEMENT;ASSIGNORS:CREDANT TECHNOLOGIES INC.;DELL INTERNATIONAL L.L.C.;DELL MARKETING L.P.;AND OTHERS;REEL/FRAME:053546/0001 Effective date: 20200409 |
|
| MAFP | Maintenance fee payment |
Free format text: PAYMENT OF MAINTENANCE FEE, 4TH YEAR, LARGE ENTITY (ORIGINAL EVENT CODE: M1551); ENTITY STATUS OF PATENT OWNER: LARGE ENTITY Year of fee payment: 4 |
|
| AS | Assignment |
Owner name: WYSE TECHNOLOGY L.L.C., CALIFORNIA Free format text: RELEASE BY SECURED PARTY;ASSIGNOR:CREDIT SUISSE AG, CAYMAN ISLANDS BRANCH;REEL/FRAME:058216/0001 Effective date: 20211101 Owner name: SCALEIO LLC, MASSACHUSETTS Free format text: RELEASE BY SECURED PARTY;ASSIGNOR:CREDIT SUISSE AG, CAYMAN ISLANDS BRANCH;REEL/FRAME:058216/0001 Effective date: 20211101 Owner name: MOZY, INC., WASHINGTON Free format text: RELEASE BY SECURED PARTY;ASSIGNOR:CREDIT SUISSE AG, CAYMAN ISLANDS BRANCH;REEL/FRAME:058216/0001 Effective date: 20211101 Owner name: MAGINATICS LLC, CALIFORNIA Free format text: RELEASE BY SECURED PARTY;ASSIGNOR:CREDIT SUISSE AG, CAYMAN ISLANDS BRANCH;REEL/FRAME:058216/0001 Effective date: 20211101 Owner name: FORCE10 NETWORKS, INC., CALIFORNIA Free format text: RELEASE BY SECURED PARTY;ASSIGNOR:CREDIT SUISSE AG, CAYMAN ISLANDS BRANCH;REEL/FRAME:058216/0001 Effective date: 20211101 Owner name: EMC IP HOLDING COMPANY LLC, TEXAS Free format text: RELEASE BY SECURED PARTY;ASSIGNOR:CREDIT SUISSE AG, CAYMAN ISLANDS BRANCH;REEL/FRAME:058216/0001 Effective date: 20211101 Owner name: EMC CORPORATION, MASSACHUSETTS Free format text: RELEASE BY SECURED PARTY;ASSIGNOR:CREDIT SUISSE AG, CAYMAN ISLANDS BRANCH;REEL/FRAME:058216/0001 Effective date: 20211101 Owner name: DELL SYSTEMS CORPORATION, TEXAS Free format text: RELEASE BY SECURED PARTY;ASSIGNOR:CREDIT SUISSE AG, CAYMAN ISLANDS BRANCH;REEL/FRAME:058216/0001 Effective date: 20211101 Owner name: DELL SOFTWARE INC., CALIFORNIA Free format text: RELEASE BY SECURED PARTY;ASSIGNOR:CREDIT SUISSE AG, CAYMAN ISLANDS BRANCH;REEL/FRAME:058216/0001 Effective date: 20211101 Owner name: DELL PRODUCTS L.P., TEXAS Free format text: RELEASE BY SECURED PARTY;ASSIGNOR:CREDIT SUISSE AG, CAYMAN ISLANDS BRANCH;REEL/FRAME:058216/0001 Effective date: 20211101 Owner name: DELL MARKETING L.P., TEXAS Free format text: RELEASE BY SECURED PARTY;ASSIGNOR:CREDIT SUISSE AG, CAYMAN ISLANDS BRANCH;REEL/FRAME:058216/0001 Effective date: 20211101 Owner name: DELL INTERNATIONAL, L.L.C., TEXAS Free format text: RELEASE BY SECURED PARTY;ASSIGNOR:CREDIT SUISSE AG, CAYMAN ISLANDS BRANCH;REEL/FRAME:058216/0001 Effective date: 20211101 Owner name: DELL USA L.P., TEXAS Free format text: RELEASE BY SECURED PARTY;ASSIGNOR:CREDIT SUISSE AG, CAYMAN ISLANDS BRANCH;REEL/FRAME:058216/0001 Effective date: 20211101 Owner name: CREDANT TECHNOLOGIES, INC., TEXAS Free format text: RELEASE BY SECURED PARTY;ASSIGNOR:CREDIT SUISSE AG, CAYMAN ISLANDS BRANCH;REEL/FRAME:058216/0001 Effective date: 20211101 Owner name: AVENTAIL LLC, CALIFORNIA Free format text: RELEASE BY SECURED PARTY;ASSIGNOR:CREDIT SUISSE AG, CAYMAN ISLANDS BRANCH;REEL/FRAME:058216/0001 Effective date: 20211101 Owner name: ASAP SOFTWARE EXPRESS, INC., ILLINOIS Free format text: RELEASE BY SECURED PARTY;ASSIGNOR:CREDIT SUISSE AG, CAYMAN ISLANDS BRANCH;REEL/FRAME:058216/0001 Effective date: 20211101 |
|
| AS | Assignment |
Owner name: SCALEIO LLC, MASSACHUSETTS Free format text: RELEASE OF SECURITY INTEREST IN PATENTS PREVIOUSLY RECORDED AT REEL/FRAME (040136/0001);ASSIGNOR:THE BANK OF NEW YORK MELLON TRUST COMPANY, N.A., AS NOTES COLLATERAL AGENT;REEL/FRAME:061324/0001 Effective date: 20220329 Owner name: EMC IP HOLDING COMPANY LLC (ON BEHALF OF ITSELF AND AS SUCCESSOR-IN-INTEREST TO MOZY, INC.), TEXAS Free format text: RELEASE OF SECURITY INTEREST IN PATENTS PREVIOUSLY RECORDED AT REEL/FRAME (040136/0001);ASSIGNOR:THE BANK OF NEW YORK MELLON TRUST COMPANY, N.A., AS NOTES COLLATERAL AGENT;REEL/FRAME:061324/0001 Effective date: 20220329 Owner name: EMC CORPORATION (ON BEHALF OF ITSELF AND AS SUCCESSOR-IN-INTEREST TO MAGINATICS LLC), MASSACHUSETTS Free format text: RELEASE OF SECURITY INTEREST IN PATENTS PREVIOUSLY RECORDED AT REEL/FRAME (040136/0001);ASSIGNOR:THE BANK OF NEW YORK MELLON TRUST COMPANY, N.A., AS NOTES COLLATERAL AGENT;REEL/FRAME:061324/0001 Effective date: 20220329 Owner name: DELL MARKETING CORPORATION (SUCCESSOR-IN-INTEREST TO FORCE10 NETWORKS, INC. AND WYSE TECHNOLOGY L.L.C.), TEXAS Free format text: RELEASE OF SECURITY INTEREST IN PATENTS PREVIOUSLY RECORDED AT REEL/FRAME (040136/0001);ASSIGNOR:THE BANK OF NEW YORK MELLON TRUST COMPANY, N.A., AS NOTES COLLATERAL AGENT;REEL/FRAME:061324/0001 Effective date: 20220329 Owner name: DELL PRODUCTS L.P., TEXAS Free format text: RELEASE OF SECURITY INTEREST IN PATENTS PREVIOUSLY RECORDED AT REEL/FRAME (040136/0001);ASSIGNOR:THE BANK OF NEW YORK MELLON TRUST COMPANY, N.A., AS NOTES COLLATERAL AGENT;REEL/FRAME:061324/0001 Effective date: 20220329 Owner name: DELL INTERNATIONAL L.L.C., TEXAS Free format text: RELEASE OF SECURITY INTEREST IN PATENTS PREVIOUSLY RECORDED AT REEL/FRAME (040136/0001);ASSIGNOR:THE BANK OF NEW YORK MELLON TRUST COMPANY, N.A., AS NOTES COLLATERAL AGENT;REEL/FRAME:061324/0001 Effective date: 20220329 Owner name: DELL USA L.P., TEXAS Free format text: RELEASE OF SECURITY INTEREST IN PATENTS PREVIOUSLY RECORDED AT REEL/FRAME (040136/0001);ASSIGNOR:THE BANK OF NEW YORK MELLON TRUST COMPANY, N.A., AS NOTES COLLATERAL AGENT;REEL/FRAME:061324/0001 Effective date: 20220329 Owner name: DELL MARKETING L.P. (ON BEHALF OF ITSELF AND AS SUCCESSOR-IN-INTEREST TO CREDANT TECHNOLOGIES, INC.), TEXAS Free format text: RELEASE OF SECURITY INTEREST IN PATENTS PREVIOUSLY RECORDED AT REEL/FRAME (040136/0001);ASSIGNOR:THE BANK OF NEW YORK MELLON TRUST COMPANY, N.A., AS NOTES COLLATERAL AGENT;REEL/FRAME:061324/0001 Effective date: 20220329 Owner name: DELL MARKETING CORPORATION (SUCCESSOR-IN-INTEREST TO ASAP SOFTWARE EXPRESS, INC.), TEXAS Free format text: RELEASE OF SECURITY INTEREST IN PATENTS PREVIOUSLY RECORDED AT REEL/FRAME (040136/0001);ASSIGNOR:THE BANK OF NEW YORK MELLON TRUST COMPANY, N.A., AS NOTES COLLATERAL AGENT;REEL/FRAME:061324/0001 Effective date: 20220329 |
|
| AS | Assignment |
Owner name: SCALEIO LLC, MASSACHUSETTS Free format text: RELEASE OF SECURITY INTEREST IN PATENTS PREVIOUSLY RECORDED AT REEL/FRAME (045455/0001);ASSIGNOR:THE BANK OF NEW YORK MELLON TRUST COMPANY, N.A., AS NOTES COLLATERAL AGENT;REEL/FRAME:061753/0001 Effective date: 20220329 Owner name: EMC IP HOLDING COMPANY LLC (ON BEHALF OF ITSELF AND AS SUCCESSOR-IN-INTEREST TO MOZY, INC.), TEXAS Free format text: RELEASE OF SECURITY INTEREST IN PATENTS PREVIOUSLY RECORDED AT REEL/FRAME (045455/0001);ASSIGNOR:THE BANK OF NEW YORK MELLON TRUST COMPANY, N.A., AS NOTES COLLATERAL AGENT;REEL/FRAME:061753/0001 Effective date: 20220329 Owner name: EMC CORPORATION (ON BEHALF OF ITSELF AND AS SUCCESSOR-IN-INTEREST TO MAGINATICS LLC), MASSACHUSETTS Free format text: RELEASE OF SECURITY INTEREST IN PATENTS PREVIOUSLY RECORDED AT REEL/FRAME (045455/0001);ASSIGNOR:THE BANK OF NEW YORK MELLON TRUST COMPANY, N.A., AS NOTES COLLATERAL AGENT;REEL/FRAME:061753/0001 Effective date: 20220329 Owner name: DELL MARKETING CORPORATION (SUCCESSOR-IN-INTEREST TO FORCE10 NETWORKS, INC. AND WYSE TECHNOLOGY L.L.C.), TEXAS Free format text: RELEASE OF SECURITY INTEREST IN PATENTS PREVIOUSLY RECORDED AT REEL/FRAME (045455/0001);ASSIGNOR:THE BANK OF NEW YORK MELLON TRUST COMPANY, N.A., AS NOTES COLLATERAL AGENT;REEL/FRAME:061753/0001 Effective date: 20220329 Owner name: DELL PRODUCTS L.P., TEXAS Free format text: RELEASE OF SECURITY INTEREST IN PATENTS PREVIOUSLY RECORDED AT REEL/FRAME (045455/0001);ASSIGNOR:THE BANK OF NEW YORK MELLON TRUST COMPANY, N.A., AS NOTES COLLATERAL AGENT;REEL/FRAME:061753/0001 Effective date: 20220329 Owner name: DELL INTERNATIONAL L.L.C., TEXAS Free format text: RELEASE OF SECURITY INTEREST IN PATENTS PREVIOUSLY RECORDED AT REEL/FRAME (045455/0001);ASSIGNOR:THE BANK OF NEW YORK MELLON TRUST COMPANY, N.A., AS NOTES COLLATERAL AGENT;REEL/FRAME:061753/0001 Effective date: 20220329 Owner name: DELL USA L.P., TEXAS Free format text: RELEASE OF SECURITY INTEREST IN PATENTS PREVIOUSLY RECORDED AT REEL/FRAME (045455/0001);ASSIGNOR:THE BANK OF NEW YORK MELLON TRUST COMPANY, N.A., AS NOTES COLLATERAL AGENT;REEL/FRAME:061753/0001 Effective date: 20220329 Owner name: DELL MARKETING L.P. (ON BEHALF OF ITSELF AND AS SUCCESSOR-IN-INTEREST TO CREDANT TECHNOLOGIES, INC.), TEXAS Free format text: RELEASE OF SECURITY INTEREST IN PATENTS PREVIOUSLY RECORDED AT REEL/FRAME (045455/0001);ASSIGNOR:THE BANK OF NEW YORK MELLON TRUST COMPANY, N.A., AS NOTES COLLATERAL AGENT;REEL/FRAME:061753/0001 Effective date: 20220329 Owner name: DELL MARKETING CORPORATION (SUCCESSOR-IN-INTEREST TO ASAP SOFTWARE EXPRESS, INC.), TEXAS Free format text: RELEASE OF SECURITY INTEREST IN PATENTS PREVIOUSLY RECORDED AT REEL/FRAME (045455/0001);ASSIGNOR:THE BANK OF NEW YORK MELLON TRUST COMPANY, N.A., AS NOTES COLLATERAL AGENT;REEL/FRAME:061753/0001 Effective date: 20220329 |