US9412037B2 - Method and system for image analysis based upon correlation relationships of sub-arrays of a descriptor array - Google Patents
Method and system for image analysis based upon correlation relationships of sub-arrays of a descriptor array Download PDFInfo
- Publication number
- US9412037B2 US9412037B2 US14/370,133 US201214370133A US9412037B2 US 9412037 B2 US9412037 B2 US 9412037B2 US 201214370133 A US201214370133 A US 201214370133A US 9412037 B2 US9412037 B2 US 9412037B2
- Authority
- US
- United States
- Prior art keywords
- array
- sub
- descriptor
- arrays
- keypoint
- Prior art date
- Legal status (The legal status is an assumption and is not a legal conclusion. Google has not performed a legal analysis and makes no representation as to the accuracy of the status listed.)
- Active
Links
- 238000003491 array Methods 0.000 title claims abstract description 190
- 238000000034 method Methods 0.000 title claims abstract description 133
- 238000010191 image analysis Methods 0.000 title abstract description 21
- 238000013139 quantization Methods 0.000 claims abstract description 38
- 239000013598 vector Substances 0.000 claims abstract description 37
- 238000012545 processing Methods 0.000 claims abstract description 23
- 230000000875 corresponding effect Effects 0.000 claims description 285
- 239000011159 matrix material Substances 0.000 claims description 54
- 238000009826 distribution Methods 0.000 claims description 43
- 238000012549 training Methods 0.000 claims description 24
- 230000002596 correlated effect Effects 0.000 claims description 11
- 238000007619 statistical method Methods 0.000 claims description 5
- 239000011800 void material Substances 0.000 claims description 5
- 238000007906 compression Methods 0.000 description 39
- 230000006835 compression Effects 0.000 description 39
- 238000000605 extraction Methods 0.000 description 31
- 230000000007 visual effect Effects 0.000 description 27
- 230000006837 decompression Effects 0.000 description 17
- 108010031325 Cytidine deaminase Proteins 0.000 description 11
- 102100030058 Secreted frizzled-related protein 1 Human genes 0.000 description 10
- 101150008950 CBK1 gene Proteins 0.000 description 9
- 101100326161 Chlamydomonas reinhardtii BKT gene Proteins 0.000 description 9
- 230000015654 memory Effects 0.000 description 9
- 238000004458 analytical method Methods 0.000 description 8
- 101150111792 sda1 gene Proteins 0.000 description 7
- 230000006399 behavior Effects 0.000 description 6
- 238000013459 approach Methods 0.000 description 5
- 238000010586 diagram Methods 0.000 description 4
- 238000012795 verification Methods 0.000 description 4
- 230000003542 behavioural effect Effects 0.000 description 3
- 230000007423 decrease Effects 0.000 description 3
- 238000005286 illumination Methods 0.000 description 3
- HPTJABJPZMULFH-UHFFFAOYSA-N 12-[(Cyclohexylcarbamoyl)amino]dodecanoic acid Chemical compound OC(=O)CCCCCCCCCCCNC(=O)NC1CCCCC1 HPTJABJPZMULFH-UHFFFAOYSA-N 0.000 description 2
- MZZYGYNZAOVRTG-UHFFFAOYSA-N 2-hydroxy-n-(1h-1,2,4-triazol-5-yl)benzamide Chemical compound OC1=CC=CC=C1C(=O)NC1=NC=NN1 MZZYGYNZAOVRTG-UHFFFAOYSA-N 0.000 description 2
- 108010029988 AICDA (activation-induced cytidine deaminase) Proteins 0.000 description 2
- 101001030172 Homo sapiens Myozenin-3 Proteins 0.000 description 2
- 101100477442 Homo sapiens SFRP2 gene Proteins 0.000 description 2
- 101000904787 Homo sapiens Serine/threonine-protein kinase ATR Proteins 0.000 description 2
- 101000658622 Homo sapiens Testis-specific Y-encoded-like protein 2 Proteins 0.000 description 2
- 102100038897 Myozenin-3 Human genes 0.000 description 2
- 101100447180 Schizosaccharomyces pombe (strain 972 / ATCC 24843) frp2 gene Proteins 0.000 description 2
- 102100030054 Secreted frizzled-related protein 2 Human genes 0.000 description 2
- 102100022433 Single-stranded DNA cytosine deaminase Human genes 0.000 description 2
- 102100034917 Testis-specific Y-encoded-like protein 2 Human genes 0.000 description 2
- 230000005540 biological transmission Effects 0.000 description 2
- 230000003247 decreasing effect Effects 0.000 description 2
- 238000007726 management method Methods 0.000 description 2
- 230000000704 physical effect Effects 0.000 description 2
- PXFBZOLANLWPMH-UHFFFAOYSA-N 16-Epiaffinine Natural products C1C(C2=CC=CC=C2N2)=C2C(=O)CC2C(=CC)CN(C)C1C2CO PXFBZOLANLWPMH-UHFFFAOYSA-N 0.000 description 1
- YTAHJIFKAKIKAV-XNMGPUDCSA-N [(1R)-3-morpholin-4-yl-1-phenylpropyl] N-[(3S)-2-oxo-5-phenyl-1,3-dihydro-1,4-benzodiazepin-3-yl]carbamate Chemical compound O=C1[C@H](N=C(C2=C(N1)C=CC=C2)C1=CC=CC=C1)NC(O[C@H](CCN1CCOCC1)C1=CC=CC=C1)=O YTAHJIFKAKIKAV-XNMGPUDCSA-N 0.000 description 1
- 238000013144 data compression Methods 0.000 description 1
- 230000001419 dependent effect Effects 0.000 description 1
- 238000011161 development Methods 0.000 description 1
- 230000006870 function Effects 0.000 description 1
- 230000014509 gene expression Effects 0.000 description 1
- 230000004807 localization Effects 0.000 description 1
- 238000013507 mapping Methods 0.000 description 1
- 238000003909 pattern recognition Methods 0.000 description 1
- 238000010972 statistical evaluation Methods 0.000 description 1
- 238000012360 testing method Methods 0.000 description 1
- 230000003936 working memory Effects 0.000 description 1
Images


Classifications
-
- G06K9/4652—
-
- G—PHYSICS
- G06—COMPUTING; CALCULATING OR COUNTING
- G06F—ELECTRIC DIGITAL DATA PROCESSING
- G06F16/00—Information retrieval; Database structures therefor; File system structures therefor
- G06F16/50—Information retrieval; Database structures therefor; File system structures therefor of still image data
- G06F16/58—Retrieval characterised by using metadata, e.g. metadata not derived from the content or metadata generated manually
- G06F16/583—Retrieval characterised by using metadata, e.g. metadata not derived from the content or metadata generated manually using metadata automatically derived from the content
-
- G06F17/30247—
-
- G—PHYSICS
- G06—COMPUTING; CALCULATING OR COUNTING
- G06F—ELECTRIC DIGITAL DATA PROCESSING
- G06F18/00—Pattern recognition
- G06F18/20—Analysing
- G06F18/21—Design or setup of recognition systems or techniques; Extraction of features in feature space; Blind source separation
- G06F18/214—Generating training patterns; Bootstrap methods, e.g. bagging or boosting
-
- G06K9/00536—
-
- G06K9/4642—
-
- G06K9/6256—
-
- G—PHYSICS
- G06—COMPUTING; CALCULATING OR COUNTING
- G06F—ELECTRIC DIGITAL DATA PROCESSING
- G06F2218/00—Aspects of pattern recognition specially adapted for signal processing
- G06F2218/12—Classification; Matching
Definitions
- the present invention relates to the field of the image analysis.
- a common operation provides for comparing two images in order to find the relation occurring therebetween in case both the images include at least a portion of a same scene or of a same object.
- the image comparison is of the utmost importance for calibrating video cameras belonging to a multi-camera system, for assessing the motion occurring between two frames of a video shoot, and for the recognition of an object within an image (e.g., a picture).
- object recognition algorithms specifically designed to be employed in the so-called visual searching engines, i.e., automated services that, starting from a picture, are capable of identifying the object(s) pictured therein and offering information related to the identified object(s). Examples of known services of this type include Google Goggles, Nokia Point&Find, and kooaba Smart Visuals.
- An object recognition application typically provides for comparing a first image—in jargon, referred to as “query image”—depicting an object to be recognized with a plurality of model images, each one depicting a respective known object; this allows to perform a comparison among the object depicted in the query image and the objects depicted in the model images.
- model images are typically arranged in a proper model database.
- each model image corresponds to an item offered by an online store (e.g., the picture of a book cover, a DVD cover and/or a CD cover).
- the number of model images included in a database of such type is quite high; for example, a model database of an online shopping service may include several millions of different model images.
- a very efficient way for performing comparing operations between two images provides for selecting a set of points—in jargon, referred to as keypoints—in the first image and then matching each keypoint of the set to a corresponding keypoint in the second image.
- the selection of which point of the first image has to become a keypoint is advantageously carried out by extracting local features of the area of the image surrounding the point itself, such as for example the point extraction scale, the privileged orientation of the area, and the so called “descriptor”.
- a descriptor of a keypoint is a mathematic operator describing the luminance gradient of an area of the image (called patch) centered at the keypoint, with such patch that is orientated according to the main luminance gradient of the patch itself.
- SIFT Scale-Invariant Feature Transform
- the SIFT descriptor is a quite powerful tool, which allows to select keypoints for performing accurate image comparisons. However, this accuracy can be achieved only with the use of a quite large amount of data; for example, a typical SIFT descriptor is an array of 128 data bytes. Since the number of keypoints in each image is relatively high (for example, 1000-1500 keypoints for a standard VGA picture), and since each keypoint is associated with a corresponding SIFT descriptor, the overall amount of data to be processed may become excessive for being efficiently managed.
- this drawback is solved at the root by directly transmitting the image, and not the descriptors, from the mobile terminal to the server. Indeed, because of the quite high number of keypoints, the amount of data of the corresponding SIFT descriptors may exceed the size (in terms of bytes) of a standard VGA picture itself.
- the amount of data to be processed may be advantageously reduced by compressing the descriptor arrays before the transmission thereof.
- descriptor arrays may be compressed through vector quantization, which provides for approximating the tuple values which the descriptor arrays may assume into a reduced set of codewords of a codebook.
- Further reduction of the amount of data to be processed may be obtained by compressing the descriptor arrays through product code vector quantization, i.e. by subdividing the descriptor arrays into sub-arrays and then applying vector quantization to each sub-array.
- H Jegou et al “Product Quantization for Nearest Neighbor Search”, IEEE Transactions on Pattern Analysis and Machine Intelligence, vol. 33, no. 1, 1 Jan. 2011 (2011 Jan. 1), pages 117-128, introduces a product quantization-based approach for approximate nearest neighbor search.
- the idea is to decompose the space into a Cartesian product of low-dimensional subspaces and to quantize each subspace separately.
- a vector is represented by a short code composed of its subspace quantization indices.
- the Euclidean distance between two vectors can be efficiently estimated from their codes.
- An asymmetric version increases precision, as it computes the approximate distance between a vector and a code.
- the solution employed by Google Goggles which provides for directly transmitting the image—and not the descriptors—from the mobile terminal to the server requires that the entire computational load is moved toward the server, which may become overburden. Moreover, the transmission of the compressed image still requires a considerable amount of data (e.g., tens of Kbytes for a VGA image).
- the Applicant has tackled the problem of how to improve these approaches in terms of amount of data to be processed.
- the Applicant has tackled the problem to provide a method for processing an image which requires a reduced amount of data to be managed.
- the Applicant has found that the amount of data to be processed for performing image analysis procedures can be advantageously reduced by subdividing the descriptor arrays identified in the image into corresponding sub-arrays based on correlation relationships among the color gradient histograms stored in the descriptor array, and then by compressing the sub-array by means of vector quantization.
- An aspect of the present invention relates to a method for processing an image.
- the method comprises identifying a group of keypoints in the image.
- the method further comprises, for each keypoint of the group, calculating a corresponding descriptor array including a plurality of array elements, wherein each array element stores values taken by a corresponding color gradient histogram of a respective sub-region of the image in the neighborhood of the keypoint.
- the method further comprises, for each keypoint of the group, subdividing the descriptor array in at least two sub-arrays, each sub-array comprising a respective number of elements of the descriptor array, and generating a compressed descriptor array comprising a corresponding compressed sub-array for each of said at least two sub-arrays.
- Each compressed sub-array is obtained by compressing the corresponding sub-array of said at least two sub-arrays by means of vector quantization using a respective codebook.
- the method still further comprises exploiting the compressed descriptor arrays of the keypoints of said group for analysing the image. For each keypoint of said group, the subdivision of the descriptor array in at least two sub-arrays is carried out based on correlation relationships among the color gradient histograms whose values are stored in the elements of the descriptor array of said each keypoint.
- decompressed descriptor arrays obtained by means of a decompression of compressed descriptor arrays compressed by subdividing the descriptor arrays in sub-arrays may be affected by distortion (i.e., the decompressed descriptor arrays differ to some extent from the original descriptor arrays before compression).
- the Applicant has found a method thanks to which the distortion can be substantially reduced, by taking into account, during the decompression, statistical spatial correlations among the various sub-regions of the area surrounding the generic keypoint.
- said decompressing is carried out based on statistical spatial correlation relationships among the positions of the sub-regions of the image in the neighborhood of the keypoint.
- FIG. 1 illustrates in terms of functional blocks an extraction procedure directed to extract from a query image an optimal set of keypoints and generate a compressed set of descriptors according to an embodiment of the present invention
- FIGS. 2A-2F are statistical distributions of corresponding selected local features of keypoints according to some exemplary embodiments of the present invention.
- FIG. 2G is an exemplary picture processed according to the extraction procedure of FIG. 1 ;
- FIG. 3A illustrates an exemplary descriptor of the SIFT type
- FIG. 3B illustrates an exemplary descriptor array of the descriptor of FIG. 3A ;
- FIG. 4A illustrates an exemplary descriptor array compression according to a solution known in the art
- FIG. 4B illustrates an exemplary descriptor array compression according to another solution known in the art
- FIG. 5 illustrates an arrangement of sub-histograms of a descriptor in correlation families according to an embodiment of the present invention
- FIGS. 6A-6D show how the descriptor array is compressed according to exemplary embodiments of the present invention
- FIG. 7A illustrates an exemplary distribution of keypoints KP
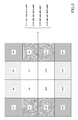
- FIG. 7B illustrates how a grid can be superimposed over the query image for quantizing the coordinates of the keypoints of FIG. 7A ;
- FIG. 7C is an exemplary graphical depiction of a histogram obtained by superimposing the grid of FIG. 7B over the set of keypoints KP of FIG. 7A ;
- FIG. 7D identifies the columns and rows of the grid of FIG. 7B which are entirely formed by cells that do not include any keypoint;
- FIG. 7E illustrates an exemplary histogram over a rank-1 support
- FIG. 7F illustrates a histogram map corresponding to the histogram over the rank-1 support of FIG. 7E ;
- FIG. 8A illustrates an example of a word histogram
- FIG. 8B illustrates an example of a histogram map
- FIG. 9 illustrates in terms of functional blocks a matching procedure directed to perform the comparison between two images according to an embodiment of the present invention.
- FIG. 10 illustrates in terms of functional blocks a retrieval procedure directed to retrieve from a model database a model image depicting the same object/scene depicted in the query image according to an embodiment of the present invention
- FIG. 11 illustrates in terms of functional blocks an optimized decompression procedure directed to decompress compressed descriptor arrays according to an embodiment of the present invention
- FIG. 12 graphically depicts the orientation of bins of a descriptor
- FIG. 13A illustrates an exemplary compensation matrix corresponding to a compression scheme providing for subdividing the descriptor array in four sub-arrays and using for each sub-array a codebook including 2 ⁇ 13 codewords;
- FIG. 13B is a diagram illustrating the values assumed by the elements of a column of the compensation matrix of FIG. 13A .
- FIG. 14A illustrates an exemplary compensation matrix Z corresponding to a compression scheme providing for subdividing the descriptor array in eight sub-arrays and using for each sub-array a codebook including 2 ⁇ 11 codewords, and
- FIG. 14B is a diagram illustrating the values assumed by the elements of a column of the compensation matrix of FIG. 14A .
- FIG. 1 illustrates in terms of functional blocks a procedure, hereinafter referred to as “extraction procedure” and identified with the reference 100 , directed to process an input image in order to obtain an optimal set of keypoints and generate a corresponding set of descriptors according to an embodiment of the present invention.
- extraction procedure directed to process an input image in order to obtain an optimal set of keypoints and generate a corresponding set of descriptors according to an embodiment of the present invention.
- the keypoints and the descriptors will be then exploited for image analysis purposes.
- image analysis and “analyzing an image” have to be intended to comprise all those operations which provide for comparing an image with at least one another image. These operations may be carried out in a wide variety of applications, such as for example in an object recognition application, as well as in an application providing for the creation of a single panoramic picture starting from a plurality of different pictures.
- the extraction procedures according to an embodiment of the present invention further provides for selecting an optimal subset of keypoints and compressing the descriptors of such keypoints to an extent such to greatly improve the efficiency of subsequent procedures.
- each processing unit may be a hardware unit specifically designed to perform one or more steps of the method.
- the steps of the method may be carried out by a programmable machine (e.g., a computer) under the control of a corresponding set of instructions.
- the first phase 110 of the extraction procedure 100 provides for receiving a query image 115 and extracting therefrom a first set of keypoints KP, each one associated with a corresponding pair of spatial coordinates C identifying the location of such keypoint KP within the query image 115 .
- This operation may be carried out by exploiting the known Difference of Gaussians (DoG) keypoint extraction algorithm; however, similar considerations apply in case different keypoint extraction algorithms are employed, such as for example the Determinant of the Hessians (DoH) keypoint extraction algorithm.
- DoG keypoint extraction algorithm the query image 115 is convolved with Gaussian filters in a sequence at different scales. Then, a difference operation is carried out between pairs of adjacent Gaussian-blurred images in the sequence. The keypoints KP are then chosen as the points having maximum/minimum values of Difference of Gaussian (DoG) at multiple scales.
- each pixel in a DoG image is compared to its eight neighbors at the same scale and to nine neighboring pixels at each of the neighboring scales (i.e., the subsequent and the previous scales in the sequence). If the pixel value is the maximum or minimum among all compared pixels, that point is considered a candidate keypoint KP.
- each keypoint KP is assigned to one or more orientations based on local image luminance gradient directions. For example, an orientation histogram with a plurality of bins is formed, with each bin covering a corresponding degree interval. Each sample in the neighboring window added to a histogram bin is weighted by its gradient magnitude and by a Gaussian-weighted circular window. The peaks in the resulting histogram correspond to dominant orientations. Once the histogram is filled, the orientations corresponding to the highest peak and local peaks that are within 80% of the highest peaks are assigned to the keypoint KP. In case of multiple orientations have been assigned, an additional keypoint KP is created having the same location and scale as the original keypoint for each additional orientation.
- a set of keypoints KP is thus generated, together with the corresponding coordinates C, the scale S at which the keypoint is extracted, its dominant orientation O, and the peak P, i.e., the absolute value of the DoG corresponding to such keypoint (which is indicative of the contrast thereof).
- the following phase 120 provides to process the query image 115 in order to compute for each keypoint KP a corresponding descriptor D.
- the descriptors D computed at phase 120 are descriptor of the SIFT type. While the keypoints KP have been extracted in such a way to ensure invariance to image location, scale and rotation, the SIFT descriptors D are computed in such a way to be highly distinctive and partially invariant to illumination and viewpoint. Specifically, for each keypoint KP a set of 16 sub-histograms are calculated on a 4 ⁇ 4 grid that is centered at the keypoint KP location and orientated according to the dominant orientation of the keypoint KP.
- the concepts of the present invention are also applicable if the SIFT descriptor is calculated on a grid including a different number of cells, and/or with a different number of bins per histogram.
- descriptors of the SIFT type similar considerations apply in case different types of descriptors are employed, such as for example the Speeded Up Robust Feature (SURF) and the Histogram of Oriented Gradients (HOG), or possibly others.
- SURF Speeded Up Robust Feature
- HOG Histogram of Oriented Gradients
- similar considerations apply if gradients of different parameters are considered. Indeed, as it is well known to those skilled in the art, the luminance is only one of the physical properties of the color.
- descriptors may be also considered, for example comprising data relating to chrominance gradients, saturation gradients, or even color (which includes both luminance, saturation and chrominance) gradients.
- each keypoint KP is associated with a plurality of local features (hereinafter globally identified with reference LFkp), including the coordinates C, the scale S, the dominant orientation O, and the peak P, as well as a corresponding descriptor D formed by an array of 128 items.
- LFkp local features
- the extraction procedure 100 according to an embodiment of the present invention provides for two expedients, i.e.:
- Phase 130 of the extraction procedure 100 is dedicated to the selection of the optimal subset SUB, phase 140 is dedicated to the compression of the descriptors D, and phase 150 is dedicated to the compression of the coordinates C.
- the selection of the optimal subset SUB is carried out by calculating for at least one local feature LFkp—the coordinates C, the scale S, the dominant orientation O, the peak P and the descriptor D—of each keypoint KP of the query image 115 at least one corresponding feature relevance probability FRP, sorting the keypoints KP according to a keypoint relevance probability KRP based on the feature relevance probabilities FRP of its local features LFkp, and then selecting the keypoints KP having the highest keypoint relevance probabilities KRP.
- LFkp the coordinates C, the scale S, the dominant orientation O, the peak P and the descriptor D—of each keypoint KP of the query image 115 at least one corresponding feature relevance probability FRP
- the feature relevance probability FRP of each local feature LFkp of the generic keypoint KP is calculated by exploiting a corresponding reference statistical distribution Rsd, which has been already predetermined in advance after having carried out statistical evaluations on a benchmark image database.
- the reference statistical distributions Rsd are made in such a way to reflect the statistical behavior of the local features LFkp of keypoints KP considered useful for image analysis purposes.
- the benchmark image database is a database comprising a plurality of image pairs, with each image pair consisting of two pictures depicting a same object/scene.
- the reference statistical distributions are generated in the following way.
- Keypoints are firstly extracted from all the images of the benchmark database. Then, a first statistical analysis is carried out on one or more selected local features of all the extracted keypoints, so as to generate first statistical distributions of such selected local features.
- Each first statistical distribution of a local feature is arranged in the form of a histogram, obtained by counting the number of keypoints (keypoints frequency)—among the totality of keypoints extracted from the images of the benchmark database—having a value of such local feature that falls within each of a plurality predefined local feature value intervals (bin). Then, for each image pair, keypoints of one picture are matched with keypoints of the other picture.
- the matches among such keypoints are processed using an image comparison procedure (such as any one among the known image comparison procedures based on image feature matching) in order to identify which match is correct (inlier) and which is incorrect (outlier).
- a second statistical analysis is then carried out on the same feature or features previously considered in order to generate the reference statistical distributions Rsd to be used for calculating the feature relevance probabilities FRP.
- the generation of the reference statistical distributions Rsd is carried out by calculating for each bin a ratio between the number of keypoints belonging to inliers and having a value of the corresponding local feature that falls within said bin, and the total number of keypoints (both belonging to inliers and outliers) having a value of the corresponding local feature that falls within the same bin.
- the Applicant has observed that the first statistical distributions and the reference statistical distributions Rsd are quite different to each other. Since the reference statistical distributions Rsd are generated taking into account the keypoints that involve a correct feature match (inlier), the Applicant has found that such statistical distributions are good representatives of the statistical behavior of keypoints (hereinafter, “relevant keypoints”) which are relevant for image analysis purposes, and particularly suited for being efficiently employed in an image comparison procedure.
- relevant keypoints are good representatives of the statistical behavior of keypoints which are relevant for image analysis purposes, and particularly suited for being efficiently employed in an image comparison procedure.
- FIGS. 2A-2F illustrate some statistical distributions Rsd of corresponding selected local features LFkp of keypoints KP according to some exemplary embodiments of the present invention.
- the statistical distributions Rsd of FIGS. 2A-2F have been generated from images of a benchmark database specifically arranged for object recognition applications. Should a different image analysis application be considered, such as for example the creation of a single panoramic picture starting from a plurality of different pictures, the images of the benchmark, and therefore, the resulting statistical distributions Rsd would be different.
- FIG. 2A is a statistical distribution Rsd related to the coordinates C of the keypoints KP.
- Each bin of the corresponding histogram represents the distance (in pixel) of the generic keypoint KP from the center of the image.
- the considered image is of the VGA type (i.e., having a resolution of 640 ⁇ 480), thus the center corresponds to the coordinate (320, 240).
- the bin having the highest keypoints KP frequency is the one corresponding to the center of the image. This means that the closer a keypoint KP is to the center, the higher the probability that such keypoint KP is a relevant keypoint; the trend of the histogram frequencies monotonically decreases as the distance from the center increases.
- FIG. 2B is a statistical distribution Rsd related to the dominant orientation O of the keypoints KP.
- Each bin of the corresponding histogram represents the angle (in radians) of the dominant direction of the generic keypoint KP with respect to the horizon (corresponding to 0 radians).
- the bins having the highest keypoints KP frequencies are the ones corresponding to the orientations which are parallel or perpendicular to the horizon orientation (i.e., corresponding to ⁇ /2, 0, ⁇ /2, ⁇ ). This means that the closer the orientation of a keypoint KP is to one of said orientations, the higher the probability that such keypoint KP is a relevant keypoint.
- the width of the bins is determined by means of a quantizer.
- FIG. 2C is a statistical distribution Rsd related to the peak P of the keypoints KP.
- Each bin of the corresponding histogram represents the contrast between the generic keypoint KP and the most similar point among the neighbor ones.
- the bin having the highest keypoints KP frequency is the one corresponding to the highest peak values. This means that the higher the contrast of a keypoint KP, the higher the probability that such keypoint KP is a relevant keypoint; the trend of the histogram frequencies monotonically increases as the contrast increases. This could be easily explained by the fact that a point of a picture having a high contrast is easily recognizable and identifiable. In this case as well, the width of the bins is determined by means of a quantizer.
- FIG. 2D is a statistical distribution Rsd related to the scale S of the keypoints KP.
- Each bin of the corresponding histogram represents a particular scale S at which the keypoint KP may be extracted.
- the bin having the highest keypoints KP frequency corresponds to a mid-low scale.
- the width of the bins is determined by means of a quantizer.
- FIG. 2E is a first statistical distribution Rsd related to the descriptors D of the keypoints KP.
- the corresponding histogram is three-dimensional, with each bin thereof corresponding to interval values of two parameters of the descriptor D of the generic keypoint KP, i.e., the mean (x axis) and the variance (y axis) of the descriptor D. Greater frequency values are indicated by circles of larger diameter.
- the mean and the variance have been considered together to form a same histogram, since they are linked to each other. According to such histogram, the bin having the highest keypoints KP frequency, represented by larger circles, is the one corresponding to the highest mean and the lowest variance.
- FIG. 2F is a second statistical distribution Rsd related to the descriptors D of the keypoints KP.
- each bin corresponds to a particular maximum distance between the descriptor D of a keypoint KP and the descriptors D of the other keypoints KP of the same image.
- maximum distance may be computed based on the Euclidean distance between descriptors, Other known method may be also contemplated, such as for example exploiting the symmetrized Kullback-Leibler divergence.
- phase 130 of the extraction procedure 100 provides for calculating, for each keypoint KP extracted at phase 110 :
- a keypoint relevance probability KRP is obtained by at least one of, or by combining among them the feature relevance probabilities FRP of the local features thereof.
- the keypoint relevance probability KRP of the generic keypoint KP is calculated by multiplying to each other its corresponding feature relevance probabilities FRP.
- the higher the number of different feature relevance probabilities FRP used to calculate the keypoint relevance probability KRP the better the results obtainable by employing such method.
- the feature relevance probabilities considered for calculating the keypoint relevance probability include at least those corresponding to the scale, the peak and the distance from the centre.
- FIG. 2G is an exemplary picture in which a plurality of keypoints are identified by means of corresponding circular spots, each one having a diameter that is proportional to the relevance probability KRP of the keypoint.
- the optimal subset SUB is formed by taking a number (based on the desired reduction in the amount of data to be managed) of keypoints KP from the first ones of the ordered sequence.
- the selected keypoints KP belonging to the optimal subset SUB results to be the most relevant keypoints KP (from the image comparison point of view) among the totality of keypoints KP extracted in phase 110 . In this way, the reduction of the overall amount of data is carried out in a smart and efficient way, taking into account only the relevant keypoints KP, and discarding those that are less useful.
- the compression of the descriptors D is carried out through vector quantization, by exploiting a reduced number of optimized codebooks.
- FIG. 3A illustrates an exemplary descriptor D of the SIFT type (one of the descriptors D generated at phase 120 of the extraction procedure 100 of FIG. 1 which has been selected to be part of the optimal subset SUB) corresponding to a generic keypoint KP.
- the values of all the orientation histograms shi of a descriptor D are arranged in a corresponding descriptor array, identified in figure with the reference DA.
- se(h) a typical frequency value may range from 0 to 255
- each sub-element se(h) of the descriptor array DA can be represented with a byte; therefore, the memory occupation of the descriptor array DA is equal to 128 bytes.
- the amount of data (in bytes) corresponding to all the descriptors D of the keypoints KP belonging to the selected optimal subset SUB is equal to 128 multiplied by the number of keypoints KP of the optimal subset SUB.
- the descriptor arrays DA corresponding to such descriptors D are compressed through vector quantization.
- the n-tuple values forming the reduced set are also referred to as “codewords”. Each codeword is associated with a corresponding set of different n-tuple values the array may assume. The association relationships between n-tuple values of the data array and codewords is determined by means of a corresponding codebook.
- the descriptor array DA which includes 16 elements ai formed in turn by eight sub-elements se(h) each having values ranging from 0 to 255
- N 256 128 of different 16-tuple values.
- the codebook determines association relationships between each codeword and a corresponding set of 16-tuple values of the descriptor array DA. Therefore, each codeword of the codebook is a 16-tuple value which is used to “approximate” a corresponding set of 16-tuple values of the descriptor array DA.
- the vector quantization is a lossy data compression, whose accuracy can be measured through a parameter called distortion.
- the distortion may be for example calculated as the Euclidean distance between a generic codeword of the codebook and the set of n-tuple values of the array which are approximated by such codeword. Similar considerations apply even if the distortion is calculated with a different method. In any case, broadly speaking, the higher the number N1 of codewords of a codebook, the lower the distortion of the compression.
- the generation of the codewords of a codebook is typically carried out by performing statistical operations (referred to as training operations) on a training database including a collection of a very high number of training arrays.
- training operations statistical operations
- the required codewords number N1 may become very high. Having a codebook formed by too high a number N1 of codewords is disadvantageous under different points of view. Indeed, the number of training arrays to be used for generating the codewords would become excessive, and the processing times would become too long. Moreover, in order to carry out compression operations by exploiting a codebook, the whole N1 codewords forming the latter have to be memorized somewhere, occupying a non-negligible amount of memory space. The latter drawback is quite critical, since the hardware employed for image analysis applications (e.g., Graphic Processing Units, GPU) may be equipped with not so capacious memories.
- image analysis applications e.g., Graphic Processing Units, GPU
- each codebook CBKy is carried out by performing training operations on a respective sub-set of training descriptor arrays.
- Each sub-set of training descriptor arrays of a codebook CBKk corresponds to one of the four sub-arrays SDAk, and may be obtained by considering from each training descriptor array used to generate the single codebook CBK of FIG. 4A only the portion thereof corresponding to the sub-array SDAk.
- codebooks CBKy formed by codewords CWj having a (smaller) dimension mk of a sub-array SDAk thereof allow to obtain, with a same number of codewords CWj, a lower distortion.
- the subdivision of the descriptor array DA in sub-arrays SDAk for compression purposes is carried out by taking into consideration the occurrence of correlation relationships among the elements ai of the descriptor array DA.
- each element ai of the descriptor array DA stores the values taken by the sub-histogram shi associated with a respective sub-region, which sub-region corresponds in turn to a cell of the 4 ⁇ 4 grid centered at the keypoint KP corresponding to such descriptor array DA.
- each correlation family CFx comprising a set of correlated sub-histograms shi with a similar statistical behavior, i.e., with a similar trend of the bin frequencies.
- two sub-histograms shi belonging to a same correlation family CFx may have a similar number of frequency peaks at same (or similar) bins.
- the statistical behavioral analysis employed to form the correlation families CFx showed that, having fixed the maximum number of codewords CWj to be used for compressing the descriptor array DA, if the arrangement of the sub-histograms shi in correlation families CFx is varied (by assigning the sub-histograms shi to different correlation families CFx), the resulting distortion accordingly varies.
- the correlation families CFx are thus formed by considering, among all the possible sub-histograms shi subdivisions, the one corresponding to the lowest distortion.
- the sixteen sub-histograms shi of a keypoint KP are arranged in four correlation families, i.e.:
- the above identified correlation families CFx are advantageously exploited in order to compress the descriptor array DA using a reduced number of optimized codebooks CBKy.
- the subdivision of the descriptor array DA in sub-arrays SDAk is carried out in such a way that at least two sub-arrays SDAk have the same global (i.e., considering all the elements thereof) statistical behavior; in this way, it is possible to use a single codebook CBKy to compress more than one sub-arrays SDAk.
- the subdivision of the descriptor array DA is carried out in such a way to obtain group(s) of sub-arrays SDAk in which for each group the elements ai occupying the same position in all the sub-arrays SDAk of the group belong to a same correlation family CFx. Therefore, all the sub-arrays SDAk belonging to a same group can be advantageously compressed using a same corresponding codebook CBKy, whose codewords CWj are obtained by considering, from each training descriptor array used to generate the single codebook CBK of FIG. 4A , only the elements thereof belonging to the correlation families CFx which the elements ai of the sub-arrays SDAk of the group belong to.
- the descriptor array DA is subdivided in four sub-arrays SDA 1 -SDA 4 which are arranged in a single group. Therefore, all the sub-arrays SDAk are compressed using a same codebook CBK 1 . Specifically:
- the codebook CBK 1 for compressing the generic sub-array SDA 1 -SDA 4 includes N3 codewords CWj, wherein each codeword CWj has the first element belonging to the first correlation family CF 1 , the second element belonging to the second correlation family CF 2 , the third element belonging to the fourth correlation family CF 4 , and the fourth element belonging to the third correlation family CF 3 .
- the descriptor array DA is subdivided in two sub-arrays SDA 1 , SDA 2 which are arranged in a single group. Therefore, all the sub-array SDAk are compressed using a same codebook CBK 1 . Specifically:
- the codebook CBK 1 for compressing the generic sub-array SDA 1 , SDA 2 includes N4 codewords CWj, wherein each codeword CWj has the first and the fourth elements belonging to the first correlation family CF 1 , the second and the third elements belonging to the second correlation family CF 2 , the fifth and the eighth elements belonging to the third correlation family CF 3 , and the sixth and the seventh elements belonging to the third correlation family CF 3 .
- the descriptor array DA is subdivided in six sub-arrays SDA 1 -SDA 6 , four of which (SDA 1 -SDA 4 ) are arranged in a first group, and two of which (SDA 5 , SDA 6 ) are arranged in a second group. Therefore, the sub-arrays SDA 1 -SDA 4 are compressed using a same first codebook CBK 1 , while the sub-arrays SDA 5 -SDA 6 are compressed using a same second codebook CBK 2 .
- the sub-arrays SDA 1 -SDA 4 are compressed using a same first codebook CBK 1
- the sub-arrays SDA 5 -SDA 6 are compressed using a same second codebook CBK 2 .
- the codebook CBK 1 for compressing the generic sub-array SDA 1 -SDA 4 belonging to the first group includes N5 codewords CWj, wherein each codeword CWj has the first element belonging to the third correlation family CF 3 , the second element belonging to the first correlation family CF 1 , and the third element belonging to the second correlation family CF 2 .
- the codebook CBK 2 for compressing the generic sub-array SDA 5 -SDA 6 belonging to the second group includes N6 codewords CWj, wherein each codeword CWj has the first and second elements belonging to the fourth correlation family CF 4 .
- the descriptor array DA is subdivided in eight sub-arrays SDA 1 -SDA 8 , four of which (SDA 1 -SDA 4 ) are arranged in a first group, and four of which (SDA 5 -SDA 8 ) are arranged in a second group. Therefore, the sub-arrays SDA 1 -SDA 4 are compressed using a same first codebook CBK 1 , while the sub-arrays SDA 5 -SDA 8 are compressed using a same second codebook CBK 2 .
- the sub-arrays SDA 1 -SDA 4 are compressed using a same first codebook CBK 1
- the sub-arrays SDA 5 -SDA 8 are compressed using a same second codebook CBK 2 .
- the codebook CBK 1 for compressing the generic sub-array SDA 1 -SDA 4 belonging to the first group includes N7 codewords CWj, wherein each codeword CWj has the first element belonging to the third correlation family CF 3 , and the second element belonging to the first correlation family CF 1 .
- the codebook CBK 2 for compressing the generic sub-array SDA 5 -SDA 8 belonging to the second group includes N8 codewords CWj, wherein each codeword CWj has the first elements belonging to the fourth correlation family CF 4 and the second elements belonging to the second correlation family CF 2 .
- the minimum number of bits required to identify all the codewords is equal to 4*(log 2 N7)+4*(log 2 N8).
- the concepts of the present invention are also applicable with subdivisions into a different number of sub-arrays and/or with a different number of codebooks. Moreover, even if in the present description reference has been made to the compression of a SIF descriptor calculated on a grid including 4 ⁇ 4 cells with eight bins per histogram, similar consideration apply if the number of cells and/or the number of bins per histogram is different, as well as descriptors of other types are considered.
- the combined use of subdividing the descriptor array DA in sub-arrays SDAk and employing a same codebook CBKy for more than one sub-arrays SDAk allows to drastically reduce the memory space required to store the codebook(s) CBKy used to compress the descriptor array DA.
- Another advantage given by the combined use of subdividing the descriptor array DA in sub-arrays SDAk and employing a same codebook CBKy for more than one sub-arrays SDAk consists in that the training procedure for the generation of the codebook(s) CBKy results to be faster.
- each codeword CWj of such codebook CBKy is identified by a corresponding compression index Cy; if the codebook CBKy is formed by a number N of different codewords CWj, the compression index Cy is formed by at least log 2 N bits.
- the corresponding compressed descriptor array CDA comprises a compression index Cy for each sub-array SDAk of the set, wherein each compression index Cy identifies the codeword CWj of the codebook CBKy used to approximate said sub-array SDAk.
- the amount of data to be managed (e.g., to be memorized and/or transmitted) for performing image analysis operations is further reduced by compressing the coordinates C of the keypoints KP belonging to the optimal subset SUB calculated at phase 130 of the extraction procedure 100 (see FIG. 1 ).
- FIG. 7A illustrates an exemplary distribution of the keypoints KP of the optimal subset SUB within a bi-dimensional space corresponding to the query image 115 ; each keypoint KP is associated with a corresponding pair of spatial coordinates C identifying the location of such keypoint KP within the query image 115 .
- the coordinates C of all the keypoints KP of the subset SUB are quantized.
- a n ⁇ m grid is superimposed over the query image 115 .
- FIG. 7C is an exemplary graphical depiction of the histogram obtained by superimposing the grid of FIG. 7B over the set of keypoints KP of FIG. 7A .
- the cells void of keypoints KP are colored in black, while the cells including at least a keypoint KP are colored in gray.
- the cells including a single keypoint KP are colored in dark grey, while those including two keypoints KP are colored in a lighter grey.
- the histogram obtained from the keypoint counting has a great number of bins whose frequency is equal to zero, i.e., with the corresponding cell that does not include any keypoint KP (the black cells depicted in FIG. 7C ).
- the data representing the histogram may be advantageously compressed taking into considerations that the portions thereof corresponding to the zero frequency bins only provide the information that its corresponding cell does not include any keypoint.
- the rows and the columns of the grid which are entirely formed by cells that does not include any keypoints KP can be advantageously removed.
- an indication of the positions of all the rows and columns void of keypoints KP (comprising those corresponding to the rows and/or columns to be removed) should be recorded.
- the next step provides for identify the rows and/or the columns which are entirely formed by cells that does not include any keypoints KP are identified. Making reference to the example at issue, such rows and columns are depicted in black in FIG. 7D .
- rank-1 support all the rows and all the columns include at least one cell comprising at least one keypoint KP.
- the histogram over the rank-1 support corresponding to the example at issue is illustrated in FIG. 7E .
- the information corresponding to point 1) may be extracted exploiting a so-called “histogram map”, while the information corresponding to point 2) may be arranged in a so-called “histogram count”.
- the histogram map is a bi-dimensional mapping of the histogram over the rank-1 support which identifies the bins thereof having a frequency equal to or higher than 1.
- the histogram map corresponding to the histogram over the rank-1 support of FIG. 7E is illustrated in FIG. 7F .
- the histogram map can be represented with a corresponding matrix, whose generic element is equal to zero if the corresponding cell of the rank-1 support does not include any keypoint KP, and is equal to one if the corresponding cell of the rank-1 support does include at least one keypoint KP.
- the matrix of the histogram map illustrated in FIG. 7F is the following one:
- the information provided by the histogram map can be advantageously compressed using an entropic coding optimized based on the statistical behavior of exemplary rank-1 support histograms learned from the analysis of a large number of training images.
- the entropic coding is carried out in the following way.
- the matrix of the histogram map is scanned (e.g., column by column) so as to subdivide it into a plurality of words each having a same length x.
- a word histogram is generated including a bin for each possible value the x-tuple of the generic word may take, with the frequency of each bin that indicates the probability that the x-tuple of the word takes the value associated with such bin.
- such statistical analysis has been carried out by making the assumption that the elements of the matrix of the histogram map are independent of each another. By analyzing a very high number of training images, it can be identified which is the probability that a “1” occurs in the matrix every n “0”; then, the word histogram is generated based on such probability.
- FIG. 8A illustrates an example of a word histogram in which the length x of the words is equal to six, and wherein each bin is identified by the decimal value of the corresponding x-tuple value.
- the highest frequency corresponds to the x-tuple (0,0,0,0,0,0), since there is a very higher probability that the generic cell of the rank-1 support does not include any keypoint KP.
- the following highest probability is the one corresponding to a single keypoint KP for cell (x-tuple (1,0,0,0,0,0), (0,1,0,0,0,0), (0,0,1,0,0,0), (0,0,0,1,0,0), (0,0,0,0,1,0), (0,0,0,0,0,1)), then the one corresponding to two keypoints KP for cell, and so on.
- an entropic coding technique e.g., the Huffman technique or the Arithmetic coding technique
- the other information that can be extracted from the histogram over the rank-1 support regards the number of keypoints KP which are included in each cell of the histogram map comprising at least one keypoint KP. Such information is arranged in a corresponding histogram, referred to as histogram count. Each bin of the histogram count corresponds to a corresponding one among the cells of the rank-1 support that includes at least one keypoint KP. The histogram count lists for each bin the number of keypoints KP included in the corresponding cell.
- the histogram map of the example at issue is illustrated in FIG. 8B , wherein 11 cells includes a single keypoint KP each and two cells include two keypoints KP each.
- the bins of the histogram map of FIG. 8B are ordered following a column-wise scan of the rank-1 support.
- each coded word wj comprises a number of coded words wj equal to Nmax ⁇ 2.
- the generation of each coded word wj is carried out by performing a corresponding one among a set of Nmax ⁇ 2 procedure steps. According to an embodiment of the present invention, such procedure steps are described hereinbelow.
- Step 1 A first coded word w1 is set to include an element for each bin of the histogram map. Therefore, the first coded word w1 includes a number of elements equal to the number bins of the histogram map.
- Each element of the first coded word w1 is set to a first value (e.g., “1”) if the corresponding bin of the histogram count corresponds to a number of keypoints KP higher than one, otherwise is set to a second value (e.g., “0”). If Nmax is higher than 2, a second step is performed for generating a second coded word w2, otherwise the process is termined. In the latter case, the whole information provided by the histogram count results to be coded with the first coded word w1 only.
- Step j (j>1)—A j-th coded word wj is generated.
- the j-th coded word wj is set to include an element for each bin of the histogram map including more than j keypoints KP. Therefore, the j-th coded word wj includes a number of elements equal to or lower than the j ⁇ 1 coded word w(i ⁇ 1).
- Each element of the j-th coded word wj is set to the first value if the corresponding bin of the histogram count corresponds to a number of keypoints KP higher than j, otherwise is set to the second value.
- Nmax is higher than j+1, a (j+1)-th step is performed, for generating a (j+1)-th coded word w(j+1), otherwise the process is termined. In the latter case, the whole information provided by the histogram count is coded with the coded words w1-wj.
- the compression operations carried out in phase 150 of the extraction procedure 100 allow to obtain for the coordinates C of the keypoints KP belonging to the subset SUB a corresponding compressed coordinate set CC comprising:
- the amount of data required for managing (memorizing and/or transmitting) the compressed coordinate set CC is sensibly lower than the amount of data required for managing the set of (uncompressed) coordinates C.
- FIG. 9 illustrates in terms of functional blocks an image analysis procedure according to an embodiment of the present invention, hereinafter referred to as “matching procedure” and identified with the reference 900 , directed to perform the comparison between two images I 1 , 12 , by exploiting for each image a respective optimal subset of keypoints and the corresponding compressed descriptors and coordinates generated with the extraction procedure 100 of FIG. 1 .
- each processing unit may be a hardware unit specifically designed to perform one or more steps of the procedure.
- a possible scenario may provide for a user (client side) which desires to exploit an image comparison service (server side) for comparing the image I 1 with the image I 2 .
- the images I 1 and I 2 may be processed at the client according to the extraction procedure 100 of FIG. 1 for the generation of the optimal subset of keypoints and the corresponding compressed descriptors and coordinates; then, the optimal subset of keypoints and the corresponding compressed descriptors and coordinates are sent to the server, which performs the matching procedure 900 exploiting the received data and then provides the results to the client.
- the extraction procedure 100 may be carried out by processing units located at the client, e.g., by means of a user's smartphone, while the matching procedure 900 may be carried out by processing units located at the server, e.g., by means of one or more server units adapted to offer image comparison services.
- Another possible scenario may provide instead that the matching procedure 900 is directly performed at the client.
- Mixed scenarios are also contemplated, in which the matching procedure 900 is carried out at the client with the compressed descriptors and coordinates sent by the server.
- the compressed coordinates of the image I 1 are identified with reference CC 1 , while the compressed descriptors of the image I 1 are identified with reference CDA 1 .
- the compressed coordinates of the image I 2 are identified with reference CC 2 , while the compressed descriptors of the image I 2 are identified with reference CDA 2 .
- the compressed descriptors CDA 1 of the first image I 1 are decompressed in order to retrieve corresponding (decompressed) descriptors D 1 (phase 902 ).
- the compressed descriptors CDA 2 of the second image I 2 are decompressed in order to retrieve corresponding (decompressed) descriptors D 2 (phase 904 ).
- the decompression of the descriptors may be carried out by means of reversed versions of the compression operations performed in phase 140 of the extraction procedure 100 . Making reference to descriptors of the SIFT type, after phases 902 and 904 the descriptors D 1 and D 2 are thus represented by corresponding descriptor arrays formed by 128 sub-elements se(h).
- matches among descriptors D 1 of the first image I 1 and descriptors D 2 of the second image I 2 are formed by exploiting any one among the feature matching algorithms known in the art, such as for example the Euclidean distance ratio test.
- phase 908 geometric verification operations are performed for ascertaining which matches among those formed at phase 906 are correct (inliers) and which matches are uncorrected (outliers).
- an operation of this type requires, in addition to the descriptors, the coordinates of each keypoint whose corresponding descriptor has been matched with the descriptor of another one keypoint.
- the compressed coordinates CC 1 of image I 1 and the compressed coordinates CC 2 of the image I 2 should be decompressed as well, for example by means of reversed versions of the compression operations performed in phase 150 of the extraction procedure 100 .
- the phase dedicated to the decompression of the compressed coordinates CC 1 is identified in FIG.
- the geometric verification may provide as a result a parameter DOM indicative of the degree of match between image I 1 and I 2 . For example, if such parameter DOM is higher than a predetermined threshold, the images I 1 and I 2 are pondered to depict a same object(s)/scene(s).
- phase 914 may be further carried out for retrieving the location(s) L of such same object(s)/scene(s) within the two images I 1 , I 2 .
- the matching procedure 900 is configured to operate with a reduced number of keypoints (only the ones belonging to the subset SUB generated by means of the extraction procedure 100 ), and since the descriptors and the coordinates of such reduced number of keypoints are received in a compressed way, with the proposed solution the overall amount of data to be sent from the client to the server is drastically reduced compared to the known solutions.
- FIG. 10 illustrates in terms of functional blocks an image analysis procedure according to an embodiment of the present invention, hereinafter referred to as “retrieval procedure” and identified with the reference 1000 , in which a query image—such as the query image 115 of FIG. 1 —depicting an object/scene to be recognized is compared with a plurality of model images—each one depicting a respective known object/scene—stored in a model database, in order to retrieve the model image(s) depicting the same object/scene depicted in the query image.
- a query image such as the query image 115 of FIG. 1
- model images each one depicting a respective known object/scene
- each processing unit may be a hardware unit specifically designed to perform one or more steps of the procedure.
- a typical scenario may provide for an user (client side) which desires to exploit an image recognition service (server side) in order to automatically recognize an object/scene depicted in a query image 115 .
- the query image 115 may be processed at the client according to the extraction procedure 100 of FIG.
- the optimal subset of keypoints and the corresponding compressed descriptors and coordinates are sent to the server, which performs the retrieval procedure 1000 exploiting the received data and then provides the results to the client.
- the plurality of model images to be used for the recognition of the object/scene depicted in the query image 115 are stored in a model database 1002 , which is located at server side.
- the compressed descriptors CDA are decompressed in order to retrieve corresponding (decompressed) descriptors DD (phase 1004 ).
- the decompression of the descriptors may be carried out by means of reversed versions of the compression operations performed in phase 140 of the extraction procedure 100 .
- the descriptors DD are thus represented by corresponding descriptor arrays formed by 128 sub-elements se(h).
- a standard object recognition procedure typically require the execution of comparison operations between the query image and a very high number of model images (for example, the model images included in the model database 1002 may be a few millions), such procedure is both time and memory consuming.
- a known solution provides for performing such comparison operations in two distinct phases. Instead of directly comparing the descriptors of the query image with the descriptors of all the model images, a fast, rough, comparison is preliminarly made by among visual words extracted from the query image and visual words extracted from the model images; then, the (refined) comparison of the descriptors is carried out only among the descriptors of the query image and the descriptors of a reduced set of model images chosen based on the preliminary comparison.
- a visual word is an array obtained by performing a vector quantization of a descriptor; in other words, each visual word is a codeword of a visual codebook.
- the generation of the visual words is carried out for each descriptor of the query image and each descriptor of the model images. For example, the preliminary comparison is carried out by counting the number of visual words in common between the query image and each model image. Then, for each model image, a similitude rank is calculated based on the counts of the number of visual words in common. Similar considerations apply if the similitude rank is generated by comparing the visual words using alternative methods.
- the refined comparison between descriptors may be advantageously carried out only among the query image and the model images having the highest similitude ranks (i.e., the ones having the highest numbers of visual words in common with the query image).
- This approach which is derived from the text analysis field, is also known as “ranking by means of Bag of Features (BoF)”.
- both the visual words VD and the visual words VDR should be generated using a same codebook.
- the generation of the visual words VDR of the model images may be advantageously carried out only once, and then the resulting plurality of visual words VDR may be directly stored in the model database 1002 ; alternatively, the visual words VDR may be periodically updated.
- a rank index is calculated by counting the number of visual words VDR of such model image which are also visual words VD of the query image. Such counting may be carried out using the known ranking by means of BoF implementation also known as Invertedindex. However, similar considerations apply in case different implementations are applied.
- a list is generated in which the model images of the database are sorted according to a rank index decreasing order. Then, a set SR of model images having the highest rank index values is selected for being subjected to the subsequent (refined) comparison operations.
- the number of keypoints forming the optimal subset SUB strongly influence the outcome of the ranking by means of BoF. Indeed, with a same number of considered images, the probability that the object/scene depicted in the query image 115 is also depicted in at least one of the model images belonging to the selected set SR of model images increases as the number of keypoints of the optimal subset SUB decreases. However, if such number of keypoints of the optimal subset SUB falls below a lower threshold, the performances of the procedure decrease, since the number of keypoints included in the subset SUB become too small for satisfactorily representing each image.
- a second, refined comparison is carried out between the query image 115 and the set SR of model images (phase 1010 ).
- One of the already known feature matching procedures may be employed for matching descriptors DD of the query image 115 with descriptors of the model images of the set SR (sub-phase 1012 ), e.g., by calculating Euclidean distances among the descriptors, and then a geometric verification is performed for ascertaining which matching are inliers and which are outliers (sub-phase 1014 ).
- the model image RI of the set SR depicting an object/scene depicted also in the query image 115 is retrieved at the end of the phase.
- the feature matching operations are carried out on compressed versions thereof obtained by subdividing the corresponding descriptor arrays into sub arrays and compressing each sub-array by means of a codebook based on vector quantization.
- the descriptors DD of the query image 115 are compressed at phase 1016 , for example by subdividing the corresponding descriptor arrays in four sub-arrays and compressing each one of said four sub-arrays with a respective codebook.
- the model database 1002 stores for each model image corresponding pre-calculated compressed versions thereof, which have been compressed using the same codebooks used for compressing the descriptors DD of the query image 115 .
- the feature matching (sub-phase 1012 ) can be performed in a very fast and efficient way. Indeed, since the feature matching is carried out in the compressed space (both the descriptors of the query image and of the model images are compressed), and since the number of descriptors to be considered is reduced (corresponding only to the keypoints of the optimal subset), it is possible to directly load in the main memory also the data representing the model images of the model database.
- sub-phase 1012 may be further improved by compressing the sub-arrays of each descriptor using a same codebook, using an approach similar to that used in phase 140 of the extraction procedure 100 of FIG. 1 .
- the compressed coordinates CC of the keypoints of the query image 115 should be decompressed as well (phase 1018 ).
- FIG. 11 illustrates in terms of functional blocks a procedure, hereinafter referred to as “optimized decompression procedure” and identified with the reference 1100 , directed to decompress compressed descriptor arrays CDA according to an embodiment of the present invention.
- the steps of the optimized decompression procedure 1100 may be carried out by proper processing units; for example, each processing unit may be a hardware unit specifically designed to perform one or more steps of the procedure.
- a compressed descriptor array CDA approximates the value taken by a descriptor array DA.
- the corresponding compressed descriptor array CDA comprises a compression index Cy for each sub-array SDAk of the set, wherein each compression index Cy identifies the codeword CWj of the codebook CBKy used to approximate said sub-array SDAk (see for example FIG. 4B ).
- a corresponding codeword CWj is identified—within the codebook CBKy used to approximate the sub-array SDAk—based on the value of such compression index Cy; then, following the order of the compression indexes Cy in the received compressed descriptor array CDA, the identified codewords CWj are joined to form a corresponding first decompressed descriptor array DA′ (block 1110 ).
- Such first decompressed descriptor array DA′ is a generally approximate version of the descriptor array DA the received compressed descriptor array CDA has been generated from.
- one of the reasons at the base of the difference between the first decompressed descriptor array DA′ and the descriptor array DA is the unavoidable lossy nature of the vector quantization procedure.
- each sub-array SDAk of the descriptor array DA instead of directly quantizing the entire descriptor array DA. Indeed, even if applying a distinct vector quantization to each sub-array SDAk of a descriptor array DA allows to advantageously reduce the overall amount of memory used to store the codebooks, the quantizations of each sub-array SDAk are carried out independently, without taking into account that:
- the Applicant has found that if the vector quantization is independently applied to each sub-array SDAk of the descriptor array DA, the statistical spatial correlation and the statistical angular correlation among sub-elements se(h) belonging to different sub-arrays SDAk are lost. Therefore, the overall distortion introduced by the compression/decompression operations, and thus the difference between the first decompressed descriptor array DA′ and the descriptor array DA, might be further reduced if such correlations were taken into account.
- F are arranged to counterbalance the abovementioned loss of statistical spatial and, preferably, angular correlations among sub-elements se(h) of the descriptor array caused by the subdivision in sub-arrays, in such a way to obtain a second decompressed descriptor array DA′′ (block 1120 ) which is closer (i.e., more similar) to the original descriptor array DA than the first decompressed descriptor array DA′ is.
- DA′′ DA′ Z
- each sub-element se(h)′′ of the second decompressed descriptor array DA′′ is generated by means of a linear combination of the sub-elements se(h)′ of the first decompressed descriptor array DA′.
- the elements z k,l of the compensation matrix Z are set in such a way that such linear combination of the sub-elements se(h)′ is weighted so as to reflect the statistical spatial and angular correlations occurring among the sub-elements se(h) of a generic descriptor array DA.
- the compensation matrix Z allows to represent in terms of mathematic relationships the statistical spatial and, preferably, angular correlations occurring among the sub-elements se(h) of a generic descriptor array DA which would be lost if such descriptor array was compressed by subdividing it into sub-arrays and then applying vector quantization to each sub-array.
- the values of the elements z k,l of the compensation matrix Z depend on the size and the type of the descriptor array DA, as well as on the number of sub-arrays SDAk and the type of codebooks CBKy used to obtain the compressed descriptor array CDA.
- the compensation matrix Z is generated in the following way.
- the compensation matrix Z obtained in this way shows how combining the columns of T for best approximating (in terms of ⁇ TZ ⁇ U ⁇ ) the columns of U.
- the compensation matrix Z would be nearly equal to the identity matrix.
- FIG. 13A illustrates an exemplary compensation matrix Z corresponding to a compression scheme providing for subdividing the descriptor array in four sub-arrays and using for each sub-array a codebook including 2 ⁇ 13 codewords (such as in the case illustrated in FIG. 6A ).
- FIG. 14A illustrates a further exemplary compensation matrix Z corresponding to a compression scheme providing for subdividing the descriptor array in eight sub-arrays and using for each sub-array a codebook including 2 ⁇ 11 codewords (such as in the case illustrated in FIG. 6D ).
- the elements z k,l of the compensation matrix Z having the highest values are the ones belonging to the main diagonal.
- the highest weight i.e., element z k,l
- the highest weight is precisely the one corresponding to said specific sub-element se(h)′′.
- the highest weight is precisely the element z 43,43 which multiplies the sub-element se(43)′.
- the three other elements z k,l sensibly different (higher) than zero are the elements z 35,43 , z 51,43 , and z 75,43 which multiply the sub-elements se(35)′, se(51)′ and se(75)′, respectively.
- said sub-elements se(h)′′ are advantageously set to the nearest endpoint of the range. For example, by considering that in a SIFT descriptor the sub-elements have values that typically range from 0 to 255, if the value of a sub-element se(h)′′ calculated through the compensation matrix Z is higher than 255 or lower than 0, it is set to 255 or 0, respectively.
- the proposed optimized decompression procedure is applicable to any compressed descriptor array which has been compressed by subdividing the descriptor array into sub-arrays and then by applying vector quantization to each sub-array, regardless of the way the codebooks are used.
- the proposed optimized decompression procedure is adapted to be employed in case each sub-array is compressed with a respective, different codebook (such as in the case illustrated in FIG. 4B ), as well as in case more than one sub-array are compressed exploiting a same codebook (such as in the cases illustrated in FIGS. 6A-6D ).
- the Applicant notes that in the limiting case of scalar quantization, applied when some are all sub-arrays contain only one element, the proposed optimized decompression procedure is still applicable.
Priority Applications (1)
| Application Number | Priority Date | Filing Date | Title |
|---|---|---|---|
| US14/370,133 US9412037B2 (en) | 2012-01-02 | 2012-10-12 | Method and system for image analysis based upon correlation relationships of sub-arrays of a descriptor array |
Applications Claiming Priority (6)
| Application Number | Priority Date | Filing Date | Title |
|---|---|---|---|
| ITMI2012A000004 | 2012-01-02 | ||
| ITMI20120004 | 2012-01-02 | ||
| ITMI2012A0004 | 2012-01-02 | ||
| US201261599586P | 2012-02-16 | 2012-02-16 | |
| PCT/EP2012/070321 WO2013102503A1 (en) | 2012-01-02 | 2012-10-12 | Method and system for image analysis |
| US14/370,133 US9412037B2 (en) | 2012-01-02 | 2012-10-12 | Method and system for image analysis based upon correlation relationships of sub-arrays of a descriptor array |
Publications (2)
| Publication Number | Publication Date |
|---|---|
| US20140363078A1 US20140363078A1 (en) | 2014-12-11 |
| US9412037B2 true US9412037B2 (en) | 2016-08-09 |
Family
ID=45809456
Family Applications (1)
| Application Number | Title | Priority Date | Filing Date |
|---|---|---|---|
| US14/370,133 Active US9412037B2 (en) | 2012-01-02 | 2012-10-12 | Method and system for image analysis based upon correlation relationships of sub-arrays of a descriptor array |
Country Status (6)
| Country | Link |
|---|---|
| US (1) | US9412037B2 (ko) |
| EP (1) | EP2801055B1 (ko) |
| KR (1) | KR101954395B1 (ko) |
| CN (1) | CN104160409B (ko) |
| AR (1) | AR089622A1 (ko) |
| WO (1) | WO2013102503A1 (ko) |
Cited By (2)
| Publication number | Priority date | Publication date | Assignee | Title |
|---|---|---|---|---|
| US9697233B2 (en) * | 2014-08-12 | 2017-07-04 | Paypal, Inc. | Image processing and matching |
| US11295159B2 (en) | 2018-10-18 | 2022-04-05 | Samsung Electronics Co., Ltd. | Method of extracting features from image, method of matching images using the same and method of processing images using the same |
Families Citing this family (13)
| Publication number | Priority date | Publication date | Assignee | Title |
|---|---|---|---|---|
| ITTO20120602A1 (it) * | 2012-07-09 | 2014-01-10 | Sisvel Technology Srl | Method for transforming an image descriptor based on a gradient histogram and relative image processing apparatus. |
| US9075847B2 (en) * | 2012-11-28 | 2015-07-07 | Sap Se | Methods, apparatus and system for identifying a document |
| US9756342B2 (en) | 2013-01-16 | 2017-09-05 | Huawei Technologies Co., Ltd. | Method for context based encoding of a histogram map of an image |
| ITTO20130629A1 (it) * | 2013-07-24 | 2015-01-25 | Sisvel Technology Srl | Method for encoding an image descriptor based on a gradient histogram and relative image processing apparatus |
| CN104615988A (zh) * | 2015-02-04 | 2015-05-13 | 四川中科腾信科技有限公司 | 一种图像识别方法 |
| US9846808B2 (en) * | 2015-12-31 | 2017-12-19 | Adaptive Computation, Llc | Image integration search based on human visual pathway model |
| CN107368834A (zh) * | 2016-05-12 | 2017-11-21 | 北京君正集成电路股份有限公司 | 一种方向梯度积分图存储方法及装置 |
| US10311288B1 (en) | 2017-03-24 | 2019-06-04 | Stripe, Inc. | Determining identity of a person in a digital image |
| CN107368827B (zh) * | 2017-04-01 | 2020-09-15 | 阿里巴巴集团控股有限公司 | 字符识别方法及装置、用户设备、服务器 |
| CN112020630A (zh) * | 2018-04-27 | 2020-12-01 | 北京嘀嘀无限科技发展有限公司 | 用于更新建筑物的3d模型的系统和方法 |
| EP3900340A4 (en) * | 2018-12-21 | 2022-08-17 | Zeropoint Technologies AB | EFFECTIVE COMPRESSION AND DECOMPRESSION METHODS, DEVICES AND SYSTEMS TO ACHIEVE HIGHER THROUGHPUT |
| CN117275130B (zh) * | 2023-11-17 | 2024-01-26 | 长春金融高等专科学校 | 基于人脸识别的智慧门禁验证系统 |
| CN117392038B (zh) * | 2023-12-05 | 2024-03-08 | 北京智源人工智能研究院 | 医学图像直方图均衡化方法、装置、电子设备和存储介质 |
Citations (10)
| Publication number | Priority date | Publication date | Assignee | Title |
|---|---|---|---|---|
| US5606629A (en) * | 1993-11-22 | 1997-02-25 | Nec Corporation | Figure recognition apparatus |
| US6088482A (en) * | 1998-10-22 | 2000-07-11 | Symbol Technologies, Inc. | Techniques for reading two dimensional code, including maxicode |
| US6594382B1 (en) * | 1999-11-04 | 2003-07-15 | The United States Of America As Represented By The Secretary Of The Navy | Neural sensors |
| US20030223633A1 (en) * | 2002-05-31 | 2003-12-04 | Teemu Pohjola | Method and system for compressing digital images |
| US20070195996A1 (en) * | 2006-02-22 | 2007-08-23 | Fujifilm Corporation | Characteristic point detection method, apparatus, and program |
| US20090324026A1 (en) * | 2008-06-27 | 2009-12-31 | Palo Alto Research Center Incorporated | System and method for finding a picture image in an image collection using localized two-dimensional visual fingerprints |
| US20100201550A1 (en) * | 2007-09-20 | 2010-08-12 | Yoon Sung Yong | Method and an apparatus for processing a signal |
| US20110158533A1 (en) * | 2009-12-28 | 2011-06-30 | Picscout (Israel) Ltd. | Robust and efficient image identification |
| US20120076401A1 (en) * | 2010-09-27 | 2012-03-29 | Xerox Corporation | Image classification employing image vectors compressed using vector quantization |
| US20120254573A1 (en) * | 2011-03-31 | 2012-10-04 | Jacob Yaakov Jeffrey Allan Alon | System, data structure, and method for collapsing multi-dimensional data |
Family Cites Families (3)
| Publication number | Priority date | Publication date | Assignee | Title |
|---|---|---|---|---|
| US608848A (en) * | 1898-08-09 | Ice-tongs | ||
| US560662A (en) * | 1896-05-26 | Brush | ||
| CN101986295B (zh) * | 2010-10-28 | 2013-01-02 | 浙江大学 | 基于流形稀疏编码的图像聚类的方法 |
-
2012
- 2012-10-12 US US14/370,133 patent/US9412037B2/en active Active
- 2012-10-12 CN CN201280069515.6A patent/CN104160409B/zh active Active
- 2012-10-12 EP EP12783144.4A patent/EP2801055B1/en active Active
- 2012-10-12 WO PCT/EP2012/070321 patent/WO2013102503A1/en active Application Filing
- 2012-10-12 KR KR1020147021747A patent/KR101954395B1/ko active IP Right Grant
-
2013
- 2013-01-02 AR ARP130100004A patent/AR089622A1/es active IP Right Grant
Patent Citations (10)
| Publication number | Priority date | Publication date | Assignee | Title |
|---|---|---|---|---|
| US5606629A (en) * | 1993-11-22 | 1997-02-25 | Nec Corporation | Figure recognition apparatus |
| US6088482A (en) * | 1998-10-22 | 2000-07-11 | Symbol Technologies, Inc. | Techniques for reading two dimensional code, including maxicode |
| US6594382B1 (en) * | 1999-11-04 | 2003-07-15 | The United States Of America As Represented By The Secretary Of The Navy | Neural sensors |
| US20030223633A1 (en) * | 2002-05-31 | 2003-12-04 | Teemu Pohjola | Method and system for compressing digital images |
| US20070195996A1 (en) * | 2006-02-22 | 2007-08-23 | Fujifilm Corporation | Characteristic point detection method, apparatus, and program |
| US20100201550A1 (en) * | 2007-09-20 | 2010-08-12 | Yoon Sung Yong | Method and an apparatus for processing a signal |
| US20090324026A1 (en) * | 2008-06-27 | 2009-12-31 | Palo Alto Research Center Incorporated | System and method for finding a picture image in an image collection using localized two-dimensional visual fingerprints |
| US20110158533A1 (en) * | 2009-12-28 | 2011-06-30 | Picscout (Israel) Ltd. | Robust and efficient image identification |
| US20120076401A1 (en) * | 2010-09-27 | 2012-03-29 | Xerox Corporation | Image classification employing image vectors compressed using vector quantization |
| US20120254573A1 (en) * | 2011-03-31 | 2012-10-04 | Jacob Yaakov Jeffrey Allan Alon | System, data structure, and method for collapsing multi-dimensional data |
Non-Patent Citations (11)
| Title |
|---|
| Brandt, "Transform Coding for Fast Approximate Nearest Neighbor Search in High Dimensions", 2010 IEEE Conference on Computer Vision and Pattern Recognition (CVPR), XP031725682, Jun. 2010, pp. 1815-1822. |
| Cai, et al., "Learning Weights for Codebook in Image Classification and Retrieval", 2010 IEEE Conference on Computer Vision and Pattern Recognition (CVPR), XP031725747, Jun. 2010, pp. 2320-2327. |
| Chandrasekhar, et al., "CHoG: Compressed Histogram of Gradients a Low Bit-Rate Feature Descriptor," Computer Vision and Pattern Recognition, 2009. CVPR 2009. IEEE Conference on IEEE, XP031607260, Jun. 2009, pp. 2504-2511. |
| Chandrasekhar, et al., "Survey of Sift Compression Schemes", The Second International Workshop on Mobile Multimedia Processing, XP-002631251, Aug. 2010, 8 pages. |
| Chen, et al., "Peking Compact Descriptor-PQ-SIFT", International Organisation for Standardisation, ISO/IEC JTC1/SC29/WG11, Coding of Moving Pictures and Audio, XP030051183, Nov. 2011, 24 pages. |
| International Search Report and Written Opinion of the International Searching Authority issued Jan. 31, 2013, in PCT/EP12/070321 filed Oct. 12, 2012. |
| Jegou, et al., "Product Quantization for Nearest Neighbor Search", IEEE Transactions on Pattern Analysis and Machine Intelligence, vol. 33, No. 1, XP055026005, Jan. 2011, pp. 117-128. |
| Lepsoy, et al., "Statistical Modelling of Outliers for Fast Visual Search", Multimedia and EXPO (ICME), 2011 IEEE International Conference on, IEEE, XP031964858, Jul. 2011, 6 pages. |
| Li et al. ("Keypoint based moment invariants descriptor for ground-based cloud image retrieval," ISIE 2009, Jul. 5-8, 2009). * |
| Tsai, et al., "Location Coding for Mobile Image Retrieval", Proceedings of the 5th International Mobile Multimedia Communications Conference, XP055026047, Jan. 2009, 7 pages. |
| U.S. Appl. No. 14/370,098, filed Jul. 1, 2014, Francini, et al. |
Cited By (2)
| Publication number | Priority date | Publication date | Assignee | Title |
|---|---|---|---|---|
| US9697233B2 (en) * | 2014-08-12 | 2017-07-04 | Paypal, Inc. | Image processing and matching |
| US11295159B2 (en) | 2018-10-18 | 2022-04-05 | Samsung Electronics Co., Ltd. | Method of extracting features from image, method of matching images using the same and method of processing images using the same |
Also Published As
| Publication number | Publication date |
|---|---|
| CN104160409B (zh) | 2017-12-19 |
| AR089622A1 (es) | 2014-09-03 |
| CN104160409A (zh) | 2014-11-19 |
| KR101954395B1 (ko) | 2019-03-05 |
| EP2801055A1 (en) | 2014-11-12 |
| KR20140111007A (ko) | 2014-09-17 |
| WO2013102503A1 (en) | 2013-07-11 |
| EP2801055B1 (en) | 2016-04-20 |
| US20140363078A1 (en) | 2014-12-11 |
Similar Documents
| Publication | Publication Date | Title |
|---|---|---|
| US9412037B2 (en) | Method and system for image analysis based upon correlation relationships of sub-arrays of a descriptor array | |
| US9373056B2 (en) | Image analysis | |
| EP2842106B1 (en) | Method and system for image analysis | |
| Kekre et al. | Improved texture feature based image retrieval using Kekre’s fast codebook generation algorithm | |
| US9349072B2 (en) | Local feature based image compression | |
| US8660360B1 (en) | System and method for reduced incremental spectral clustering | |
| JP2014029732A (ja) | 画像の検索および読み出しに関する基準を用いて画像内容の描写を生成する方法 | |
| US8687892B2 (en) | Generating a binary descriptor representing an image patch | |
| WO2011054002A2 (en) | Content-based image search | |
| CN110442749B (zh) | 视频帧处理方法及装置 | |
| KR100464224B1 (ko) | 화상처리방법 및 그 장치, 기억매체 | |
| CN112184843A (zh) | 图像数据压缩的冗余数据去除系统及方法 | |
| CN116863155A (zh) | 仓内物品识别方法、装置、设备及存储介质 | |
| Sudeep et al. | Improved texture feature based image retrieval using Kekre’s fast codebook generation algorithm |
Legal Events
| Date | Code | Title | Description |
|---|---|---|---|
| AS | Assignment |
Owner name: TELECOM ITALIA S.P.A., ITALY Free format text: ASSIGNMENT OF ASSIGNORS INTEREST;ASSIGNORS:BALESTRI, MASSIMO;FRANCINI, GIANLUCA;LEPSOY, SKJALG;REEL/FRAME:033222/0421 Effective date: 20130122 |
|
| STCF | Information on status: patent grant |
Free format text: PATENTED CASE |
|
| MAFP | Maintenance fee payment |
Free format text: PAYMENT OF MAINTENANCE FEE, 4TH YEAR, LARGE ENTITY (ORIGINAL EVENT CODE: M1551); ENTITY STATUS OF PATENT OWNER: LARGE ENTITY Year of fee payment: 4 |
|
| MAFP | Maintenance fee payment |
Free format text: PAYMENT OF MAINTENANCE FEE, 8TH YEAR, LARGE ENTITY (ORIGINAL EVENT CODE: M1552); ENTITY STATUS OF PATENT OWNER: LARGE ENTITY Year of fee payment: 8 |