US8873827B2 - Determination of spatial proximity between features of interest in biological tissue - Google Patents
Determination of spatial proximity between features of interest in biological tissue Download PDFInfo
- Publication number
- US8873827B2 US8873827B2 US13/539,187 US201213539187A US8873827B2 US 8873827 B2 US8873827 B2 US 8873827B2 US 201213539187 A US201213539187 A US 201213539187A US 8873827 B2 US8873827 B2 US 8873827B2
- Authority
- US
- United States
- Prior art keywords
- morphological
- biomarker
- units
- expression levels
- biological tissue
- Prior art date
- Legal status (The legal status is an assumption and is not a legal conclusion. Google has not performed a legal analysis and makes no representation as to the accuracy of the status listed.)
- Active, expires
Links
Images


Classifications
-
- G—PHYSICS
- G06—COMPUTING; CALCULATING OR COUNTING
- G06T—IMAGE DATA PROCESSING OR GENERATION, IN GENERAL
- G06T7/00—Image analysis
- G06T7/0002—Inspection of images, e.g. flaw detection
- G06T7/0012—Biomedical image inspection
-
- G—PHYSICS
- G06—COMPUTING; CALCULATING OR COUNTING
- G06T—IMAGE DATA PROCESSING OR GENERATION, IN GENERAL
- G06T2207/00—Indexing scheme for image analysis or image enhancement
- G06T2207/10—Image acquisition modality
- G06T2207/10056—Microscopic image
-
- G—PHYSICS
- G06—COMPUTING; CALCULATING OR COUNTING
- G06T—IMAGE DATA PROCESSING OR GENERATION, IN GENERAL
- G06T2207/00—Indexing scheme for image analysis or image enhancement
- G06T2207/30—Subject of image; Context of image processing
- G06T2207/30004—Biomedical image processing
- G06T2207/30024—Cell structures in vitro; Tissue sections in vitro
Definitions
- Oxygenation in human tissues ranges from two to nine percent. Hypoxia is characterized by oxygen levels of less than two percent. Differing oxygenation has well established effects on physiology, including cancer progression and tissue ischemia in stroke. Due to irregular vascular function in many diseases, hypoxia occurs. The degree to which hypoxia varies as a function of distance from vasculature is highly variable due to differences in vascular malformation or injury, as well as inherent differences in diffusion of dissolved oxygen in different tissues. Direct measurement of tissue oxygenation in fixed surgically removed structures, however, is not possible.
- the inventors of the present invention recognized that quantitative spatial characterization of hypoxia, and other conditions that can be characterized by at least one biomarker expression level, would advance the understanding of basic disease biology and improve the understanding of the diffusion of drugs into tissue.
- spatial characterization may be applied to characterize the extent of malformation in proliferative diseases such as cancer.
- a computer-implemented method for determining a relationship between biomarker expression levels of morphological units in biological tissue and their spatial distance from a morphological feature.
- the method includes identifying a morphological feature in an image of the biological tissue based on expression levels of a first biomarker indicative of the morphological feature.
- the method includes receiving a result of a segmentation analysis performed on the image of the biological tissue.
- the result of the segmentation analysis identifies a first set of morphological units in the image external to the morphological feature, where the first set of morphological units includes cells and/or sub-cellular components.
- the method also includes determining an expression level of a second biomarker corresponding to each unit in the first set of morphological units in the image of the biological tissue, and determining a spatial distance between the morphological feature and each unit in the first set of morphological units.
- the method further includes automatically rendering, on a user interface displayed on a visual display device, a representation of a relationship between the expression levels of the second biomarker and the corresponding spatial distance from the morphological feature of the first set of morphological units.
- a computer system for determining a relationship between biomarker expression levels of morphological units in biological tissue and their spatial distance from a morphological feature.
- the system includes a storage device and a processor.
- the processor is configured to identify a morphological feature in an image of biological tissue based on expression levels of a first biomarker indicative of the morphological feature.
- the processor is configured to receive a result of a segmentation analysis performed on the image of the biological tissue.
- the result of the segmentation analysis identifies a first set of morphological units in the image external to the morphological feature, where the first set of morphological units includes cells and/or sub-cellular components.
- the processor is also configured to determine an expression level of a second biomarker corresponding to each unit in the first set of morphological units in the image of the biological tissue, and to determine a spatial distance between the morphological feature and each unit in the first set of morphological units.
- the processor is further configured to determine a representation of a relationship between the expression levels of the second biomarker and the corresponding spatial distance from the morphological feature of the first set of morphological units, and to store a representation of the relationship on the storage device.
- one or more computer-readable media having encoded thereon one or more computer-executable instructions for determining a relationship between biomarker expression levels of morphological units in biological tissue and spatial distance from a morphological feature.
- the one or more instructions include instructions for identifying a morphological feature in an image of the biological tissue based on expression levels of a first biomarker indicative of the morphological feature.
- the one or more instructions include instructions for receiving a result of a segmentation analysis performed on the image of the biological tissue. The result of the segmentation analysis identifies a first set of morphological units in the image external to the morphological feature, where the first set of morphological units includes cells and/or sub-cellular components.
- FIG. 1 is a block diagram of exemplary computing system components that may be used to perform exemplary methods.
- FIG. 2 illustrates an image of a microscope field-of-view of stained biological tissue.
- FIG. 4 illustrates an exemplary data structure for storing spatial distance information corresponding to biological tissue.
- FIG. 5 illustrates an exemplary visualization of spatial distance information corresponding to biological tissue.
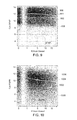
- FIGS. 7-9 illustrate graphs generated by exemplary embodiments showing expression levels of different structural biomarkers represented on the y-axis and different spatial distances from blood vessels represented on the x-axis.
- FIGS. 10-20 are graphs generated by exemplary embodiments showing expression levels of different non-structural biomarkers represented on the y-axis and different spatial distances from blood vessels represented on the x-axis.
- FIG. 21 is a block diagram of an exemplary computing device that may be used to implement exemplary embodiments.
- a representation of the relationship between the expression level of a biomarker (e.g., a protein) and the distance from a given morphological structure (e.g., the nearest blood vessel) is generated on a visual display device.
- a graphical plot may be generated in which a first axis represents the distance of each cell from the nearest blood vessel, and a second axis represents the expression in the cells of one or more biomarkers.
- a two-dimensional probability density or scatterplot may be generated from the cell data and placed in the plot space.
- one or more curves may be overlaid in the plot space to represent the expression level of the biomarker at a user-specified percentile level (for example, median, 10%, 90%) at one or more distances from the blood vessel. Exemplary embodiments thereby enable convenient, quick and efficacious review of differences between the different cells based on their spatial distance from the nearest blood vessel.
- Exemplary morphological features may include, but are not limited to, one or more blood vessels, one or more immune cells, one or more cancer cells, one or more tumor cells, one or more epithelial cells, one or more extra-cellular matrix components, and the like.
- the tissue sample may also be part of a group of specimens of similar tissue from different subjects, known as a cohort. These groups of tissue samples may represent one or more disease or condition models, different stages within a disease or condition model, or one or more responses to treatment of a disease or condition.
- Images of each stained field-of-view are generated through known techniques, such as with a digital camera coupled with an appropriate microscope and appropriate quality control routines. Automated image registration and analysis may also be used to quantify the biomarker concentration levels for individual delineated cells, or even sub-cellular compartments, such as nucleus, cytoplasm, and membrane.
- the data values resulting from the multiplexing and image analysis of cells may be stored alone or in conjunction with results of further analysis.
- a database may preserve the identity of the measurement of strength of the biomarker expression including the tissue and the location within the tissue from which it was drawn. The location may indicate the particular cell and/or tissue from which a particular measurement was drawn, and may also include the compartment, nucleus, cytoplasm or membrane, associated with the measurement.
- the information may be stored in a database, which may be maintained in the storage device 102 or in a network device.
- the computer system 100 may include or be connectable to a visual display device 114 for rendering visualizations generated by the visualization generation module 124 .
- Exemplary embodiments may store, in a suitable data structure, information on the expression levels of one or more biomarkers at the level of one or more morphological units, and information on the spatial distance of the morphological units from a morphological feature of interest.
- FIG. 4 illustrates an exemplary data structure 400 for storing spatial distance information corresponding to biological tissue.
- the morphological units may be, for example, individual cells or sub-cellular components (e.g., individual cytoplasms, individual membranes, individual nuclei). Each row in the table 400 may represent and contain information on a separate morphological unit.
- Exemplary columns in table 400 include a column 402 for identifying different morphological units in biological tissue.
- the table 400 may include one or more columns 404 for representing the spatial distance of each morphological unit from one or more morphological features.
- the spatial distances may be represented in any suitable unit, for example, average cell radii, pixels, microns, and the like.
- the table 400 may include one or more columns 406 for indicating whether each morphological unit is part of one or more morphological features of interest.
- the column 406 may indicate whether each morphological unit represented is part of a blood vessel. Any suitable classification technique, for example, intensity thresholding, may be used to determine morphological units in the biological tissue that are part of the morphological feature of interest.
- the table 400 may include one or more columns 408 , 410 for representing unit-level expression levels of one or more biomarkers for each morphological unit represented.
- table 400 may have two or more dimensions.
- table 400 may have two or more dimensions.
- any suitable data structure including and other than tables, may be used to store data in exemplary embodiments.
- Exemplary embodiments may analyze the data stored in the data structure to visualize and render information on the expression levels of one or more biomarkers at the level of one or more morphological units, and information on the spatial distance of the morphological units from a morphological feature of interest.
- expression levels of a single biomarker in morphological units may be visualized and/or analyzed with respect to spatial distance from a morphological feature of interest.
- expression levels of two or more biomarkers in morphological units may be visualized and/or analyzed with respect to spatial distance from a morphological feature of interest.
- Expression levels of a plurality of biomarkers may be associated with and/or indicative of a particular biological or physiological characteristic of interest.
- a disease may be indicated by the co-localization of high expression levels of two or more biomarkers in morphological units.
- a relationship between the disease and distance from a morphological feature of interest may be determined by analyzing and/or visualizing expression levels of the two or more biomarkers with increasing and/or decreasing spatial distance from the morphological feature of interest.
- FIG. 5 illustrates an exemplary visualization of spatial distance information corresponding to biological tissue.
- FIG. 5 is a graph of expression levels of non-structural biomarker for smooth muscle actin (SMA) along the y-axis (in units of log 2 of the fluorescence intensity measurements of the biomarker expression) and distances from the nearest blood vessel along the x-axis (in units of average cell radii).
- SMA smooth muscle actin
- a scatterplot 502 of the distribution of morphological units is plotted in the x-y space
- a curve 504 is plotted representing the median expression level of SMA over different distance values
- a curve 506 is plotted representing the 90 th percentile expression level of SMA over different distance values
- a curve 508 is plotted representing the 10 th percentile expression level of SMA over different distance values.
- a graph may be plotted with a first axis representing a combination of the expression levels of a plurality of biomarkers at the level of a morphological unit, and a second axis representing the spatial distance from each morphological unit to a morphological feature of interest.
- Expression levels of the plurality of biomarkers may be associated with and/or indicative of a particular biological or physiological characteristic of interest. For example, a disease may be indicated by the co-localization of high expression levels of two or more biomarkers.
- the expression levels of a plurality of biomarkers may be combined in any suitable way, for example, as an average, as a weighted average, and the like. This exemplary visualization enables viewing how the expression levels of multiple biomarkers changes with increasing or decreasing distance from a morphological feature of interest.
- multidimensional graphs may be plotted to visualize and render information on the expression levels of a plurality of biomarkers at the level of one or more morphological units, and information on the spatial distance of the morphological units from a morphological feature of interest.
- a graph may have a first axis representing expression levels of a first biomarker at the level of a morphological unit, a second axis representing expression levels of a second biomarker, and a third axis representing the spatial distance from each morphological unit to a morphological feature of interest.
- a relationship between the spatial distance from a morphological feature and expression levels of one or more biomarkers may be determined and/or visualization. Any suitable relationship may be determined between the biomarker expression levels and corresponding spatial distances from a morphological feature of interest. An exemplary relationship may be determined based on a correlation analysis to generate a negative correlation, a positive correlation or a lack of correlation between the biomarker expression levels and corresponding spatial distances. In one example, exemplary embodiments may determine that the expression levels of a particular biomarker increases with increasing spatial proximity to a blood vessel.
- expression levels of a first biomarker may be analyzed in a first set of morphological units including spatial distances from the units to a morphological feature of interest.
- Exemplary embodiments may determine a collection of units within the first set of units in which expression levels of the first biomarker satisfy one or more predetermined criteria.
- Exemplary embodiments may render a representation of the collection of units at different distances from the morphological feature of interest.
- expression levels of first and second biomarkers may be analyzed in a first set of morphological units including spatial distances from the units to a morphological feature of interest.
- Exemplary embodiments may determine a collection of units within the first set of units in which expression levels of the first and second biomarkers satisfy one or more predetermined criteria.
- Exemplary embodiments may render a representation of the collection of units at different distances from the morphological feature of interest.
- step 602 data corresponding to an image of biological tissue—stained to reveal expression of one or more biomarkers in the biological tissue—is accessed.
- an image of biological tissue is received.
- FIG. 2 illustrates an exemplary image of biological tissue stained to reveal expression levels of biomarker CD31 that indicates blood vessels.
- exemplary embodiments may analyze the image data of the biological tissue to automatically identify a morphological feature of interest based on the expression levels of at least one biomarker that are indicative of the morphological feature.
- vascular structures for example, blood vessels
- detection of high expression levels of the biomarker CD31 in the image indicates the presence of one or more vascular structures in the biological tissue.
- CD31 is a membrane protein that is constitutively expressed on the surface of endothelial cells. Because blood vessels are lined with endothelial cells, high expression levels of CD31 indicate the presence of blood vessels.
- FIG. 2 illustrates an exemplary image of biological tissue in which a blood vessel 200 is identified based on high expression levels of biomarker CD31.
- exemplary embodiments may perform segmentation analysis on the image of biological tissue to identify one or more morphological units in the image.
- the results of a segmentation analysis of the image of biological tissue are received.
- the results identify a set of morphological units in the image.
- Exemplary morphological units identified by the segmentation analysis may include, but are not limited to, cells, sub-cellular components (e.g., nuclei, cytoplasms, membranes), extra-cellular components (e.g., matrix proteins), multi-cellular components, and the like.
- the results of a segmentation analysis performed on the image of biological tissue may be received. Any suitable image segmentation technique may be used and exemplary embodiments are not limited by any specific image segmentation technique.
- a morphological unit in the biological tissue may be determined to be part of the morphological feature of interest if the expression levels of one or more biomarkers in the unit satisfy one or more predetermined criteria. For example, if the expression level of the biomarker CD31 in a morphological unit is above a predetermined level, the morphological unit may be determined to be part of a blood vessel.
- a morphological unit in the biological tissue may be determined to be part of the morphological feature of interest based on a comparison between the expression level of one or more biomarkers in the unit and the expression level of the biomarkers in a collection of units in the image of biological tissue. For example, if the expression level of the biomarker CD31 in a morphological unit is exactly or approximately at or above the 90 th percentile among all morphological units in the image of biological tissue, the morphological unit may be determined to be part of a blood vessel.
- exemplary embodiments may determine expression levels of one or more biomarkers of interest in a set of morphological units at the level of morphological units in the image of biological tissue.
- the set of morphological units may be disposed outside the morphological feature identified in step 604 .
- the expression levels used in exemplary embodiments are granular at the level of a morphological unit of interest, and not at the pixel level. That is, exemplary embodiments enable determination and visualization of expression levels at the cell-level, membrane-level, nucleus-level, and the like.
- Steps 610 - 614 illustrate an exemplary method 608 for determining expression levels of one or more biomarkers of interest in a set of morphological units at the level of morphological units.
- exemplary embodiments may receive an identification of one or more types of morphological units (e.g., cell, membrane, cytoplasm, nucleus) so that biomarker expression will be analyzed and/or visualized at the level of the morphological unit.
- the identification of the type of morphological unit may be received from a user, may be predetermined, or may be automatically determined (for example, based on the biomarker to be analyzed and/or visualized).
- exemplary embodiments may determine which pixels in the image of biological tissue fall within separate morphological units.
- exemplary embodiments may determine that a first set of image pixels represent a first nucleus, while a second set of image pixels represent a second nucleus in the biological tissue.
- the pixel-level data received from the segmentation analysis may be used to generate biomarker expression data at the level of the selected morphological unit.
- exemplary embodiments may determine and/or visualize a first expression level for a first biomarker representative of a first nucleus, and a second expression level for the first biomarker representative of a second nucleus in the biological tissue. Any suitable technique may be used to determine expression levels at the level of morphological units.
- the expression levels of a biomarker at all image pixels corresponding to a selected morphological unit may be combined using any suitable technique (e.g., mean, median, mean+(T*standard deviation, where T is a suitable multiplier), and the like) to determine the unit-level expression level of the biomarker.
- certain conventional systems analyze and visualize biomarker expression at the pixel-level, and not at the level of the morphological units in biological tissue.
- the use of cell-level or compartment-level biomarker expression in exemplary embodiments is advantageous over the use of pixel-level biomarker expression in conventional systems.
- the use of cell-level or compartment-level data enables the determination of how cell-level or compartment-level properties vary with spatial distance from a morphological feature. These cell-level or compartment-level properties may be exhibited as biomarker expression levels and, therefore, cell-level or compartment-level biomarker expression is essential in accurate and meaningful analysis of biological units and their properties.
- biomarker expression may be determined and/or visualized at the cell-level and may be restricted to all cells in the biological tissue or to particular groups or types of cells in the biological tissue.
- biomarker expression may be determined and/or visualized at the membrane-level and may be restricted to only the membranes in the biological tissue.
- biomarker expression may be determined and/or visualized at the nucleus-level and may be restricted to only the nuclei in the biological tissue.
- biomarker expression may be determined and/or visualized at the cytoplasm-level and may be restricted to only the cytoplasms in the biological tissue. Restriction of biomarker expression analysis and/or visualization to certain groups or types of morphological units in the biological tissue enables determination of relationships between spatial distance and specific features and morphologies in the biological tissue.
- implementing translocation, analysis and/or visualization of biomarker expression may be based on a plurality of morphological unit types, for example, a ratio between expression levels of a biomarker in membranes to expression levels of the biomarker in nuclei.
- exemplary embodiments enable determination and/or visualization of how the expression levels in membranes to nuclei vary at different spatial distances from a morphological feature of interest.
- exemplary embodiments enable within-cell heterogeneity metrics to analyze biomarker expression inside the cell compartment.
- the average biomarker expression in the membrane may be compared to the average biomarker expression in the nucleus, and each or both the expressions may be analyzed with respect to spatial distance from a morphological feature of interest (e.g., the nearest blood vessel).
- Exemplary embodiments may determine that a morphological unit-level expression data does not conform to a predetermined expression level or a predetermined range of expression levels characteristic of the type of a morphological unit. This may thereby enable determination that the expression levels are a result of non-specific staining. For example, if a biomarker is not typically expressed in cell membranes, expression of the biomarker at the membrane-level may be analyzed to determine that the expression is due to non-specific staining and should be ignored. Exemplary embodiments may take one or more actions based on the determination of non-specific staining, for example, deletion of data that results from non-specific staining, ignoring the data resulting from non-specific staining, and the like.
- exemplary embodiments may determine a spatial distance between the morphological feature of interest and each morphological unit in the set of morphological units analyzed in step 608 .
- the spatial distance may be determined in terms of pixels between the centroid pixels of two biological units, and then converted into a distance unit, for example, microns.
- Any suitable image processing technique may be used in step 616 , for example, those described in Borgefors, G. “Distance Transformations in Digital Images,” Computer Vision, Graphics and Image Processing, 34:344-371, 1986; and Rosenfeld, A. and Pfalz, J. L., “Distance Functions on Digital Pictures,” Pattern Recognition, 1:33-61, 1968, the entire contents of which are incorporated herein in their entirety by reference.
- exemplary embodiments may determine a relationship between the expression levels of the biomarkers determined in step 608 and the spatial distances determined in step 616 .
- a relationship may be determined between the expression levels of a biomarker in cells (i.e., a set of morphological units) and the spatial proximity of the cells from a blood vessel (i.e., a morphological feature of interest).
- Exemplary embodiments enable continuous expression level tracking so that a relationship between biomarker expression levels and spatial distance may be determined or tracked over continuous expression levels.
- Exemplary embodiments also enable continuous distance tracking so that a relationship between biomarker expression levels and spatial distance may be determined or tracked over continuous distances and at any user-specified distance from a morphological feature.
- continuous distance tracking of morphological units from a morphological feature may be implemented by separately analyzing a first set of morphological units that are at the morphological feature and a second set of morphological units that are outside the boundary of the morphological feature.
- quantile regression methods for determining the units at a predetermined biomarker expression percentile analysis of the first and second sets of morphological units together can results in discontinuities and inaccuracies. The separate analysis of the first and second sets of morphological units avoids any discontinuities in the regression analysis results.
- Any suitable relationship may be determined between the biomarker expression levels and corresponding spatial distances from a morphological feature of interest.
- An exemplary relationship may be determined based on a correlation analysis to generate a negative correlation, a positive correlation or a lack of correlation between the biomarker expression levels and corresponding spatial distances.
- exemplary embodiments may determine that the expression levels of a particular biomarker increases with increasing spatial proximity to a blood vessel.
- Another exemplary relationship may be determined by charting the distribution of morphological units (e.g., cells) over differential spatial distances from a morphological feature and over differential expression levels of one or more biomarkers.
- An exemplary distribution may be charted on a scatterplot with a first axis representing different expression levels of a biomarker, a second axis representing different spatial distances from the morphological feature, and morphological units charted in the space of the graph.
- Another exemplary distribution may be charted on a histogram with a first axis representing different expression levels of a biomarker, a second axis representing different spatial distances from the morphological feature, and morphological units charted in the space of the graph.
- the density of morphological units in the space of the graph may be shown as the darkness of a color shading.
- Exemplary biomarker expression percentiles usable in exemplary embodiments may include, but are not limited to, 0%, 5%, 10%, 15%, 20%, 25%, 30%, 35%, 40%, 45%, 50%, 55%, 60%, 65%, 70%, 75%, 80%, 85%, 90%, 95%, 100%, and any numbers therebetween.
- Any suitable technique may be used to determine the biomarker expression level at any desired percentile over an image of biological tissue or over all biological tissue for a cohort. Any suitable technique may be used to determine the number of morphological units at any desired biomarker expression percentile over an image of biological tissue or over all biological tissue for a cohort.
- An exemplary technique is a quantile smoothing method called “constrained b-spline smoothing” described in and available at Ng P.
- a representation of the relationship determined in step 618 may be rendered on a user interface displayed on a visual display device.
- the relationship or a representation of the relationship determined in step 618 may be saved or stored on one or more non-transitory storage devices.
- FIGS. 7-9 illustrate graphs generated by exemplary embodiments showing expression levels of different structural biomarkers represented on the y-axis and different spatial distances from blood vessels represented on the x-axis.
- Each graph shows a scatterplot of the distribution of cells in the x-y space, thereby illustrating a density of cells at different spatial distances from blood vessels and exhibiting different biomarker expression levels.
- Each graph also illustrates a continuous or discontinuous curve charting the median expression level of the biomarker at different spatial distances from the blood vessel.
- Each graph also illustrates a curve charting the 90 th percentile expression level of the biomarker and a curve charting the 10 th percentile expression level of the biomarker at different spatial distances from the blood vessel.
- FIG. 7 is a graph of expression levels of structural biomarker Na + /K + -ATPase (NaKATPase) along the y-axis and distances from the nearest blood vessel along the x-axis.
- FIG. 7 illustrates a scatterplot 702 of the distribution of cells in the x-y space, a curve 704 representing the median expression level of NaKATPase over different distance values, a curve 706 representing the 90 th percentile expression level of NaKATPase over different distance values, and a curve 708 representing the 10 th percentile expression level of NaKATPase over different distance values.
- FIG. 8 is a graph of expression levels of structural biomarker S6 40S ribosomal protein (S6) along the y-axis and distances from the nearest blood vessel along the x-axis.
- FIG. 8 illustrates a scatterplot 802 of the distribution of cells in the x-y space, a curve 804 representing the median expression level of S6 over different distance values, a curve 806 representing the 90 th percentile expression level of S6 over different distance values, and a curve 808 representing the 10 th percentile expression level of S6 over different distance values.
- FIG. 9 is a graph of expression levels of structural biomarker glial fibrillary acidic protein (GFAP) along the y-axis and distances from the nearest blood vessel along the x-axis.
- FIG. 9 illustrates a scatterplot 902 of the distribution of cells in the x-y space, a curve 904 representing the median expression level of GFAP over different distance values, a curve 906 representing the 90 th percentile expression level of GFAP over different distance values, and a curve 908 representing the 10 th percentile expression level of GFAP over different distance values.
- GFAP structural biomarker glial fibrillary acidic protein
- FIG. 10 is a graph of expression levels of non-structural biomarker epidermal growth factor receptor (EGFR) along the y-axis and distances from the nearest blood vessel along the x-axis.
- FIG. 10 illustrates a scatterplot 1002 of the distribution of cells in the x-y space, a curve 1004 representing the median expression level of EGFR over different distance values, a curve 1006 representing the 90 th percentile expression level of EGFR over different distance values, and a curve 1008 representing the 10 th percentile expression level of EGFR over different distance values.
- EGFR non-structural biomarker epidermal growth factor receptor
- FIG. 11 is a graph of expression levels of non-structural biomarker pS6 along the y-axis and distances from the nearest blood vessel along the x-axis.
- FIG. 11 illustrates a scatterplot 1102 of the distribution of cells in the x-y space, a curve 1104 representing the median expression level of pS6 over different distance values, a curve 1106 representing the 90 th percentile expression level of pS6 over different distance values, and a curve 1108 representing the 10 th percentile expression level of pS6 over different distance values.
- FIG. 12 is a graph of expression levels of non-structural biomarker phosphorylated epidermal growth factor receptor (pEGFR) along the y-axis and distances from the nearest blood vessel along the x-axis.
- FIG. 12 illustrates a scatterplot 1202 of the distribution of cells in the x-y space, a curve 1204 representing the median expression level of pEGFR over different distance values, a curve 1206 representing the 90 th percentile expression level of pEGFR over different distance values, and a curve 1208 representing the 10 th percentile expression level of pEGFR over different distance values.
- pEGFR non-structural biomarker phosphorylated epidermal growth factor receptor
- FIG. 13 is a graph of expression levels of non-structural biomarker for smooth muscle actin (SMA) along the y-axis and distances from the nearest blood vessel along the x-axis.
- FIG. 13 illustrates a scatterplot 1302 of the distribution of cells in the x-y space, a curve 1304 representing the median expression level of SMA over different distance values, a curve 1306 representing the 90 th percentile expression level of SMA over different distance values, and a curve 1308 representing the 10 th percentile expression level of SMA over different distance values.
- SMA smooth muscle actin
- FIG. 14 is a graph of expression levels of non-structural biomarker phosphatase and tensin homolog (PTEN) along the y-axis and distances from the nearest blood vessel along the x-axis.
- FIG. 14 illustrates a scatterplot 1402 of the distribution of cells in the x-y space, a curve 1404 representing the median expression level of PTEN over different distance values, a curve 1406 representing the 90 th percentile expression level of PTEN over different distance values, and a curve 1408 representing the 10 th percentile expression level of PTEN over different distance values.
- FIG. 15 is a graph of expression levels of non-structural biomarker forkhead box O3 (FOXO3a) along the y-axis and distances from the nearest blood vessel along the x-axis.
- FIG. 15 illustrates a scatterplot 1502 of the distribution of cells in the x-y space, a curve 1504 representing the median expression level of FOXO3a over different distance values, a curve 1506 representing the 90 th percentile expression level of FOXO3a over different distance values, and a curve 1508 representing the 10 th percentile expression level of FOXO3a over different distance values.
- FOXO3a non-structural biomarker forkhead box O3
- FIG. 16 is a graph of expression levels of non-structural biomarker pSMAD2/3 along the y-axis and distances from the nearest blood vessel along the x-axis.
- FIG. 16 illustrates a scatterplot 1602 of the distribution of cells in the x-y space, a curve 1604 representing the median expression level of pSMAD2/3 over different distance values, a curve 1606 representing the 90 th percentile expression level of pSMAD2/3 over different distance values, and a curve 1608 representing the 10 th percentile expression level of pSMAD2/3 over different distance values.
- FIG. 17 is a graph of expression levels of non-structural biomarker p4EBP along the y-axis and distances from the nearest blood vessel along the x-axis.
- FIG. 17 illustrates a scatterplot 1702 of the distribution of cells in the x-y space, a curve 1704 representing the median expression level of p4EBP over different distance values, a curve 1706 representing the 90 th percentile expression level of p4EBP over different distance values, and a curve 1708 representing the 10 th percentile expression level of p4EBP over different distance values.
- FIG. 18 is a graph of expression levels of non-structural biomarker pmTOR along the y-axis and distances from the nearest blood vessel along the x-axis.
- FIG. 18 illustrates a scatterplot 1802 of the distribution of cells in the x-y space, a curve 1804 representing the median expression level of pmTOR over different distance values, a curve 1806 representing the 90 th percentile expression level of pmTOR over different distance values, and a curve 1808 representing the 10 th percentile expression level of pmTOR over different distance values.
- FIG. 19 is a graph of expression levels of non-structural biomarker pCREB along the y-axis and distances from the nearest blood vessel along the x-axis.
- FIG. 19 illustrates a scatterplot 1902 of the distribution of cells in the x-y space, a curve 1904 representing the median expression level of pCREB over different distance values, a curve 1906 representing the 90 th percentile expression level of pCREB over different distance values, and a curve 1908 representing the 10 th percentile expression level of pCREB over different distance values.
- FIG. 20 is a graph of expression levels of non-structural biomarker Glut1 along the y-axis and distances from the nearest blood vessel along the x-axis.
- FIG. 20 illustrates a scatterplot 2002 of the distribution of cells in the x-y space, a curve 2004 representing the median expression level of Glut1 over different distance values, a curve 2006 representing the 90 th percentile expression level of Glut1 over different distance values, and a curve 2008 representing the 10 th percentile expression level of Glut1 over different distance values.
- Exemplary embodiments may be used to unambiguously define the localization of immune cells to determine if the localization can be used in prognosis. For example, certain immune cells (e.g., CD8+ T cells) may have different disease prognosis based on their spatial distance from tumor cells. Similarly, certain tumor cells have different disease prognosis based on their spatial distance from immune cells. Exemplary embodiments may be used to determine the spatial distance from certain immune cells to the nearest one or more tumor cells in a cohort of users. Exemplary embodiments may then analyze the disease outcome for the immune cells and its relationship to the distances to the nearest tumor cell. Exemplary embodiments may be used to determine the spatial distance from certain tumor cells to the nearest one or more immune cells in a cohort of users.
- certain immune cells e.g., CD8+ T cells
- tumor cells have different disease prognosis based on their spatial distance from immune cells.
- Exemplary embodiments may be used to determine the spatial distance from certain immune cells to the nearest one or more tumor cells in a cohort of users.
- Exemplary embodiments may then analyze the disease outcome for the tumor cells and its relationship to the distances to the nearest immune cell. See, Mlecnik B et al., “Histopathologic-Based Prognostic Factors of Colorectal Cancers are Associated with the State of the Local Immune Reaction,” J Clin Oncol., 2011, 29(6):610-618; Funada, Y. et al., “Prognostic Significance of CD8+ T Cell and Macrophage Peritumoral Infiltration in Colorectal Cancer,” Oncology Reports, 2003, 10(2): 309-313; Forssel, J. et al., “High Macrophage Infiltration along the Tumor Front Correlates with Improved Survival in Colon Cancer,” Clin.
- Exemplary embodiments may be used to differentiate cells based on distance of the cells from basement membranes and/or extracellular matrices. This cell differential enabled by exemplary embodiments has application in examining of cancer cells. Certain cancer cells associated with matrices, while other cancer cells acquire the capability to grow in a matrix-anchorage-independent manner. Matrix-associated cells may be more resistant to chemotherapy. Exemplary embodiments may be used to determine the spatial distance from certain cancer cells to the nearest matrix component. In one example, if certain cancer cells that are within a predetermined distance or a predetermined distance range from the nearest matrix component, it may be determined that the cancer cells have the ability to grow in a matrix-independent manner and/or may be more resistant to chemotherapy. See, Muranen, T.
- Exemplary embodiments may be used in pharmaceutical research in which cancer cells may be analyzed before and after drug treatment to determine whether drug efficacy is affected by the distance of cancer cells from matrix components.
- cancer cell populations at different distances from the nearest matrix component may be analyzed before and after drug treatment to determine biomarker expression levels that may or may not be affected by the drug.
- Exemplary embodiments may also be used in pharmaceutical research in which cancer cells may be analyzed to classify different types of tumors. For example, cancel cell populations at different distances from the nearest matrix component may be analyzed to determine if tumor morphology and/or tumor phenotype varies between cells that are associated with a matrix component and cells that are not associated with matrix components.
- Exemplary embodiments may be used to characterize the level of vascularity in tissue, e.g., angiogenesis.
- the spatial distances for morphological units (e.g., cells) from the nearest blood vessel may be used to determine vascularity, for example, by taking the average distance of the units from the nearest blood vessel.
- a clinical outcome may be automatically determined corresponding to biological tissue in a cohort of users based on a relationship between expression levels of one or more biomarkers in morphological units and corresponding spatial distances from a morphological feature of interest of the units.
- the analysis may be used to generate a predictive model for a clinical outcome corresponding to the biological tissue of the cohort based on the relationship between the expression levels of the one or more biomarker and the corresponding spatial distance from the morphological feature the first set of morphological units.
- Some exemplary embodiments may perform a correlation analysis between expression levels of one or more biomarkers in morphological units and corresponding spatial distances from a morphological feature of interest of the units.
- FIG. 21 is a block diagram of an exemplary computing device 2100 that may be used in to perform any of the methods provided by exemplary embodiments.
- the computing device 2100 may be any suitable computing or communication device or system, such as a workstation, desktop computer, server, laptop, handheld computer, tablet computer (e.g., the iPadTM tablet computer), mobile computing or communication device (e.g., the iPhoneTM communication device), or other form of computing or telecommunications device that is capable of communication and that has sufficient processor power and memory capacity to perform the operations described herein.
- the computing device 2100 includes one or more non-transitory computer-readable media for storing one or more computer-executable instructions, programs or software for implementing exemplary embodiments.
- the non-transitory computer-readable media may include, but are not limited to, one or more types of hardware memory, non-transitory tangible media (for example, one or more magnetic storage disks, one or more optical disks, one or more USB flashdrives), and the like.
- memory 2106 included in the computing device 2100 may store computer-readable and computer-executable instructions, programs or software for implementing exemplary embodiments.
- Memory 2106 may include a computer system memory or random access memory, such as DRAM, SRAM, EDO RAM, and the like. Memory 2106 may include other types of memory as well, or combinations thereof.
- the computing device 2100 also includes processor 2102 and associated core 2104 , and optionally, one or more additional processor(s) 2102 ′ and associated core(s) 2104 ′ (for example, in the case of computer systems having multiple processors/cores), for executing computer-readable and computer-executable instructions or software stored in the memory 2106 and other programs for controlling system hardware.
- processor 2102 and processor(s) 2102 ′ may each be a single core processor or multiple core ( 2104 and 2104 ′) processor.
- Virtualization may be employed in the computing device 2100 so that infrastructure and resources in the computing device may be shared dynamically.
- a virtual machine 2114 may be provided to handle a process running on multiple processors so that the process appears to be using only one computing resource rather than multiple computing resources. Multiple virtual machines may also be used with one processor.
- a user may interact with the computing device 2100 through a visual display device 2118 , such as a computer monitor, which may display one or more user interfaces 2120 that may be provided in accordance with exemplary embodiments.
- the visual display device 2118 may also display other aspects, elements and/or information or data associated with exemplary embodiments.
- the computing device 2100 may include other input/output (I/O) devices for receiving input from a user, for example, a keyboard or any suitable multi-point touch interface 2108 , a pointing device 2110 (e.g., a mouse).
- the keyboard 2108 and the pointing device 2110 may be coupled to the visual display device 2118 .
- the computing device 2100 may include other suitable conventional I/O peripherals.
- the computing device 2100 may include one or more storage devices 2124 , such as a hard-drive, CD-ROM, or other computer readable media, for storing data and computer-readable instructions and/or software that implement exemplary embodiments as taught herein.
- Exemplary storage device 2124 may also store one or more databases for storing any suitable information required to implement exemplary embodiments, for example, the exemplary data illustrated in the storage device of FIG. 1 .
- the databases may be updated by a user or automatically at any suitable time to add, delete or update one or more items in the databases.
- the computing device 2100 may include a network interface 2112 configured to interface via one or more network devices 2122 with one or more networks, for example, Local Area Network (LAN), Wide Area Network (WAN) or the Internet through a variety of connections including, but not limited to, standard telephone lines, LAN or WAN links (for example, 802.11, T1, T3, 56 kb, X.25), broadband connections (for example, ISDN, Frame Relay, ATM), wireless connections, controller area network (CAN), or some combination of any or all of the above.
- LAN Local Area Network
- WAN Wide Area Network
- the Internet through a variety of connections including, but not limited to, standard telephone lines, LAN or WAN links (for example, 802.11, T1, T3, 56 kb, X.25), broadband connections (for example, ISDN, Frame Relay, ATM), wireless connections, controller area network (CAN), or some combination of any or all of the above.
- LAN Local Area Network
- WAN Wide Area Network
- CAN controller area network
- the network interface 2112 may include a built-in network adapter, network interface card, PCMCIA network card, card bus network adapter, wireless network adapter, USB network adapter, modem or any other device suitable for interfacing the computing device 2100 to any type of network capable of communication and performing the operations described herein.
- the computing device 2100 may run any operating system 2116 , such as any of the versions of the Microsoft® Windows® operating systems, the different releases of the Unix and Linux operating systems, any version of the MacOS® for Macintosh computers, any embedded operating system, any real-time operating system, any open source operating system, any proprietary operating system, any operating systems for mobile computing devices, or any other operating system capable of running on the computing device and performing the operations described herein.
- the operating system 2116 may be run in native mode or emulated mode.
- the operating system 2116 may be run on one or more cloud machine instances.
- FIG. 22 is a block diagram of an exemplary network environment 2200 suitable for a distributed implementation of exemplary embodiments.
- the network environment 2200 may include one or more servers 2202 and 2204 coupled to one or more clients 2206 and 2208 via a communication network 2210 .
- the servers 2202 and 2204 may take the form of or include one or more computing devices 2100 ′ and 2100 ′′, respectively, that are similar to the computing device 2100 illustrated in FIG. 21 .
- the clients 2206 and 2208 may take the form of or include one or more computing devices 2100 ′′′ and 2100 ′′′′, respectively, that are similar to the computing device 2100 illustrated in FIG. 21 .
- the network interface 2112 and the network device 2122 of the computing device 2100 enable the servers 2202 and 2204 to communicate with the clients 2206 and 2208 via the communication network 2210 .
- the communication network 2210 may include, but is not limited to, the Internet, an intranet, a LAN (Local Area Network), a WAN (Wide Area Network), a MAN (Metropolitan Area Network), a wireless network, an optical network, and the like.
- the communication facilities provided by the communication network 2210 are capable of supporting distributed implementations of exemplary embodiments.
- the servers 2202 and 2204 may provide the clients 2206 and 2208 with computer-readable and/or computer-executable components or products under a particular condition, such as a license agreement.
- the clients 2206 and 2208 may provide the servers 2202 and 2204 with computer-readable and computer-executable components or products under a particular condition, such as a license agreement.
- Exemplary flowcharts are provided herein for illustrative purposes and are non-limiting examples of methods.
- One of ordinary skill in the art will recognize that exemplary methods may include more or fewer steps than those illustrated in the exemplary flowcharts, and that the steps in the exemplary flowcharts may be performed in a different order than shown.
Landscapes
- Engineering & Computer Science (AREA)
- Health & Medical Sciences (AREA)
- General Health & Medical Sciences (AREA)
- Medical Informatics (AREA)
- Nuclear Medicine, Radiotherapy & Molecular Imaging (AREA)
- Radiology & Medical Imaging (AREA)
- Quality & Reliability (AREA)
- Computer Vision & Pattern Recognition (AREA)
- Physics & Mathematics (AREA)
- General Physics & Mathematics (AREA)
- Theoretical Computer Science (AREA)
- Investigating Or Analysing Biological Materials (AREA)
Abstract
Description
Claims (18)
Priority Applications (1)
| Application Number | Priority Date | Filing Date | Title |
|---|---|---|---|
| US13/539,187 US8873827B2 (en) | 2012-06-29 | 2012-06-29 | Determination of spatial proximity between features of interest in biological tissue |
Applications Claiming Priority (1)
| Application Number | Priority Date | Filing Date | Title |
|---|---|---|---|
| US13/539,187 US8873827B2 (en) | 2012-06-29 | 2012-06-29 | Determination of spatial proximity between features of interest in biological tissue |
Publications (2)
| Publication Number | Publication Date |
|---|---|
| US20140003702A1 US20140003702A1 (en) | 2014-01-02 |
| US8873827B2 true US8873827B2 (en) | 2014-10-28 |
Family
ID=49778244
Family Applications (1)
| Application Number | Title | Priority Date | Filing Date |
|---|---|---|---|
| US13/539,187 Active 2033-04-27 US8873827B2 (en) | 2012-06-29 | 2012-06-29 | Determination of spatial proximity between features of interest in biological tissue |
Country Status (1)
| Country | Link |
|---|---|
| US (1) | US8873827B2 (en) |
Cited By (13)
| Publication number | Priority date | Publication date | Assignee | Title |
|---|---|---|---|---|
| CN107924457A (en) * | 2015-06-11 | 2018-04-17 | 匹兹堡大学高等教育联邦体系 | For the area-of-interest in lookup hematoxylin and the organization chart picture of eosin (H & E) dyeing in multiplexing/super composite fluorescence organization chart picture and quantify the system and method for intra-tumor cell spaces heterogeneity |
| US10482595B2 (en) | 2014-08-27 | 2019-11-19 | S.D. Sight Diagnostics Ltd. | System and method for calculating focus variation for a digital microscope |
| US10488644B2 (en) | 2015-09-17 | 2019-11-26 | S.D. Sight Diagnostics Ltd. | Methods and apparatus for detecting an entity in a bodily sample |
| US10640807B2 (en) | 2011-12-29 | 2020-05-05 | S.D. Sight Diagnostics Ltd | Methods and systems for detecting a pathogen in a biological sample |
| US10831013B2 (en) | 2013-08-26 | 2020-11-10 | S.D. Sight Diagnostics Ltd. | Digital microscopy systems, methods and computer program products |
| US10843190B2 (en) | 2010-12-29 | 2020-11-24 | S.D. Sight Diagnostics Ltd. | Apparatus and method for analyzing a bodily sample |
| US11048911B2 (en) | 2016-10-27 | 2021-06-29 | Koninklijke Philips N.V. | Apparatus for determining cellular composition information in one or more tissue samples |
| US11099175B2 (en) | 2016-05-11 | 2021-08-24 | S.D. Sight Diagnostics Ltd. | Performing optical measurements on a sample |
| US11100634B2 (en) | 2013-05-23 | 2021-08-24 | S.D. Sight Diagnostics Ltd. | Method and system for imaging a cell sample |
| US11307196B2 (en) | 2016-05-11 | 2022-04-19 | S.D. Sight Diagnostics Ltd. | Sample carrier for optical measurements |
| US11434515B2 (en) | 2013-07-01 | 2022-09-06 | S.D. Sight Diagnostics Ltd. | Method and system for imaging a blood sample |
| US11609413B2 (en) | 2017-11-14 | 2023-03-21 | S.D. Sight Diagnostics Ltd. | Sample carrier for microscopy and optical density measurements |
| US11733150B2 (en) | 2016-03-30 | 2023-08-22 | S.D. Sight Diagnostics Ltd. | Distinguishing between blood sample components |
Families Citing this family (8)
| Publication number | Priority date | Publication date | Assignee | Title |
|---|---|---|---|---|
| US9725766B1 (en) * | 2014-07-29 | 2017-08-08 | Flagship Biosciences, Inc. | Methods for measuring and reporting vascularity in a tissue sample |
| GB201420859D0 (en) | 2014-11-24 | 2015-01-07 | Cancer Res Inst Royal | Tumour analysis |
| US10195445B2 (en) * | 2015-06-11 | 2019-02-05 | Cardiac Pacemakers, Inc. | Bent loop antenna for implantable medical devices |
| CN114578038A (en) * | 2015-10-23 | 2022-06-03 | 诺华股份有限公司 | Computer process after AQUA enhanced version |
| EP3459046B1 (en) * | 2016-05-18 | 2021-06-16 | F. Hoffmann-La Roche AG | Tumor proximity measure |
| EP3460750B1 (en) * | 2017-09-20 | 2020-03-25 | DKFZ Deutsches Krebsforschungszentrum | Method, system and computer program for computer-assisted evaluation of biomarkers in a tissue sample |
| WO2020131658A1 (en) * | 2018-12-19 | 2020-06-25 | University Of Pittsburgh-Of The Commonwealth System Of Higher Education | Computational systems pathology spatial analysis platform for in situ or in vitro multi-parameter cellular and subcellular imaging data |
| US20230237664A1 (en) * | 2020-06-12 | 2023-07-27 | Institut Pasteur | Method for detecting spatial coupling |
Citations (6)
| Publication number | Priority date | Publication date | Assignee | Title |
|---|---|---|---|---|
| US20030064025A1 (en) | 2001-04-05 | 2003-04-03 | Xiaoming Yang | Imaging systems for in vivo protocols |
| WO2008077245A1 (en) | 2006-12-22 | 2008-07-03 | The Governors Of The University Of Alberta | Novel methods for cellular image analysis and simulation |
| US20090237501A1 (en) | 2008-03-19 | 2009-09-24 | Ruprecht-Karis-Universitat Heidelberg Kirchhoff-Institut Fur Physik | method and an apparatus for localization of single dye molecules in the fluorescent microscopy |
| US7668586B2 (en) | 2000-11-02 | 2010-02-23 | Cornell Research Foundation, Inc. | In vivo multiphoton diagnostic detection and imaging of a neurodegenerative disease |
| US20100254589A1 (en) * | 2007-12-04 | 2010-10-07 | University College Dublin National University Of Ireland | Method and system for image analysis |
| WO2011076895A1 (en) | 2009-12-22 | 2011-06-30 | Cancer Research Technology Ltd | Hypoxia tumour markers |
-
2012
- 2012-06-29 US US13/539,187 patent/US8873827B2/en active Active
Patent Citations (6)
| Publication number | Priority date | Publication date | Assignee | Title |
|---|---|---|---|---|
| US7668586B2 (en) | 2000-11-02 | 2010-02-23 | Cornell Research Foundation, Inc. | In vivo multiphoton diagnostic detection and imaging of a neurodegenerative disease |
| US20030064025A1 (en) | 2001-04-05 | 2003-04-03 | Xiaoming Yang | Imaging systems for in vivo protocols |
| WO2008077245A1 (en) | 2006-12-22 | 2008-07-03 | The Governors Of The University Of Alberta | Novel methods for cellular image analysis and simulation |
| US20100254589A1 (en) * | 2007-12-04 | 2010-10-07 | University College Dublin National University Of Ireland | Method and system for image analysis |
| US20090237501A1 (en) | 2008-03-19 | 2009-09-24 | Ruprecht-Karis-Universitat Heidelberg Kirchhoff-Institut Fur Physik | method and an apparatus for localization of single dye molecules in the fluorescent microscopy |
| WO2011076895A1 (en) | 2009-12-22 | 2011-06-30 | Cancer Research Technology Ltd | Hypoxia tumour markers |
Non-Patent Citations (11)
| Title |
|---|
| Baker, et al. Direct Visualization of Heterogeneous Extravascular Distribution of Trastuzumab in Human Epidermal Growth Factor Receptor Type 2 Overexpressing Xenografts, Clin Cancer Res 2008; 14:271-2179, Published online Apr. 1, 2008. |
| Barash, E.; Dinn, S.; Sevinsky, C.; Ginty, F., "Multiplexed Analysis of Proteins in Tissue Using Multispectral Fluorescence Imaging," Medical Imaging, IEEE Transactions on , vol. 29, No. 8, pp. 1457, 1462, Aug. 2010. * |
| Cabenda pharmaceutical research limited, "innovative tools for drug discovery", www.cabenda.com, info@cabenda.com, Dec. 8, 2008. |
| Carter, K.M. et al., "Information Preserving Component Analysis: Data Projections for Flow Cytometry Analysis", IEEE Journal of Selected Topics in Signal Processing, Feb. 2009, vol. 3, pp. 148-158. |
| Fenton, B.M. et al., "Zonal Image Analysis of Tumour Vascular Perfusion, Hypoxia, and Necrosis", British Journal of Cancer, Jun. 7, 2002, vol. 86, pp. 1831-1836. |
| Huxham, et al. "Microregional Effects of Gemcitabine in HCT-116 Xenografts", Cancer Res 2004;64:6537-6541, Published online on Sep. 16, 2004. |
| Loukas, Constantinos G., et al., "Tumor Hypoxia and Blood Vessel Detection", Techniques in Bioinformatics and Medical Informatics, Jan. 24, 2006, vol. 980, pp. 125-138, abstract only. |
| Ng, et al., "A Fast and Efficient Implementation of Qualitatively Constrained Quantile Smoothing Splines", Statistical Modelling 2007; 7(4); 315-328. |
| Ramanathan, K., et al., "Automated Tracking of Biological Cells in an "in-vitro" Environment Using Active Contours and Distance Measures", IEEE 5th International Conference on Cybernetics and Intelligent Systems (CIS), Sep. 17-19, 2011, pp. 241-246. |
| Rosenfeld, et al., "Distance Functions on Digital Pictures", Pattern Recognition, Pergamon Press 1968, vol. 1, pp. 33-61. |
| Xu, Xiayu, et al., "Vessel Boundary Delineation on Fundus Images Using Graph-Based Approach", IEEE Transactions on Medical Imaging, Jun. 2011, vol. 30, pp. 1184-1191. |
Cited By (27)
| Publication number | Priority date | Publication date | Assignee | Title |
|---|---|---|---|---|
| US12005443B2 (en) | 2010-12-29 | 2024-06-11 | S.D. Sight Diagnostics Ltd. | Apparatus and method for analyzing a bodily sample |
| US10843190B2 (en) | 2010-12-29 | 2020-11-24 | S.D. Sight Diagnostics Ltd. | Apparatus and method for analyzing a bodily sample |
| US10640807B2 (en) | 2011-12-29 | 2020-05-05 | S.D. Sight Diagnostics Ltd | Methods and systems for detecting a pathogen in a biological sample |
| US11584950B2 (en) | 2011-12-29 | 2023-02-21 | S.D. Sight Diagnostics Ltd. | Methods and systems for detecting entities in a biological sample |
| US11295440B2 (en) | 2013-05-23 | 2022-04-05 | S.D. Sight Diagnostics Ltd. | Method and system for imaging a cell sample |
| US11803964B2 (en) | 2013-05-23 | 2023-10-31 | S.D. Sight Diagnostics Ltd. | Method and system for imaging a cell sample |
| US11100634B2 (en) | 2013-05-23 | 2021-08-24 | S.D. Sight Diagnostics Ltd. | Method and system for imaging a cell sample |
| US11434515B2 (en) | 2013-07-01 | 2022-09-06 | S.D. Sight Diagnostics Ltd. | Method and system for imaging a blood sample |
| US10831013B2 (en) | 2013-08-26 | 2020-11-10 | S.D. Sight Diagnostics Ltd. | Digital microscopy systems, methods and computer program products |
| US10482595B2 (en) | 2014-08-27 | 2019-11-19 | S.D. Sight Diagnostics Ltd. | System and method for calculating focus variation for a digital microscope |
| US11721018B2 (en) | 2014-08-27 | 2023-08-08 | S.D. Sight Diagnostics Ltd. | System and method for calculating focus variation for a digital microscope |
| US11100637B2 (en) | 2014-08-27 | 2021-08-24 | S.D. Sight Diagnostics Ltd. | System and method for calculating focus variation for a digital microscope |
| CN107924457A (en) * | 2015-06-11 | 2018-04-17 | 匹兹堡大学高等教育联邦体系 | For the area-of-interest in lookup hematoxylin and the organization chart picture of eosin (H & E) dyeing in multiplexing/super composite fluorescence organization chart picture and quantify the system and method for intra-tumor cell spaces heterogeneity |
| US11262571B2 (en) | 2015-09-17 | 2022-03-01 | S.D. Sight Diagnostics Ltd. | Determining a staining-quality parameter of a blood sample |
| US11199690B2 (en) | 2015-09-17 | 2021-12-14 | S.D. Sight Diagnostics Ltd. | Determining a degree of red blood cell deformity within a blood sample |
| US10488644B2 (en) | 2015-09-17 | 2019-11-26 | S.D. Sight Diagnostics Ltd. | Methods and apparatus for detecting an entity in a bodily sample |
| US11914133B2 (en) | 2015-09-17 | 2024-02-27 | S.D. Sight Diagnostics Ltd. | Methods and apparatus for analyzing a bodily sample |
| US10663712B2 (en) | 2015-09-17 | 2020-05-26 | S.D. Sight Diagnostics Ltd. | Methods and apparatus for detecting an entity in a bodily sample |
| US11796788B2 (en) | 2015-09-17 | 2023-10-24 | S.D. Sight Diagnostics Ltd. | Detecting a defect within a bodily sample |
| US11733150B2 (en) | 2016-03-30 | 2023-08-22 | S.D. Sight Diagnostics Ltd. | Distinguishing between blood sample components |
| US11808758B2 (en) | 2016-05-11 | 2023-11-07 | S.D. Sight Diagnostics Ltd. | Sample carrier for optical measurements |
| US11307196B2 (en) | 2016-05-11 | 2022-04-19 | S.D. Sight Diagnostics Ltd. | Sample carrier for optical measurements |
| US11099175B2 (en) | 2016-05-11 | 2021-08-24 | S.D. Sight Diagnostics Ltd. | Performing optical measurements on a sample |
| US11048911B2 (en) | 2016-10-27 | 2021-06-29 | Koninklijke Philips N.V. | Apparatus for determining cellular composition information in one or more tissue samples |
| US11614609B2 (en) | 2017-11-14 | 2023-03-28 | S.D. Sight Diagnostics Ltd. | Sample carrier for microscopy measurements |
| US11609413B2 (en) | 2017-11-14 | 2023-03-21 | S.D. Sight Diagnostics Ltd. | Sample carrier for microscopy and optical density measurements |
| US11921272B2 (en) | 2017-11-14 | 2024-03-05 | S.D. Sight Diagnostics Ltd. | Sample carrier for optical measurements |
Also Published As
| Publication number | Publication date |
|---|---|
| US20140003702A1 (en) | 2014-01-02 |
Similar Documents
| Publication | Publication Date | Title |
|---|---|---|
| US8873827B2 (en) | Determination of spatial proximity between features of interest in biological tissue | |
| Fornacon-Wood et al. | Radiomics as a personalized medicine tool in lung cancer: Separating the hope from the hype | |
| Lipkova et al. | Deep learning-enabled assessment of cardiac allograft rejection from endomyocardial biopsies | |
| CN109791693B (en) | Digital pathology system and related workflow for providing visualized whole-slice image analysis | |
| JP6910068B2 (en) | Systems and methods for investigating regions of interest in hematoxylin-eosin (H & E) stained tissue images and quantifying intratumoral cell spatial heterogeneity with multiplexed / highly multiplexed fluorescent tissue images | |
| US8885912B2 (en) | Generate percentage of positive cells for biomarkers by normalizing and autothresholding the image intensity produced by immunohistochemistry technique | |
| JP6163152B2 (en) | Analysis of biomarker expression in cells by product rate | |
| Bredfeldt et al. | Automated quantification of aligned collagen for human breast carcinoma prognosis | |
| Banna et al. | The promise of digital biopsy for the prediction of tumor molecular features and clinical outcomes associated with immunotherapy | |
| US11885732B2 (en) | Morphometric genotyping of cells in liquid biopsy using optical tomography | |
| US9031306B2 (en) | Diagnostic and prognostic histopathology system using morphometric indices | |
| US10825195B2 (en) | Spatial index creation for IHC image analysis | |
| Wang et al. | Automated morphological classification of lung cancer subtypes using H&E tissue images | |
| Shia et al. | Effectiveness of evaluating tumor vascularization using 3D power Doppler ultrasound with high-definition flow technology in the prediction of the response to neoadjuvant chemotherapy for T2 breast cancer: a preliminary report | |
| Cao et al. | 3D convolutional neural networks fusion model for lung nodule detection onclinical CT scans | |
| US20230237658A1 (en) | Method and system for analyzing pathological image | |
| US20140372450A1 (en) | Methods of viewing and analyzing high content biological data | |
| Farahmand et al. | Deep learning trained on H&E tumor ROIs predicts HER2 status and Trastuzumab treatment response in HER2+ breast cancer | |
| Grote et al. | Exploring the spatial dimension of estrogen and progesterone signaling: detection of nuclear labeling in lobular epithelial cells in normal mammary glands adjacent to breast cancer | |
| Dammak et al. | Prediction of tumour mutational burden of squamous cell carcinoma using histopathology images of surgical specimens | |
| KR20220106691A (en) | Method and system for analysing pathology image | |
| Li | Novel Population Specific Computational Pathology-based Prognostic and Predictive Biomarkers for Breast Cancer | |
| Corrigan et al. | Image analysis in drug discovery | |
| WO2024173431A1 (en) | Nuclei-based digital pathology systems and methods | |
| JP2024522094A (en) | Tumor immunophenotyping based on spatial distribution analysis |
Legal Events
| Date | Code | Title | Description |
|---|---|---|---|
| AS | Assignment |
Owner name: GENERAL ELECTRIC COMPANY, NEW YORK Free format text: ASSIGNMENT OF ASSIGNORS INTEREST;ASSIGNORS:MCCULLOCH, COLIN C.;SEVINKSY, CHRISTOPHER J.;ZHANG, JINGYU;REEL/FRAME:028473/0932 Effective date: 20120629 |
|
| FEPP | Fee payment procedure |
Free format text: PAYOR NUMBER ASSIGNED (ORIGINAL EVENT CODE: ASPN); ENTITY STATUS OF PATENT OWNER: LARGE ENTITY |
|
| STCF | Information on status: patent grant |
Free format text: PATENTED CASE |
|
| CC | Certificate of correction | ||
| MAFP | Maintenance fee payment |
Free format text: PAYMENT OF MAINTENANCE FEE, 4TH YEAR, LARGE ENTITY (ORIGINAL EVENT CODE: M1551) Year of fee payment: 4 |
|
| AS | Assignment |
Owner name: GLOBAL LIFE SCIENCES SOLUTIONS USA LLC, MASSACHUSETTS Free format text: ASSIGNMENT OF ASSIGNORS INTEREST;ASSIGNOR:GENERAL ELECTRIC COMPANY;REEL/FRAME:053966/0133 Effective date: 20200320 |
|
| AS | Assignment |
Owner name: LEICA MICROSYSTEMS CMS GMBH, GERMANY Free format text: ASSIGNMENT OF ASSIGNORS INTEREST;ASSIGNOR:GLOBAL LIFE SCIENCES SOLUTIONS USA LLC;REEL/FRAME:057261/0128 Effective date: 20210430 |
|
| MAFP | Maintenance fee payment |
Free format text: PAYMENT OF MAINTENANCE FEE, 8TH YEAR, LARGE ENTITY (ORIGINAL EVENT CODE: M1552); ENTITY STATUS OF PATENT OWNER: LARGE ENTITY Year of fee payment: 8 |