US8557811B2 - Dual-color imaging method of sodium/calcium activities using two-photon fluorescent probes and preparation method of two-photon fluorescent probes - Google Patents
Dual-color imaging method of sodium/calcium activities using two-photon fluorescent probes and preparation method of two-photon fluorescent probes Download PDFInfo
- Publication number
- US8557811B2 US8557811B2 US12/913,378 US91337810A US8557811B2 US 8557811 B2 US8557811 B2 US 8557811B2 US 91337810 A US91337810 A US 91337810A US 8557811 B2 US8557811 B2 US 8557811B2
- Authority
- US
- United States
- Prior art keywords
- photon
- photon fluorescent
- fluorescent probe
- bca1
- calcium
- Prior art date
- Legal status (The legal status is an assumption and is not a legal conclusion. Google has not performed a legal analysis and makes no representation as to the accuracy of the status listed.)
- Active, expires
Links
- QLCYNRYZNIFIDP-UHFFFAOYSA-N CC1=CC=C(CC(=O)CN(C)C2=CC=C3C=C(/C4=N/C5=C(C=CC=C5)C4)C=CC3=C2)C=C1OCC(=O)N1CCOCC1 Chemical compound CC1=CC=C(CC(=O)CN(C)C2=CC=C3C=C(/C4=N/C5=C(C=CC=C5)C4)C=CC3=C2)C=C1OCC(=O)N1CCOCC1 QLCYNRYZNIFIDP-UHFFFAOYSA-N 0.000 description 6
- RLDCHARXBDYMFT-UHFFFAOYSA-N CC1=CC=C(CC(=O)CN(C)C2=CC=C3C=C(/C4=N/C5=C(C=CC=C5)C4)C=CC3=C2)C=C1OCC(=O)N1CCOCC1.CN(CC(=O)O)C1=CC=C2C=C(/C3=N/C4=C(C=CC=C4)C3)C=CC2=C1.CN(CC(=O)OC(C)(C)C)C1=CC=C2C=C(Br)C=CC2=C1.COC(=O)CN(CC(=O)OC)C1=C(OCC(=O)N2CCOCC2)C=C(N)C=C1 Chemical compound CC1=CC=C(CC(=O)CN(C)C2=CC=C3C=C(/C4=N/C5=C(C=CC=C5)C4)C=CC3=C2)C=C1OCC(=O)N1CCOCC1.CN(CC(=O)O)C1=CC=C2C=C(/C3=N/C4=C(C=CC=C4)C3)C=CC2=C1.CN(CC(=O)OC(C)(C)C)C1=CC=C2C=C(Br)C=CC2=C1.COC(=O)CN(CC(=O)OC)C1=C(OCC(=O)N2CCOCC2)C=C(N)C=C1 RLDCHARXBDYMFT-UHFFFAOYSA-N 0.000 description 2
- 0 CC1C(C)[C@](*)C(C)CC1 Chemical compound CC1C(C)[C@](*)C(C)CC1 0.000 description 2
- XNJZDCRYKHJPJD-UHFFFAOYSA-N CN(CC(=O)O)C1=CC=C2C=C(/C3=N/C4=C(C=CC=C4)C3)C=CC2=C1.CN(CC(=O)OC(C)(C)C)C1=CC=C2C=C(Br)C=CC2=C1.COC(=O)CN(CC(=O)OC)C1=C(OCC(=O)N2CCOCC2)C=C(N)C=C1 Chemical compound CN(CC(=O)O)C1=CC=C2C=C(/C3=N/C4=C(C=CC=C4)C3)C=CC2=C1.CN(CC(=O)OC(C)(C)C)C1=CC=C2C=C(Br)C=CC2=C1.COC(=O)CN(CC(=O)OC)C1=C(OCC(=O)N2CCOCC2)C=C(N)C=C1 XNJZDCRYKHJPJD-UHFFFAOYSA-N 0.000 description 1
- UGBXWCKGHFZEQC-UHFFFAOYSA-N COC1=CC(NC(=O)CN(C)C2=CC=C3C=C(C(C)=O)C=CC3=C2)=CC=C1N1CCOCCOCCN(C2=C(OC)C=CC=C2)CCOCC1 Chemical compound COC1=CC(NC(=O)CN(C)C2=CC=C3C=C(C(C)=O)C=CC3=C2)=CC=C1N1CCOCCOCCN(C2=C(OC)C=CC=C2)CCOCC1 UGBXWCKGHFZEQC-UHFFFAOYSA-N 0.000 description 1
Images


Classifications
-
- C—CHEMISTRY; METALLURGY
- C07—ORGANIC CHEMISTRY
- C07D—HETEROCYCLIC COMPOUNDS
- C07D413/00—Heterocyclic compounds containing two or more hetero rings, at least one ring having nitrogen and oxygen atoms as the only ring hetero atoms
- C07D413/02—Heterocyclic compounds containing two or more hetero rings, at least one ring having nitrogen and oxygen atoms as the only ring hetero atoms containing two hetero rings
- C07D413/12—Heterocyclic compounds containing two or more hetero rings, at least one ring having nitrogen and oxygen atoms as the only ring hetero atoms containing two hetero rings linked by a chain containing hetero atoms as chain links
-
- C—CHEMISTRY; METALLURGY
- C07—ORGANIC CHEMISTRY
- C07D—HETEROCYCLIC COMPOUNDS
- C07D273/00—Heterocyclic compounds containing rings having nitrogen and oxygen atoms as the only ring hetero atoms, not provided for by groups C07D261/00 - C07D271/00
- C07D273/08—Heterocyclic compounds containing rings having nitrogen and oxygen atoms as the only ring hetero atoms, not provided for by groups C07D261/00 - C07D271/00 having two nitrogen atoms and more than one oxygen atom
-
- G—PHYSICS
- G01—MEASURING; TESTING
- G01N—INVESTIGATING OR ANALYSING MATERIALS BY DETERMINING THEIR CHEMICAL OR PHYSICAL PROPERTIES
- G01N21/00—Investigating or analysing materials by the use of optical means, i.e. using sub-millimetre waves, infrared, visible or ultraviolet light
- G01N21/62—Systems in which the material investigated is excited whereby it emits light or causes a change in wavelength of the incident light
- G01N21/63—Systems in which the material investigated is excited whereby it emits light or causes a change in wavelength of the incident light optically excited
- G01N21/64—Fluorescence; Phosphorescence
- G01N21/6428—Measuring fluorescence of fluorescent products of reactions or of fluorochrome labelled reactive substances, e.g. measuring quenching effects, using measuring "optrodes"
-
- G—PHYSICS
- G01—MEASURING; TESTING
- G01N—INVESTIGATING OR ANALYSING MATERIALS BY DETERMINING THEIR CHEMICAL OR PHYSICAL PROPERTIES
- G01N21/00—Investigating or analysing materials by the use of optical means, i.e. using sub-millimetre waves, infrared, visible or ultraviolet light
- G01N21/62—Systems in which the material investigated is excited whereby it emits light or causes a change in wavelength of the incident light
- G01N21/63—Systems in which the material investigated is excited whereby it emits light or causes a change in wavelength of the incident light optically excited
- G01N21/64—Fluorescence; Phosphorescence
- G01N2021/6417—Spectrofluorimetric devices
- G01N2021/6421—Measuring at two or more wavelengths
-
- G—PHYSICS
- G01—MEASURING; TESTING
- G01N—INVESTIGATING OR ANALYSING MATERIALS BY DETERMINING THEIR CHEMICAL OR PHYSICAL PROPERTIES
- G01N21/00—Investigating or analysing materials by the use of optical means, i.e. using sub-millimetre waves, infrared, visible or ultraviolet light
- G01N21/62—Systems in which the material investigated is excited whereby it emits light or causes a change in wavelength of the incident light
- G01N21/63—Systems in which the material investigated is excited whereby it emits light or causes a change in wavelength of the incident light optically excited
- G01N21/64—Fluorescence; Phosphorescence
- G01N21/6428—Measuring fluorescence of fluorescent products of reactions or of fluorochrome labelled reactive substances, e.g. measuring quenching effects, using measuring "optrodes"
- G01N2021/6439—Measuring fluorescence of fluorescent products of reactions or of fluorochrome labelled reactive substances, e.g. measuring quenching effects, using measuring "optrodes" with indicators, stains, dyes, tags, labels, marks
- G01N2021/6441—Measuring fluorescence of fluorescent products of reactions or of fluorochrome labelled reactive substances, e.g. measuring quenching effects, using measuring "optrodes" with indicators, stains, dyes, tags, labels, marks with two or more labels
Definitions
- the present disclosure relates to a method for dual-color imaging of sodium/calcium activities using a two-photon fluorescent probe and a method for preparing the two-photon fluorescent probe.
- the disclosure relates to a two-photon fluorescent probe capable of imaging calcium ion activity near ion channels of the cell membrane with high sensitivity and selectivity and a method for dual-color imaging of exchange and activities of sodium/calcium cations in cells or tissues by staining along with a two-photon sodium probe of another fluorescent color.
- the change in calcium ion distribution in cells is very important in the study of physiological and pathological phenomena.
- the calcium ion level in the cell is controlled by pumps or channels existing on the plasma membrane depending on various situations.
- the concentration of calcium ion is much higher near the cell membrane than its average value in the cell. Depending on physiological activity, it increases up to 100 ⁇ M or above.
- the highly concentrated calcium ions near the cell membrane are known to play important roles in exocytosis of hormones and neurotransmitters, as second messengers in signal transduction, or the like.
- NCX Na + /Ca 2+ exchanger
- TPM two-photon microscopy
- the present disclosure is directed to providing a two-photon fluorescent probe capable of selectively staining the cell membrane and adequate for imaging selectivity and activity of calcium ions near the cell membrane while having a small molecular weight.
- the present disclosure is also directed to providing a method for selectively imaging the distribution of calcium ions near the cell membrane in a living cell or tissue using the two-photon fluorescent probe.
- the present disclosure is also directed to providing a method for imaging Na + /Ca 2+ exchange in a living cell or tissue using the two-photon fluorescent probe and another two-photon fluorescent sodium probe.
- the present disclosure is also directed to providing a method for preparing the two-photon fluorescent probe for detecting calcium ions near the cell membrane.
- the present disclosure provides a two-photon fluorescent probe represented by Chemical Formula 1:
- X is O, S or NH.
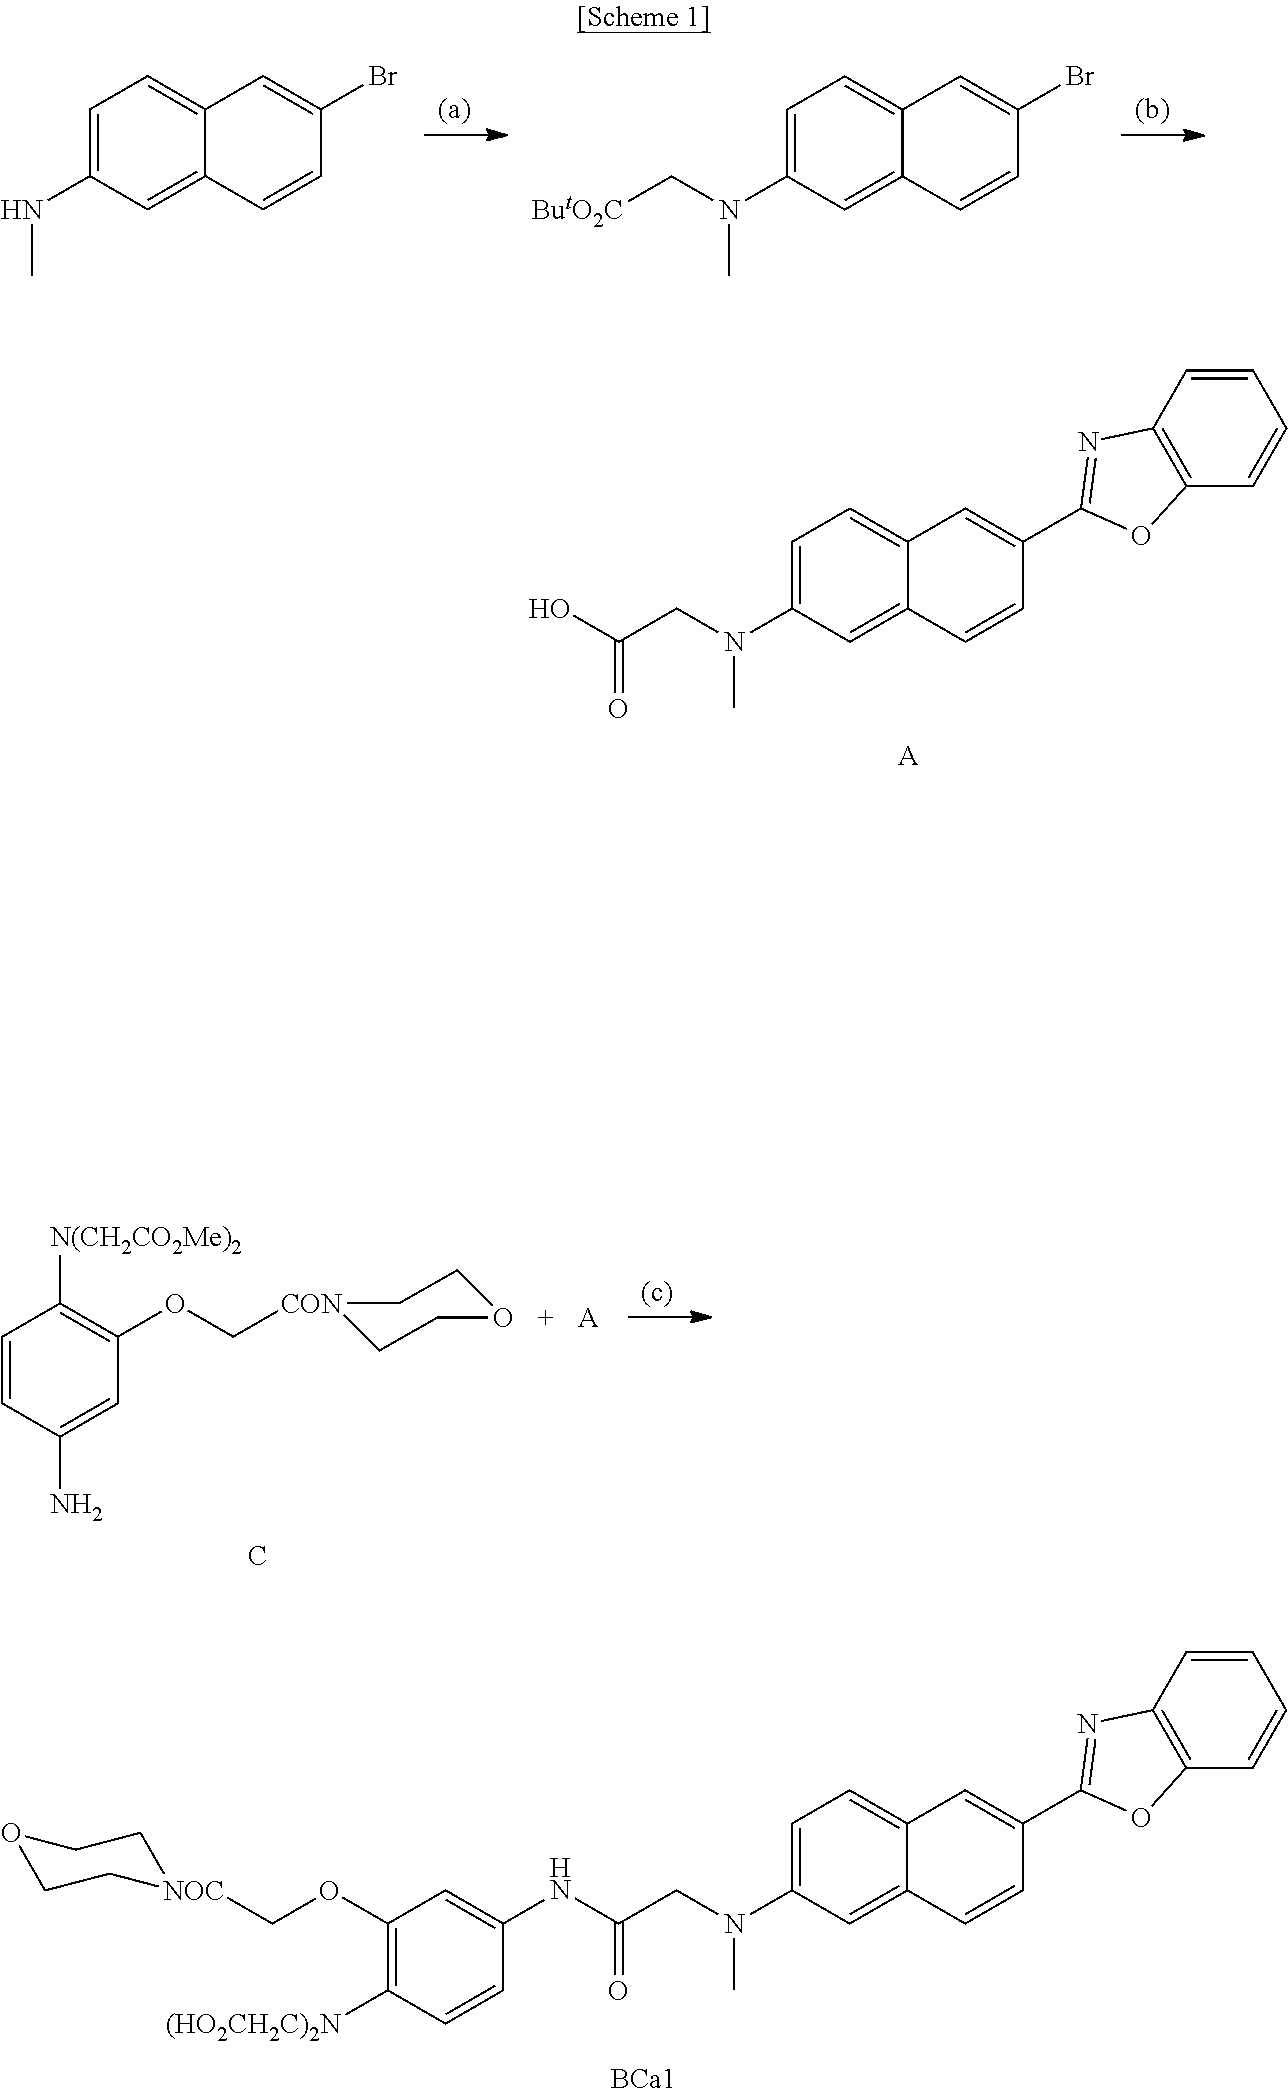
- the present disclosure provides a method for preparing a two-photon fluorescent probe represented by Chemical Formula 1 including: 1) refluxing a mixture of 6-bromo-N-methyl-2-naphthylamine, Proton-sponge and tert-butyl bromoacetate to prepare Compound B represented by Chemical Formula 2; 2) stirring a mixture of Compound B, benzoxazole, Pd(II) OAc, PPh 3 , CuI and CsCO 3 to prepare Compound A represented by Chemical Formula 3; and 3) mixing Compound A with 1-hydroxybenzotriazole and Compound D represented by Chemical Formula 4 and reacting the mixture:
- X is O, S or NH.
- the present disclosure provides a method for selectively imaging the distribution of calcium ions in a living cell or tissue using the two-photon fluorescent probe represented by Chemical Formula 1.
- the present disclosure provides a method for imaging Na + /Ca 2+ exchange in a living cell or tissue using the two-photon fluorescent probe represented by Chemical Formula 1 and a two-photon fluorescent probe for detecting sodium ions.
- FIG. 1 shows one-photon fluorescence spectra of BCa1 and fluorescence intensity of BCa1 depending on concentration in H 2 O;
- FIG. 2 shows normalized absorption and emission spectra of BCa1 in 1,4-dioxane, EtOH, DMF and H 2 O;
- FIG. 3 shows normalized emission spectra of BCa1 and ANa1 in HeLa cells
- FIG. 4 shows one-photon fluorescence spectra of BCa1
- FIG. 5 shows one-photon absorption curves of BCa1, one-photon and two-photon fluorescence titration curves of BCa1, and one-photon and two-photon Hill curves of BCa1;
- FIG. 6 shows relative fluorescence intensity of BCa1 for various cations and effect of pH on one-photon fluorescence intensity of BCa1;
- FIG. 7 shows two-photon fluorescence operational spectra
- FIG. 8 shows one-photon fluorescence spectra of BCa1 and a Hill curve of BCa1;
- FIG. 9 shows normalized emission spectra of BCa1 in LUVs and normalized emission spectra of BCa1 in HeLa cells
- FIG. 10 ( a ) shows a TPM image of HeLa cells labeled with BCa1
- FIG. 10 ( b ) shows an analysis result thereof
- FIG. 11 shows an electron micrograph, a TPM image and fluorescence intensity of HeLa cells labeled with BCa1;
- FIG. 12 shows TPM images of HeLa cells labeled with BCa1
- FIG. 13 shows TPM images and fluorescence intensity of HeLa cells labeled with BCa1 and ANa1;
- FIG. 14 shows images of a rat hippocampal slice stained with BCa1 and ANa1.
- the present disclosure provides a two-photon fluorescent probe represented by Chemical Formula 1:
- X may be O, S or NH, specifically O.
- the two-photon fluorescent probe represented by Chemical Formula 1 according to the present disclosure may be used to detect calcium ions in a living cell or tissue.
- the two-photon fluorescent probe represented by Chemical Formula 1 comprises 2-(2′-morpholino-2′-oxoethoxy)-N,N-bis(hydroxycarbonylmethyl)aniline (MOBHA) as a calcium cation receptor and 6-(benzo[d]oxazol-2′-yl)-2-(N,N-dimethylamino)naphthalene as a reporter.
- MOBHA 2-(2′-morpholino-2′-oxoethoxy)-N,N-bis(hydroxycarbonylmethyl)aniline
- 6-(benzo[d]oxazol-2′-yl)-2-(N,N-dimethylamino)naphthalene as a reporter.
- the present disclosure provides a method for preparing the two-photon fluorescent probe represented by Chemical Formula 1 comprising: 1) refluxing a mixture of 6-bromo-N-methyl-2-naphthylamine, Proton-sponge and tert-butyl bromoacetate to prepare Compound B represented by Chemical Formula 2; 2) stirring a mixture of Compound B, benzoxazole, Pd(II) OAc, PPh 3 , CuI and CsCO 3 to prepare Compound A represented by Chemical Formula 3; and 3) mixing Compound A with 1-hydroxybenzotriazole and Compound D represented by Chemical Formula 4 and reacting the mixture:
- X may be O, S or NH, specifically O,
- the present disclosure further provides a method for selectively imaging the distribution of calcium ions in a living cell or tissue using the two-photon fluorescent probe represented by Chemical Formula 1. More specifically, the distribution of calcium ions near the cell membrane may be selectively imaged.
- the two-photon fluorescent probe represented by Chemical Formula 1 reacts with calcium cations to exhibit strong two-photon fluorescence and may be selectively and easily loaded into the cell membrane by forming a complex with a calcium ion. Further, it allows imaging of the distribution of calcium cations in a living cell or tissue since it can selectively detect calcium ions in the living cell or tissue at a depth of 100 to 200 ⁇ m for more than 60 minutes.
- the present disclosure further provides a method for imaging Na + /Ca 2+ exchange in a living cell or tissue using the two-photon fluorescent probe represented by Chemical Formula 1 and a two-photon fluorescent probe for detecting sodium ions.
- the two-photon fluorescent probe for detecting sodium ions may be ANa1 represented by the following formula, but is not limited thereto:
- the calcium and sodium activities can be imaged simultaneously at different channels.
- a stock solution (1.0 ⁇ 10 ⁇ 2 M) was prepared by dissolving the dye (BCa1) in DMSO.
- the solution was diluted (to 6.0 ⁇ 10 ⁇ 3 to 6.0 ⁇ 10 ⁇ 5 M) and transferred to a cuvette holding H 2 O (3.0 mL) using a microsyringe.
- H 2 O 3.0 mL
- the concentration of DMSO in H 2 O was maintained at 0.20. Fluorescence intensity plotted against the dye concentration showed linearity at low concentrations and was bent downward at high concentrations (see FIG. 1 ).
- the highest concentration in the linear region was determined as the solubility of BCa1, which was about 5.0 ⁇ M in water, being sufficient to stain cells.
- FIG. 1 ( a ) One-photon fluorescence spectra of BCa1 are shown in FIG. 1 ( a ), and the fluorescence intensity of BCa1 in H 2 O depending on concentrations is shown in FIG. 1 ( b ). Excitation wavelength was 360 nm.
- FIG. 3 shows the normalized emission spectra of BCa1 and ANa1 in HeLa cells. As seen from FIG. 3 , the emission band of BCa1 is distinguished well from the emission band of ANa1.
- FIG. 4 shows one-photon fluorescence spectra of 1 ⁇ M BCa1 (30 mM 3-(N-morpholino)propanesulfonic acid (MOPS), 100 mM KCl, pH 7.2) in the presence of free Ca 2+ (0 to 2.5 mM).
- MOPS 3-(N-morpholino)propanesulfonic acid
- FIG. 4 shows that when Ca 2+ was added to BCa1 in the MOPS buffer (30 mM, 100 mM KCl, pH 7.2), the fluorescence intensity increased abruptly with the metal ion concentration. This is caused by the blocking of photo-induced electron transfer (PET) resulting from complexation with the metal ions. Almost similar result was observed for the two-photon process.
- PET photo-induced electron transfer
- FIG. 5 ( a ) One-photon absorption curves of 1 ⁇ M BCa1 (30 mM MOPS, 100 mM KCl, pH 7.2) complex in the presence of free Ca 2+ are shown in FIG. 5 ( a ), one-photon and two-photon fluorescence titration curves are shown in FIG. 5 ( b ), and one-photon and two-photon Hill curves are shown in FIG. 5 ( c ).
- BCa1 Relative fluorescence intensity of 1 ⁇ M BCa1 for various cations are shown in FIG. 6 ( a ), and the effect of pH on one-photon fluorescence intensity of BCa1 is shown in FIG. 6 ( b ).
- BCa1 exhibited weak responses to Mg 2+ , Zn 2+ and Mn 2+ , and no response at all to Fe 2+ , Cu 2+ and Co 2+ .
- the probe allows selective detection of Ca 2+ without minimized interference from other biologically relevant cations.
- BCa1 was not affected by pH.
- Two-photon operational emission ⁇ of BCa1 in the MOPS buffer containing excess Ca 2+ was 150 GM at 780 nm, 3- to 5-fold improved over Calcium-Green-Ca 2+ or Fura-2-Ca 2+ (see FIG. 7 ).
- staining of cells with BCa1 can provide brighter TPM images as compared to other commercially available probes.
- LUVs for the measurement of one-photon and two-photon spectra were prepared from a hydrated suspension of multilamellar vesicles by means of extrusion. Lipids were dissolved in CHCl 3 /MeOH (95/5 vol %) and then dried under N 2 flow in vacuum. The resulting film was hydrated in MOPS buffer (30 mM MOPS, 100 mM KCl, pH 7.2) by shaking at 60° C. until the suspension became homogeneous. The mixture was subjected to 3 freeze-thaw cycles, and LUVs were extruded therefrom by passing through a membrane having 100 nm pores (Avanti Polar Lipids).
- FIG. 8 ( a ) One-photon fluorescence spectra of complexes of free Ca 2+ (0 to 2.5 mM) and 1 ⁇ M BCa1 for LUVs composed of DOPC/sphingomyelin/cholesterol (1:1:1, raft mixture) are shown in FIG. 8 ( a ), and Hill curves are shown in FIG. 8 ( b ).
- TPA cross section (6) was measured by femtosecond (fs) fluorescence spectroscopy.
- TPEF intensity of reference and sample was determined at the same excitation wavelength.
- Equation 1 s and r respectively stand for sample and reference molecules, S represents the intensity of a signal collected by the CCD detector, ⁇ represents the fluorescence quantum yield, f represents the overall fluorescence collection efficiency of the experimental apparatus, c represents molecular density in the solution, and ⁇ r represents the TPA cross section of reference molecules.
- HeLa cells were cultured in Dulbecco's modified Eagle's medium (DMEM; Gibco) supplemented with heat-inactivated 10% (v/v) fetal bovine serum (FBS; Gibco), 100 units/mL penicillin and 100 ⁇ g/mL streptomycin.
- DMEM Dulbecco's modified Eagle's medium
- FBS fetal bovine serum
- Four days before imaging the cells were harvested with a trypsin-EDTA solution and were transferred to a glass-bottomed dish (MatTek) with 50,000 cells/mm 2 .
- the cells were treated at 37° C. for 20 minutes with 2 ⁇ M ANa1, and then loaded with 0.5 ⁇ M BCa1 at room temperature.
- a TPM image of the HeLa cells labeled with BCa1 and an analysis result thereof are shown in FIG. 10 .
- a bright-field image of the HeLa cells labeled with BCa1 (0.5 ⁇ M) collected at 390 to 450 nm (a), a TPM image (b), and relative TPEF intensity with time (c) are shown in FIG. 11 .
- FIG. 12 ( a ) shows a TPM image of HeLa cells labeled with 0.5 ⁇ M BCa1 at 390 to 450 nm
- FIG. 12 ( b ) shows a TPM image of HeLa cells labeled with 0.5 ⁇ M BCa1 at 500 to 560 nm
- FIG. 12 ( c ) shows a TPM image of HeLa cells labeled with 2 ⁇ M ANa1 at 390 to 450 nm
- FIG. 12 ( d ) shows a TPM image of HeLa cells labeled with 2 ⁇ M ANa1 at 500 to 560 nm.
- FIG. 13 TPM images and fluorescence intensity of HeLa cells labeled with BCa1 and ANa1 are shown in FIG. 13 . More specifically, FIG. 13 ( a ) shows a TMP image of HeLa cells labeled with BCa1 at 390 to 450 nm, FIG. 13 ( b ) shows a TMP image of HeLa cells labeled with ANa1 at 500 to 560 nm, FIG. 13 ( c ) shows superimposition of ( a ) and ( b ), FIG. 13 ( d ) enlarges the box area in ( c ), and FIG. 13 ( e ) shows fluorescence intensity at the regions 1 and 2 in ( d ).
- Hippocampal slices of a 2-week-old rat were prepared. Hippocampal tissue was cut into 400 ⁇ m-thick slices in an artificial cerebrospinal fluid (ACSF; 138.6 mM NaCl, 3.5 mM KCl, 21 mM NaHCO 3 , 0.6 mM NaH 2 PO 4 , 9.9 mM D-glucose, 1 mM CaCl 2 and 3 mM MgCl 2 ) using a vibrating blade microtome. The slices were incubated with 10 mM BCa1 and 20 mM ANa1 in ACSF bubbled with 95& O 2 and 5% CO 2 at 37° C. for 40 minutes. Then, the slices were washed 3 times with ACSF, transferred to a glass-bottomed dish (MatTek), and observed under an electron microscope.
- ACSF artificial cerebrospinal fluid
- FIG. 14 shows images of the rat hippocampal slice stained with BCa1 and ANa1. More specifically, FIG. 14 ( a ) and ( b ) show a bright-field image of the CA1-CA3 regions as well as the TPM image dentate gyrus by 10 ⁇ magnification and a TPM image.
- FIG. 14 ( b ) shows a 25 TPM image at 390 to 450 nm (channel 1) and 500 to 560 nm (channel 2).
- FIG. 14 ( c ) to ( e ) show TPM images of the CA3 region.
- ( c ) and ( d ) show TPM images of channel 1 and channel 2 at 100 to 200 ⁇ m depth, by 100 ⁇ magnification, and ( e ) shows a superimposition thereof.
- the two-photon fluorescent probe for detecting calcium ions near the cell membrane reacts with calcium cations to exhibit strong two-photon fluorescence and may be selectively and easily loaded into the cell membrane by forming a complex with a calcium ion. Further, it allows imaging of the distribution of calcium cations in a living cell or tissue since it can selectively detect calcium ions in the living cell or tissue at a depth of 100 to 200 ⁇ m for more than 60 minutes, with a dissociation constant K i d in cells of 78 ⁇ 5 ⁇ M. In addition, it allows simultaneous imaging of activities of calcium and sodium at different channels by staining the living cell or tissue with the two probes of different fluorescent color.
Abstract
Description


| TABLE 1 | ||||||
| λ(1) max/λfl max | Φ | KTP d/Ki d | FEF | λ(2) max | δΦ | |
| BCa1 | 360/470 | 0.07 | — | — | nd | nd |
| BCa1 + Ca2+ | 360/470 | 0.98 | 89/78 μM | 13(14) | 780 | 150 |
| ANa1 | 367/500 | 0.08 | — | — | nd | nd |
| ANa1 + Na+ | 367/500 | 0.65 | 20/26 mM | 8(8) | 780 | 95 |
| λ(1) max: One-photon absorption and emission wavelength (nm) | ||||||
| Φ: Fluorescence photon efficiency (error range: ±10%) | ||||||
| KTP d: Dissociation constant for Ca2+ measured in two-photon process in buffer | ||||||
| Ki d: Dissociation constant for Ca2+ measured in two-photon process in cells | ||||||
| FEF: Fluorescence enhancement factor ((F − Fmin)/Fmin = FEF), Values in parentheses are for two-photon process | ||||||
| λ(2) max: Two-photon excitation wavelength (nm) | ||||||
| δΦ: Two-photon operational cross section at 10−50 cm4 s/photon (GM) (error range: ±15%) | ||||||
| nd: Not determinable because of too weak two-photon fluorescence intensity | ||||||
| λfl max: Value measured in large unilamellar vesicles (LUVs) composed of 1,2-dipalmitoyl-sn-glycero-3-phosphocholine/cholesterol (DPPC/CHL), raft mixture and 1,2-dioleoylsn-glycero-3-phosphocholine (DOPC) | ||||||
| KOP d values measured in the buffer and LUVs were 90 ± 2 μM and 81 ± 4 μM, respectively. | ||||||
δ=δr(S sφr f r c r)/(S rφs f s c s) [Equation 1]
Claims (7)


Applications Claiming Priority (2)
| Application Number | Priority Date | Filing Date | Title |
|---|---|---|---|
| KR10-2010-0075718 | 2010-08-05 | ||
| KR1020100075718A KR101233679B1 (en) | 2010-08-05 | 2010-08-05 | Dual-color imaging method of sodium/calcium activities using two-photon fluorescent probes and preparation method of two-photon fluorescent probes |
Publications (2)
| Publication Number | Publication Date |
|---|---|
| US20120035360A1 US20120035360A1 (en) | 2012-02-09 |
| US8557811B2 true US8557811B2 (en) | 2013-10-15 |
Family
ID=45556604
Family Applications (1)
| Application Number | Title | Priority Date | Filing Date |
|---|---|---|---|
| US12/913,378 Active 2031-09-15 US8557811B2 (en) | 2010-08-05 | 2010-10-27 | Dual-color imaging method of sodium/calcium activities using two-photon fluorescent probes and preparation method of two-photon fluorescent probes |
Country Status (3)
| Country | Link |
|---|---|
| US (1) | US8557811B2 (en) |
| JP (1) | JP5422803B2 (en) |
| KR (1) | KR101233679B1 (en) |
Families Citing this family (7)
| Publication number | Priority date | Publication date | Assignee | Title |
|---|---|---|---|---|
| KR101381767B1 (en) * | 2012-03-02 | 2014-04-07 | 아주대학교산학협력단 | two-photon fluorescent probes for nitric oxide, biological imaging methode of nitric oxide using the same and synthesis methode of the same |
| KR101364592B1 (en) * | 2012-03-21 | 2014-02-20 | 아주대학교산학협력단 | Changeable Color Two-photon Fluorescent Probes for Hydrogen Peroxide in Mitochondria and Biological Imaging Methode of Hydrogen Peroxide using the same and synthesis methode of the same |
| KR101653581B1 (en) * | 2014-09-18 | 2016-09-05 | 아주대학교산학협력단 | - - ratiometric two-photon fluorescent probes for -galactosidase synthesis method of the same and quantitative imaging method of senescence-associated -galactosidase in vivo using the same |
| WO2016108316A1 (en) * | 2014-12-31 | 2016-07-07 | 아주대학교 산학협력단 | Two-photon fluorescent probe, preparation method therefor, and ph imaging method using same |
| CN109946276B (en) * | 2019-03-25 | 2021-04-30 | 遵义师范学院 | Application of two-photon fluorescent probe |
| CN110627737B (en) * | 2019-10-23 | 2022-12-02 | 湖北理工学院 | Water-soluble benzoxazole fluorescent probe for detecting zinc ions as well as preparation method and application thereof |
| KR102646848B1 (en) * | 2022-02-28 | 2024-03-11 | 고려대학교 산학협력단 | Blue-emitting two-photon probes for calcium ions in plasma membrane |
Family Cites Families (4)
| Publication number | Priority date | Publication date | Assignee | Title |
|---|---|---|---|---|
| KR100858560B1 (en) * | 2007-05-25 | 2008-09-16 | 고려대학교 산학협력단 | Two photon probe for real time monitoring of intracellular magnesium ions, method for preparing the same and method for real time monitoring of intracellular magnesium ions |
| WO2009031734A1 (en) * | 2007-09-07 | 2009-03-12 | Korea University Industrial & Academic Collaboration Foundation | Two-photon probe for real-time monitoring of intracellular calcium ions, method for preparing the probe and method for real-time monitoring of intracellular calcium ions using the probe |
| KR100954585B1 (en) * | 2008-05-13 | 2010-04-26 | 고려대학교 산학협력단 | Two photon probe for real time monitoring of intracellular free zinc ions, method for preparing the same and method for real time monitoring of intracellular free zinc ions |
| KR101218765B1 (en) * | 2010-01-19 | 2013-01-07 | 아주대학교산학협력단 | Two-photon fluorescent probe, in vivo imaging methode using the same and synthesis methode of the same |
-
2010
- 2010-08-05 KR KR1020100075718A patent/KR101233679B1/en active IP Right Grant
- 2010-10-27 US US12/913,378 patent/US8557811B2/en active Active
- 2010-10-28 JP JP2010242600A patent/JP5422803B2/en active Active
Non-Patent Citations (2)
| Title |
|---|
| Kim. Angewandte CHemie International Edition, 2010, 49, 6786-89. * |
| Two-Photon Fluorescent Probes for Na+/CA2+Activities In Vivo; The 105th National Meeting of the Korean Chemical Society; Published Apr. 29, 2010, 1 page, Hwan Kim. |
Also Published As
| Publication number | Publication date |
|---|---|
| JP2012037498A (en) | 2012-02-23 |
| JP5422803B2 (en) | 2014-02-19 |
| KR101233679B1 (en) | 2013-02-15 |
| US20120035360A1 (en) | 2012-02-09 |
| KR20120013627A (en) | 2012-02-15 |
Similar Documents
| Publication | Publication Date | Title |
|---|---|---|
| US8557811B2 (en) | Dual-color imaging method of sodium/calcium activities using two-photon fluorescent probes and preparation method of two-photon fluorescent probes | |
| Shen et al. | A rhodamine B-based lysosomal pH probe | |
| Zheng et al. | A unique carbazole–coumarin fused two-photon platform: development of a robust two-photon fluorescent probe for imaging carbon monoxide in living tissues | |
| Wu et al. | A ratiometric fluorescent nanoprobe for H 2 O 2 sensing and in vivo detection of drug-induced oxidative damage to the digestive system | |
| CN105670609B (en) | A kind of novel Rhodamine fluorescent probe and preparation method thereof of detection mercury ion | |
| Wang et al. | A novel colorimetric and near-infrared fluorescent probe for hydrogen peroxide imaging in vitro and in vivo | |
| WO2017062364A2 (en) | Turn-on near infrared fluorescent probes for imaging lysosomal ros in live cells at subcellular resolution | |
| EP2778161B1 (en) | Two-photon fluorescent probe using naphthalene as matrix and preparation method and use thereof | |
| CN111116696A (en) | Preparation and application of adenosine triphosphate near-infrared nano fluorescent probe | |
| Resa et al. | New dual fluorescent probe for simultaneous biothiol and phosphate bioimaging | |
| CN107286173B (en) | Rhodol derivative and preparation method and application thereof | |
| CN108398409B (en) | Method for detecting hypochlorite by fluorescence ratio | |
| CN112500386A (en) | Near-infrared HClO fluorescent probe based on pyrrazone oxime, and preparation and application thereof | |
| US20090286275A1 (en) | Two-photon probe for real-time monitoring of intracellular free zinc ions, method for preparing the probe and method for real-time monitoring of intracellular free zinc ions using the probe | |
| KR101364592B1 (en) | Changeable Color Two-photon Fluorescent Probes for Hydrogen Peroxide in Mitochondria and Biological Imaging Methode of Hydrogen Peroxide using the same and synthesis methode of the same | |
| Lin et al. | A ratiometric fluorescent probe for fast detection and bioimaging of formaldehyde | |
| KR20150051009A (en) | Two-photon fluorescent probes, preparation method for thereof and methods for imaging of pH using the same | |
| CN109796493B (en) | Nitrosyl hydrogen fluorescent probe with two-photon and near-infrared light emitting characteristics and preparation method and application thereof | |
| US8084647B2 (en) | Two-photon probe for real-time monitoring of intracellular calcium ions, method for preparing the probe and method for real-time monitoring of intracellular calcium ions using the probe | |
| Chen et al. | Near-infrared and lysosome-targetable fluorescent probe based on phenoxazinium for hydrogen peroxide detection | |
| CN110372681A (en) | A kind of application of the self-assembled nanometer fluorescence probe for selective enumeration method human serum albumins | |
| CN113292571B (en) | Turn-on type fluorescent molecular probe responding to polarity of living cells of organism as well as preparation method and application thereof | |
| CN108456192B (en) | Two-photon fluorescent sodium ion probe and synthetic method and application thereof | |
| KR101908442B1 (en) | A differential stokes shift based two-photon probe and the ratiometric imaging of calcium ions in live tissue using the same | |
| Wang et al. | A novel fluorescent probe with high photostability for imaging distribution of RNA in living cells and tissues |
Legal Events
| Date | Code | Title | Description |
|---|---|---|---|
| AS | Assignment |
Owner name: AJOU UNIVERSITY INDUSTRY - ACADEMIC COOPERATION FO Free format text: ASSIGNMENT OF ASSIGNORS INTEREST;ASSIGNOR:KIM, HWAN MYUNG;REEL/FRAME:025544/0369 Effective date: 20101208 |
|
| AS | Assignment |
Owner name: AJOU UNIVERSITY INDUSTRY - ACADEMIC COOPERATION FO Free format text: ASSIGNMENT OF ASSIGNORS INTEREST;ASSIGNOR:CHO, BONG RAE;REEL/FRAME:031161/0851 Effective date: 20130905 |
|
| STCF | Information on status: patent grant |
Free format text: PATENTED CASE |
|
| FEPP | Fee payment procedure |
Free format text: PAYOR NUMBER ASSIGNED (ORIGINAL EVENT CODE: ASPN); ENTITY STATUS OF PATENT OWNER: SMALL ENTITY |
|
| FPAY | Fee payment |
Year of fee payment: 4 |
|
| MAFP | Maintenance fee payment |
Free format text: PAYMENT OF MAINTENANCE FEE, 8TH YR, SMALL ENTITY (ORIGINAL EVENT CODE: M2552); ENTITY STATUS OF PATENT OWNER: SMALL ENTITY Year of fee payment: 8 |