US8433113B2 - Automatic recovery of the left ventricular blood pool in cardiac cine magnetic resonance images - Google Patents
Automatic recovery of the left ventricular blood pool in cardiac cine magnetic resonance images Download PDFInfo
- Publication number
- US8433113B2 US8433113B2 US12/398,425 US39842509A US8433113B2 US 8433113 B2 US8433113 B2 US 8433113B2 US 39842509 A US39842509 A US 39842509A US 8433113 B2 US8433113 B2 US 8433113B2
- Authority
- US
- United States
- Prior art keywords
- connected components
- roi
- measure
- indicates
- blood pool
- Prior art date
- Legal status (The legal status is an assumption and is not a legal conclusion. Google has not performed a legal analysis and makes no representation as to the accuracy of the status listed.)
- Active, expires
Links
- 239000008280 blood Substances 0.000 title claims abstract description 70
- 210000004369 blood Anatomy 0.000 title claims abstract description 70
- 230000000747 cardiac effect Effects 0.000 title description 3
- 230000002861 ventricular Effects 0.000 title description 2
- 238000011084 recovery Methods 0.000 title 1
- 210000005240 left ventricle Anatomy 0.000 claims abstract description 62
- 238000000034 method Methods 0.000 claims abstract description 58
- 230000033001 locomotion Effects 0.000 claims abstract description 16
- 230000002123 temporal effect Effects 0.000 claims abstract description 3
- 238000005192 partition Methods 0.000 description 7
- 210000005241 right ventricle Anatomy 0.000 description 7
- 230000004807 localization Effects 0.000 description 6
- 210000005246 left atrium Anatomy 0.000 description 4
- 210000004115 mitral valve Anatomy 0.000 description 4
- 238000007796 conventional method Methods 0.000 description 3
- 230000003247 decreasing effect Effects 0.000 description 3
- 230000011218 segmentation Effects 0.000 description 3
- 230000006870 function Effects 0.000 description 2
- 210000002837 heart atrium Anatomy 0.000 description 2
- 238000003384 imaging method Methods 0.000 description 2
- 239000011159 matrix material Substances 0.000 description 2
- 238000012986 modification Methods 0.000 description 2
- 230000004048 modification Effects 0.000 description 2
- 238000012545 processing Methods 0.000 description 2
- 208000024172 Cardiovascular disease Diseases 0.000 description 1
- 210000000709 aorta Anatomy 0.000 description 1
- 230000009286 beneficial effect Effects 0.000 description 1
- 230000005540 biological transmission Effects 0.000 description 1
- 210000005242 cardiac chamber Anatomy 0.000 description 1
- 239000000470 constituent Substances 0.000 description 1
- 238000013500 data storage Methods 0.000 description 1
- 238000001514 detection method Methods 0.000 description 1
- 238000002059 diagnostic imaging Methods 0.000 description 1
- 238000005516 engineering process Methods 0.000 description 1
- 239000000284 extract Substances 0.000 description 1
- 230000036541 health Effects 0.000 description 1
- 230000002107 myocardial effect Effects 0.000 description 1
- 230000001575 pathological effect Effects 0.000 description 1
- 230000008569 process Effects 0.000 description 1
- 238000003672 processing method Methods 0.000 description 1
- 230000029058 respiratory gaseous exchange Effects 0.000 description 1
- 230000004044 response Effects 0.000 description 1
- 230000000717 retained effect Effects 0.000 description 1
- 238000013179 statistical model Methods 0.000 description 1
- 230000008719 thickening Effects 0.000 description 1
- 238000012549 training Methods 0.000 description 1
Images


Classifications
-
- G—PHYSICS
- G06—COMPUTING; CALCULATING OR COUNTING
- G06T—IMAGE DATA PROCESSING OR GENERATION, IN GENERAL
- G06T7/00—Image analysis
- G06T7/10—Segmentation; Edge detection
- G06T7/12—Edge-based segmentation
-
- G—PHYSICS
- G06—COMPUTING; CALCULATING OR COUNTING
- G06T—IMAGE DATA PROCESSING OR GENERATION, IN GENERAL
- G06T7/00—Image analysis
- G06T7/10—Segmentation; Edge detection
- G06T7/162—Segmentation; Edge detection involving graph-based methods
-
- G—PHYSICS
- G06—COMPUTING; CALCULATING OR COUNTING
- G06V—IMAGE OR VIDEO RECOGNITION OR UNDERSTANDING
- G06V10/00—Arrangements for image or video recognition or understanding
- G06V10/20—Image preprocessing
- G06V10/26—Segmentation of patterns in the image field; Cutting or merging of image elements to establish the pattern region, e.g. clustering-based techniques; Detection of occlusion
- G06V10/267—Segmentation of patterns in the image field; Cutting or merging of image elements to establish the pattern region, e.g. clustering-based techniques; Detection of occlusion by performing operations on regions, e.g. growing, shrinking or watersheds
-
- G—PHYSICS
- G06—COMPUTING; CALCULATING OR COUNTING
- G06V—IMAGE OR VIDEO RECOGNITION OR UNDERSTANDING
- G06V10/00—Arrangements for image or video recognition or understanding
- G06V10/40—Extraction of image or video features
- G06V10/44—Local feature extraction by analysis of parts of the pattern, e.g. by detecting edges, contours, loops, corners, strokes or intersections; Connectivity analysis, e.g. of connected components
- G06V10/457—Local feature extraction by analysis of parts of the pattern, e.g. by detecting edges, contours, loops, corners, strokes or intersections; Connectivity analysis, e.g. of connected components by analysing connectivity, e.g. edge linking, connected component analysis or slices
-
- G—PHYSICS
- G06—COMPUTING; CALCULATING OR COUNTING
- G06T—IMAGE DATA PROCESSING OR GENERATION, IN GENERAL
- G06T2207/00—Indexing scheme for image analysis or image enhancement
- G06T2207/10—Image acquisition modality
- G06T2207/10072—Tomographic images
- G06T2207/10076—4D tomography; Time-sequential 3D tomography
-
- G—PHYSICS
- G06—COMPUTING; CALCULATING OR COUNTING
- G06T—IMAGE DATA PROCESSING OR GENERATION, IN GENERAL
- G06T2207/00—Indexing scheme for image analysis or image enhancement
- G06T2207/30—Subject of image; Context of image processing
- G06T2207/30004—Biomedical image processing
- G06T2207/30048—Heart; Cardiac
-
- G—PHYSICS
- G06—COMPUTING; CALCULATING OR COUNTING
- G06T—IMAGE DATA PROCESSING OR GENERATION, IN GENERAL
- G06T2207/00—Indexing scheme for image analysis or image enhancement
- G06T2207/30—Subject of image; Context of image processing
- G06T2207/30004—Biomedical image processing
- G06T2207/30101—Blood vessel; Artery; Vein; Vascular
-
- G—PHYSICS
- G06—COMPUTING; CALCULATING OR COUNTING
- G06V—IMAGE OR VIDEO RECOGNITION OR UNDERSTANDING
- G06V2201/00—Indexing scheme relating to image or video recognition or understanding
- G06V2201/03—Recognition of patterns in medical or anatomical images
Definitions
- the present disclosure relates to medical imaging of the heart, and more particularly, to detection of the left ventricular blood pool in the heart.
- Cardiovascular disease has become the largest cause of death in the modern world and is an important health concern.
- Imaging technologies such as magnetic resonance (MR) imaging allow physicians to non-invasively observe the behavior of the heart. Physicians are particularly interested in the left ventricle (LV) because it pumps oxygenated blood out to the rest of the body.
- MR magnetic resonance
- LV left ventricle
- it is useful to be able to quantify the volume of blood pool of the LV over time and estimate its ejection fraction, cardiac output, peak ejection rate, filling rate, myocardial thickening, etc. These quantities can be computed once the LV is outlined in several images of the heart.
- the localized blood pool can be used to initialize more elaborate LV segmentation methods.
- it can be difficult to localize the LV blood pool because MR intensities are not consistent across acquisitions and blood pixels cannot easily be identified in the images.
- many acquisitions cover slices beyond the LV itself to guarantee it is seen in all phases. This means that some slices can be below the apex and contain no blood pool, and some slices can be above the mitral valve and contain the left atrium blood pool.
- One conventional method uses a 4D probabilistic atlas of the heart and a 3D intensity template to register an ED frame to localize the left and right ventricles.
- a second conventional method uses a hybrid active shape and appearance model to locate the heart using a Hough transform.
- models have difficulty capturing variability outside their training sets. For example, pathological cases that fall outside the standard set of shapes may not be recognized and appearance models may need to be re-trained for new acquisition protocols and sequences.
- One conventional modeling method is fast enough for clinical practice, but still depends on a learned appearance represented by a Markov chain.
- Another conventional modeling method combines a statistical model with coupled mesh surfaces.
- many of the datasets tested using the statistical modeling method exhibit breathing artifacts and through-plane motion.
- the statistical modeling method assumes that the heart is located in the center of an image, which is rarely a valid assumption.
- An exemplary embodiment of the present invention includes a method of detecting a left ventricle blood pool.
- the method includes: localizing a region of interest (ROI) in a three-dimensional temporal (3D+T) image based on motion information of each slice of the 3D image over time, thresholding the ROI to determine pixels of the ROI that correspond to blood, extracting connected components from the determined pixels, clustering the extracted connected components into groups based on criteria that are indicative of a blood pool of a left ventricle, and selecting one of the groups as the left ventricle blood pool.
- ROI region of interest
- 3D+T three-dimensional temporal
- the 3D image may be, for example, an MR image.
- the extracted connected components may be three (2D+T) dimensional.
- the identifying may include: ranking the groups in decreasing order of size, examining at least the first two group, and selecting a group from the at least two groups that has a highest confidence for indicating the left ventricle blood pool.
- the pixels may be indicative of blood when their intensities are above a threshold intensity.
- the grouping may include: associating each 2D+T connected component with a vertex in a graph and defining edges between the vertices of neighboring slices, calculating first measures for each vertex that are indicative of an LV blood pool, calculating second measures for each pair of vertices in neighboring slices that are indicative of the similarity between the connected components, and clustering the 2D connected components into the groups based on the first and second measures.
- the clustering of the 2D+T connected components into the groups based on the first and second measures may include: generating a confidence value for each vertex from the first measures, defining an edge weight for each edge based on the confidence value and the second measures, and clustering the 2D connected components into the groups based on the edge weights.
- the first measures may include a shrinking measure that indicates the amount that a 2D connected component contracts over time, a roundness measure that indicates an average roundness of a 2D connected component over time, a connectedness measure that indicates the degree of connectedness of a 2D connected component over time, and a concavity measure that indicates the degree of concavity of a 2D connected component over time.
- the second measures include an overlap measure that indicates the degree of overlap between two 2D connected components, a distance measure that indicates the distance between centers of two 2D connected components, and a size measure that indicates a difference in size between areas of two 2D connected components.
- the ROI may be generated by computing the first harmonic of a Fourier transform over time for each slice of the 3D image to generate harmonic images to highlight moving areas, where the ROI includes a part of the moving areas.
- the generation of the ROI may include: fitting a 3D line through 2D centroids of the harmonic images to remove distant artifacts, and discarding connected components of the moving image with low confidences for indicating the heart. The confidences may be based on relative motions and relative sizes of the connected components.
- An exemplary embodiment of the present invention includes a method of detecting a blood pool of a left ventricle.
- the method includes: thresholding a region of interest (ROI) to determine pixels of the ROI that correspond to blood, extracting connected components from the determined pixels, clustering the extracted connected components into groups based on criteria that are indicative of a blood pool of a left ventricle, and selecting one of the groups as the left ventricle blood pool.
- ROI region of interest
- the clustering may include: generating a first confidence value for each connected component that is indicative of a left ventricle blood pool, generating a second confidence value for pairs of the connected components that is indicative of the similarity between the connected components, and clustering the connected components into groups based on the first and second confidence values.
- the first confidence value may be derived from a shrinking measure that indicates the amount that a connected component contracts, a roundness measure that indicates an average roundness of connected component, a connectedness measure that indicates the degree of connectedness of a connected component, and a concavity measure that indicates the degree of concavity of a connected component.
- the second confidence value may be derived from an overlap measure that indicates the degree of overlap between a pair of connected components, a distance measure that indicates the distance between centers of a pair of connected components, and a size measure that indicates a difference in size between areas of a pair of connected components.
- An exemplary embodiment of the present invention includes a system for detecting a left ventricle blood pool.
- the system includes a localization unit, a thresholding unit, an extracting unit, and a clustering unit.
- the localization unit locates a region of interest (ROI) in a three-dimensional (3D) image based on motion information of each slice of a 3D image over time.
- the thresholding unit performs a thresholding on the ROI to determine pixels of the ROI that correspond to blood.
- the extracting unit extracts connected components from the determined pixels.
- the clustering unit divides the extracted connected components into groups based on criteria that are indicative of a blood pool of a left ventricle.
- the localization unit may determine the motion information by performing a Fourier transform on each slice of the 3D image over time.
- the clustering unit may divide the extracted connected components into groups using isoperimetric clustering. Parameters of the isoperimetric clustering may include measures for each connected component and pairs of the connected components that are indicative of a blood pool of a left ventricle of a heart and the similarity between connected components.
- An exemplary embodiment of the present invention includes a method of segmenting a region of interest (ROI) in a 3D+T image of a heart.
- the method includes: determining connected components in the ROI that only include blood pixels of the 3D image, clustering the connected components between slices of the ROI into groups using isoperimetric clustering, and selecting one of the groups as the left ventricle blood pool.
- Parameters of the isometric clustering may include an amount that each connected component shrinks over time and an average roundness of each connected component over time.
- the selecting one of the groups may include: ranking the groups in decreasing order of size, examining at least the first two groups, and selecting a group from the at least two groups that has a highest confidence for indicating the left ventricle blood pool.
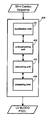
- FIG. 1 illustrates a high-level flow-chart of a method of detecting a blood pool of a left ventricle, according to an exemplary embodiment of the present invention
- FIG. 2 illustrates a high-level flow chart of a method for locating the heart in an image, according to exemplary embodiment of the present invention
- FIG. 3 illustrates an exemplary graph that may be constructed when the method of FIG. 1 is performed
- FIG. 4 illustrates a system for detecting a left ventricle blood pool, according to an exemplary embodiment of the present invention.
- FIG. 5 shows an example of a computer system capable of implementing the methods and systems according to embodiments of the present invention.
- FIGS. 1-5 exemplary embodiments for systems and methods of detecting a blood pool of a left ventricle from a plurality of images will now be discussed in further detail with reference to FIGS. 1-5 .
- This invention may, however, be embodied in different forms and should not be construed as limited to the embodiments set forth herein. Rather, these embodiments are provided so that this disclosure will be thorough and complete, and will fully convey the scope of the invention to those skilled in the art.
- the systems and methods described herein may be implemented in various forms of hardware, software, firmware, special purpose processors, or a combination thereof.
- at least a portion of the present invention may be implemented as an application comprising program instructions that are tangibly embodied on one or more program storage devices (e.g., hard disk, magnetic floppy disk, RAM, ROM, CD ROM, etc.) and executable by any device or machine comprising suitable architecture, such as a general purpose digital computer having a processor, memory, and input/output interfaces.
- FIG. 1 illustrates a high-level flow chart of a method of detecting a blood pool of a left ventricle from a plurality of images, according to an exemplary embodiment of the present invention.
- the method includes: localizing a heart in a 3D+T image based on motion information of each slice of the 3D image over time to generate a region of interest (ROI) (S 101 ), determining pixels of the ROI that are indicative of blood (S 102 ), extracting connected components from the determined pixels (S 103 ), grouping the connected components from neighboring slices of the 3D image based on criteria that are indicative of a blood pool of a left ventricle (S 104 ), and identifying the group that corresponds to the LV blood pool (S 105 ).
- ROI region of interest
- the step (S 101 ) of localizing the heart may be performed by the method of FIG. 2 , according to an exemplary embodiment of the present invention.
- the first harmonic of the Fourier transform over time for each slice of the 3D image is computed to generate a plurality of 3D harmonic images H 1 s (x,y) (S 201 ).
- the harmonic images highlight the moving structures (e.g. cardiac chamber, large vessels, etc.) within the 3D image.
- each slice an average response H 1 s of the first harmonic is computed and each harmonic image is thresholded at 2H 1 s to retain only the strongly moving areas (S 205 ).
- Connected components (CC) are extracted and then grouped between slices to generate regions of interest that are consistent in space (S 206 ).
- the CC with the largest average motion e.g., over all pixels
- the CC with the largest size is identified in each slice and the relative sizes of the other CCs are computed.
- a confidence of a CC may then be defined as its relative size times its relative motion (S 207 ).
- the CCs with the smallest confidences are removed one at a time (S 208 ) and this process is repeated until a slice containing a single CC (denoted ⁇ ) is identified (S 209 ).
- a 2D overlap between each CC and ⁇ is computed and the confidence becomes the relative size times this overlap (S 210 ).
- Connected components with a confidence lower than a threshold value are discarded (S 211 ).
- the ROI may be defined as the convex hull of the retained CCs in each of the slices (S 212 ).
- the step (S 102 ) of determining pixels of the ROI indicative of blood may include performing a thresholding on the ROI.
- the thresholding may be performed using Otsu's method to distinguish the bright pixels (i.e., those more likely to represent blood) from the rest.
- the bright pixels may also be distinguished by retaining those having intensities that are above a predefined intensity threshold and discarding the rest.
- the bright pixels may then be grouped into connected components.
- two dimensional connected components may be extracted from the ROI over time (hereinafter referred to as “2D+T connected components”).
- the 2D+T connected components may be extracted instead of 3D+T connected components, especially when the first slices of the datasets used contain the left atrium (LA).
- LA left atrium
- the bright pixels of the LV would have been connected above the bright pixels of the LA, which would have been connected below to the bright pixels of the RV, and the LV and RV would have been connected.
- the LV and the RV are connected only in the mitral valve slice.
- the connected components are likely to include the LV blood pool, the RV blood pool, the aorta, and other noisy regions.
- the grouping may be performed using an isoperimetric clustering method.
- the isoperimetric clustering method partitions a weighted graph by minimizing the perimeter to area ratio
- An edge between two vertices v i and v j is denoted e ij .
- the largest four connected components in each slice are each associated with a vertex in the graph and edges are defined between vertices in neighboring slices.
- the present invention is not limited to the largest four connected components, as other embodiments can make use of a lesser or greater number of connected components.
- the parameter A p (v i ) is used to represent the area in phase p (e.g., of the heart) of the connected component associated with a vertex v i .
- Parameters A mt (v i ) and A M (v i ) are to used to respectively represent the minimum and maximum areas over time. Measures or parameters that are indicative of the characteristics of an LV blood pool may be computed for each connected component.
- a shrinking measure S(v i ) that indicates the amount that an object (e.g., a connected component) contracts over time may be represented by equation 1 as follows:
- a roundness measure R(v i ) indicates the degree of roundness exhibited by an object over time.
- the roundness measure R(v i ) may be computed from the ratio of the smallest eigenvalue to the largest eigenvalue of a connected component in each phase, averaged over time.
- a concavity measure D(v i ) indicates the degree of concavity exhibited by an object over time.
- the concavity measure D(v i ) may be computed by determining the maximum distance (e.g., normalized between 0 and 1) between the object and its convex hull, averaged over time.
- an overall confidence L(v i ) of a connected component may be calculated using some or all of the above measures.
- the overall confidence L(v i ) may be computed using a confidence equation that varies from equation 3 or by an equation that uses less than the above measures S(v i ), R(v i ), C(v i ), and D(v i ).
- Edge weights denoted w(e ij ) may indicate a similarity between vertices.
- the normalized area a p (v i ) of a connected component in phase p may be computed by equation 4 as follows:
- Measures or parameters that are indicative of the characteristics of an LV blood pool may be computed for each pair of connected components in neighboring slices.
- An overlap measure O(v i , v j ) indicates the degree of overlap between two 2D+T connected components.
- the overlap measure O(v i , v j ) may be computed by determining the intersection of the 2D+T connected components divided by their union. For example, in one exemplary embodiment, if the overlap measure O(v i , v j ) ⁇ 0.001, the edge e ij is discarded.
- a distance measure D(v i , v j ) indicates the distance between the centers of connected components averaged over time.
- a resemblance measure T(v i , v j ) indicates the resemblance of the area-time curves of a pair of connected components. The resemblance measure T(v i , v j ) may be computed using equation 5 as follows:
- a size measure S(v i , v j ) indicates a difference in size between a pair of connected components.
- the size measure S(v i , v j ) may be computed using equation 6 as follows:
- An edge cost c(v i , v j ) may be computed using equation 7 as follows:
- An edge weight w(e ij ) may be computed from the edge cost c(v i ,v j ). For example, the edge weight w(e ij ) may be set equal to 1/c(v i , v j ).
- the isoperimetric clustering method uses an indicator vector x, a perimeter, an area, and a Laplacian matrix.
- the indicator vector x takes a binary value at each vertex and encodes the partition S according the equation 8 as follows:
- the perimeter and area of the partition may be respectively defined by equations 9 and 10 as follows:
- x T L x, (9)
- x T 1, (10) where 1 is the unit vector and L is the Laplacian matrix, which is defined by equation 11 as follows:
- the ground node may be chosen as the center of the graph (e.g., the vertex for which the shortest path to the farthest vertex the smallest, which may be recovered using Floyd Warhsall's method). This ground node may perform better to recover elongated clusters rather than the node with the largest degree.
- the graph is recursively partitioned until the isoperimetric ratio of the sub-partitions is larger than a stopping criteria.
- a grouping obtained using the above methods is likely to provide a blood pool cluster that is reasonably large, has connected components that shrink and expand over time, is reasonably round, and contain at least one main piece in each phase.
- the clusters may be ranked in decreasing order of size. In one embodiment, at least two of the largest clusters are examined, as well as those as large as the first two and any cluster of size larger than three. This is merely an example, as a fewer or greater number of the ordered clusters may be examined, and the clusters may be sized larger or smaller than three.
- a single one of the clusters ⁇ circumflex over (K) ⁇ is chosen such that a function is minimized.
- the function may be embodied by equation 12 as follows:
- FIG. 3 illustrates an example of a graph 300 that may be constructed with edge weights w(e ij ) and confidences L′(v i ) using the above described isoperimetric clustering method and the above described measures.
- the partitions are shown in the dashed lines and the LV blood pool partition is shown in the dotted lines.
- the numbers in each node (vertex) of the graph 300 are the confidences L′(v i ) and the numbers on each edge between the vertices are the edge weights w(e ij ).
- the LV blood pool is bounded by the dotted lines and includes vertices having values of 8, 7, 7, 4, 4, and 4.
- Each column of vertices corresponds to a different slice.
- the vertices within a given row of the graph 300 correspond to each of the different connected components.
- FIG. 4 illustrates a system 400 for detecting a left ventricle blood pool.
- the system includes: a localization unit 401 , a thresholding unit 402 , an extracting unit 403 , and a clustering unit 404 .
- the localization unit 401 is configured to locate a region of interest (ROI) in a three-dimensional (3D) image based on motion information of each slice of a 3D image over time.
- the thresholding unit 402 is configured to perform a thresholding on the ROI to determine pixels of the ROI that correspond to blood.
- the extracting unit 403 is configured to extract connected components from the determined pixels.
- the clustering unit 404 is configured to divide the extracted connected components into groups based on criteria that are indicative of a blood pool of a left ventricle.
- the localization unit 401 may determine the motion information by performing a Fourier transform on each slice of the 3D image over time.
- the clustering unit 404 may divide the extracted connected components into groups using isoperimetric clustering. Parameters of the isoperimetric clustering may include measures for each connected component and pairs of the connected components that are indicative of a blood pool of a left ventricle of a heart.
- FIG. 5 shows an example of a computer system which may implement a method and system of the present disclosure.
- the system and method of the present disclosure may be implemented in the form of a software application running on a computer system, for example, a mainframe, personal computer (PC), handheld computer, server, etc.
- the software application may be stored on a recording media locally accessible by the computer system and accessible via a hard wired or wireless connection to a network, for example, a local area network, or the Internet.
- the computer system referred to generally as system 1000 may include, for example, a central processing unit (CPU) 1001 , random access memory (RAM) 1004 , a printer interface 1010 , a display unit 1011 , a local area network (LAN) data transmission controller 1005 , a LAN interface 1006 , a network controller 1003 , an internal bus 1002 , and one or more input devices 1009 , for example, a keyboard, mouse etc.
- the system 1000 may be connected to a data storage device, for example, a hard disk, 1008 via a link 1007 .
Abstract
Description
A graph is a pair G=(V, E) with vertices vεV and edges eεE⊂V×V. An edge between two vertices vi and vj is denoted eij. In one embodiment of the present invention, the largest four connected components in each slice are each associated with a vertex in the graph and edges are defined between vertices in neighboring slices. However, the present invention is not limited to the largest four connected components, as other embodiments can make use of a lesser or greater number of connected components.
A roundness measure R(vi) indicates the degree of roundness exhibited by an object over time. The roundness measure R(vi) may be computed from the ratio of the smallest eigenvalue to the largest eigenvalue of a connected component in each phase, averaged over time. A connectedness measure C(vi) indicates the degree of connectedness exhibited by an object over time. Connected components when observed in each phase can be composed of multiple pieces. The relative size of these pieces is denoted by rp j(vi), j=1, . . . ,ni and the connectedness measure C(vi) may be computed by equation 2 as follows:
A concavity measure D(vi) indicates the degree of concavity exhibited by an object over time. The concavity measure D(vi) may be computed by determining the maximum distance (e.g., normalized between 0 and 1) between the object and its convex hull, averaged over time.
L(v i)=F 1 S(v i)(1−R(v i))C(v i)F
where factors F1, F2, F3 may be determined empirically. In one embodiment, factor F1= 1/50 and factors F2 and F3=10. However, the present invention is not limited to these particular factors, as the factors may be adjusted in various ways. Further, the overall confidence L(vi) may be computed using a confidence equation that varies from equation 3 or by an equation that uses less than the above measures S(vi), R(vi), C(vi), and D(vi).
Measures or parameters that are indicative of the characteristics of an LV blood pool may be computed for each pair of connected components in neighboring slices.
A size measure S(vi, vj) indicates a difference in size between a pair of connected components. The size measure S(vi, vj) may be computed using equation 6 as follows:
where vi is on the slice below vj. The connected components may grow smaller as one traverses down through slices closer to the apex. Thus, the size measure S(vi, vj) may stay close to one for connected components in the LV blood pool.
An edge weight w(eij) may be computed from the edge cost c(vi,vj). For example, the edge weight w(eij) may be set equal to 1/c(vi, vj).
The perimeter and area of the partition may be respectively defined by
|∂S|=x T L x, (9)
|S|=x T1, (10)
where 1 is the unit vector and L is the Laplacian matrix, which is defined by equation 11 as follows:
where Nk is the number of vertices in cluster K and L′(vi)=S(vi)(1−R(vi))C(vi)10 is the confidence of a connected component. The cluster with smaller L′ is the blood pool. The 2D convex hulls of the connected components in {circumflex over (K)} define the left ventricle blood pool. Concavity D may be included in alternate embodiments of L′.
Claims (16)
Priority Applications (1)
| Application Number | Priority Date | Filing Date | Title |
|---|---|---|---|
| US12/398,425 US8433113B2 (en) | 2008-03-12 | 2009-03-05 | Automatic recovery of the left ventricular blood pool in cardiac cine magnetic resonance images |
Applications Claiming Priority (2)
| Application Number | Priority Date | Filing Date | Title |
|---|---|---|---|
| US3588708P | 2008-03-12 | 2008-03-12 | |
| US12/398,425 US8433113B2 (en) | 2008-03-12 | 2009-03-05 | Automatic recovery of the left ventricular blood pool in cardiac cine magnetic resonance images |
Publications (2)
| Publication Number | Publication Date |
|---|---|
| US20090232371A1 US20090232371A1 (en) | 2009-09-17 |
| US8433113B2 true US8433113B2 (en) | 2013-04-30 |
Family
ID=41063080
Family Applications (1)
| Application Number | Title | Priority Date | Filing Date |
|---|---|---|---|
| US12/398,425 Active 2031-02-03 US8433113B2 (en) | 2008-03-12 | 2009-03-05 | Automatic recovery of the left ventricular blood pool in cardiac cine magnetic resonance images |
Country Status (1)
| Country | Link |
|---|---|
| US (1) | US8433113B2 (en) |
Families Citing this family (5)
| Publication number | Priority date | Publication date | Assignee | Title |
|---|---|---|---|---|
| US7715627B2 (en) * | 2005-03-25 | 2010-05-11 | Siemens Medical Solutions Usa, Inc. | Automatic determination of the standard cardiac views from volumetric data acquisitions |
| US8494236B2 (en) * | 2009-10-07 | 2013-07-23 | Siemens Aktiengesellschaft | System and method for cardiac segmentation in MR-cine data using inverse consistent non-rigid registration |
| CN102890823B (en) * | 2011-07-19 | 2016-04-27 | 株式会社东芝 | Motion object outline is extracted and left ventricle image partition method and device |
| CN102890824B (en) | 2011-07-19 | 2015-07-29 | 株式会社东芝 | Motion object outline tracking and device |
| US10346993B2 (en) * | 2015-11-17 | 2019-07-09 | Shanghai United Imaging Healthcare Co., Ltd. | Systems and methods for image processing in magnetic resonance imaging |
Citations (14)
| Publication number | Priority date | Publication date | Assignee | Title |
|---|---|---|---|---|
| US6236738B1 (en) * | 1998-04-09 | 2001-05-22 | Board Of Trustees Of The Leland Stanford Junior University | Spatiotemporal finite element method for motion analysis with velocity data |
| US20050238215A1 (en) * | 2001-10-04 | 2005-10-27 | Marie-Pierre Jolly | System and method for segmenting the left ventricle in a cardiac image |
| US20060062457A1 (en) * | 2004-09-22 | 2006-03-23 | Leo Grady | Image segmentation using isoperimetric trees |
| US20060064007A1 (en) * | 2004-09-02 | 2006-03-23 | Dorin Comaniciu | System and method for tracking anatomical structures in three dimensional images |
| US20060159343A1 (en) * | 2005-01-18 | 2006-07-20 | Leo Grady | System and method for multi-label image segmentation of digital photographs |
| US20060239554A1 (en) * | 2005-03-25 | 2006-10-26 | Ying Sun | Automatic determination of the standard cardiac views from volumetric data acquisitions |
| US20070253609A1 (en) * | 2006-04-28 | 2007-11-01 | Aben Jean-Paul M M | Method, Apparatus and Computer Program Product for Automatic Segmenting of Cardiac Chambers |
| US7339585B2 (en) * | 2004-07-19 | 2008-03-04 | Pie Medical Imaging B.V. | Method and apparatus for visualization of biological structures with use of 3D position information from segmentation results |
| US20090080745A1 (en) * | 2007-09-21 | 2009-03-26 | Yefeng Zheng | Method and system for measuring left ventricle volume |
| US7519220B2 (en) * | 2004-11-15 | 2009-04-14 | Siemens Medical Solutions Usa, Inc. | GPU accelerated isoperimetric algorithm for image segmentation, digital photo and video editing |
| US20090279758A1 (en) * | 2008-03-05 | 2009-11-12 | Dikici Engin | System and method for 3d vessel segmentation with minimal cuts |
| US7715626B2 (en) * | 2005-03-23 | 2010-05-11 | Siemens Medical Solutions Usa, Inc. | System and method for vascular segmentation by Monte-Carlo sampling |
| US7715603B2 (en) * | 2003-02-27 | 2010-05-11 | Siemens Aktiengesellschaft | Method for processing available time/phase-dependent primary data sets of a computer tomograph of a displaced object to form a three-dimensional image sequence |
| US8000497B2 (en) * | 2006-10-18 | 2011-08-16 | Siemens Corporation | Fast detection of left ventricle and its configuration in 2D/3D echocardiogram using probabilistic boosting network |
-
2009
- 2009-03-05 US US12/398,425 patent/US8433113B2/en active Active
Patent Citations (14)
| Publication number | Priority date | Publication date | Assignee | Title |
|---|---|---|---|---|
| US6236738B1 (en) * | 1998-04-09 | 2001-05-22 | Board Of Trustees Of The Leland Stanford Junior University | Spatiotemporal finite element method for motion analysis with velocity data |
| US20050238215A1 (en) * | 2001-10-04 | 2005-10-27 | Marie-Pierre Jolly | System and method for segmenting the left ventricle in a cardiac image |
| US7715603B2 (en) * | 2003-02-27 | 2010-05-11 | Siemens Aktiengesellschaft | Method for processing available time/phase-dependent primary data sets of a computer tomograph of a displaced object to form a three-dimensional image sequence |
| US7339585B2 (en) * | 2004-07-19 | 2008-03-04 | Pie Medical Imaging B.V. | Method and apparatus for visualization of biological structures with use of 3D position information from segmentation results |
| US20060064007A1 (en) * | 2004-09-02 | 2006-03-23 | Dorin Comaniciu | System and method for tracking anatomical structures in three dimensional images |
| US20060062457A1 (en) * | 2004-09-22 | 2006-03-23 | Leo Grady | Image segmentation using isoperimetric trees |
| US7519220B2 (en) * | 2004-11-15 | 2009-04-14 | Siemens Medical Solutions Usa, Inc. | GPU accelerated isoperimetric algorithm for image segmentation, digital photo and video editing |
| US20060159343A1 (en) * | 2005-01-18 | 2006-07-20 | Leo Grady | System and method for multi-label image segmentation of digital photographs |
| US7715626B2 (en) * | 2005-03-23 | 2010-05-11 | Siemens Medical Solutions Usa, Inc. | System and method for vascular segmentation by Monte-Carlo sampling |
| US20060239554A1 (en) * | 2005-03-25 | 2006-10-26 | Ying Sun | Automatic determination of the standard cardiac views from volumetric data acquisitions |
| US20070253609A1 (en) * | 2006-04-28 | 2007-11-01 | Aben Jean-Paul M M | Method, Apparatus and Computer Program Product for Automatic Segmenting of Cardiac Chambers |
| US8000497B2 (en) * | 2006-10-18 | 2011-08-16 | Siemens Corporation | Fast detection of left ventricle and its configuration in 2D/3D echocardiogram using probabilistic boosting network |
| US20090080745A1 (en) * | 2007-09-21 | 2009-03-26 | Yefeng Zheng | Method and system for measuring left ventricle volume |
| US20090279758A1 (en) * | 2008-03-05 | 2009-11-12 | Dikici Engin | System and method for 3d vessel segmentation with minimal cuts |
Non-Patent Citations (10)
| Title |
|---|
| Cocosco, Chris A., et al., "Automatic Image-Driven Segmentation of Cardiac Ventricles in Cine Anatomical MRI", Proc. of SPIE Applications of Digital Image Processing, vol. 5909 (2005), pp. 1-11. |
| Gering, David T., "Automatic Segmentation of Cardiac MRI", Proc. MICCAI (2003) pp. 524-532. |
| Grady, L. et al., "Isoperimetric Partitioning: A New Algorithm for Graph Partitioning", SIAM Journal on Scientific Computing 27 (6) (2006), pp. 1844-1866. |
| Jolly, Marie-Pierre, "Automatic Segmentation of the Left Ventricle in Cardiac MR and CT Images", International Journal of Computer Vision 70(2) (2006), pp. 151-163. |
| Kaus, Michael R., et al., "Automated Segmentation of the Left Ventricle in Cardiac MRI", Medical Image Analysis 8 (2004), pp. 245-254. |
| Lin, Xiang et al, "Automated Detection of Left Ventricles in 4D MR Images: Experience from a Large Study", Proc. MICCAI 2006, pp. 728-735. |
| Lorenzo-Valdes, Maria, et al., "Segmentation of 4D Cardiac MR Images Using a Probabilistic Atlas and the EM Algorithm", Medical Image Analysis 8 (2004), pp. 255-265. |
| Mitchell, Steven C., et al., "Multistage Hybrid Active Appearance Model Matching: Segmentation of Left and Right Ventricles in Cardiac MR Images", IEEE Transactions of Medical Imaging, vol. 20, No. 5, May 2001, pp. 415-423. |
| Otsu, Nobuyuki, "A Threshold Selection Method from Gray-Level Histograms", IEEE Trans. Systems, Man and Cybernatics 9 (1979), pp. 62-66. |
| Phumeechanya Sopon, et al., Left Ventricular Segmentation Using Double Region-Based Snakes, Proc. ISBI (2007), pp. 840-843. |
Also Published As
| Publication number | Publication date |
|---|---|
| US20090232371A1 (en) | 2009-09-17 |
Similar Documents
| Publication | Publication Date | Title |
|---|---|---|
| US11344273B2 (en) | Methods and systems for extracting blood vessel | |
| Jolly | Automatic segmentation of the left ventricle in cardiac MR and CT images | |
| Zotti et al. | Convolutional neural network with shape prior applied to cardiac MRI segmentation | |
| US10235750B2 (en) | Segmentation of cardiac magnetic resonance (CMR) images using a memory persistence approach | |
| Namburete et al. | Fully-automated alignment of 3D fetal brain ultrasound to a canonical reference space using multi-task learning | |
| Peng et al. | A review of heart chamber segmentation for structural and functional analysis using cardiac magnetic resonance imaging | |
| EP1851722B1 (en) | Image processing device and method | |
| US10169873B2 (en) | Weakly supervised probabilistic atlas generation through multi-atlas label fusion | |
| Sundaresan et al. | Automated characterization of the fetal heart in ultrasound images using fully convolutional neural networks | |
| US7400757B2 (en) | System and method for segmenting the left ventricle in a cardiac image | |
| CN106340021B (en) | Blood vessel extraction method | |
| CN101596111B (en) | Automatic localization of the left ventricle in cardiac cine magnetic resonance imaging | |
| CN102890823A (en) | Motion object outline extraction and left ventricular image segmentation method and device | |
| Leclerc et al. | A fully automatic and multi-structural segmentation of the left ventricle and the myocardium on highly heterogeneous 2D echocardiographic data | |
| Dong et al. | A left ventricular segmentation method on 3D echocardiography using deep learning and snake | |
| US8433113B2 (en) | Automatic recovery of the left ventricular blood pool in cardiac cine magnetic resonance images | |
| US9042619B2 (en) | Method and system for automatic native and bypass coronary ostia detection in cardiac computed tomography volumes | |
| Lei et al. | Echocardiographic image multi‐structure segmentation using Cardiac‐SegNet | |
| Liu et al. | Automatic segmentation algorithm of ultrasound heart image based on convolutional neural network and image saliency | |
| US20230005140A1 (en) | Automated detection of tumors based on image processing | |
| Zotti et al. | Novel deep convolution neural network applied to MRI cardiac segmentation | |
| Guo et al. | A novel myocardium segmentation approach based on neutrosophic active contour model | |
| Jolly | Automatic recovery of the left ventricular blood pool in cardiac cine MR images | |
| Lu et al. | AutoMPR: Automatic detection of standard planes in 3D echocardiography | |
| Zhu et al. | Automatic segmentation of the left atrium from MRI images using salient feature and contour evolution |
Legal Events
| Date | Code | Title | Description |
|---|---|---|---|
| AS | Assignment |
Owner name: SIEMENS CORPORATE RESEARCH, INC., NEW JERSEY Free format text: ASSIGNMENT OF ASSIGNORS INTEREST;ASSIGNOR:JOLLY, MARIE-PIERRE;REEL/FRAME:022469/0054 Effective date: 20090324 |
|
| AS | Assignment |
Owner name: SIEMENS AKTIENGESELLSCHAFT, GERMANY Free format text: ASSIGNMENT OF ASSIGNORS INTEREST;ASSIGNOR:SIEMENS CORPORATE RESEARCH, INC.;REEL/FRAME:023289/0172 Effective date: 20090923 Owner name: SIEMENS AKTIENGESELLSCHAFT,GERMANY Free format text: ASSIGNMENT OF ASSIGNORS INTEREST;ASSIGNOR:SIEMENS CORPORATE RESEARCH, INC.;REEL/FRAME:023289/0172 Effective date: 20090923 |
|
| STCF | Information on status: patent grant |
Free format text: PATENTED CASE |
|
| AS | Assignment |
Owner name: SIEMENS HEALTHCARE GMBH, GERMANY Free format text: ASSIGNMENT OF ASSIGNORS INTEREST;ASSIGNOR:SIEMENS AKTIENGESELLSCHAFT;REEL/FRAME:039271/0561 Effective date: 20160610 |
|
| FPAY | Fee payment |
Year of fee payment: 4 |
|
| MAFP | Maintenance fee payment |
Free format text: PAYMENT OF MAINTENANCE FEE, 8TH YEAR, LARGE ENTITY (ORIGINAL EVENT CODE: M1552); ENTITY STATUS OF PATENT OWNER: LARGE ENTITY Year of fee payment: 8 |
|
| AS | Assignment |
Owner name: SIEMENS HEALTHINEERS AG, GERMANY Free format text: ASSIGNMENT OF ASSIGNORS INTEREST;ASSIGNOR:SIEMENS HEALTHCARE GMBH;REEL/FRAME:066088/0256 Effective date: 20231219 |