US7761394B2 - Augmented dataset representation using a taxonomy which accounts for similarity and dissimilarity between each record in the dataset and a user's similarity-biased intuition - Google Patents
Augmented dataset representation using a taxonomy which accounts for similarity and dissimilarity between each record in the dataset and a user's similarity-biased intuition Download PDFInfo
- Publication number
- US7761394B2 US7761394B2 US11/457,103 US45710306A US7761394B2 US 7761394 B2 US7761394 B2 US 7761394B2 US 45710306 A US45710306 A US 45710306A US 7761394 B2 US7761394 B2 US 7761394B2
- Authority
- US
- United States
- Prior art keywords
- dataset
- term
- record
- vocabulary
- taxonomy
- Prior art date
- Legal status (The legal status is an assumption and is not a legal conclusion. Google has not performed a legal analysis and makes no representation as to the accuracy of the status listed.)
- Expired - Fee Related, expires
Links
Images


Classifications
-
- G—PHYSICS
- G06—COMPUTING OR CALCULATING; COUNTING
- G06N—COMPUTING ARRANGEMENTS BASED ON SPECIFIC COMPUTATIONAL MODELS
- G06N5/00—Computing arrangements using knowledge-based models
- G06N5/02—Knowledge representation; Symbolic representation
- G06N5/022—Knowledge engineering; Knowledge acquisition
-
- G—PHYSICS
- G06—COMPUTING OR CALCULATING; COUNTING
- G06F—ELECTRIC DIGITAL DATA PROCESSING
- G06F16/00—Information retrieval; Database structures therefor; File system structures therefor
- G06F16/20—Information retrieval; Database structures therefor; File system structures therefor of structured data, e.g. relational data
- G06F16/28—Databases characterised by their database models, e.g. relational or object models
- G06F16/284—Relational databases
- G06F16/285—Clustering or classification
-
- G—PHYSICS
- G06—COMPUTING OR CALCULATING; COUNTING
- G06F—ELECTRIC DIGITAL DATA PROCESSING
- G06F18/00—Pattern recognition
- G06F18/20—Analysing
- G06F18/23—Clustering techniques
- G06F18/231—Hierarchical techniques, i.e. dividing or merging pattern sets so as to obtain a dendrogram
-
- G—PHYSICS
- G06—COMPUTING OR CALCULATING; COUNTING
- G06N—COMPUTING ARRANGEMENTS BASED ON SPECIFIC COMPUTATIONAL MODELS
- G06N7/00—Computing arrangements based on specific mathematical models
- G06N7/01—Probabilistic graphical models, e.g. probabilistic networks
Definitions
- Embodiments of the present invention relate generally to methods and systems adapted to cluster categorical data. More specifically, embodiments of the present invention relate to methods and systems adapted to augment a categorical dataset by imputation.
- Data is often organized in a clustering process by separating an arbitrary dataset into a plurality of subsets (i.e., clusters) according to some inherent similarity measure between data within the dataset, wherein data within a particular cluster is characterized by some common trait or attribute. Subsequently, category labels are generated using the clusters and a classifier for the dataset is constructed using the category labels.
- Clustering processes can be characterized according to the manner in which they form clusters. Two common clustering techniques include partitional and hierarchical techniques.
- Partitional clustering techniques organize a dataset into a single collection of clusters that usually do not overlap, wherein data within each cluster is uniformly similar.
- Hierarchical clustering algorithms create a hierarchy of clusters representing a range (e.g., from coarse to fine) of intra-cluster similarity.
- Hierarchical clustering algorithms are generally classified according to the manner in which they construct the cluster hierarchy. Thus, agglomerative hierarchical clustering algorithms build the cluster hierarchy from the bottom up by progressively merging smaller clusters into larger clusters while divisive hierarchical clustering algorithms build the hierarchy from the top down by progressively dividing larger clusters to form smaller clusters.
- clustering algorithms work well when the dataset is numerical (i.e., when data within the dataset are all related by some inherent similarity metric or natural order).
- Numerical datasets often describe a single attribute or category.
- Categorical datasets describe multiple attributes or categories that are often discrete, lacking a natural similarity measure between them. From the clustering perspective this also implies that the centroid of a cluster in a categorical dataset is an undefinable entity. Therefore, categorical data is usually not effectively clustered using partitional clustering techniques.
- one type of categorical data e.g., electronic program guide (EPG) data
- EPG electronic program guide
- an attribute e.g., a descriptor field
- the dimension of the vector space can quickly attain a high dimension (e.g., with O(1000) features) and sparse in that vectors within the dataset typically have more than 99% of their components equal to zero.
- a typical EPG dataset may include 2,154 records, wherein the descriptor fields of the records collectively contain 2,694 unique terms.
- the average number of appearances of a term per record is 4.3. But this average is skewed upwards by a small number records (e.g., 2%) having a large number (e.g., 30 or more) of terms (i.e., nonzero features in the term vector). 56% of the records have 3 or fewer terms, resulting in a dataset having a sparsity of at least 3/2694 ⁇ 99.9%. 76% of the records have 5 or fewer terms, giving a sparseness of at least 5/2694>99.8%.
- One embodiment describes a computerized method of representing a dataset with a taxonomy.
- a dataset comprising a plurality of records is obtained.
- the dataset is characterized by a vocabulary and each of the plurality of records being characterized by at least one term within the vocabulary.
- nearest neighbors for each term within the vocabulary are identified.
- a degree of membership for each nearest neighbor identified is imputed for each term within the vocabulary.
- the obtained dataset is augmented with the imputed degree of membership.
- a taxonomy of the augmented dataset is then generated.
- Another embodiment describes a computer program product including a computer usable medium having computer readable code embodied therein for causing a computer to effect obtaining a dataset comprising a plurality of records, wherein the dataset is characterized by a vocabulary and each of the plurality of records is characterized by at least one term within the vocabulary.
- the computer readable code is also adapted to cause the computer to identify nearest neighbors for each term within the vocabulary.
- the computer readable code is also adapted to cause the computer to impute a degree of membership for each nearest neighbor identified for each term within the vocabulary.
- the computer readable code is adapted to cause the computer to augment the obtained dataset with the imputed degree of membership.
- the computer readable code is adapted to cause the computer to generate a taxonomy of the augmented dataset.
- FIG. 1 illustrates a diagram of a system for assisting a user in searching and automatically organizing information.
- FIG. 2 illustrates an exemplary process of augmenting a dataset and generating a taxonomy from the augmented categorical dataset in accordance with embodiments of the present invention.
- FIG. 3 illustrates an exemplary pre-processing method as applied to categorical data in accordance with embodiments of the present invention.
- FIG. 4 illustrates an exemplary ontology onto which records containing categorical data are mapped in accordance with embodiments of the present invention.
- FIG. 5 illustrates an exemplary process of cleaning categorical data in accordance with embodiments of the present invention.
- FIG. 6 illustrates an exemplary process of augmenting a dataset with imputed information in accordance with embodiments of the present invention.
- FIG. 7 illustrates an exemplary process of identifying nearest neighbors of each term in a vocabulary.
- FIG. 8 illustrates an exemplary process of generating a taxonomy in connection with the process shown in FIG. 2 .
- FIG. 9 illustrates an exemplary process of initializing a hierarchy level index in connection with the process shown in FIG. 8 .
- FIG. 10 illustrates an exemplary process of creating an internal representation of leaf clusters in connection with the process shown in FIG. 8 .
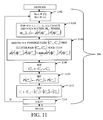
- FIG. 11 illustrates an exemplary process of building a hierarchy in connection with the process shown in FIG. 8 .
- FIG. 12 illustrates an exemplary process of identifying and merging cluster pairs in accordance in connection with the process shown in FIG. 11 .
- FIG. 1 illustrates a diagram of a system 100 for assisting a user in searching and automatically organizing information, such as content, which can be characterized by categorical data 110 .
- content may be, for example, recorded TV programs, electronic program guide (EPG) entries, and multimedia content.
- EPG electronic program guide
- the system 100 may further assist the user in tracking preferences of the user, and may also provide recommendations to the user.
- the system 100 can further be used by the user to search by example and/or by query.
- the system 100 includes an input processing module 109 , a clustering/classification module 120 , a data analysis module 140 , and a user interface 150 . Also shown in FIG. 1 are categorical data 110 and an organizational structure 130 .
- Categorical data describes multiple attributes or categories. Often the categories are discrete and lack a natural similarity measure between them.
- the system 100 includes an input processing module 109 to pre-process input data into categorical data and load the categorical data 110 .
- the categorical data 110 is grouped into clusters, and/or classified into folders by the clustering/classification module 120 .
- the category and classification methods described herein can operate on any arbitrary categorical dataset.
- the clustering/classification module 120 may augment the categorical data for example, by imputing attributes of the categorical data.
- the augmentation may reduce any scarceness of categorical data while increasing the overall quality of the categorical data to aid the clustering and classification processes.
- Augmenting by imputation allows the similarity between records characterizing the categorical data to be increased by reducing the sparsity of the dataset while keeping the dimension of the vocabulary fixed.
- the resulting augmented dataset will, therefore, be more informative and generate a taxonomy that satisfies a user's similarity-biased intuition while taking into account both similarity and dissimilarity factors.
- Classification is the task of assigning data points to one or more of the identified categories based on some predefined proximity or divergence measure.
- the clustering/classification module 120 uses a folder-based classification system.
- the folder-based classification system allows a user to build a classifier by creating a group of folders. Each folder within the group is instantiated by a number of exemplary categorical data records.
- one or more of the exemplary records may be input by the user.
- a group of folders created by the user may act as a classifier such that new categorical data records are compared against the user-created group of folders and automatically sorted into the most appropriate folder.
- the folder-based classifier automatically creates a collection of folders, and automatically adds and deletes folders to or from the collection.
- the folder-based classifier may also automatically modify the contents of other folders not in the collection.
- the output of the clustering/classification module 120 is an organizational data structure 130 , such as a dendrogram, a cluster tree, or a matrix, collectively referred to herein as a taxonomy.
- a cluster tree may be used as an indexed organization of the categorical data or to select a suitable cluster of the data.
- an output of the clustering/classification module 120 includes an optimal layer that contains a unique cluster group containing an optimal number of clusters.
- a data analysis module 140 may use the folder-based classifiers and/or classifiers generated by clustering operations for automatic recommendation or selection of content.
- the data analysis module 140 may automatically recommend or provide content that may be of interest to a user or may be similar or related to content selected by a user.
- the data analysis module 140 assigns categorical data records for new content items with the appropriate folders based on similarity.
- a user interface 150 also shown in FIG. 1 is designed to assist the user in searching and automatically organizing content using the system 100 .
- the clustering/classification module 120 may be implemented as different separate modules or may be combined into one or more modules.
- FIG. 2 illustrates an exemplary process of augmenting a categorical dataset and generating a taxonomy from the augmented categorical dataset in accordance with embodiments of the present invention.
- an exemplary process flow of augmenting a categorical dataset and generating a taxonomy from the augmented categorical dataset proceeds as follows: receive input data ( 202 ), pre-process the received input data into the aforementioned categorical data ( 204 ), and augment the categorical data ( 206 ). Subsequently, a taxonomy of the augmented categorical data can be generated ( 208 ) and category labels for the generated taxonomy can be assigned ( 210 ).
- the input data received at 202 includes a plurality of records electronically input into the system 100 .
- a record can be a document, a video, photograph, music, or the like, or any combination thereof.
- each record is mapped onto a system ontology ( 302 ) and the dataset formed from the received records is “cleaned” ( 304 ).
- records within the received dataset can be mapped onto predetermined fields of a system ontology at 302 .
- the format of the data, the transformations expected, and the format of the output data are specified in a language designed to describe metadata such as RDF.
- RDF employs a graph-based data model with a well-defined entailment relation.
- RDF is expressed in an XML format, the syntax of which explicitly specifies the parameters required and simplifies specification of the transformation process.
- FIG. 4 illustrates an exemplary ontology onto which records containing categorical data are mapped in accordance with embodiments of the present invention.
- the ontology 400 is characterized by a plurality of attributes 402 (i.e., 402 a to 402 x ), wherein each attribute is further characterized by one or more terms 404 .
- the predetermined ontology adds abstract terms to particular attributes of a record to facilitate processing of the electronic record by the system 100 .
- the ontology thus provides a means for uniformly representing records in a manner that the system 100 can recognize efficiently.
- a received record can be a document describing a particular television program.
- Data mapped into a first attribute 402 a corresponds to record identifier (e.g., a particular television program) and is characterized by the term “8498618”;
- data mapped into another attribute 402 d i.e., a “descriptor attribute” corresponds to keywords for the television program identified in attribute 402 a and is characterized by the terms listed from “Best” to “Child”;
- data mapped into attribute 402 n i.e., a “genre attribute” corresponds to the genre for the television program identified in attribute 402 a and is characterized by the terms “Kids” and “Cartoon”;
- data mapped into other attributes correspond to the date, start time, end time, duration, of the television program identified in attribute 402 a and are characterized by the terms “20040410”, “0930”, “1000”, and “30”, respectively.
- the term “***” represents missing data.
- the same term can appear multiple times within the same attribute (e.g., the keyword attribute 402 d contains multiple instances of the term “Family”.
- terms such as “0SubCulture” are abstract terms supplemented by the ontology.
- Records are represented within the system as multi-component vectors.
- the dimension of each vector corresponds to the total number of terms characterizing all attributes found in all records processed by the system (i.e., the global vocabulary of the system).
- Values assigned to components of a vector represent the presence of a term within a corresponding record.
- a vector component can be binarily represented as either a 0 (indicating the absence of a term from a record) or a 1 (indicating the presence of a term in a record).
- a first record d 1 include the terms A, B, D, and E and a second record d 2 include the terms C, D, and F.
- the global vocabulary consists of only six terms. In practice, however, the global vocabulary includes thousands of terms, wherein any particular record includes only a relatively small number of terms. Accordingly, only a relatively few number of vector components are assigned non-zero values. In practice, therefore, records are typically represented as highly “sparse” vectors that can be difficult to process to efficiently generate folder sets and yield inaccurate results. To increase the efficiency with which folder sets are generated, and to produce more accurate results, each record is “cleaned” at 304 .
- vector components can be numerically represented (as opposed to binarily represented) by a value corresponding to the number of times that a term occurs in a record (i.e., the frequency of the term in the record) or by a normalized value corresponding to the number of times that a term occurs in a record in addition to the total number of terms the record contains (i.e., the normalized frequency of the term in the record).
- a value corresponding to the number of times that a term occurs in a record i.e., the frequency of the term in the record
- a normalized value corresponding to the number of times that a term occurs in a record in addition to the total number of terms the record contains
- a record can be cleaned, for example, by removing terms ( 502 ), splitting attributes ( 504 ), and replacing terms ( 506 ).
- terms can be removed by removing terms from attributes that are not generally useful in generating a folder set or in classifying records based on the generated folder set.
- Non-useful terms can be identified as those that occur infrequently (e.g., once) within a particular attribute of a record.
- the total number of terms within the attribute vocabulary can be significantly reduced. For example, suppose the system receives 2154 records describing television programs playing over the course of a week. Such a collection of records may include 3016 description keywords, wherein each record contains an average of 5.37 keywords, wherein each keyword occurs an average of 4.29 times, and wherein 1113 keywords occur just once.
- the size of the description keyword attribute space can be reduced by about 33%.
- the attributes are split by splitting large record attributes (i.e., attributes characterized by a large number of unique terms) into a plurality of smaller sub-attributes characterized by a smaller number of unique terms.
- large record attributes i.e., attributes characterized by a large number of unique terms
- sub-attributes characterized by a smaller number of unique terms.
- a large attribute can be split into a plurality of smaller sub-attributes by grouping terms within the large attribute based on their frequency of occurrence within the large attribute. In this case, it is assumed that terms occurring more frequently are more relevant, and thus more important, than terms occurring less frequently). As a result, information indicating relevance levels of particular sub-attributes is imparted and used as a weighting value to reflect the relative importance of each sub-attribute.
- the size and number of the sub-attributes created as a result of the splitting can be controlled, for example, by specifying the proportions of frequencies or value of frequencies desired in each sub-attribute.
- a large attribute can be split into a plurality of sub-attributes by grouping semantically-related terms.
- meanings of words may be internally generated or obtained from a lexical reference system such as WordNet, a lexical reference system developed at the Cognitive Science Laboratory at Princeton University.
- WordNet a lexical reference system developed at the Cognitive Science Laboratory at Princeton University.
- information indicating a certain degree of “common-sense” is imparted and used as a weighting value to reflect the relevance of each sub-attribute.
- the size and number of the sub-attributes created as a result of the splitting can be controlled using statistics about particular terms and term frequencies in the attribute.
- the total number of occurrences of terms within each sub-attribute can be maintained within a predetermined range to control the degree of relatedness between terms in a particular sub-attribute or to control the abstractness of relationships between terms within a sub-attribute.
- terms that can be grouped together into a sub-attribute according to their semantic interrelatedness are identified using an “is-a” (hypernym) chain relation as applied to nouns.
- dog canine, carnivore, placental, mammal, vertebrate, chordate, animal, organism, living thing, object, entity
- a cat is a feline, a feline is a carnivore, etc.
- a dog is a canine, a canine is a carnivore, etc.
- an umbrella is a canopy, a canopy is a shelter, etc.
- the terms ‘cat’ and ‘dog’ share the ‘carnivore’ hypernym relation much earlier in the chain than they share the ‘object’ hypernym relation with the term ‘umbrella’. Accordingly, the term ‘cat’ is more semantically related to the term ‘dog’ than it is related to the term ‘umbrella’.
- one large attribute may, for example, be divided into two smaller sub-attributes, wherein the first sub-attribute, related to recreation, contains the terms ‘Recreation’, ‘Pachinko’, ‘Hobby’, ‘Fun’, ‘Entertainment’, ‘Encore’, ‘Swimming’, ‘Skating’, ‘Gymnastics’, ‘Hunting’, ‘Fishing’, ‘Tennis’, ‘Basketball’, ‘Golf’, ‘Soccer’, ‘Baseball’, and ‘Athletics’ while the second sub-attribute, related to food, contains the terms ‘Tofu’, ‘Food’, ‘Diet’, ‘Vitamin’, ‘Sushi’, ‘Soup’, ‘Pudding’, ‘Dessert’, ‘Chocolate’, and ‘Beverage’.
- each of the terms identified above can be further divided into smaller
- terms can be replaced by replacing specific terms with equivalent, more abstract terms.
- terms found, for example, in WordNet can be replaced with equivalent, more abstract terms.
- the number of unique terms characterizing an attribute of a record can be reduced because several specific terms can be mapped onto the same abstract term.
- vector representations of records become much less sparse because each abstract term appears in more records and there are proportionately more abstract terms appearing in each record.
- the size and number of the sub-attributes created as a result of the term replacements can be controlled using statistics about particular terms and term frequencies in the attribute.
- the specific terms ‘Brother’, ‘Sister’, ‘Grandchild’, ‘Baby’, ‘Infant’, ‘Son’, ‘Daughter’, ‘Husband’, ‘Mother’, ‘Parent’, and ‘Father’ of an attribute can all be mapped onto an equivalent abstract term ‘relative’.
- the specific terms ‘Hunting’, ‘Fishing’, ‘Gymnastics’, ‘Basketball’, ‘Tennis’, ‘Golf’, ‘Soccer’, ‘Football’, and ‘Baseball’ of an attribute can all be mapped onto an equivalent abstract term ‘sport’.
- the dataset D produced as a result of the pre-processing at 204 contains m records d 1 , d 2 , . . . , d m and is characterized by an attribute space containing d attributes, A 1 , A 2 , . . . , A d .
- n i unique terms contained within a vocabulary V i ⁇ v i 1 , v i 2 , . . . , v i n i ⁇ specific to A i .
- a global vocabulary V contains n unique terms characterizing the global attribute space A (i.e., a combination of all attributes within the dataset D), such that
- the dataset D can be represented as an m ⁇ n matrix. Accordingly, each row of the m ⁇ n matrix corresponds to a vector-space representation of a particular record.
- the dataset D can be augmented at 206 .
- the dataset D can be augmented according to an imputation process exemplarily described below with respect to FIG. 6 .
- an exemplary imputation process flow proceeds as follows: identify k nearest neighbors u for each term v in the global vocabulary V ( 602 ), impute the degree of membership d(u
- k (where 0 ⁇ k ⁇ K) nearest neighbors, u, for each term v in the global vocabulary V are identified at 602 .
- the nearest neighbors u identified for each particular term v define a neighborhood N(v) of k nearest neighbors u.
- the k nearest neighbors u for each term v can be identified by any suitable method.
- the k nearest neighbors u for each term v can be identified by determining whether a term that is a potential nearest neighbor has at least a predetermined similarity with the term v.
- v) (where 0 ⁇ d ⁇ 1) imputed to each nearest neighbor u with respect to a term v at 604 represents the semantic association that the nearest neighbor u (also a term v ⁇ V) has with the term v. Accordingly, the value of d(u
- v) 1 when the nearest neighbor u has a high semantic association with the term v and the value of d(u
- v) 0 when the nearest neighbor u has a low semantic association with the term v.
- v) can be imputed by any suitable method. For example, degree of membership for a nearest neighbor can be computed by determining the relative similarity of the nearest neighbor u across the entire neighborhood N(v).
- the relative similarity of the nearest neighbor u can be obtained by 1) summing the absolute similarity between the nearest neighbor u and each term within the neighborhood N(v); and 2) dividing the absolute similarity between the nearest neighbor u and the term v buy the summation value.
- the vocabulary is augmented with the imputed degree of membership d(u
- An exemplary process of augmenting the dataset D will now be discussed below with respect to FIG. 7 .
- the dataset D can be augmented with the imputed degree of membership d(u
- 704 can be accomplished by determining whether the term frequency for ⁇ j in d i is greater than zero.
- the process flow is directed back to 704 . If, as a result of 710 , it is determined that the incremented term counter variable j does not exceed the total number of terms in the global vocabulary V, then the process flow is directed back to 704 . If, as a result of 710 , it is determined that the incremented term counter variable j exceeds the total number of terms in the global vocabulary V, then the process flow continues to 712 where the record counter variable i is incremented by one. At 714 , it is determined whether the incremented record counter variable i exceeds the total number of records in the dataset D. If, as a result of 714 , it is determined that the incremented record counter variable i does not exceed the total number of records in the dataset D, then the process flow is directed back to 704 . Otherwise, the process flow continues to 208 and a taxonomy is generated.
- the taxonomy, ⁇ , generated at 208 is a taxonomy of the augmented dataset D resulting from 206 .
- a given layer ⁇ t within the taxonomy ⁇ contains a set of k(t) clusters nested within a hierarchically higher layer ⁇ t+1 , containing a set of k(t+1) clusters (k(t+1) ⁇ k(t)), such that ⁇ t ⁇ t+1 .
- each cluster in ⁇ t is a subset of a cluster in ⁇ t+1 and at least one cluster in ⁇ t is a proper subset of a cluster in ⁇ t+1 .
- the taxonomy ⁇ comprises h nested layers ⁇ 1 ⁇ 2 ⁇ . . . ⁇ h .
- the uppermost layer ⁇ h of the taxonomy contains one cluster containing all of the m records and, therefore, corresponds to the size of the dataset D.
- the bottommost layer of the taxonomy, ⁇ 1 contains m singleton leaf clusters, each corresponding to one of the m records within the dataset D.
- a taxonomy can be generated, for example, by initializing a hierarchy index of the taxonomy ( 802 ), creating an internal representation of leaf clusters ( 804 ), and building a hierarchy of cluster sets from the leaf clusters ( 606 ).
- the hierarchy index identifies layers within the taxonomy and, as shown above, is represented by the hierarchy index variable, t.
- the hierarchy index can be initialized by setting the hierarchy index variable, t, equal to 1 ( 902 ) and setting each record within the dataset as a leaf cluster ( 904 ).
- each record d i ⁇ D is represented as a vector.
- the bottommost layer of the taxonomy, ⁇ 1 contains a set of m clusters C 1 1 , C 1 2 , . . .
- an internal representation of the leaf clusters is created at 704 .
- a generic cluster C t i ⁇ t can be internally represented by its conditional probability distribution P(A
- C t i ), where P(A v j
- a generic record d i ⁇ D can be internally represented by its conditional probability P(A
- d i ), where P(A v j
- the internal representation scheme described above is herein referred to as globally normalized (i.e. g-norm) representation because the term-frequency vectors of all records and clusters are normalized across the global attribute space A to generate the probability mass function representation.
- each generic record d i ⁇ D or cluster C t i ⁇ t can be internally represented as a set of d probability mass functions, one for each attribute.
- the internal representation of every record d i ⁇ D is the disjunction of d locally normalized conditional probability distributions, ⁇ P(A 1
- the internal representation of every cluster C t i ⁇ t is the disjunction of d locally normalized conditional probability distributions, ⁇ P(A 1
- the internal representation scheme described above is herein referred to as locally normalized (i.e., l-norm) representation.
- l-norm representation Compared to g-norm, l-norm representation provides d degrees of freedom, as there are d entropy/information components corresponding to d probability distributions.
- the entropy/information components can be linearly combined in any manner, and therefore any type of clustering can be obtained varying the weight distribution across attributes.
- g-norm representation propagates the effect of sparsity within one attribute to all other attributes whereas l-norm representation confines attribute-local sparsities to the same local attribute space.
- each leaf cluster C 1 1 , C 1 2 , . . . , C 1 m can be created by determining the conditional probability distribution P(A
- the hierarchy can be built at 806 .
- the hierarchy is generated according to a hierarchical agglomerative clustering process.
- the hierarchical agglomerative clustering process is a clustering process that partitions the dataset D into k mutually exclusive clusters (where k ⁇ m), C 1 , C 2 , . . . , C k , such that the following conditions are satisfied:
- C i is a non-null subset
- the hierarchy can be built, for example, by successively merging cluster pairs together according to a predetermined entropic similarity condition.
- such a hierarchy can be built, for example, by setting a cluster number variable, k, and the aforementioned taxonomy layer variable, t, ( 1102 ), creating a distance matrix M t ⁇ 1 ( 1104 ), identifying a pair of clusters listed in the distance matrix M t ⁇ 1 according to a predetermined entropic similarity condition ( 1106 ), merging the identified cluster pair ( 1108 ), setting the marginal probability of the merged cluster pair ( 1110 ), creating a new taxonomy layer containing the merged cluster pair in addition to all non-merged clusters ( 1112 ), and determining whether the new taxonomy layer contains a single cluster ( 1114 ).
- the value of the cluster number variable, k is inherited from 802 and the value of the taxonomy layer variable, t, is inherited from 1002 and incremented by one.
- Subsequent values of the cluster number variable, k, and the taxonomy layer variable, t are based on the number of clusters contained within each new taxonomy layer after cluster pairs have been merged and non-merged clusters have been isomorphically mapped from preceding taxonomy layers.
- each entry within the distance matrix M t ⁇ 1 identifies a degree of similarity between a cluster identified in the i th row and a cluster identified in the j th column of the distance matrix M t ⁇ 1 .
- the degree of similarity can be represented by an entropic distance metric, ⁇ that characterizes a measure of the divergence (or proximity) between every possible pair-wise combination of clusters present within the taxonomy layer ⁇ t ⁇ 1 .
- values for the entropic distance metric, ⁇ can be obtained using principles related to information-theoretic data compression.
- Y if the value-set of a random variable X is compressed into a smaller-sized value-set of another random variable Y, and if both X and Y contain information about a third random variable Z, then.
- the information content of Y is always upper-bounded by (i.e., less than or equal to) the information content of X, which means there is always some finite amount of information loss when X is compressed to Y.
- the information content of ⁇ t is I(A, ⁇ t ).
- the amount of information loss incurred when ⁇ t is generated from ⁇ t ⁇ 1 is equal to the increase in the conditional uncertainty when ⁇ t is generated from ⁇ t ⁇ 1 . Accordingly, the equivalence between differential mutual information ⁇ I( ⁇ t ⁇ 1 , ⁇ t ) and ⁇ is as follows: ⁇ I( ⁇ t ⁇ 1 , ⁇ t ) ⁇ (P(A
- the differential mutual information ⁇ I( ⁇ t ⁇ 1 , ⁇ t ) can be determined based on the well known Jensen-Shannon (JS) divergence measure, quantifying the difference between two or more probability distributions, which are transformed representations of categorical data vectors.
- the JS measure is built upon the Kullback-Leibler (KL) divergence measure and, therefore, inherits all the properties of KL divergence.
- KL Kullback-Leibler
- the JS measure does not suffer from the singularity problem.
- the JS divergence can be generalized to more than two distributions and argument distributions can be weighted.
- the differential mutual information between C t ⁇ 1 i and C t ⁇ 1 j can be represented as a linear function of their JS-divergence: ⁇ ( P ( A
- C t ⁇ 1 j )) ( ⁇ i + ⁇ j )JS( P ( A
- the entry M[i, j] created at 1104 denotes ⁇ (P(A
- the entropic proximity or divergence measure between two records or clusters is a weighted summation of the entropic similarity or dissimilarity measure between respective intra-attribute probability functions. Assuming that the weight distribution over the attributes A 1 , A 2 , . . . , A d is ⁇ 1 , ⁇ 2 , . . . , ⁇ d ⁇ , each individual weight can be used to regulate the contribution of an entropic proximity or divergence measure specific to a particular attribute. In one embodiment, the entropic divergence measure is obtained as follows:
- ⁇ is a gradient-controlling parameter of the entropic measure ⁇ .
- less weight may be given to the divergence between two probability components if the corresponding attribute is of a higher weight while more weight may be given the proximity between two probability components if the corresponding attribute is of a higher weight.
- the predetermined entropic similarity condition represents a minimal amount of information loss incurred as a result of generating a new taxonomy layer ⁇ t from a previous taxonomy layer ⁇ t ⁇ 1 .
- a high-quality data compression is achieved when the amount of information loss is minimized.
- pairs of clusters listed in the distance matrix M t ⁇ 1 are identified at 1106 by identifying cluster pairs listed within the distance matrix M t ⁇ 1 which, when merged, will minimize the amount of information loss ⁇ I( ⁇ t ⁇ 1 , ⁇ t ) incurred when ⁇ t is generated from ⁇ t ⁇ 1 .
- pairs of clusters listed in the distance matrix M t ⁇ 1 are identified at 1106 by identifying cluster pairs listed within the distance matrix M t ⁇ 1 which, when merged, will maximize the reduction of uncertainty as numerous, smaller-sized clusters are grouped into fewer, larger-sized clusters.
- clusters C t ⁇ 1 i and C t ⁇ 1 j that are identified according to the predetermined entropic similarity condition described above have a maximum amount of overlap in the information that they contain about A.
- Clusters C t ⁇ 1 i and C t ⁇ 1 j within such cluster pairs can be marked as C t ⁇ 1 r and C t ⁇ 1 s , respectively.
- ⁇ represents a measure of proximity (i.e., closeness) between clusters C t ⁇ 1 i and C t ⁇ 1 j clusters C t ⁇ 1 r and C t ⁇ 1 s are identified for which ⁇ (P(A
- ⁇ represents a measure of divergence (i.e., farness) between clusters C t ⁇ 1 i and C t ⁇ 1 j
- clusters C t ⁇ 1 r and C t ⁇ 1 s are identified for which ⁇ (P(A
- cluster pairs can be merged together at 1108 by performing a union operation of all identified clusters C t ⁇ 1 r and C t ⁇ 1 s to form C t ⁇ 1 u (i.e., C t ⁇ 1 u ⁇ C t ⁇ 1 r ⁇ C t ⁇ 1 s ).
- each merged cluster C t ⁇ 1 u represents the union of a plurality of clusters.
- each leaf cluster C 1 i is identified by an underlying vector.
- C t ⁇ 1 u can be identified by an underlying vector identifying the centroid of the plurality of clusters it contains. For the sake of ease of exposition, no formal distinction will be drawn between a merged cluster and the underlying vector identifying the merged cluster.
- the new taxonomy layer can be created at 1112 by isomorphically mapping the non-merged clusters onto the new taxonomy layer.
- an exemplary identification and merging process can be accomplished by, for example, determining for all entries within the distance matrix M t ⁇ 1 ,
- the entropic distance metric, ⁇ represents a measure of proximity
- the entropic distance metric, ⁇ can be determined at 1202 by determining, for all entries within the distance matrix M t ⁇ 1 ,
- the process flow is directed back to 1208 . If, as a result of 1216 , it is determined that the incremented distance matrix column counter variable, j, is less than or equal to the total number of clusters, k, the process flow is directed back to 1208 . If, as a result of 1216 , it is determined that the incremented distance matrix column counter variable, j, is greater than the total number of clusters, k, the process flow continues to 1218 where the distance matrix row counter variable, i, is incremented by 1 and, subsequently at 1220 , it is determined whether the incremented distance matrix column row variable, i, exceeds the total number of clusters, k, within the taxonomy layer ⁇ t ⁇ 1 .
- taxonomy ⁇ can be generated at 208 by any suitable method.
- the taxonomy ⁇ can be generated according to a process exemplarily described in copending application Ser. No. 11/457,064 entitled “METHOD AND SYSTEM FOR SUBSPACE BOUNDED RECURSIVE CLUSTERING OF CATEGORICAL DATA,” application Ser. No. 11/475,090 entitled “METHOD AND SYSTEM FOR ORDER INVARIANT CLUSTERING OF CATEGORICAL DATA,” and/or application Ser. No.
- the taxonomy generated can be a hierarchical taxonomy. It will be appreciated, however, that the taxonomy generated at 208 need not be based on a hierarchy of cluster sets as described above with respect to FIG. 8 but can, instead be based on some non-hierarchical arrangement of clusters (e.g., as generated according to a process exemplarily described in copending application Ser. No. 11/457,107 entitled “FOLDER-BASED ITERATIVE CLASSIFICATION,” incorporated by reference as if fully set forth herein). Accordingly, the taxonomy generated can be a non-hierarchical taxonomy.
- each category label is descriptive of the contents of the cluster it is assigned to and can be assigned manually and/or automatically by the system by any known means.
- the category label for each cluster corresponds to the centroid of that cluster.
- the taxonomy that has been generated from the categorical dataset can be used in various ways.
- the taxonomy can be used as an indexed organization of the categorical dataset or a layer within the taxonomy can be selected to characterize and classify the categorical dataset.
- An exemplary process of classifying records within the categorical dataset can include treating the selected taxonomy layer as a nearest neighbor classifier.
- numerous embodiments of the present invention are provided to reduce the inherent sparsity of categorical datasets while increasing the overall quality of the categorical dataset to aid hierarchical agglomerative clustering processes in creating high-quality, clustering solutions that are in alignment with a user's similarity biased intuition.
- the similarity factor between records in a dataset can be increased by reducing sparsity within the dataset.
- dissimilarity between records is not ignored. Rather, the quality of the dissimilarity between records is identified and used to increase the similarity therebetween.
- the received categorical dataset is augmented with probabilistically imputed term values.
Landscapes
- Engineering & Computer Science (AREA)
- Theoretical Computer Science (AREA)
- Data Mining & Analysis (AREA)
- Physics & Mathematics (AREA)
- General Engineering & Computer Science (AREA)
- General Physics & Mathematics (AREA)
- Databases & Information Systems (AREA)
- Artificial Intelligence (AREA)
- Evolutionary Computation (AREA)
- Software Systems (AREA)
- Mathematical Physics (AREA)
- Computing Systems (AREA)
- Computer Vision & Pattern Recognition (AREA)
- Computational Linguistics (AREA)
- Evolutionary Biology (AREA)
- Bioinformatics & Computational Biology (AREA)
- Bioinformatics & Cheminformatics (AREA)
- Probability & Statistics with Applications (AREA)
- Algebra (AREA)
- Computational Mathematics (AREA)
- Mathematical Analysis (AREA)
- Mathematical Optimization (AREA)
- Pure & Applied Mathematics (AREA)
- Life Sciences & Earth Sciences (AREA)
- Information Retrieval, Db Structures And Fs Structures Therefor (AREA)
Abstract
Description
The dataset D can be represented as an m×n matrix. Accordingly, each row of the m×n matrix corresponds to a vector-space representation of a particular record.
I(A,Γ t−1)=H(A)−H(A|Γ t−1),
where H(A) is the absolute entropy and H(A|Γt−1) is the Γt−1-conditional entropy of A. Similarly, the information content of Γt, about the global vocabulary A, is I(A,Γt).
δI(Γt−1,Γt)=I(A,Γ t−1)−I(A,Γ t)=H(A|Γ t)−H(A|Γ t−1).
δI(Γt−1,Γt)≡μ(P(A|Ct−1 i),P(A|Ct−1 j))
and the JS-divergence between Ct−1 i and Ct−1 j, is:
μ(P(A|C t−1 i),P(A|C t−1 j))=(πi+πj)JS(P(A|C t−1 i)∥P(A|C t−1 j)).
when the entropic distance metric, μ, represents a measure of divergence (1202), setting a distance matrix row counter variable, i, equal to 1 (1204), setting a distance matrix column counter variable, j, equal to 1 (1206), and determining whether the
In embodiments where the entropic distance metric, μ, represents a measure of proximity, the entropic distance metric, μ, can be determined at 1202 by determining, for all entries within the distance matrix Mt−1,
then the process flow proceeds to 1210 where Ct−1 i and Ct−1 j are marked Ct−1 r and Ct−1 s, respectively, and are subsequently merged into a single cluster Ct−1 u at 1212. The process flow then continues to 1110 as discussed above.
then the process flow proceeds directly to 1214 where the distance matrix column counter variable, j, is incremented by 1 and, subsequently at 1216, it is determined whether the incremented distance matrix column counter variable, j, exceeds the total number of clusters, k, within the taxonomy layer Γt−1.
Claims (18)
Priority Applications (1)
| Application Number | Priority Date | Filing Date | Title |
|---|---|---|---|
| US11/457,103 US7761394B2 (en) | 2006-05-16 | 2006-07-12 | Augmented dataset representation using a taxonomy which accounts for similarity and dissimilarity between each record in the dataset and a user's similarity-biased intuition |
Applications Claiming Priority (2)
| Application Number | Priority Date | Filing Date | Title |
|---|---|---|---|
| US11/436,142 US7774288B2 (en) | 2006-05-16 | 2006-05-16 | Clustering and classification of multimedia data |
| US11/457,103 US7761394B2 (en) | 2006-05-16 | 2006-07-12 | Augmented dataset representation using a taxonomy which accounts for similarity and dissimilarity between each record in the dataset and a user's similarity-biased intuition |
Related Parent Applications (1)
| Application Number | Title | Priority Date | Filing Date |
|---|---|---|---|
| US11/436,142 Continuation-In-Part US7774288B2 (en) | 2006-05-16 | 2006-05-16 | Clustering and classification of multimedia data |
Publications (2)
| Publication Number | Publication Date |
|---|---|
| US20070271266A1 US20070271266A1 (en) | 2007-11-22 |
| US7761394B2 true US7761394B2 (en) | 2010-07-20 |
Family
ID=46325735
Family Applications (1)
| Application Number | Title | Priority Date | Filing Date |
|---|---|---|---|
| US11/457,103 Expired - Fee Related US7761394B2 (en) | 2006-05-16 | 2006-07-12 | Augmented dataset representation using a taxonomy which accounts for similarity and dissimilarity between each record in the dataset and a user's similarity-biased intuition |
Country Status (1)
| Country | Link |
|---|---|
| US (1) | US7761394B2 (en) |
Cited By (9)
| Publication number | Priority date | Publication date | Assignee | Title |
|---|---|---|---|---|
| US10489690B2 (en) | 2017-10-24 | 2019-11-26 | International Business Machines Corporation | Emotion classification based on expression variations associated with same or similar emotions |
| US10515341B2 (en) * | 2017-01-18 | 2019-12-24 | State Farm Mutual Automobile Insurance Company | Computer communication network for routing communications based on identified information clusters |
| US10579940B2 (en) | 2016-08-18 | 2020-03-03 | International Business Machines Corporation | Joint embedding of corpus pairs for domain mapping |
| US10642919B2 (en) | 2016-08-18 | 2020-05-05 | International Business Machines Corporation | Joint embedding of corpus pairs for domain mapping |
| US10657189B2 (en) | 2016-08-18 | 2020-05-19 | International Business Machines Corporation | Joint embedding of corpus pairs for domain mapping |
| US10664656B2 (en) | 2018-06-20 | 2020-05-26 | Vade Secure Inc. | Methods, devices and systems for data augmentation to improve fraud detection |
| US20210042275A1 (en) * | 2019-08-05 | 2021-02-11 | International Business Machines Corporation | Data blocking in a database system |
| US11663275B2 (en) | 2019-08-05 | 2023-05-30 | International Business Machines Corporation | Method for dynamic data blocking in a database system |
| US20250148303A1 (en) * | 2019-01-03 | 2025-05-08 | Lucomm Technologies, Inc. | Smart Device System |
Families Citing this family (15)
| Publication number | Priority date | Publication date | Assignee | Title |
|---|---|---|---|---|
| KR20100090312A (en) | 2006-02-10 | 2010-08-13 | 스트랜즈, 아이엔씨. | Systems and methods for prioritizing mobile media player files |
| US8478747B2 (en) * | 2008-06-05 | 2013-07-02 | Samsung Electronics Co., Ltd. | Situation-dependent recommendation based on clustering |
| US8166052B2 (en) * | 2007-10-22 | 2012-04-24 | Samsung Electronics Co., Ltd. | Situation recognition for recommendation using merge-split approach |
| US8171035B2 (en) * | 2007-10-22 | 2012-05-01 | Samsung Electronics Co., Ltd. | Situation-aware recommendation using correlation |
| US8019782B2 (en) * | 2007-10-22 | 2011-09-13 | Samsung Electronics Co., Ltd. | Situation-aware recommendation using limited cluster sizes |
| JP5379372B2 (en) * | 2007-11-15 | 2013-12-25 | キヤノン株式会社 | Data compression apparatus, data decompression apparatus, and data compression method |
| US7979426B2 (en) * | 2008-06-05 | 2011-07-12 | Samsung Electronics Co., Ltd. | Clustering-based interest computation |
| JP5906071B2 (en) * | 2011-12-01 | 2016-04-20 | キヤノン株式会社 | Information processing method, information processing apparatus, and storage medium |
| US10601749B1 (en) | 2014-07-11 | 2020-03-24 | Twitter, Inc. | Trends in a messaging platform |
| US10592539B1 (en) | 2014-07-11 | 2020-03-17 | Twitter, Inc. | Trends in a messaging platform |
| US9922315B2 (en) | 2015-01-08 | 2018-03-20 | Outseeker Corp. | Systems and methods for calculating actual dollar costs for entities |
| US10482074B2 (en) * | 2016-03-23 | 2019-11-19 | Wipro Limited | System and method for classifying data with respect to a small dataset |
| US20230401238A1 (en) * | 2022-06-14 | 2023-12-14 | Ebay Inc. | Item retrieval using query core intent detection |
| CN115130578B (en) * | 2022-06-29 | 2025-07-25 | 南京邮电大学 | Distribution transformer state online evaluation method based on incremental rough clustering |
| US12045271B1 (en) * | 2023-09-27 | 2024-07-23 | Societe Des Produits Nestle S.A. | Methods and systems for facilitating the creation of food and/or beverage product concepts |
Citations (12)
| Publication number | Priority date | Publication date | Assignee | Title |
|---|---|---|---|---|
| US20020042793A1 (en) * | 2000-08-23 | 2002-04-11 | Jun-Hyeog Choi | Method of order-ranking document clusters using entropy data and bayesian self-organizing feature maps |
| US6446061B1 (en) | 1998-07-31 | 2002-09-03 | International Business Machines Corporation | Taxonomy generation for document collections |
| US6460036B1 (en) | 1994-11-29 | 2002-10-01 | Pinpoint Incorporated | System and method for providing customized electronic newspapers and target advertisements |
| US20030126561A1 (en) | 2001-12-28 | 2003-07-03 | Johannes Woehler | Taxonomy generation |
| US20030177000A1 (en) | 2002-03-12 | 2003-09-18 | Verity, Inc. | Method and system for naming a cluster of words and phrases |
| US20030217052A1 (en) * | 2000-08-24 | 2003-11-20 | Celebros Ltd. | Search engine method and apparatus |
| US20040111438A1 (en) | 2002-12-04 | 2004-06-10 | Chitrapura Krishna Prasad | Method and apparatus for populating a predefined concept hierarchy or other hierarchical set of classified data items by minimizing system entrophy |
| US20050044487A1 (en) | 2003-08-21 | 2005-02-24 | Apple Computer, Inc. | Method and apparatus for automatic file clustering into a data-driven, user-specific taxonomy |
| US6886007B2 (en) | 2000-08-25 | 2005-04-26 | International Business Machines Corporation | Taxonomy generation support for workflow management systems |
| US20060004747A1 (en) | 2004-06-30 | 2006-01-05 | Microsoft Corporation | Automated taxonomy generation |
| US20060031217A1 (en) | 2004-08-03 | 2006-02-09 | International Business Machines Corporation | Method and apparatus for ontology-based classification of media content |
| US20060095521A1 (en) * | 2004-11-04 | 2006-05-04 | Seth Patinkin | Method, apparatus, and system for clustering and classification |
-
2006
- 2006-07-12 US US11/457,103 patent/US7761394B2/en not_active Expired - Fee Related
Patent Citations (12)
| Publication number | Priority date | Publication date | Assignee | Title |
|---|---|---|---|---|
| US6460036B1 (en) | 1994-11-29 | 2002-10-01 | Pinpoint Incorporated | System and method for providing customized electronic newspapers and target advertisements |
| US6446061B1 (en) | 1998-07-31 | 2002-09-03 | International Business Machines Corporation | Taxonomy generation for document collections |
| US20020042793A1 (en) * | 2000-08-23 | 2002-04-11 | Jun-Hyeog Choi | Method of order-ranking document clusters using entropy data and bayesian self-organizing feature maps |
| US20030217052A1 (en) * | 2000-08-24 | 2003-11-20 | Celebros Ltd. | Search engine method and apparatus |
| US6886007B2 (en) | 2000-08-25 | 2005-04-26 | International Business Machines Corporation | Taxonomy generation support for workflow management systems |
| US20030126561A1 (en) | 2001-12-28 | 2003-07-03 | Johannes Woehler | Taxonomy generation |
| US20030177000A1 (en) | 2002-03-12 | 2003-09-18 | Verity, Inc. | Method and system for naming a cluster of words and phrases |
| US20040111438A1 (en) | 2002-12-04 | 2004-06-10 | Chitrapura Krishna Prasad | Method and apparatus for populating a predefined concept hierarchy or other hierarchical set of classified data items by minimizing system entrophy |
| US20050044487A1 (en) | 2003-08-21 | 2005-02-24 | Apple Computer, Inc. | Method and apparatus for automatic file clustering into a data-driven, user-specific taxonomy |
| US20060004747A1 (en) | 2004-06-30 | 2006-01-05 | Microsoft Corporation | Automated taxonomy generation |
| US20060031217A1 (en) | 2004-08-03 | 2006-02-09 | International Business Machines Corporation | Method and apparatus for ontology-based classification of media content |
| US20060095521A1 (en) * | 2004-11-04 | 2006-05-04 | Seth Patinkin | Method, apparatus, and system for clustering and classification |
Non-Patent Citations (28)
| Title |
|---|
| Conrad, Jack G. et al., "Effective Document Clustering for Large Heterogeneous Law Firm Collections", pp. 177-187, Jan. 2005. |
| De Queiroz, Kevin et al., "Phylogeny as a Central Principle in Taxonomy: Phylogenetic Definition of Taxon Names", pp. 1-17, Dec. 2002. |
| Dhar, Vassant et al., "Discovering Interesting Patterns for Investment Decision Making with GLOWER-A Genetic Learner Overlaid with Entropy Reduction", pp. 1-30, Jan. 2000. |
| Examiner Interview Summary from U.S. Appl. No. 11/457,064 mailed Dec. 30, 2009. |
| Examiner Interview Summary from U.S. Appl. No. 11/457,090 mailed Mar. 12, 2010. |
| Examiner Interview Summary from U.S. Appl. No. 11/457,095 mailed Aug. 13, 2009. |
| Final Office Action for U.S. Appl. No. 11/457,090 mailed Aug. 19, 2009. |
| Final Office Action from U.S. Appl. No. 11/457,064 mailed Aug. 14, 2009. |
| Lee, John W. et al., "Hierarchical Clustering Based on Ordinal Consistency", Department of Computing, Hong Kong Polytechnic University, Hung Hom, Kowloon, Hong Kong. Received Sep. 2. 2004, accepted May 16, 2005. Pattern Recognition 38 (2005) 1913-1925. |
| Lee, John W., "Order Invariant Hierarchical Clustering", Department of Computing, Hong Kong Polytechnic University, Department of Rehabilitation Sciences, Hong Kong Polytechnic University, Hung Hom, Hong Kong, China, 2002 IEEE 6 pgs. |
| Milano, et al., "Using Ontologies for XML Data Cleaning", OTM Workshops, 2005, pp. 562-572. |
| Non-Final Office Action from U.S. Appl. 11/457,064 mailed Dec. 30, 2009. |
| Non-Final Office Action from U.S. Appl. No. 11/457,090 mailed Dec. 22, 2009. |
| Notice of Allowance for U.S. Appl. 11/457,095 mailed Aug. 13, 2009. |
| Notice of Allowance from U.S. Appl. No. 11/457,107 mailed Jul. 23, 2009. |
| Notice of Allowance from U.S. Appl. No. 11/457,115 mailed Aug. 25, 2009. |
| U.S. Appl. No. 11/436,142, filed May 16, 2006, Acharya et al. |
| U.S. Appl. No. 11/457,064, filed Jul. 12, 2006, Acharya et al. |
| U.S. Appl. No. 11/457,090, filed Jul. 12, 2005, Acharya et al. |
| U.S. Appl. No. 11/457,095, filed Jul. 12, 2006, Acharya et al. |
| U.S. Appl. No. 11/457,107, filed Jul. 12, 2006, Acharya et al. |
| U.S. Appl. No. 11/457,115, filed Jul. 12, 2006, Acharya et al. |
| USPTO, Interview Summary for U.S. Appl. No. 11/457,064 mailed May 4, 2009. |
| USPTO, Non Final Office Action from U.S. Appl. No. 11/457,064 mailed Feb. 2, 2009. |
| USPTO, Non Final Office Action from U.S. Appl. No. 11/457,090 mailed Feb. 10, 2009. |
| USPTO, Non Final Office Action from U.S. Appl. No. 11/457,095 mailed Feb. 9, 2009. |
| USPTO, Non Final Office Action from U.S. Appl. No. 11/457,107 mailed Feb. 9, 2009. |
| USPTO, Non Final Office Action from U.S. Appl. No. 11/457,115 mailed Feb. 12, 2009. |
Cited By (11)
| Publication number | Priority date | Publication date | Assignee | Title |
|---|---|---|---|---|
| US10579940B2 (en) | 2016-08-18 | 2020-03-03 | International Business Machines Corporation | Joint embedding of corpus pairs for domain mapping |
| US10642919B2 (en) | 2016-08-18 | 2020-05-05 | International Business Machines Corporation | Joint embedding of corpus pairs for domain mapping |
| US10657189B2 (en) | 2016-08-18 | 2020-05-19 | International Business Machines Corporation | Joint embedding of corpus pairs for domain mapping |
| US11436487B2 (en) | 2016-08-18 | 2022-09-06 | International Business Machines Corporation | Joint embedding of corpus pairs for domain mapping |
| US10515341B2 (en) * | 2017-01-18 | 2019-12-24 | State Farm Mutual Automobile Insurance Company | Computer communication network for routing communications based on identified information clusters |
| US10489690B2 (en) | 2017-10-24 | 2019-11-26 | International Business Machines Corporation | Emotion classification based on expression variations associated with same or similar emotions |
| US10963756B2 (en) | 2017-10-24 | 2021-03-30 | International Business Machines Corporation | Emotion classification based on expression variations associated with same or similar emotions |
| US10664656B2 (en) | 2018-06-20 | 2020-05-26 | Vade Secure Inc. | Methods, devices and systems for data augmentation to improve fraud detection |
| US20250148303A1 (en) * | 2019-01-03 | 2025-05-08 | Lucomm Technologies, Inc. | Smart Device System |
| US20210042275A1 (en) * | 2019-08-05 | 2021-02-11 | International Business Machines Corporation | Data blocking in a database system |
| US11663275B2 (en) | 2019-08-05 | 2023-05-30 | International Business Machines Corporation | Method for dynamic data blocking in a database system |
Also Published As
| Publication number | Publication date |
|---|---|
| US20070271266A1 (en) | 2007-11-22 |
Similar Documents
| Publication | Publication Date | Title |
|---|---|---|
| US7664718B2 (en) | Method and system for seed based clustering of categorical data using hierarchies | |
| US7761394B2 (en) | Augmented dataset representation using a taxonomy which accounts for similarity and dissimilarity between each record in the dataset and a user's similarity-biased intuition | |
| US7937352B2 (en) | Computer program product and method for folder classification based on folder content similarity and dissimilarity | |
| US7774288B2 (en) | Clustering and classification of multimedia data | |
| US7844557B2 (en) | Method and system for order invariant clustering of categorical data | |
| US8055597B2 (en) | Method and system for subspace bounded recursive clustering of categorical data | |
| Sharghi et al. | Query-focused extractive video summarization | |
| Meng et al. | Semi-supervised heterogeneous fusion for multimedia data co-clustering | |
| Qian et al. | Unsupervised feature selection for multi-view clustering on text-image web news data | |
| US20080313179A1 (en) | Information storage and retrieval | |
| Dy | Unsupervised feature selection | |
| Tekli | An overview of cluster-based image search result organization: background, techniques, and ongoing challenges | |
| Song et al. | Supervised hashing with pseudo labels for scalable multimedia retrieval | |
| Choo et al. | Weakly supervised nonnegative matrix factorization for user-driven clustering | |
| US8412757B2 (en) | Non-negative matrix factorization as a feature selection tool for maximum margin classifiers | |
| US7640220B2 (en) | Optimal taxonomy layer selection method | |
| Aljedani et al. | Multi-label Arabic text classification: an overview | |
| Zheng et al. | A hierarchical co-clustering approach for entity exploration over Linked Data | |
| Shirahama et al. | Event retrieval in video archives using rough set theory and partially supervised learning | |
| Vahed et al. | A model for movie classification and a genre-based recommender system | |
| Carpineto et al. | A concept lattice-based kernel for SVM text classification | |
| Csurka et al. | Unsupervised visual and textual information fusion in multimedia retrieval-a graph-based point of view | |
| Rocha et al. | Efficient and flexible cluster-and-search for cbir | |
| Wang et al. | Efficient sampling of training set in large and noisy multimedia data | |
| US20090132229A1 (en) | Information processing apparatus and method, and program storage medium |
Legal Events
| Date | Code | Title | Description |
|---|---|---|---|
| AS | Assignment |
Owner name: SONY CORPORATION, JAPAN Free format text: ASSIGNMENT OF ASSIGNORS INTEREST;ASSIGNORS:ACHARYA, CHIRANJIT, MR.;PLUTOWSKI, MARK, MR.;REEL/FRAME:018591/0565;SIGNING DATES FROM 20061026 TO 20061101 Owner name: SONY ELECTRONICS INC., NEW JERSEY Free format text: ASSIGNMENT OF ASSIGNORS INTEREST;ASSIGNORS:ACHARYA, CHIRANJIT, MR.;PLUTOWSKI, MARK, MR.;REEL/FRAME:018591/0565;SIGNING DATES FROM 20061026 TO 20061101 Owner name: SONY CORPORATION, JAPAN Free format text: ASSIGNMENT OF ASSIGNORS INTEREST;ASSIGNORS:ACHARYA, CHIRANJIT, MR.;PLUTOWSKI, MARK, MR.;SIGNING DATES FROM 20061026 TO 20061101;REEL/FRAME:018591/0565 Owner name: SONY ELECTRONICS INC., NEW JERSEY Free format text: ASSIGNMENT OF ASSIGNORS INTEREST;ASSIGNORS:ACHARYA, CHIRANJIT, MR.;PLUTOWSKI, MARK, MR.;SIGNING DATES FROM 20061026 TO 20061101;REEL/FRAME:018591/0565 |
|
| STCF | Information on status: patent grant |
Free format text: PATENTED CASE |
|
| CC | Certificate of correction | ||
| FPAY | Fee payment |
Year of fee payment: 4 |
|
| MAFP | Maintenance fee payment |
Free format text: PAYMENT OF MAINTENANCE FEE, 8TH YEAR, LARGE ENTITY (ORIGINAL EVENT CODE: M1552) Year of fee payment: 8 |
|
| FEPP | Fee payment procedure |
Free format text: MAINTENANCE FEE REMINDER MAILED (ORIGINAL EVENT CODE: REM.); ENTITY STATUS OF PATENT OWNER: LARGE ENTITY |
|
| LAPS | Lapse for failure to pay maintenance fees |
Free format text: PATENT EXPIRED FOR FAILURE TO PAY MAINTENANCE FEES (ORIGINAL EVENT CODE: EXP.); ENTITY STATUS OF PATENT OWNER: LARGE ENTITY |
|
| STCH | Information on status: patent discontinuation |
Free format text: PATENT EXPIRED DUE TO NONPAYMENT OF MAINTENANCE FEES UNDER 37 CFR 1.362 |
|
| FP | Lapsed due to failure to pay maintenance fee |
Effective date: 20220720 |