US7716447B2 - System, method and program for supporting a computer sizing having N level hierarchical resources - Google Patents
System, method and program for supporting a computer sizing having N level hierarchical resources Download PDFInfo
- Publication number
- US7716447B2 US7716447B2 US11/727,171 US72717107A US7716447B2 US 7716447 B2 US7716447 B2 US 7716447B2 US 72717107 A US72717107 A US 72717107A US 7716447 B2 US7716447 B2 US 7716447B2
- Authority
- US
- United States
- Prior art keywords
- resource
- performance
- data
- cost
- level
- Prior art date
- Legal status (The legal status is an assumption and is not a legal conclusion. Google has not performed a legal analysis and makes no representation as to the accuracy of the status listed.)
- Expired - Fee Related, expires
Links
Images


Classifications
-
- G—PHYSICS
- G06—COMPUTING OR CALCULATING; COUNTING
- G06F—ELECTRIC DIGITAL DATA PROCESSING
- G06F9/00—Arrangements for program control, e.g. control units
- G06F9/06—Arrangements for program control, e.g. control units using stored programs, i.e. using an internal store of processing equipment to receive or retain programs
- G06F9/46—Multiprogramming arrangements
- G06F9/50—Allocation of resources, e.g. of the central processing unit [CPU]
- G06F9/5061—Partitioning or combining of resources
-
- G—PHYSICS
- G06—COMPUTING OR CALCULATING; COUNTING
- G06F—ELECTRIC DIGITAL DATA PROCESSING
- G06F2209/00—Indexing scheme relating to G06F9/00
- G06F2209/50—Indexing scheme relating to G06F9/50
- G06F2209/505—Clust
Definitions
- the present invention relates to a sizing of hierarchical computer resources. More particularly, the present invention relates to a sizing support system, method and program for supporting the sizing for hierarchical computer resources of 3 hierarchy levels or more.
- nodes which has one or more CPUs, memories and communication devices.
- the cluster constructed by combining (or clustering) a plurality of nodes to operate as one system becomes popular.
- the nodes are connected to and communicate with each other.
- the cluster is excellent in the cost performance and in the scalability.
- the excellent scalability results from the characteristic that the cluster is hierarchical computer resources.
- the hierarchical resources are constructed from the computer resources provided with a plurality of hierarchy levels, and a resource of higher level (the higher level resource) is constituted by the combination of the resources of lower hierarchy level (the low level resources).
- the performance of a high level resource can be enhanced by increasing the number of low level resources or improving the performance of low level resources. For example, by increasing the number of the nodes constituting a cluster or improving the performance of the node, the performance of the cluster is enhanced.
- a cluster is hierarchical resources, and the nodes constituting the cluster are also hierarchical resources. This is because the increase in the number of the CPUs constituting a node or the improvement of the performance of the CPU improves the performance of the nodes.
- hierarchical resources having a uniform configuration are called as uniform hierarchical resources.
- a cluster provided with only the nodes of the same kind is uniform hierarchical resources.
- Each of the nodes of the same kind is composed of the CPUs of the same kind and the same number.
- the actually used clusters are in many cases the uniform hierarchical resources.
- the sizing plan is experientially made on the basis of the sense and experience of skilled technicians.
- the processing performance of the hierarchical resources constituted in accordance with the sizing plan is estimated and compared with the processing performance required for the system. If the processing performance does not agree with the requirement, the sizing planning is executed again.
- JP-P 2003-223335A a virtual stand-alone outsourcing system is described.
- the computer resources are divided into a plurality of partitions, and the respective partitions are used by clients. Also, correspondingly to the performance information for each partition, the configuration of the partition is dynamically changed.
- JP-P 2004-288183A a method for automatically allocating computing resources in a partition server is described. According to the method, priorities are set for partitions. In accordance with the priority, the competition between the resources (CPUs) is solved, and the resource amount assigned to the partition is determined.
- JP-P 2004-302525A a performance balance evaluating apparatus of a computer system is described.
- a performance estimation index obtaining means individually transmits and receives a test application to and from each apparatus constituting an estimation target computer system. Then, the performance estimation index obtaining means changes the number of the test applications and obtains a transaction density and a performance estimation index of each apparatus.
- a use rate obtaining means transmits the test application to the estimation target computer system and instructs each apparatus to process such as a usual service application and obtains a use rate of each apparatus.
- a capacity calculating means divides the performance estimation index of each apparatus by each use rate and calculates the capacity of each apparatus.
- a performance balance evaluating means defines any one of the apparatuses as a standard apparatus and calculates a performance balance from a ratio between the capacity of a different apparatus and the allowable amount of the standard apparatus.
- JP-P 2000-29753A a performance evaluating method of a system having a hierarchical resource competition is described.
- a layer of a software resource is a higher order layer
- a layer of a hardware resource is a lower order layer.
- the hardware configuration of the lower order layer is inputted.
- a transaction data of a transaction using the software resource of the higher order layer is inputted.
- a process data of a process constituting the software resource is inputted.
- the restriction condition of the process is inputted.
- the setting which shows what type of a performance estimation value is displayed in what type of a format is carried out.
- a displaying means indicates those performance estimation values to a user.
- JP-P 2004-78947A having a counterpart U.S. Pat. No. 7,389,4357
- a method for satisfying the demanded capacity in a blade-based computer system is described.
- the number of loaded blades in the system is determined.
- an optimal performance configuration for each of the individual blades is determined.
- the optimal performance configuration is based at least in part on the number of the blades loaded in the chassis and the overall thermal and power envelope.
- an individual frequency for at least one of the individual blades is set creating a more efficiently run system.
- JP-P 2006-331135A a performance prediction apparatus of a cluster system is described.
- the cluster system has nodes which share the data in a main storage device.
- the performance prediction apparatus calculates the frequency of block copy between the nodes, by which the data is copied by the unit of the memory block of the storage device per unit time.
- the clustering overhead occurred in the cluster system is calculated based on the frequency of the block copy and the information of the CPU load per block copy.
- the object of the present invention is to provide a technique for supporting a quantitative sizing of hierarchical resources before a system construction or enhancement.
- the performance and cost of the hierarchical resources can be quantitatively estimated.
- FIG. 1 is a block diagram showing the configuration of a sizing support system according to an embodiment of the present invention
- FIG. 2 is a block diagram showing a conceptual flow of data in the sizing support system according to an embodiment of the present invention
- FIG. 3 is a flowchart showing a sizing supporting method according to an embodiment of the present invention.
- FIG. 4 is a conceptual view showing a hierarchy structure of a cluster which is a sizing target in the first example of an operation
- FIG. 5 is a view showing an example of lower level resource data
- FIG. 6 is a view showing an example of scalability data
- FIG. 7 is a view showing an example of unit performance data
- FIG. 8 is a view showing an example of cost data
- FIG. 9 is a flowchart showing a step S 10 in detail
- FIG. 10 is a view showing an example of a generated table frame
- FIG. 11 is a flowchart showing a step S 20 in detail
- FIG. 12 is a view showing an example of a generated scale table
- FIG. 13 is a flowchart showing a step S 30 in detail
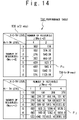
- FIG. 14 is a view showing an example of a generated performance table
- FIG. 15 is a flowchart showing a step S 40 in detail
- FIG. 16 is a view showing an example of a generated cost table
- FIG. 17 is a view showing an example of a representation of a user view data
- FIG. 18 is a conceptual view showing a hierarchy structure of a cluster which is a sizing target in the second example of operation
- FIG. 19 is a view showing an example of lower order resource data
- FIG. 20 is a view showing an example of scalability data
- FIG. 21 is a view showing an example of unit performance data
- FIG. 22 is a view showing an example of cost data
- FIG. 23 is a view showing an example of a generated scale table
- FIG. 24 is a view showing an example of a generated performance table
- FIG. 25 is a view showing an example of a generated cost table
- FIG. 26 is a flowchart showing a step S 60 in detail
- FIG. 27 is a view showing an example of representation of a user view data
- FIG. 28 is a view showing an example of a performance table generated in a third operation example.
- FIG. 29 is a view showing an example of a cost table generated in the third example of operation.
- the target system of the sizing is a uniform hierarchical resources of n hierarchy levels (n is an integer of 3 or more).
- the cluster system is exemplified as the target system of the sizing.
- a resource of the first hierarchy top hierarch level
- resources of the second hierarchy are nodes
- resources of the third hierarchy are CPUs.
- the cluster system may be a virtual cluster system.
- the target of the sizing may be a multiprocessor system, a virtual server or a blade server.
- the system of the sizing target may have the configuration of various patterns depending on the kinds of employed hardware.
- the sizing support system according to this embodiment quantitatively calculates the performances and costs of the entire system, with regard to the various patterns. Moreover, the sizing support system according to this embodiment indicates the relation between the performances and costs for the various patterns for supporting the user's estimation and selection.
- FIG. 1 is a block diagram showing the configuration of the sizing support system 1 according to this embodiment.
- the sizing support system 1 contains a storage device 2 , a processor 3 , an input device 4 , a display 5 , a network interface 6 and a media drive 7 .
- the storage device 2 stores lower level resource data 10 , scalability data 20 , unit performance data 30 and cost data 40 . Those data may be inputted by the input device 4 , or provided through the network interface 6 . Or, those data may be recorded in a computer-readable recording medium and are read by the media drive 7 .
- the storage device 2 further stores a table frame T 10 , a scale table T 20 , a performance table T 30 , a cost table T 40 and a user view data 70 . Those tables and data are mainly generated by the sizing support system 1 .
- the processor 3 includes CPU and carries out various processes and also controls the operations of each apparatus and each device. Also, the processor 3 executes a sizing support program 100 and attains the sizing support process in accordance with a command from the sizing support program 100 .
- the sizing support program 100 is recorded in, for example, the computer-readable recording medium and read by the media drive 7 . Or, the sizing support program 100 may be provided through the network interface 6 .
- the sizing support program 100 provides a table definition module 110 , a scale estimation module 120 , a performance estimation module 130 , a cost estimation module 140 , a processing level decrementing module 160 and a user view generating module 170 , in linkage with the processor 3 .
- the input device 4 the keyboard and the mouse are exemplified.
- the display 5 a liquid crystal display is exemplified. The user, while referring to the information displayed on the display 5 , can use the input device 4 and input the various data and commands.
- FIG. 2 schematically shows the flow of the data in the sizing support system 1 .
- the table definition module 110 reads the lower level resource data 10 from the storage device 2 and generates the table frame T 10 in accordance with the lower level resource data 10 .
- the table frame T 10 is a frame of a table, and the generation of a table frame T 10 corresponds to a definition of an array.
- the respective elements of the array namely, the modules for calculating the respective fields of the table are the scale estimation module 120 , the performance estimation module 130 and the cost estimation module 140 .
- the scale estimation module 120 , the performance estimation module 130 and the cost estimation module 140 are totally referred to as the field calculation module 150 .
- the scale estimation module 120 reads the table frame T 10 and scalability data 20 from the storage device 2 and generates the scale table T 20 in accordance with the read data.
- the performance estimation module 130 reads the scale table T 20 and the unit performance data 30 from the storage device 2 and generates the performance table T 30 in accordance with the read data.
- the cost estimation module 140 reads the table frame T 10 and cost data 40 from the storage device 2 and generates the cost table T 40 in accordance with the read data.
- the generated tables T 20 to T 40 may be directly outputted from the sizing support system 1 . Or, those tables T 20 to T 40 may be sent to the user view generating module 170 .
- the user view generating module 170 correlates those tables T 20 to T 40 to each other and generates the user view data 70 .
- the user view data 70 is displayed on the display 5 .
- the performance and cost of the entire system of the sizing target are correlated. The user can easily determine the proper hierarchical resource configuration by considering the relation between the performance and the cost which are displayed on the display 5 .
- the operations of the sizing support system 1 according to this embodiment will be described below in detail with reference to the flowchart shown in FIG. 3 .
- the target of the sizing is a uniform sizing supporting of n hierarchies (n is an integer of 3 or more). As described later, the process is sequentially executed in which 3 hierarchies are treated as one unit.
- the resource group of the first (top) hierarchy level includes only the cluster itself
- the resource group of the second hierarchy level includes nodes
- the resource group of the third hierarchy level includes the CPUs.
- a resource in the level one rank higher than the reference level is referred to as the higher level resource
- a resource in the level one rank lower than the reference level is referred to as the lower level resource.
- a node is a lower level resource of the cluster
- a CPU is a higher level resource of a node.
- the cluster is constituted by the nodes of the same kind. Also, each of the nodes is constituted by the CPUs of the same kind and the same number. Namely, the sizing target cluster in this embodiment consists of uniform hierarchical resources. Depending on the kinds of the employed CPUs and nodes, the clusters of the various patterns are consisted. The sizing support system 1 according to this embodiment enables to calculate the performances and costs of clusters of various patterns.
- Step S 1 Provision of Basic Information
- the basic information used in the process is inputted to the sizing support system 1 and stored in the storage device 2 .
- the basic information includes the data indicating parameters with regard to the resources of the respective hierarchy levels and includes the lower level resource data 10 , the scalability data 20 , the unit performance data 30 and the cost data 40 , which will be described below.
- FIG. 5 shows an example of the lower level resource data 10 .
- the lower level resource data 10 indicates the possible kinds (or types) and maximum number of the 1-rank lower level resources which constitute the higher level resource for respective hierarchy levels. Specifically, with regard to the resources of each hierarchy, the kinds and maximum number of the lower level resources which can be possessed by the higher level resource are recorded.
- a lower level resource data 10 - 1 for the first hierarchy indicates the kind (identified by R K+1 ) of the node that can constitute the cluster (R K ) and the maximum number (M K+1 ) of the nodes.
- R K+1 the kind of the node that can constitute the cluster
- M K+1 the maximum number of the nodes.
- the lower level resource data shown in FIG. 5 shows that a maximum of 8 2-way nodes or a maximum of 7 4-way nodes can be set in a cluster.
- a lower level resource data 10 - 2 for the second hierarchy level ((K+1)-th hierarchy) indicates the kind R K+2 of the CPU that can constitute the node R K+1 and the maximum number M K+2 of the CPUs.
- the 2-Way node can possess a maximum of 2 CPU-A (CPU of type A).
- the 4-Way node can possess a maximum of 4 CPU-B.
- the lower level resource data 10 - 3 for the third hierarchy is not recorded since the third hierarchy level ((K+2)-th hierarchy) is the lowest layer.
- FIG. 6 shows an example of the scalability data 20 .
- Scalability implies the change rate of the performance with regard to the addition of each of the resources.
- the scalability indicates the rate of change of the performance per resource in response to the number of the resources in a certain hierarchy.
- the scalability of the 2-way node is given as a one-dimensional array data s K+1 [1:8], and the scalability of the 4-way node is also given as a one-dimensional array data s K+1 [1:7].
- the scalability of CPU-A is given as a one-dimensional array data s K+2 [1:2]
- the scalability of CPU-B is given as a one-dimensional array data s K+2 [1:4].
- the kind and the maximum number is consistent with the lower level resource data 10 shown in FIG. 5 .
- a scalability data 20 - 1 for the first hierarchy (K-th hierarchy level) is not recorded because it is the sole constituent of the top level.
- FIG. 7 shows an example of the unit performance data 30 .
- This unit performance data 30 is given only to the third hierarchy level ((K+2)-th hierarchy) that is the lowest layer, and indicates unit performance (p K+2 ) with regard to the kind R K+2 of CPUs.
- the unit performance indicates the number of the requests that can be processed by the CPU in one second.
- the unit performances of CPU-A and CPU-B are both 100.
- FIG. 8 shows an example of the cost data 40 .
- This cost data 40 indicates the cost with regard to the resources of each hierarchy level. The cost includes the price of hardware, the license price of software.
- a cost data 40 - 2 for the second hierarchy level ((K+1)-th hierarchy) indicates the kinds R K+1 and costs c K+1 of the nodes.
- a cost data 40 - 3 for the third hierarchy level ((K+2)-th hierarchy) indicates the kinds R K+2 and the costs (c K+2 ) of the CPUs.
- a cost data 40 - 1 for the first hierarchy level (K-th hierarchy) indicates the kinds (R K ) and the costs (c K ) of the nodes.
- the K-th hierarchy level since the K-th hierarchy level is the highest, the cost thereof c K is set to zero.
- the cost of the first hierarchy namely, the cost of the cluster itself is one of the targets to be determined through the sizing support method.
- Step S 2 Execution of Program
- the sizing support program 100 is executed by the processor 3 . Consequently, the respective modules shown in FIG. 2 are provided, and the processes are executed.
- Step S 3 Initial Setting of Process Hierarchy
- the process is repeated with the 3 hierarchies (the (K to K+2)-th hierarchies) as one unit.
- the 3 hierarchies that are the process targets are referred to as “process hierarchy”.
- a processing level decrementing module 160 sets K to “n-2” as the initial setting of the process hierarchy level.
- Step S 10 Generation of Table Frame
- the cluster of the sizing target may have the various configuration patterns, depending on the kinds and number of the employed nodes and CPUs. Thus, before estimating the performance and cost of the cluster, it is necessary to know the pattern types that may be possessed by the cluster.
- the patterns are defined in the table frame T 10 .
- the kinds and maximum number of the nodes that may be possessed by the cluster and the kinds and maximum number of the CPUs that may be possessed by the respective nodes are indicated in the lower level resource data 10 (shown in FIG. 5 ). Thus, by referring to the lower level resource data 10 , it is possible to recognize the possible patterns of the cluster.
- the table definition module 110 generates the table frame T 10 in accordance with the lower level resource data 10 .
- the flow is shown in FIG. 9 in more detail.
- the table definition module 110 reads the lower level resource data 10 from the storage device 2 (Step S 11 ).
- the table definition module 110 generates table frames T 10 - a , T 10 - b , which are shown in FIG. 10 , for each resource kind R K+1 of the second hierarchy level (Step S 12 ).
- the table frame T 10 - a indicates the pattern when the 2-way node is employed in the cluster
- the table frame T 10 - b indicates the pattern when the 4-way node is employed in the cluster.
- the 2-way node may be constituted by a maximum of 2 CPU-A (refer to FIG. 5 ).
- the table frame T 10 indicates the configuration of the possible 44 configuration of the cluster.
- the generation of the table frame T 10 corresponds to the definition of the data array.
- the performance and the cost are calculated. That is, for each of the possible configuration of the cluster, the properties of the performance and the cost are calculated.
- the calculation is carried out by the field calculation module 150 (consisting of the scale estimation module 120 , the performance estimation module 130 and the cost estimation module 140 ) which is described below.
- Step S 20 Generation of Scale Table
- the scale estimation module 120 generates the scale table T 20 in accordance with the table frame T 10 and scalability data 20 .
- the scale table T 20 is the table indicating performance magnification with regard to each of the possible configuration of the cluster.
- the performance magnification is the parameter indicating the magnification of the performance of the configuration, as compared with the case where the number of the lower level resources is 1. This performance magnification is calculated from the scalability and number of the lower level resources.
- the scale estimation module 120 reads the table frame T 10 and the scalability data 20 from the storage device 2 (Step S 21 ).
- the scale estimation module 120 selects one table frame T 10 (Step S 22 ).
- i is the node number (1 to M K+1 ) of the second layer
- j is the CPU number (1 to M K+2 ) of the third layer.
- S K+1 [i] is the scalability of the node based on the number i and is obtained from the scalability data 20 - 2 shown in FIG. 6 .
- S K+2 [j] is the scalability of the CPU based on the number j, and is obtained from the scalability data 20 - 3 shown in FIG. 6 .
- FIG. 12 shows an example of the scale table T 20 generated in this example.
- the scale tables T 20 - a , T 20 - b correspond to the table frames T 10 - a , T 10 - b , respectively.
- Step S 30 Generation of Performance Table
- the performance estimation module 130 generates the performance table T 30 in accordance with the scale table T 20 and unit performance data 30 .
- the performance table T 30 is the table indicating performance with regard to each of the possible configuration of the cluster.
- FIG. 13 shows the flow in more detail.
- the performance estimation module 130 reads the scale table T 20 and the unit performance data 30 from the storage device 2 (Step S 31 ).
- the performance estimation module 130 selects one scale table T 20 (Step S 32 ).
- the performance estimation module 130 calculates the performance P ij for each field (each pattern) of the selected scale table T 20 (Step S 33 ).
- the performance P ij is given by the following equation.
- P ij S ij ⁇ p K+2
- i is the node number (1 to M K+1 ) of the second level
- j is the CPU number (1 to M K+2 ) of the third level.
- P K+2 is the unit performance of the CPU, and is obtained from the unit performance data 30 shown in FIG. 7 .
- FIG. 14 shows the performance table T 30 generated in this example.
- the performance tables T 30 - a , T 30 - b correspond to the scale tables T 20 - a , T 20 - b , namely, the table frames T 10 - a , T 10 - b , respectively.
- Step S 40 Generation of Cost Table
- the cost estimation module 140 generates the cost table T 40 in accordance with the table frame T 10 and cost data 40 .
- the cost table T 40 is the table indicating cost with regard to each of the possible configuration of the cluster.
- FIG. 15 shows the flow in more detail.
- the cost estimation module 140 reads the table frame T 10 and the cost data 40 from the storage device 2 (Step S 41 ).
- the cost estimation module 140 selects one table frame T 10 (Step S 42 ).
- the cost estimation module 140 calculates a cost C ij for each field (each pattern) of the selected table frame T 10 (Step S 43 ).
- the cost C ij is given by the following equation.
- C ij c K +c K+1 ⁇ i+c K+2 ⁇ i ⁇ j
- i is the node number (1 to M K+1 ) of the second level
- j is the CPU number (1 to M K+2 ) of the third level.
- c K , c K+1 and c K+2 are the costs of the nodes of the respective levels and are obtained from the cost data 40 shown in FIG. 8 .
- the cost table T 40 corresponding to the selected table frame T 10 is generated.
- FIG. 16 shows the cost table T 40 generated in this example.
- the cost tables T 40 - a , T 40 - b correspond to the table frames T 10 - a , T 10 - b , respectively.
- the generating process for the cost table T 40 is finished (Step S 45 ).
- the cost table T 40 may be directly given from outside. In such a case, the user uses the input device 4 for inputting the cost table T 40 . Or, the cost table T 40 may be provided through a network or computer readable medium.
- the given cost table T 40 has a format as shown in FIG. 16 and is stored in the storage device 2 .
- Step S 50
- Step S 60 which will be described later is executed.
- K is 2 or more, namely, when the process hierarchy does not include the highest hierarchy level.
- Steps S 70 , S 80 Output of Result
- All of the scale table T 20 , the performance table T 30 and the cost table T 40 which are generated by the above mentioned processes, indicate the important parameters quantitatively when the proper cluster configuration is selected.
- Those tables T 20 to T 40 may be displayed in their original states on the display 5 or may be recorded onto the recording medium by the media drive 7 . The user can refer to those tables T 20 to T 40 and determine the cluster configuration which enables the desirable system.
- those tables T 20 to T 40 may be indicated to the user while they are correlated to each other.
- the user view generating module 170 correlates them. As shown in FIG. 2 , the user view generating module 170 generates the user view data 70 by correlating the tables T 20 to T 40 to each other. For example, the user view data 70 indicates the relation between the performance and the cost, for each of the possible configuration of the cluster. The user view data 70 is given in a graph format or table format. The user view generating module 170 displays the user view data 70 on the display 5 .
- FIG. 17 shows an example of the user view data 70 displayed on the display 5 .
- the relation between the performance and cost of the cluster is shown in the graph format.
- the vertical axis of the graph indicates the cost of the cluster, and the horizontal axis indicates the performance of the cluster.
- the vertical axis may alternatively indicate the cost per performance (the value calculated by dividing the cost the performance).
- the points in the graph correspond to the field values of the tables T 20 to T 40 .
- the points in the graph are linked through lines so that each kind of nodes are shown in series.
- the relation of the case where the cluster is defined by the 4-way node having 2 CPU-B is represented by a group “4-way (2CPU)”. In each group, the leftmost point indicates the case where the number of the nodes is 1, and the number of the nodes increases by one each moving to the rights.
- the user can easily judge the kind of the node to be employed in order to constitute a desirable cluster, by referring to this graph. For example, if firstly a cluster having the performance of processing 500 requests per second is constructed and the enhancement to 1000 requests per second is scheduled, the user may employ any of 2-way (2CPU), 4-way (2CPU), 4-way (3CPU) and 4-way (4CPU). Also, if desiring to constitute the cheapest cluster, the user may employ the 2-way (2CPU).
- the user may employ any of the 4-way (3CPU) and the 4-way (4CPU). If desiring further to enhance the cluster cheaply, the user may select the 4-way (4CPU). Because, with regard to the 4-way (4CPU), although the initial expense is high, the future enhancement is easy in cost. On the other hand, with regard to the 2-way (1CPU), it is understood that, although the initial expense is cheap, the price becomes in a neck when this will be enhanced in future.
- the representation for indicating the relation between the performance and the cost as mentioned above is also possible in the case of the hierarchical resource of 2 levels. In that case, as compared with the representation shown in FIG. 17 , only the number of the lines is reduced.
- the user Before constituting the cluster, the user can estimate the future enhancement and determine the optimal cluster configuration from the viewpoint of the initial expense and the future extensibility. Thus, it is possible to avoid the lack of the providing capacity of the services caused from the increase of the number of requests in future.
- the hierarchical resources of the sizing target has the 4 or more hierarchy levels.
- the resource of the first hierarchy level is the cluster
- the resources of the second hierarchy level is the nodes
- the resources of the third hierarchy level is the CPUs
- the resources of the fourth hierarchy level is cores.
- the cluster is constituted by the nodes of the same kind, and the respective nodes are constituted by the CPUs of the same kind and the same number, and the respective CPUs are constituted by the cores of the same kind and the same number.
- the sizing target cluster in this example is the uniform hierarchical resources. Depending on the kinds of the employed resources, the clusters of the various patterns may be constructed. In the explanation in this example, the explanation for the operations essentially same to the first operation is omitted.
- FIG. 19 shows an example of the lower level resource data 10 .
- the lower level resource data 10 includes the lower level resource data 10 - 1 to 10 - 4 for the respective hierarchy levels.
- the lower level resource data 10 - 4 for the fourth hierarchy level which is the lowest level is not recorded.
- FIG. 20 shows an example of the scalability data 20 .
- the scalability data 20 includes the scalability data 20 - 1 to 20 - 4 for the respective hierarchy levels.
- the scalability data 20 - 1 for the first hierarchy level that is the highest level is not recorded.
- FIG. 21 shows an example of the unit performance data 30 . This unit performance data 30 is given only to the fourth hierarchy level which is the lowest level.
- FIG. 22 shows an example of the cost data 40 .
- the cost data 40 includes the cost data 40 - 1 to 40 - 4 for the respective levels.
- the cost c 1 of the first hierarchy level that is the highest level is set to “0”.
- the process hierarchy levels in the first process are the second hierarchy level (K-th hierarchy), the third hierarchy level ((K+1)-th hierarchy) and the fourth hierarchy level ((K+2)-th hierarchy).
- the processes similar to the first operation example are executed (Steps S 10 , S 20 , S 30 and S 40 ).
- the scale table T 20 , the performance table T 30 and the cost table T 40 are generated.
- FIG. 23 shows the scale table T 20 generated by the first process.
- a scale table T 20 - a corresponds to the case where the resources of the third hierarchy level are CPU-As. Its column indicates the number of CPU-As in the third hierarchy level, and the row indicates the number of core-As in the fourth hierarchy level.
- a scale table T 20 - b corresponds to the case where the resources of the third hierarchy level are CPU-Bs. The column indicates the number of CPU-Bs in the third hierarchy level, and the row indicates the number of core-B in the fourth hierarchy.
- Each table indicates the performance magnification calculated for each of the various patterns.
- FIG. 24 shows the performance table T 30 generated by the first process.
- Performance tables T 30 - a , T 30 - b correspond to the cases where the resources of the respective third hierarchy level are CPU-A and CPU-B, respectively.
- Each of the tables indicates the performances calculated for each of the various patterns.
- FIG. 25 shows the cost table T 40 generated by the first process. Cost tables T 40 - a , T 40 - b correspond to the cases where the resources of the third hierarchy level are CPU-A and CPU-B, respectively.
- Each of the tables shows the costs calculated for each of the various patterns.
- Step S 50 is executed.
- k is not 1. That is, the processing hierarchy does not include the highest level (Step S 50 ; No). In that case, the processing level decrementing module 160 changes the process hierarchy level (Step S 60 ).
- FIG. 18 shows the flow at the step S 60 in detail.
- the process hierarchy proceeds to the first to third hierarchies.
- the third hierarchy level is the lowest in the processing hierarchy, and the unit performance data 30 with regard to the third hierarchy level is required.
- the unit performance of the CPU in the third hierarchy level is extracted from the performance table T 30 shown in FIG. 24 .
- the values of fields P 11 to P 1MK+2 are referred.
- Those field values indicate the performances in the case where the number of the CPUs in the third hierarchy level is 1, namely, the unit performance of the third hierarchy level.
- the field values P 11 to P 1MK+2 of 3 kinds may be set as the unit performance data 30 for the third hierarchy level.
- the unit performance data 30 indicates the respective unit performances of the 3 kinds of (CPU-A, 1core-A), (CPU-B, 1core-B) and (CPU-B, 2core-B) (Step S 61 ).
- the cost of the CPU in the third hierarchy level is extracted from the cost table T 40 shown in FIG. 25 .
- the values of fields C 11 to C 1MK+2 are referred. Those field values indicate the costs in the case where the number of the CPUs in the third hierarchy level is 1.
- the field values C 11 to C 1MK+2 of 3 kinds may be set as the cost data 40 - 3 for the third hierarchy level.
- the cost data 40 - 3 indicates the respective costs of the 3 kinds of (CPU-A, 1core-A), (CPU-B, 1core-B) and (CPU-B, 2core-B) (Step S 62 ).
- the processing level decrementing module 160 refers to the performance table T 30 and the cost table T 40 , which are generated by the certain unit process, and consequently extracts the unit performance data 30 and the cost data 40 - 3 which are used by the next unit process.
- the processing level decrementing module 160 refers to the performance table T 30 generated by the certain unit process and consequently extracts the unit performance data 30 that is used by the next unit process. In this way, the data generated by the certain unit process is fed back to the next unit process.
- the processing level decrementing module 160 carries out the decrement of K (Step S 63 ). As a result, K becomes 1, and the process hierarchy level is shifted to the first to third hierarchy levels.
- the second process is performed on the first hierarchy level (K-th hierarchy), the second hierarchy level ((K+1)-th hierarchy) and the third hierarchy level ((K+2)-th hierarchy) which are the new process hierarchy level.
- the extracted data are used.
- the second process is also executed similarly to the foregoing operation examples (Steps S 10 , S 20 , S 30 and S 40 ).
- the scale table T 20 , the performance table T 30 and the cost table T 40 with regard to the first hierarchy level are generated. Since K is 1 (Step S 50 ; Yes), the repetition of the process is finished.
- the user view data 70 is generated (Step S 70 ), and its result is outputted to the display 5 (Step S 80 ).
- FIG. 27 shows an example of the displayed screen image in this example.
- the relation of the performances and costs of the cluster are indicated in a graph format.
- the groups of 10 kinds of [1. node-A, 1CPU-A, 1core-A], [2. node-A, 2CPU-A, 1core-A], [3. node-B, 1CPU-B, 1core-B], [4. node-B, 2CPU-B, 1core-B], [5. node-B, 1CPU-B, 2core-B], [6. node-B, 3CPU-B, 1core-B], [7. node-B, 4CPU-B, 1core-B], [8. node-B, 2CPU-B, 2core-B], [9. node-B, 3CPU-B, 2core-B] and [10. node-B, 4CPU-B, 2core-B] are indicated.
- the similar process is performed.
- the data obtained by a certain process is fed back as the data with regard to the lowest hierarchy level (the (K+2)-th hierarchy) in a next process.
- the repetition of the processes enables the estimation of the entire performance and cost of the n hierarchy levels.
- the calculations of the performance and the cost are not required to be performed on all of the patterns that may be employed to constitute the cluster.
- the performance and the cost may be calculated only for a part of the configuration patterns of the cluster. For example, in the case where the excellent performance is required, the system where the number of the resources is small is considered to be unable to attain the required performance. Thus, in order to reduce the calculation, the calculation of the pattern where the number of the resources is small can be skipped for deriving enough information.
- FIG. 28 shows an example of the performance table T 30 generated in this operation example, and this corresponds to FIG. 14 illustrated in the first operation example. In FIG. 28 , the performance where the number of the CPUs in the third hierarchy level is 1 is not calculated. The user obtains only the pattern where the performance is relatively high.
- FIG. 29 shows an example of the cost table T 40 generated in this operation example and corresponds to FIG. 16 illustrated in the first operation example.
- the pattern where the cost exceeds 8,000,000 yens is not shown.
- the calculation can be reduced.
- the plot with regard to the pattern far away from the required system is not indicated. Thus, the user can easily view the result and determine the optimal configuration.
- the relation between the performance and cost of the hierarchical resources can be provided to the user simply and easily.
- the user can easily determine the configuration of the proper hierarchical resources by considering the provided information.
- the user can determine the optimal configuration from the viewpoint of the initial cost and the future extensibility before constructing the cluster system. Hence, it is possible to avoid the lack of the provision capacity for coping with the requirements which may be increased in future. In this way, the sizing is supported.
- the cost data 40 indicating the price of each resource is used.
- the heat amount data indicating the heat amount discharged by each resource may be used instead of the cost data 40 .
- the format of the heat amount data is similar to the cost data 40 , and the processing can be carried out similarly.
- the relation between the performance and heat amount of the hierarchical resources of the cluster can be quantitatively provided to the user. The user can create the cluster which satisfies the required performance and is small in heat discharge. Other than the heat amount, the various sizing supports can be attained by introducing an index other than the performance.
Landscapes
- Engineering & Computer Science (AREA)
- Software Systems (AREA)
- Theoretical Computer Science (AREA)
- Physics & Mathematics (AREA)
- General Engineering & Computer Science (AREA)
- General Physics & Mathematics (AREA)
- Stored Programmes (AREA)
Abstract
Description
S ij =s K+1 [i]×i×s K+2 [j]×j
P ij =S ij ×p K+2
C ij =c K +c K+1 ×i+c K+2 ×i×j
Claims (23)
S ij =s K+1 [i]×i×s K+2 [j]×j.
S ij =s K+1 [i]×i×s K+2 [j]×j.
Applications Claiming Priority (2)
| Application Number | Priority Date | Filing Date | Title |
|---|---|---|---|
| JP2006-090016 | 2006-03-29 | ||
| JP2006090016A JP4716259B2 (en) | 2006-03-29 | 2006-03-29 | Sizing support system, method, and program |
Publications (2)
| Publication Number | Publication Date |
|---|---|
| US20070233996A1 US20070233996A1 (en) | 2007-10-04 |
| US7716447B2 true US7716447B2 (en) | 2010-05-11 |
Family
ID=38560831
Family Applications (1)
| Application Number | Title | Priority Date | Filing Date |
|---|---|---|---|
| US11/727,171 Expired - Fee Related US7716447B2 (en) | 2006-03-29 | 2007-03-23 | System, method and program for supporting a computer sizing having N level hierarchical resources |
Country Status (2)
| Country | Link |
|---|---|
| US (1) | US7716447B2 (en) |
| JP (1) | JP4716259B2 (en) |
Cited By (1)
| Publication number | Priority date | Publication date | Assignee | Title |
|---|---|---|---|---|
| US8583698B2 (en) | 2007-10-03 | 2013-11-12 | Nec Corporation | Hierarchical load estimation system, method and program |
Families Citing this family (1)
| Publication number | Priority date | Publication date | Assignee | Title |
|---|---|---|---|---|
| JP6842447B2 (en) * | 2018-09-12 | 2021-03-17 | 株式会社日立製作所 | Systems and methods to help optimize resource allocation |
Citations (21)
| Publication number | Priority date | Publication date | Assignee | Title |
|---|---|---|---|---|
| JPS61245273A (en) | 1985-04-24 | 1986-10-31 | Hitachi Ltd | Parts deployment and aggregation method and device |
| JPS63259740A (en) | 1987-04-17 | 1988-10-26 | Hitachi Ltd | Performance estimation device |
| JPH02219138A (en) | 1989-02-21 | 1990-08-31 | Nec Corp | Predicting device for computer performance |
| JPH03108036A (en) | 1989-09-20 | 1991-05-08 | Fujitsu Ltd | Performance estimating method for data base management system |
| JPH0438522A (en) | 1990-06-05 | 1992-02-07 | Mitsubishi Electric Corp | Software program simulator |
| JPH05151031A (en) | 1991-11-29 | 1993-06-18 | Nec Corp | Overhead information calculation system |
| JPH06139065A (en) | 1992-10-29 | 1994-05-20 | Hokuriku Nippon Denki Software Kk | Program performance estimating device |
| JPH08202541A (en) | 1995-01-24 | 1996-08-09 | N T T Data Tsushin Kk | System design method and system design support device |
| JPH11265306A (en) | 1998-03-16 | 1999-09-28 | Ntt Data Corp | Processing capacity estimation device, processing capacity estimation method, and recording medium |
| JP2000029753A (en) | 1998-07-10 | 2000-01-28 | Nec Corp | Device and method for evaluating performance of system with hierarchical resource contentions |
| JP2000207255A (en) | 1999-01-11 | 2000-07-28 | Nec Corp | Method for predicting object-oriented program performance |
| US6347366B1 (en) * | 1998-12-10 | 2002-02-12 | Genuity Inc. | System and method for automatically optimizing software performance |
| JP2002183416A (en) | 2000-12-15 | 2002-06-28 | Hitachi Ltd | System proposal method, its implementation device, and recording medium recording its processing program |
| JP2003223335A (en) | 2002-01-30 | 2003-08-08 | Nec Corp | Out-sourcing system, out-sourcing method, and program for out-sourcing |
| US20040028070A1 (en) | 2002-08-12 | 2004-02-12 | Barr Andrew H. | System and method for the frequency management of computer systems to allow capacity on demand |
| JP2004220453A (en) | 2003-01-17 | 2004-08-05 | Nec Corp | System performance predicting system and method based on performance measurement of software component |
| US20040199632A1 (en) | 2003-03-21 | 2004-10-07 | Romero Francisco J. | Assembly and method for balancing processors in a partitioned server |
| JP2004302525A (en) | 2003-03-28 | 2004-10-28 | Nri & Ncc Co Ltd | Apparatus and method for evaluating and sizing the performance balance of components of a computer system |
| JP2005190277A (en) | 2003-12-26 | 2005-07-14 | Internatl Business Mach Corp <Ibm> | Analysis system, analysis method, analysis program, and recording medium |
| US20070195700A1 (en) * | 2005-09-20 | 2007-08-23 | Fujitsu Limited | Routing control method, apparatus and system |
| US20080222090A1 (en) * | 2007-03-08 | 2008-09-11 | Shigero Sasaki | Load estimating system and computer load estimating method |
Family Cites Families (6)
| Publication number | Priority date | Publication date | Assignee | Title |
|---|---|---|---|---|
| JPH0553878A (en) * | 1991-08-29 | 1993-03-05 | Toshiba Corp | Man-machine system evaluation supporting device |
| JPH10198641A (en) * | 1996-12-28 | 1998-07-31 | Nec Corp | Method for evaluating performance of distributed processing type computer system |
| JP3806609B2 (en) * | 2001-04-27 | 2006-08-09 | 株式会社日立製作所 | Parallel database system and distributed file system |
| JP2004054680A (en) * | 2002-07-22 | 2004-02-19 | Fujitsu Ltd | Parallel efficiency calculation method |
| JP4592325B2 (en) * | 2004-04-28 | 2010-12-01 | 株式会社東芝 | IT system design support system and design support method |
| JP2007207173A (en) * | 2006-02-06 | 2007-08-16 | Fujitsu Ltd | Performance analysis program, performance analysis method, and performance analysis apparatus |
-
2006
- 2006-03-29 JP JP2006090016A patent/JP4716259B2/en not_active Expired - Fee Related
-
2007
- 2007-03-23 US US11/727,171 patent/US7716447B2/en not_active Expired - Fee Related
Patent Citations (25)
| Publication number | Priority date | Publication date | Assignee | Title |
|---|---|---|---|---|
| JPS61245273A (en) | 1985-04-24 | 1986-10-31 | Hitachi Ltd | Parts deployment and aggregation method and device |
| JPS63259740A (en) | 1987-04-17 | 1988-10-26 | Hitachi Ltd | Performance estimation device |
| JPH02219138A (en) | 1989-02-21 | 1990-08-31 | Nec Corp | Predicting device for computer performance |
| JPH03108036A (en) | 1989-09-20 | 1991-05-08 | Fujitsu Ltd | Performance estimating method for data base management system |
| JPH0438522A (en) | 1990-06-05 | 1992-02-07 | Mitsubishi Electric Corp | Software program simulator |
| JPH05151031A (en) | 1991-11-29 | 1993-06-18 | Nec Corp | Overhead information calculation system |
| JPH06139065A (en) | 1992-10-29 | 1994-05-20 | Hokuriku Nippon Denki Software Kk | Program performance estimating device |
| JPH08202541A (en) | 1995-01-24 | 1996-08-09 | N T T Data Tsushin Kk | System design method and system design support device |
| JPH11265306A (en) | 1998-03-16 | 1999-09-28 | Ntt Data Corp | Processing capacity estimation device, processing capacity estimation method, and recording medium |
| JP2000029753A (en) | 1998-07-10 | 2000-01-28 | Nec Corp | Device and method for evaluating performance of system with hierarchical resource contentions |
| US6347366B1 (en) * | 1998-12-10 | 2002-02-12 | Genuity Inc. | System and method for automatically optimizing software performance |
| JP2000207255A (en) | 1999-01-11 | 2000-07-28 | Nec Corp | Method for predicting object-oriented program performance |
| JP2002183416A (en) | 2000-12-15 | 2002-06-28 | Hitachi Ltd | System proposal method, its implementation device, and recording medium recording its processing program |
| JP2003223335A (en) | 2002-01-30 | 2003-08-08 | Nec Corp | Out-sourcing system, out-sourcing method, and program for out-sourcing |
| US20040028070A1 (en) | 2002-08-12 | 2004-02-12 | Barr Andrew H. | System and method for the frequency management of computer systems to allow capacity on demand |
| JP2004078947A (en) | 2002-08-12 | 2004-03-11 | Hewlett-Packard Development Co Lp | Method for meeting capacity in compliance with request in computer system |
| JP2004220453A (en) | 2003-01-17 | 2004-08-05 | Nec Corp | System performance predicting system and method based on performance measurement of software component |
| US7376549B2 (en) | 2003-01-17 | 2008-05-20 | Nec Corporation | System performance prediction mechanism and method based on software component performance measurements |
| US20040199632A1 (en) | 2003-03-21 | 2004-10-07 | Romero Francisco J. | Assembly and method for balancing processors in a partitioned server |
| JP2004288183A (en) | 2003-03-21 | 2004-10-14 | Hewlett-Packard Development Co Lp | Method for automatically allocating computing resource |
| JP2004302525A (en) | 2003-03-28 | 2004-10-28 | Nri & Ncc Co Ltd | Apparatus and method for evaluating and sizing the performance balance of components of a computer system |
| JP2005190277A (en) | 2003-12-26 | 2005-07-14 | Internatl Business Mach Corp <Ibm> | Analysis system, analysis method, analysis program, and recording medium |
| US20050166081A1 (en) | 2003-12-26 | 2005-07-28 | International Business Machines Corporation | Computer operation analysis |
| US20070195700A1 (en) * | 2005-09-20 | 2007-08-23 | Fujitsu Limited | Routing control method, apparatus and system |
| US20080222090A1 (en) * | 2007-03-08 | 2008-09-11 | Shigero Sasaki | Load estimating system and computer load estimating method |
Non-Patent Citations (1)
| Title |
|---|
| S. Graham et al., "gprof: a Call Graph Execution Profiler," 1992 ACM, pp. 120-126. |
Cited By (1)
| Publication number | Priority date | Publication date | Assignee | Title |
|---|---|---|---|---|
| US8583698B2 (en) | 2007-10-03 | 2013-11-12 | Nec Corporation | Hierarchical load estimation system, method and program |
Also Published As
| Publication number | Publication date |
|---|---|
| US20070233996A1 (en) | 2007-10-04 |
| JP4716259B2 (en) | 2011-07-06 |
| JP2007265079A (en) | 2007-10-11 |
Similar Documents
| Publication | Publication Date | Title |
|---|---|---|
| US9058216B2 (en) | Method for estimating job run time | |
| US8424059B2 (en) | Calculating multi-tenancy resource requirements and automated tenant dynamic placement in a multi-tenant shared environment | |
| US7107191B2 (en) | Modular architecture for optimizing a configuration of a computer system | |
| JP5065296B2 (en) | A method for modeling a free pool of resources | |
| CN112328395B (en) | Cloud resource capacity planning method and system | |
| CN113037800B (en) | Job scheduling method and job scheduling device | |
| US7672815B2 (en) | Method and apparatus for evaluating a proposed solution to a constraint problem | |
| JP5790270B2 (en) | Structural analysis system, structural analysis program, and structural analysis method | |
| US20060020628A1 (en) | Method and system for determining size of a data center | |
| JP5988173B2 (en) | Application architecture design method, application architecture design system, and program | |
| US7716447B2 (en) | System, method and program for supporting a computer sizing having N level hierarchical resources | |
| JP2015197721A (en) | Storage device adjustment device, hierarchical storage design program, and hierarchical storage design method | |
| CN105045906A (en) | Estimation method and device of click rate of delivery information | |
| CN119204582A (en) | Project resource configuration method, device, computer equipment and storage medium | |
| CN118606048A (en) | Cloud service management platform resource configuration method and system | |
| AU2024233987A1 (en) | Systems and methods for allocating categories of products to a designated space | |
| CN115470959B (en) | Supply chain inventory optimization method, apparatus, computer device and storage medium | |
| CN116795508A (en) | A tiling accelerator resource scheduling method and system | |
| CN119697133B (en) | Resource allocation method, apparatus, device, storage medium and program product | |
| Martin et al. | Adaptive Physics Refinement for Anatomic Adhesive Dynamics Simulations | |
| JP7436854B2 (en) | Information processing device, control method, program | |
| Meyerhenke | Dynamic load balancing for parallel numerical simulations based on repartitioning with disturbed diffusion | |
| JP2007128382A (en) | Performance prediction method of cluster system and device | |
| JP2002073985A (en) | Transaction support method and storage medium storing transaction support program | |
| CN120238443B (en) | Open source system resource scheduling management method and system based on service traffic prediction |
Legal Events
| Date | Code | Title | Description |
|---|---|---|---|
| AS | Assignment |
Owner name: NEC CORPORATION, JAPAN Free format text: ASSIGNMENT OF ASSIGNORS INTEREST;ASSIGNOR:SASAKI, SHIGERO;REEL/FRAME:019247/0109 Effective date: 20070430 Owner name: NEC CORPORATION,JAPAN Free format text: ASSIGNMENT OF ASSIGNORS INTEREST;ASSIGNOR:SASAKI, SHIGERO;REEL/FRAME:019247/0109 Effective date: 20070430 |
|
| FPAY | Fee payment |
Year of fee payment: 4 |
|
| FEPP | Fee payment procedure |
Free format text: MAINTENANCE FEE REMINDER MAILED (ORIGINAL EVENT CODE: REM.) |
|
| LAPS | Lapse for failure to pay maintenance fees |
Free format text: PATENT EXPIRED FOR FAILURE TO PAY MAINTENANCE FEES (ORIGINAL EVENT CODE: EXP.) |
|
| STCH | Information on status: patent discontinuation |
Free format text: PATENT EXPIRED DUE TO NONPAYMENT OF MAINTENANCE FEES UNDER 37 CFR 1.362 |