US5465608A - Saw vapor sensor apparatus and multicomponent signal processing - Google Patents
Saw vapor sensor apparatus and multicomponent signal processing Download PDFInfo
- Publication number
- US5465608A US5465608A US08/085,604 US8560493A US5465608A US 5465608 A US5465608 A US 5465608A US 8560493 A US8560493 A US 8560493A US 5465608 A US5465608 A US 5465608A
- Authority
- US
- United States
- Prior art keywords
- sensor
- response
- target compound
- concentration
- vapor
- Prior art date
- Legal status (The legal status is an assumption and is not a legal conclusion. Google has not performed a legal analysis and makes no representation as to the accuracy of the status listed.)
- Expired - Fee Related
Links
Images


Classifications
-
- G—PHYSICS
- G01—MEASURING; TESTING
- G01N—INVESTIGATING OR ANALYSING MATERIALS BY DETERMINING THEIR CHEMICAL OR PHYSICAL PROPERTIES
- G01N29/00—Investigating or analysing materials by the use of ultrasonic, sonic or infrasonic waves; Visualisation of the interior of objects by transmitting ultrasonic or sonic waves through the object
- G01N29/22—Details, e.g. general constructional or apparatus details
- G01N29/32—Arrangements for suppressing undesired influences, e.g. temperature or pressure variations, compensating for signal noise
- G01N29/326—Arrangements for suppressing undesired influences, e.g. temperature or pressure variations, compensating for signal noise compensating for temperature variations
-
- G—PHYSICS
- G01—MEASURING; TESTING
- G01N—INVESTIGATING OR ANALYSING MATERIALS BY DETERMINING THEIR CHEMICAL OR PHYSICAL PROPERTIES
- G01N29/00—Investigating or analysing materials by the use of ultrasonic, sonic or infrasonic waves; Visualisation of the interior of objects by transmitting ultrasonic or sonic waves through the object
- G01N29/02—Analysing fluids
- G01N29/022—Fluid sensors based on microsensors, e.g. quartz crystal-microbalance [QCM], surface acoustic wave [SAW] devices, tuning forks, cantilevers, flexural plate wave [FPW] devices
-
- G—PHYSICS
- G01—MEASURING; TESTING
- G01N—INVESTIGATING OR ANALYSING MATERIALS BY DETERMINING THEIR CHEMICAL OR PHYSICAL PROPERTIES
- G01N29/00—Investigating or analysing materials by the use of ultrasonic, sonic or infrasonic waves; Visualisation of the interior of objects by transmitting ultrasonic or sonic waves through the object
- G01N29/22—Details, e.g. general constructional or apparatus details
- G01N29/30—Arrangements for calibrating or comparing, e.g. with standard objects
-
- G—PHYSICS
- G01—MEASURING; TESTING
- G01N—INVESTIGATING OR ANALYSING MATERIALS BY DETERMINING THEIR CHEMICAL OR PHYSICAL PROPERTIES
- G01N2291/00—Indexing codes associated with group G01N29/00
- G01N2291/02—Indexing codes associated with the analysed material
- G01N2291/025—Change of phase or condition
- G01N2291/0256—Adsorption, desorption, surface mass change, e.g. on biosensors
-
- G—PHYSICS
- G01—MEASURING; TESTING
- G01N—INVESTIGATING OR ANALYSING MATERIALS BY DETERMINING THEIR CHEMICAL OR PHYSICAL PROPERTIES
- G01N2291/00—Indexing codes associated with group G01N29/00
- G01N2291/02—Indexing codes associated with the analysed material
- G01N2291/028—Material parameters
- G01N2291/02845—Humidity, wetness
-
- G—PHYSICS
- G01—MEASURING; TESTING
- G01N—INVESTIGATING OR ANALYSING MATERIALS BY DETERMINING THEIR CHEMICAL OR PHYSICAL PROPERTIES
- G01N2291/00—Indexing codes associated with group G01N29/00
- G01N2291/04—Wave modes and trajectories
- G01N2291/042—Wave modes
- G01N2291/0423—Surface waves, e.g. Rayleigh waves, Love waves
Definitions
- This invention relates to an apparatus and method for sensing and identifying the chemical vapor and resolving a chemical composition of a vapor mixture and is specifically directed to an apparatus and method which uses the physical parameter changes of a sensor when exposed to the vapor mixture to identify a particular compound in the chemical vapor mixture, and to determine concentration of one or more components in the mixture.
- This invention includes a method for discriminating instrument responses to chemical vapors from instrument noise and chemical interferant noise sources.
- SAW Surface Acoustic Wave
- SAW sensor--a pair of SAW oscillators SAWs.
- One, called sample SAW is coated with a selected coating material and periodically exposed to the sample air and another, called reference SAW, is not coated or, if coated, is not exposed.
- SAW signal--one cycle difference in frequency oscillation between a sample and a reference SAW i.e., the measurement of oscillation frequencies as the SAWs are first exposed to clean air, then subjected to a contaminated atmosphere, and finally re-exposed to clean air.
- Target Compounds--those chemicals whose presence or concentrations need to be determined in an air stream, and to which a selected SAW sensor is designed to be responsive.
- Contaminants--compounds other than target compounds present in the sample air stream also called interferants.
- Sensitivity--Signal-to-noise ratio at a signal produced by a unit concentration of a compound of interest is an amplitude of the steady state part of a signal produced by a unit concentration.
- Characteristic transient characteristic response of a chemical--noise free, one cycle signal (or any part of thereof) produced by a unit concentration of this chemical at a given SAW.
- Characteristic spectrum of a chemical--a vector consisting of the characteristic transients from all the sensors of a SAW array.
- a SAW measures air concentrations of a particular compound by changing its resonant frequency in the presence of additional mass on the coated SAW surface.
- the target compound sorbs into a selective coating on the surface of the SAW, equilibrating the activity (or concentration) of the compound in the coating film with the activity (or partial pressure) of the target compound in the air.
- the resulting frequency shift is proportional to the added surface mass density at a steady state equilibrium [1].
- the coating material needs to have a reversible response, namely, after a target compound is removed from the air stream, the frequency shift (between the coated and uncoated SAWs) should return to zero (only with the baseline removed) as the target compound desorbs from the SAW coating. Therefore, SAW sensor measurements are done in cycles where a SAW sensor is exposed alternately to analyzed and reference (nominally uncontaminated) air streams.
- a typical SAW sensor output signal is shown in FIG. 4.
- Each measurement cycle as shown in FIG. 6, (which is one of the measurement signals in FIGS. 4 and 5) has a loading phase (curve A) when a compound penetrates into the coating, a steady state phase (curve B) when compound concentration in the coating reaches equilibrium with t e compound concentration in the air above the coating, and an unloading phase (curve C) during which the chemical is washed out of the surface coating by a stream of reference air.
- the loading and unloading phases are present in any cycle, but a steady state phase sometimes is not reached because the exposure time of the SAW coating to a chemical is too short compared to the mass transport and diffusion rates for that chemical in the system.
- Different coatings may have different sensitivities toward different compounds.
- a SAW array comprising more than one SAW sensor with different coatings on the sample SAW of each SAW sensor can resolve a mixture of several compounds.
- the normal arrangement of a SAW array is to have almost as many SAW sensors as there are different compounds in the mixture with each sample SAW possessing a different coating with a high selectivity toward one of the compounds in the mixture.
- a SAW array may be a set of more than one SAW sensor, each with the same coating, or different coatings, or a combination of coatings on the sample SAWs, and which are held at the same temperature or at different temperatures so as to be sensitive to each of the compounds of interest.
- the steady state response of a SAW array to each of the compounds of interest is called the compound's "fingerprint" on this particular SAW array.
- the existing SAW sensors use a steady state frequency shift of one measurement cycle (curve B in FIG. 6). Then a maximum of frequency shift (FIG. 7), or an integral of a one cycle frequency shift (FIG. 8), is used. This produces one data point per SAW sensor per measurement cycle.
- the current state of the art uses N-dimensional cluster analysis to separate target compound signals from those signals due to contaminants or interferants [2].
- N-dimensional cluster analysis uses N-dimensional cluster analysis to separate target compound signals from those signals due to contaminants or interferants [2].
- several similar contaminants are grouped into one class by observing that their "fingerprints" occupy the same region in an N-dimensional space.
- the cluster analysis method is computationally expensive and does not give significant savings in the number of SAW sensors needed for multicomponent separation.
- the method discriminates compounds based on their steady state responses on the SAW array. This need for a steady state response requires a measurement time which is long, especially for small concentrations of the components of interest.
- An alternative method [3] instead of relying exclusively on the steady state (static) characteristic, tries to make use of some dynamic information.
- the method introduces one more parameter--the target compound sorption time constant ⁇ .
- This method relies on an explicit sorption model ##EQU1## where M o is the mass sorbed at a steady state, and R is a constant depending on a rate of air flow.
- each SAW sensor produces two data points that are characteristic for a given compound and its concentration: diffusion time constant ⁇ and a steady state sorption M o . Since an explicit form of an sorption transient is used, both characteristic constants ⁇ and M o can be determined before a steady state is achieved. This allows a reduction in measurement time and provides an early determination of a target compound concentration before a steady state response is reached.
- the sorption time constant gives an extra degree of freedom to determine which component is present in the air stream.
- equation (1) becomes a sum of several exponents: ##EQU2##
- M (t) the mass of analyts sorbed at time t is nonlinear with respect to unknown parameters and becomes unmanageable for large K. Since the instrument response is to first order linear with sorbed analyt mass, the complex behavior of mixtures leads to unmanageable data analysis.
- An object of this invention is to decrease the number of different SAW sensors necessary for mixture resolution, to relax the requirement for high steady state selectivity for each coating, and to significantly improve the overall sensitivity of the system.
- This invention involves the calibration of a selected sample SAW of a SAW sensor with respect to the target compound and the detection and quantification of the target compound in a gas mixture by the use of the SAW sensor. This also allows a mixture resolution by using a number of calibrated SAW sensors smaller than the number of different compounds in the analyzed mixture.
- an average one cycle response of a SAW sensor to a particular target compound is determined by directing a mixture having a known concentration of this particular target compound over the sample SAW.
- the output from this SAW sensor is processed for each target compound to provide a set of vectors x i wherein each vector represents an average one cycle response per unit concentration of the i-th target compound.
- These vectors are called "characteristic transients".
- the vectors x i make up the columns of the calibration matrix X, defining the instrument response to all compounds of interest.
- a mixture having compounds of unknown concentrations can be determined using a single calibrated SAW or a SAW array comprising the plurality of the previously calibrated SAW sensors and by applying multidimensional statistics or filtering methods to the output of the single calibrated SAW or calibrated SAW array.
- This invention does not rely solely on the steady state frequency shift as in the "fingerprint method” or on an explicit model of the sorption process as in the "time constant” method.
- This invention instead uses an overall transient shape, or a part thereof, to resolve a particular gas mixture.
- the transient response is determined by the instrument, and is defined as the instrument transfer function convolved with the compound concentrations.
- this invention uses the whole or a part of a one cycle frequency shift as an n-dimensional vector data and then applies any of the known methods, such as multidimensional statistical methods and/or linear or non-linear filtering methods to this data to resolve a multicomponent mixture.
- this method uses a vector which represents the whole cycle or a part thereof. Therefore, a mixture can be separated by using fewer SAW sensors since the method increases dimensionality of the sampling space,
- this invention when compared to the time constant method, is an improvement thereover in that this invention:
- c. uses a characteristic spectrum of a mixture which is a linear combination of the characteristic spectra of the individual components while a time constant of a mixture is not a linear combination of the individual time constants,
- e. provides a number of degrees of freedom per SAW and is not predetermined to 2 but can be determined from the available data, e.g., via Singular Value Decomposition of a calibration matrix X,
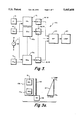
- FIG. 1 is a block diagram of a SAW sensor for calibration of the sample SAW and/or for detection of target compound in a gas mixture using the calibrated sample SAW,
- FIG. 2 is a block diagram of a SAW sensor with one coated SAW exposed to the sampled air, and the second SAW, either coated or uncoated, exposed to air filtered to remove contaminants,
- FIG. 3 is a block diagram of a SAW array comprising a set of SAW sensors with sample SAWs of the same or different coatings or a combination of coatings with each SAW sensor being held at the same or different temperatures,
- FIG. 3a is a block diagram of a SAW array with a heat conductive bar to provide a linear temperature gradient heat control
- FIG. 4 shows the raw SAW sensor output signal for TBP (tributyl phosphate) vapors of three concentrations
- FIG. 5 shows the SAW output signal of FIG. 4 with the baseline drift removed
- FIG. 6 is a typical one cycle signal with a baseline removed, i.e., one cycle of the signal of FIGS. 4 and 5,
- FIG. 7 shows the sensor response to ethanol, water, acetone, and TBP vapors using the method of steady state frequency shifts. Component identification based on maximum of a single cycle shift is not possible with this sensor,
- FIG. 8 shows signal separation by the integral of frequency shifts, also illustrating an inability to resolve TBP from the other interferants.
- FIG. 9 shows that different components have different characteristic transients (normalized signals).
- FIG. 10 shows a normalized SAW response for different TBP concentrations which shows that transient shape does not depend on concentration
- FIG. 11 shows TBP characteristic transients and a corresponding weighting vector (normalized).
- FIG. 12 shows TBP detection for the sample described in FIGS. 7 and 8 using the method and apparatus of this invention.
- FIG. 1 illustrates a SAW sensor 10 which comprises a coated SAW CS and an uncoated SAW S.
- the input to both SAWs comprises a valve 12 for the supply of a vapor mixture M and an uncontaminated air supply R so that the vapor mixture M and/or the uncontaminated air R (reference air) may be directed alternately to both SAWs. Directing the flow of mixture M and reference air R through both SAWs alternately takes care of any changes in such parameters as air temperature, in flow rate, etc.
- the SAW sensor 10 is coupled to a suitable temperature control device 14 to regulate its temperature and the temperature of mixture M and reference air R flowing therethrough.
- the output of each SAW is connected to a differential mixer 16 which in turn is connected to a counter 18 and the latter's output is directed to a computer 20.
- the SAW sensor 10 is used for determining a one cycle response to a unit concentration of a target compound.
- a known concentration of a i-th target compound in mixture M is directed to both SAW sensors through valve 12 and thereafter the uncontaminated air R is directed through valve 12 to both sensors.
- the oscillation frequency of the SAWs in response to the mixture M and the uncontaminated air R provide the frequency shift by reason of the sorption of the target compound by the coating on the sample SAW CS and this frequency shift is directed to the mixer 16 which produces a difference frequency.
- Counter 18 samples this difference frequency and produces an output signal which is processed in the computer to form a set of vectors.
- An average one cycle vector response x i scaled for a unit concentration of the target compound is called the "characteristic transient" of the target compound for a particular SAW sensor and, since there is no a priori assumptions about the form of the response of a SAW sensor having a calibrated SAW to unit concentration of the target compound, the calibration process takes into account hardware peculiarities and possible deviations from a theoretical model as described in [3].
- FIG. 2 shows a SAW CS sensor 10a with one SAW subject to the mixture and reference air while the other SAW, S or CS, is subject only to the temperature, pressure and flow rate of the mixture and reference air.
- the input of this latter SAW is directed through a filter 22 where the target compound is removed.
- SAW sensor 10 (or SAW sensor 10A as the case may be) is calibrated for all the target compounds and potential interferants that could be expected to be in the mixture.
- a calibration matrix is constructed of characteristic response vectors x i for each of the three compounds:
- FIG. 3 illustrates a SAW array 10A which contains a calibrated SAW sensor 10 1 (SS 1 ) in combination with a plurality of SAW sensors, designated as 10 1 -10 N (SS 1 -SS N ), and with a plurality of temperature controls, designated as 14 1 -14 N .
- These temperature controls function to control the temperatures of each SAW sensor and the mixture and reference air as above described. Since the SAW sensors may have the same or different coatings, these temperature controls provide a wide variety of temperature control over multiple SAW sensors in the array 10A.
- a SAW array 10B such as shown in FIG. 3a, will utilize a heat source 26 and a heat conductive bar 30 to provide a linear temperature gradient across the array 10B to control its temperature.
- each SAW sensor 10 1 -10 N is directed first to a mixer and counter, shown combined and designated M/C 1 -M/C N and 16/18.
- the output signals from each mixture and counter combination is then directed to a multiplexer 24 whose output signals are processed to form a set of vectors x i in computer 20.
- FIGS. 4-12 to explain the detection mode, it is pointed out that FIGS. 4-6 were previously referred to in the Background but will again be discussed to shown the ability of this invention to identify a target compound and its concentration in a mixture.
- FIG. 4 represents raw data, shown as the cyclical output signal from a single SAW sensor in response to TBP, the target compound of interest.
- FIG. 4 is a plot, frequency versus time, representing the frequency shift signal as the output from this SAW sensor in response to different concentrations of TBP, for example, concentrations of 1, 2 and 4 ppm. Any one of these cycles may be used for analysis and
- FIG. 5 is a rough sketch of this same data to show how the output signal of FIG. 4 appears with the baseline removed.
- FIG. 6 is also a rough sketch of one of the cycles of FIG. 5 to show the various phases of the signal.
- each measurement cycle has a loading phase (curve A) when the mixture penetrates the coating on the sample SAW, a steady state phase (curve B) when the mixture concentration in the coating reaches equilibrium with the mixture concentration in the air above the coating, and an unloading phase (curve C) during which the mixture is washed out of the coating by a stream of reference air.
- each cycle in FIGS. 4, 5 and 6 contain these phases if the exposure time of the SAW coating to the target compound is not too short.
- the following figures show the difficulty of identifying a target compound, such as TBP, in a mixture by the prior art methods.
- FIG. 7 a plot of maximum signal shift versus sample number, shows signal separation by maximum frequency shift induced by different concentrations of different vapors.
- This figure shows data for water vapors, ethanol, acetone and various concentrations of TBP with acetone having the strongest signal and ethanol and TBP barely distinguishable from the water vapor.
- This figure also shows the inability of distinguishing the various vapors in a mixture if only the maximum values of the curves are considered.
- FIG. 8 a plot of signal separation by integral of frequency shift vs sample number, shows that this method produces substantially the same in result as in FIG. 7.
- FIGS. 4, 5 and 6 show the output of a single SAW sensor in response to TBP during the calibration step and the calibration of other SAW sensors for other target compounds will produce cyclical curves of different shapes as seen in FIG. 9 which shows the output curves for the same vapors as in FIG. 7, ethanol, water, acetone and TBP.
- FIG. 9 is a plot of frequency shift vs. time and is similar to FIG. 6 with different vapors shown overlaying each other. Note the different shapes of the various vapors. The shape of the curve representing TBP differs from the shape of the curves of the other vapors. The amplitudes are normalized to have unit area under the curves. Were the other vapor curves shown alone, their cyclical curves would be represented as such in a curve such as in FIG. 6, with unique transient responses characterizing the loading and unloading phases of that curve.
- FIG. 10 is a plot of frequency shift vs. time and shows a SAW sensor response to different TBP concentrations normalized to a unit area. This FIG. demonstrates that the shapes of the curves do not depend on the concentration of TBP. It is apparent that different components have different transient responses irrespective of concentration and this important discovery enables the target compound to be identified in the mixture.
- a mixture having compounds of unknown concentrations can be determined by standard methods of multidimensional statistics-linear or nonlinear. For example, a Least Squares fit can be used as:
- vector Y represents one cycle SAW frequency shift and matrix X is built during the calibration stage, with columns comprised of the standard response vectors x i for each of the i components of the mixture.
- a similar method can be applied to an array of SAWs with different coatings by simply assembling the characteristics transients x i for each SAW sensor into one characteristic spectrum.
- FIG. 11 is a plot of normalized instrument response to TBP vs.time, and shows the weighting vectors developed to determine TBP concentration from an arbitrary mixed sample signal.
- the curve marked NR is a characteristic response of TBP and the curve marked WB is a weighting vector. Both vectors are normalized to unity for display purposes.
- FIG. 12 is a plot of TBP concentrations vs. sample numbers and thus shows the detection of TBP as a strong signal against all other vapors in the mixture which are referred to as interferants in this figure.
- interferants the cross sensitivities of the TBP determination to much higher concentrations (and instrument responses) of interferents, are demonstrated to be small.
Abstract
Description
X=[x.sub.TBP, x.sub.H2O, x.sub.ACET ] (3)
c=[c.sub.TBP, c.sub.H2O, c.sub.ACT,] (4)
Y=x·c (5)
c=X.sup.+ ·y (6)
Claims (13)
Priority Applications (1)
| Application Number | Priority Date | Filing Date | Title |
|---|---|---|---|
| US08/085,604 US5465608A (en) | 1993-06-30 | 1993-06-30 | Saw vapor sensor apparatus and multicomponent signal processing |
Applications Claiming Priority (1)
| Application Number | Priority Date | Filing Date | Title |
|---|---|---|---|
| US08/085,604 US5465608A (en) | 1993-06-30 | 1993-06-30 | Saw vapor sensor apparatus and multicomponent signal processing |
Publications (1)
| Publication Number | Publication Date |
|---|---|
| US5465608A true US5465608A (en) | 1995-11-14 |
Family
ID=22192733
Family Applications (1)
| Application Number | Title | Priority Date | Filing Date |
|---|---|---|---|
| US08/085,604 Expired - Fee Related US5465608A (en) | 1993-06-30 | 1993-06-30 | Saw vapor sensor apparatus and multicomponent signal processing |
Country Status (1)
| Country | Link |
|---|---|
| US (1) | US5465608A (en) |
Cited By (26)
| Publication number | Priority date | Publication date | Assignee | Title |
|---|---|---|---|---|
| US5817922A (en) * | 1994-05-17 | 1998-10-06 | Forschungszenlram Karlsruhe Gmbh | Gas sensor consisting of surface wave components |
| US5832411A (en) * | 1997-02-06 | 1998-11-03 | Raytheon Company | Automated network of sensor units for real-time monitoring of compounds in a fluid over a distributed area |
| US5883457A (en) * | 1997-04-24 | 1999-03-16 | Raychem Corporation | Organic matrix for acoustic reflector array |
| WO1999009388A3 (en) * | 1997-08-18 | 1999-05-06 | Metasensors Inc | Method and apparatus for real time gas analysis and medical fluids monitoring |
| US5918258A (en) * | 1996-07-11 | 1999-06-29 | Bowers; William D. | High-sensitivity instrument to measure NVR in fluids |
| US5959191A (en) * | 1995-03-27 | 1999-09-28 | California Institute Of Technology | Sensor arrays for detecting analytes in fluids |
| WO1999060389A1 (en) * | 1998-05-19 | 1999-11-25 | Advanced Technology Materials, Inc. | Piezoelectric quartz crystal hydrogen sensor, and hydrogen sensing method utilizing same |
| WO2000016091A1 (en) * | 1998-09-11 | 2000-03-23 | Femtometrics, Inc. | Chemical sensor array |
| US6089078A (en) * | 1998-04-08 | 2000-07-18 | Hycel Diagnostics | Process and device for measuring particles in suspension in a liquid |
| GB2347502A (en) * | 1999-03-05 | 2000-09-06 | Marconi Applied Techn Ltd | Fire detection apparatus |
| US6161420A (en) * | 1997-11-12 | 2000-12-19 | Fisher Controls International, Inc. | High frequency measuring circuit |
| US6286360B1 (en) * | 1999-02-25 | 2001-09-11 | Metasensors, Inc. | Methods and apparatus for real time fluid analysis |
| WO2001071336A1 (en) * | 2000-03-20 | 2001-09-27 | The Charles Stark Draper Laboratory, Inc. | Flexural plate wave sensor and array |
| US20020094531A1 (en) * | 1999-06-14 | 2002-07-18 | Frederic Zenhausern | Apparatus and method for monitoring molecular species within a medium |
| GB2399170A (en) * | 2003-03-05 | 2004-09-08 | Boc Group Plc | Chemical sensor with temperature differential between measurement and reference SAWs |
| US6975944B1 (en) | 1999-09-28 | 2005-12-13 | Alpha Mos | Method and apparatus for monitoring materials used in electronics |
| WO2005121769A1 (en) * | 2004-06-12 | 2005-12-22 | Akubio Limited | Analytical apparatus with array of sensors and calibrating element |
| US6981947B2 (en) | 2002-01-22 | 2006-01-03 | University Of Florida Research Foundation, Inc. | Method and apparatus for monitoring respiratory gases during anesthesia |
| US7052854B2 (en) | 2001-05-23 | 2006-05-30 | University Of Florida Research Foundation, Inc. | Application of nanotechnology and sensor technologies for ex-vivo diagnostics |
| US7052468B2 (en) | 2001-05-24 | 2006-05-30 | University Of Florida Research Foundation, Inc. | Method and apparatus for detecting environmental smoke exposure |
| US7104963B2 (en) | 2002-01-22 | 2006-09-12 | University Of Florida Research Foundation, Inc. | Method and apparatus for monitoring intravenous (IV) drug concentration using exhaled breath |
| US7820108B2 (en) | 1999-11-08 | 2010-10-26 | University Of Florida Research Foundation, Inc. | Marker detection method and apparatus to monitor drug compliance |
| US7914460B2 (en) | 2006-08-15 | 2011-03-29 | University Of Florida Research Foundation, Inc. | Condensate glucose analyzer |
| US8211035B2 (en) | 2002-01-22 | 2012-07-03 | University Of Florida Research Foundation, Inc. | System and method for monitoring health using exhaled breath |
| US8793849B1 (en) | 2005-07-28 | 2014-08-05 | University Of South Florida | Method of manufacturing high frequency thickness shear mode gas and organic vapor sensors |
| US9638669B2 (en) | 2014-08-13 | 2017-05-02 | Spectro Scientific, Inc. | Portable fuel dilution meter and method |
Citations (11)
| Publication number | Priority date | Publication date | Assignee | Title |
|---|---|---|---|---|
| US3333192A (en) * | 1963-12-24 | 1967-07-25 | William A Geyger | Second harmonic magnetic modulator measuring system |
| US4312228A (en) * | 1979-07-30 | 1982-01-26 | Henry Wohltjen | Methods of detection with surface acoustic wave and apparati therefor |
| US4660151A (en) * | 1983-09-19 | 1987-04-21 | Beckman Instruments, Inc. | Multicomponent quantitative analytical method and apparatus |
| US4807148A (en) * | 1987-05-29 | 1989-02-21 | Hewlett-Packard Company | Deconvolving chromatographic peaks |
| US4888295A (en) * | 1984-03-02 | 1989-12-19 | The United States Of America As Represented By The United States Department Of Energy | Portable system and method combining chromatography and array of electrochemical sensors |
| US4895017A (en) * | 1989-01-23 | 1990-01-23 | The Boeing Company | Apparatus and method for early detection and identification of dilute chemical vapors |
| US5076094A (en) * | 1990-10-03 | 1991-12-31 | The United States Of America As Represented By The United States Department Of Energy | Dual output acoustic wave sensor for molecular identification |
| US5243539A (en) * | 1989-09-13 | 1993-09-07 | The Boeing Company | Method for predicting physical parameters in a diffusion process |
| US5313416A (en) * | 1991-07-03 | 1994-05-17 | Mitsubishi Denki Kabushiki Kaisha | Semiconductor memory control device and method of mounting same in high density |
| US5325705A (en) * | 1990-12-14 | 1994-07-05 | Novapure Corporation | In-line detector system for real-time determination of impurity concentration in a flowing gas stream |
| US5351198A (en) * | 1991-02-15 | 1994-09-27 | Horiba, Ltd. | Quantitative analytical method and apparatus for determining a plurality of ingredients with spectrometric analysis |
-
1993
- 1993-06-30 US US08/085,604 patent/US5465608A/en not_active Expired - Fee Related
Patent Citations (11)
| Publication number | Priority date | Publication date | Assignee | Title |
|---|---|---|---|---|
| US3333192A (en) * | 1963-12-24 | 1967-07-25 | William A Geyger | Second harmonic magnetic modulator measuring system |
| US4312228A (en) * | 1979-07-30 | 1982-01-26 | Henry Wohltjen | Methods of detection with surface acoustic wave and apparati therefor |
| US4660151A (en) * | 1983-09-19 | 1987-04-21 | Beckman Instruments, Inc. | Multicomponent quantitative analytical method and apparatus |
| US4888295A (en) * | 1984-03-02 | 1989-12-19 | The United States Of America As Represented By The United States Department Of Energy | Portable system and method combining chromatography and array of electrochemical sensors |
| US4807148A (en) * | 1987-05-29 | 1989-02-21 | Hewlett-Packard Company | Deconvolving chromatographic peaks |
| US4895017A (en) * | 1989-01-23 | 1990-01-23 | The Boeing Company | Apparatus and method for early detection and identification of dilute chemical vapors |
| US5243539A (en) * | 1989-09-13 | 1993-09-07 | The Boeing Company | Method for predicting physical parameters in a diffusion process |
| US5076094A (en) * | 1990-10-03 | 1991-12-31 | The United States Of America As Represented By The United States Department Of Energy | Dual output acoustic wave sensor for molecular identification |
| US5325705A (en) * | 1990-12-14 | 1994-07-05 | Novapure Corporation | In-line detector system for real-time determination of impurity concentration in a flowing gas stream |
| US5351198A (en) * | 1991-02-15 | 1994-09-27 | Horiba, Ltd. | Quantitative analytical method and apparatus for determining a plurality of ingredients with spectrometric analysis |
| US5313416A (en) * | 1991-07-03 | 1994-05-17 | Mitsubishi Denki Kabushiki Kaisha | Semiconductor memory control device and method of mounting same in high density |
Non-Patent Citations (4)
| Title |
|---|
| Susan L. Rose Pehrsson, Jay W. Grate, David S. Ballantine, Jr. and Peter C. Jurs, Detection of Hazardous Vapors Including Mixtures Using Pattern Recognition Analysis of Responses from Surface Acoustic Wave Devices, Anal. Chem. 1988 60 pp. 2801 2811. * |
| Susan L. Rose-Pehrsson, Jay W. Grate, David S. Ballantine, Jr. and Peter C. Jurs, "Detection of Hazardous Vapors Including Mixtures Using Pattern Recognition Analysis of Responses from Surface Acoustic Wave Devices," Anal. Chem. 1988 60 pp. 2801-2811. |
| W. Patrick Carey and Bruce R. Kowalski, "Chemical Piezoelectric Sensor and Sensor Array Characterization," Anal. Chem. 1986, 58, pp. 3077-3084. |
| W. Patrick Carey and Bruce R. Kowalski, Chemical Piezoelectric Sensor and Sensor Array Characterization, Anal. Chem. 1986, 58, pp. 3077 3084. * |
Cited By (40)
| Publication number | Priority date | Publication date | Assignee | Title |
|---|---|---|---|---|
| US5817922A (en) * | 1994-05-17 | 1998-10-06 | Forschungszenlram Karlsruhe Gmbh | Gas sensor consisting of surface wave components |
| US5959191A (en) * | 1995-03-27 | 1999-09-28 | California Institute Of Technology | Sensor arrays for detecting analytes in fluids |
| US5918258A (en) * | 1996-07-11 | 1999-06-29 | Bowers; William D. | High-sensitivity instrument to measure NVR in fluids |
| US5832411A (en) * | 1997-02-06 | 1998-11-03 | Raytheon Company | Automated network of sensor units for real-time monitoring of compounds in a fluid over a distributed area |
| US5883457A (en) * | 1997-04-24 | 1999-03-16 | Raychem Corporation | Organic matrix for acoustic reflector array |
| US6076392A (en) * | 1997-08-18 | 2000-06-20 | Metasensors, Inc. | Method and apparatus for real time gas analysis |
| WO1999009388A3 (en) * | 1997-08-18 | 1999-05-06 | Metasensors Inc | Method and apparatus for real time gas analysis and medical fluids monitoring |
| US6272905B1 (en) | 1997-08-18 | 2001-08-14 | Metasensors, Inc. | Method and apparatus for real time gas analysis |
| US6161420A (en) * | 1997-11-12 | 2000-12-19 | Fisher Controls International, Inc. | High frequency measuring circuit |
| US6089078A (en) * | 1998-04-08 | 2000-07-18 | Hycel Diagnostics | Process and device for measuring particles in suspension in a liquid |
| US6029500A (en) * | 1998-05-19 | 2000-02-29 | Advanced Technology Materials, Inc. | Piezoelectric quartz crystal hydrogen sensor, and hydrogen sensing method utilizing same |
| WO1999060389A1 (en) * | 1998-05-19 | 1999-11-25 | Advanced Technology Materials, Inc. | Piezoelectric quartz crystal hydrogen sensor, and hydrogen sensing method utilizing same |
| WO2000016091A1 (en) * | 1998-09-11 | 2000-03-23 | Femtometrics, Inc. | Chemical sensor array |
| US6321588B1 (en) | 1998-09-11 | 2001-11-27 | Femtometrics, Inc. | Chemical sensor array |
| US6286360B1 (en) * | 1999-02-25 | 2001-09-11 | Metasensors, Inc. | Methods and apparatus for real time fluid analysis |
| GB2347502A (en) * | 1999-03-05 | 2000-09-06 | Marconi Applied Techn Ltd | Fire detection apparatus |
| US20020094531A1 (en) * | 1999-06-14 | 2002-07-18 | Frederic Zenhausern | Apparatus and method for monitoring molecular species within a medium |
| US7115229B2 (en) | 1999-06-14 | 2006-10-03 | Alpha Mos | Apparatus and method for monitoring molecular species within a medium |
| US6975944B1 (en) | 1999-09-28 | 2005-12-13 | Alpha Mos | Method and apparatus for monitoring materials used in electronics |
| US7820108B2 (en) | 1999-11-08 | 2010-10-26 | University Of Florida Research Foundation, Inc. | Marker detection method and apparatus to monitor drug compliance |
| US20030200823A1 (en) * | 2000-03-20 | 2003-10-30 | Cunningham Brian T. | Flexural plate wave sensor and array |
| US20040055401A1 (en) * | 2000-03-20 | 2004-03-25 | Cunningham Brian T. | Flexural plate wave sensor and array |
| WO2001071336A1 (en) * | 2000-03-20 | 2001-09-27 | The Charles Stark Draper Laboratory, Inc. | Flexural plate wave sensor and array |
| EP1266214A1 (en) * | 2000-03-20 | 2002-12-18 | The Charles Stark Draper Laboratory, INC. | Flexural plate wave sensor and array |
| US6837097B2 (en) * | 2000-03-20 | 2005-01-04 | The Charles Stark Draper Laboratory, Inc. | Flexural plate wave sensor and array |
| US6851297B2 (en) | 2000-03-20 | 2005-02-08 | The Charles Stark Draper Laboratory, Inc. | Flexural plate wave sensor and array |
| EP1266214A4 (en) * | 2000-03-20 | 2003-08-06 | Draper Lab Charles S | Flexural plate wave sensor and array |
| US7052854B2 (en) | 2001-05-23 | 2006-05-30 | University Of Florida Research Foundation, Inc. | Application of nanotechnology and sensor technologies for ex-vivo diagnostics |
| US7052468B2 (en) | 2001-05-24 | 2006-05-30 | University Of Florida Research Foundation, Inc. | Method and apparatus for detecting environmental smoke exposure |
| US6981947B2 (en) | 2002-01-22 | 2006-01-03 | University Of Florida Research Foundation, Inc. | Method and apparatus for monitoring respiratory gases during anesthesia |
| US7104963B2 (en) | 2002-01-22 | 2006-09-12 | University Of Florida Research Foundation, Inc. | Method and apparatus for monitoring intravenous (IV) drug concentration using exhaled breath |
| US8211035B2 (en) | 2002-01-22 | 2012-07-03 | University Of Florida Research Foundation, Inc. | System and method for monitoring health using exhaled breath |
| WO2004079360A1 (en) * | 2003-03-05 | 2004-09-16 | The Boc Group Plc | Pressure compensated chemical surface acoustic wave sensor for use in a vacuum environment |
| GB2399170A (en) * | 2003-03-05 | 2004-09-08 | Boc Group Plc | Chemical sensor with temperature differential between measurement and reference SAWs |
| WO2005121769A1 (en) * | 2004-06-12 | 2005-12-22 | Akubio Limited | Analytical apparatus with array of sensors and calibrating element |
| US20080264170A1 (en) * | 2004-06-12 | 2008-10-30 | Julian Paul Abbott | Analytical Apparatus with Array of Sensors and Calibrating Element |
| US7878064B2 (en) | 2004-06-12 | 2011-02-01 | Akubio Limited | Analytical apparatus with array of sensors and calibrating element |
| US8793849B1 (en) | 2005-07-28 | 2014-08-05 | University Of South Florida | Method of manufacturing high frequency thickness shear mode gas and organic vapor sensors |
| US7914460B2 (en) | 2006-08-15 | 2011-03-29 | University Of Florida Research Foundation, Inc. | Condensate glucose analyzer |
| US9638669B2 (en) | 2014-08-13 | 2017-05-02 | Spectro Scientific, Inc. | Portable fuel dilution meter and method |
Similar Documents
| Publication | Publication Date | Title |
|---|---|---|
| US5465608A (en) | Saw vapor sensor apparatus and multicomponent signal processing | |
| US5239483A (en) | Detection of chemicals | |
| Carey et al. | Chemical piezoelectric sensor and sensor array characterization | |
| US4353242A (en) | Multichannel detection and resolution of chromatographic peaks | |
| US5076094A (en) | Dual output acoustic wave sensor for molecular identification | |
| Martı́n et al. | Classification of vegetable oils by linear discriminant analysis of electronic nose data | |
| US20210364441A1 (en) | Method for improving identification accuracy of mixture components by using known mixture raman spectrum | |
| EP0161672B1 (en) | Data processing system for chromatography | |
| CN111504979B (en) | Method for improving mixture component identification precision by using Raman spectrum of known mixture | |
| Staples | Electronic nose simulation of olfactory response containing 500 orthogonal sensors in 10 seconds | |
| Samitier et al. | A new method to analyse signal transients in chemical sensors | |
| Reibel et al. | Gas analysis with SAW sensor systems | |
| Barkó et al. | Application of principal component analysis for the characterisation of a piezoelectric sensors array | |
| JP2723209B2 (en) | Mixed gas determination method | |
| EP0895595B1 (en) | Apparatus and method for detecting fluids | |
| JPH0954071A (en) | Gas chromatograph | |
| JPH09503859A (en) | How to identify an analyte | |
| Potyrailo et al. | Dynamic high throughput screening of chemical libraries using acoustic-wave sensor system | |
| WO2004005907A1 (en) | Improved method of chemical sensing | |
| SU1698724A1 (en) | Method of analysis of liquid dielectrics | |
| JP4009737B2 (en) | Chromatogram analyzer | |
| JP2000346776A (en) | Method and device for gas analysis, record medium with gas analysis program stored, and record medium with gsa analysis data stored | |
| Marco et al. | Improved multiexponential transient spectroscopy by iterative deconvolution | |
| JPH0769216B2 (en) | Method and device for identifying substances | |
| JPH11142313A (en) | Method for quantifying concentration of matter, device for detecting concentration of matter, and storage medium |
Legal Events
| Date | Code | Title | Description |
|---|---|---|---|
| AS | Assignment |
Owner name: PERKIN ELMER CORPORATION, THE, CONNECTICUT Free format text: ASSIGNMENT OF ASSIGNORS INTEREST;ASSIGNORS:LOKSHIN, ANATOLE;BURCHFIELD, DAVID E.;TRACY, DAVID H.;REEL/FRAME:006609/0425;SIGNING DATES FROM 19930616 TO 19930625 |
|
| AS | Assignment |
Owner name: ORBITAL SCIENCES CORPORATION, VIRGINIA Free format text: ASSIGNMENT OF ASSIGNORS INTEREST;ASSIGNOR:PERKIN-ELMER CORPORATION;REEL/FRAME:006804/0063 Effective date: 19930917 |
|
| FPAY | Fee payment |
Year of fee payment: 4 |
|
| AS | Assignment |
Owner name: MORGAN GUARANTY TRUST COMPANY OF NEW YORK, AS COLL Free format text: SECURITY AGREEMENT;ASSIGNOR:ORBITAL SCIENCES CORPORATION;REEL/FRAME:010703/0401 Effective date: 19991130 |
|
| AS | Assignment |
Owner name: ORBITAL SCIENCES CORPORATION, VIRGINIA Free format text: RELEASE OF LIEN ON PATENTS;ASSIGNOR:MORGAN GUARANTY TRUST COMPANY OF NEW YORK;REEL/FRAME:012418/0925 Effective date: 20010921 Owner name: HAMILTON SUNDSTRAND CORPORATION, CONNECTICUT Free format text: ASSIGNMENT OF ASSIGNORS INTEREST;ASSIGNOR:ORBITAL SCIENCES CORPORATION;REEL/FRAME:012418/0930 Effective date: 20010924 |
|
| AS | Assignment |
Owner name: JPMORGAN CHASE BANK, NEW YORK Free format text: MERGER AND CHANGE OF NAME;ASSIGNOR:MORGAN GURANTY TRUST COMPANY OF NEW YORK;REEL/FRAME:012735/0144 Effective date: 20011110 |
|
| AS | Assignment |
Owner name: ORBITAL SCIENCES CORPORATION, VIRGINIA Free format text: RELEASE OF SECURITY AGREEMENT;ASSIGNOR:JPMORGAN CHASE BANK;REEL/FRAME:012495/0611 Effective date: 20020123 |
|
| FEPP | Fee payment procedure |
Free format text: PAYOR NUMBER ASSIGNED (ORIGINAL EVENT CODE: ASPN); ENTITY STATUS OF PATENT OWNER: LARGE ENTITY |
|
| FPAY | Fee payment |
Year of fee payment: 8 |
|
| SULP | Surcharge for late payment |
Year of fee payment: 7 |
|
| FEPP | Fee payment procedure |
Free format text: PAYER NUMBER DE-ASSIGNED (ORIGINAL EVENT CODE: RMPN); ENTITY STATUS OF PATENT OWNER: LARGE ENTITY Free format text: PAYOR NUMBER ASSIGNED (ORIGINAL EVENT CODE: ASPN); ENTITY STATUS OF PATENT OWNER: LARGE ENTITY |
|
| REMI | Maintenance fee reminder mailed | ||
| AS | Assignment |
Owner name: ORBITAL SCIENCES CORPORATION, VIRGINIA Free format text: RELEASE BY SECURED PARTY;ASSIGNOR:WELLS FARGO FOOTHILL, INC., FORMERLY KNOWN AS FOOTHILL CAPITAL CORPORATION;REEL/FRAME:019699/0842 Effective date: 20030708 |
|
| LAPS | Lapse for failure to pay maintenance fees | ||
| STCH | Information on status: patent discontinuation |
Free format text: PATENT EXPIRED DUE TO NONPAYMENT OF MAINTENANCE FEES UNDER 37 CFR 1.362 |
|
| FP | Lapsed due to failure to pay maintenance fee |
Effective date: 20071114 |