US20120249498A1 - Image display apparatus, image display method, and magnetic resonance imaging apparatus - Google Patents
Image display apparatus, image display method, and magnetic resonance imaging apparatus Download PDFInfo
- Publication number
- US20120249498A1 US20120249498A1 US13/493,242 US201213493242A US2012249498A1 US 20120249498 A1 US20120249498 A1 US 20120249498A1 US 201213493242 A US201213493242 A US 201213493242A US 2012249498 A1 US2012249498 A1 US 2012249498A1
- Authority
- US
- United States
- Prior art keywords
- image
- display
- images
- unit
- control unit
- Prior art date
- Legal status (The legal status is an assumption and is not a legal conclusion. Google has not performed a legal analysis and makes no representation as to the accuracy of the status listed.)
- Abandoned
Links
Images


Classifications
-
- A—HUMAN NECESSITIES
- A61—MEDICAL OR VETERINARY SCIENCE; HYGIENE
- A61B—DIAGNOSIS; SURGERY; IDENTIFICATION
- A61B5/00—Measuring for diagnostic purposes; Identification of persons
- A61B5/05—Detecting, measuring or recording for diagnosis by means of electric currents or magnetic fields; Measuring using microwaves or radio waves
- A61B5/055—Detecting, measuring or recording for diagnosis by means of electric currents or magnetic fields; Measuring using microwaves or radio waves involving electronic [EMR] or nuclear [NMR] magnetic resonance, e.g. magnetic resonance imaging
-
- A—HUMAN NECESSITIES
- A61—MEDICAL OR VETERINARY SCIENCE; HYGIENE
- A61B—DIAGNOSIS; SURGERY; IDENTIFICATION
- A61B5/00—Measuring for diagnostic purposes; Identification of persons
- A61B5/40—Detecting, measuring or recording for evaluating the nervous system
- A61B5/4058—Detecting, measuring or recording for evaluating the nervous system for evaluating the central nervous system
- A61B5/4064—Evaluating the brain
-
- A—HUMAN NECESSITIES
- A61—MEDICAL OR VETERINARY SCIENCE; HYGIENE
- A61B—DIAGNOSIS; SURGERY; IDENTIFICATION
- A61B5/00—Measuring for diagnostic purposes; Identification of persons
- A61B5/70—Means for positioning the patient in relation to the detecting, measuring or recording means
- A61B5/704—Tables
-
- A—HUMAN NECESSITIES
- A61—MEDICAL OR VETERINARY SCIENCE; HYGIENE
- A61B—DIAGNOSIS; SURGERY; IDENTIFICATION
- A61B6/00—Apparatus or devices for radiation diagnosis; Apparatus or devices for radiation diagnosis combined with radiation therapy equipment
- A61B6/02—Arrangements for diagnosis sequentially in different planes; Stereoscopic radiation diagnosis
- A61B6/03—Computed tomography [CT]
- A61B6/032—Transmission computed tomography [CT]
-
- A—HUMAN NECESSITIES
- A61—MEDICAL OR VETERINARY SCIENCE; HYGIENE
- A61B—DIAGNOSIS; SURGERY; IDENTIFICATION
- A61B6/00—Apparatus or devices for radiation diagnosis; Apparatus or devices for radiation diagnosis combined with radiation therapy equipment
- A61B6/46—Arrangements for interfacing with the operator or the patient
- A61B6/461—Displaying means of special interest
- A61B6/463—Displaying means of special interest characterised by displaying multiple images or images and diagnostic data on one display
-
- A—HUMAN NECESSITIES
- A61—MEDICAL OR VETERINARY SCIENCE; HYGIENE
- A61B—DIAGNOSIS; SURGERY; IDENTIFICATION
- A61B6/00—Apparatus or devices for radiation diagnosis; Apparatus or devices for radiation diagnosis combined with radiation therapy equipment
- A61B6/46—Arrangements for interfacing with the operator or the patient
- A61B6/467—Arrangements for interfacing with the operator or the patient characterised by special input means
- A61B6/469—Arrangements for interfacing with the operator or the patient characterised by special input means for selecting a region of interest [ROI]
-
- G—PHYSICS
- G01—MEASURING; TESTING
- G01R—MEASURING ELECTRIC VARIABLES; MEASURING MAGNETIC VARIABLES
- G01R33/00—Arrangements or instruments for measuring magnetic variables
- G01R33/20—Arrangements or instruments for measuring magnetic variables involving magnetic resonance
- G01R33/44—Arrangements or instruments for measuring magnetic variables involving magnetic resonance using nuclear magnetic resonance [NMR]
- G01R33/48—NMR imaging systems
- G01R33/483—NMR imaging systems with selection of signals or spectra from particular regions of the volume, e.g. in vivo spectroscopy
-
- G—PHYSICS
- G01—MEASURING; TESTING
- G01R—MEASURING ELECTRIC VARIABLES; MEASURING MAGNETIC VARIABLES
- G01R33/00—Arrangements or instruments for measuring magnetic variables
- G01R33/20—Arrangements or instruments for measuring magnetic variables involving magnetic resonance
- G01R33/44—Arrangements or instruments for measuring magnetic variables involving magnetic resonance using nuclear magnetic resonance [NMR]
- G01R33/48—NMR imaging systems
- G01R33/54—Signal processing systems, e.g. using pulse sequences ; Generation or control of pulse sequences; Operator console
- G01R33/56—Image enhancement or correction, e.g. subtraction or averaging techniques, e.g. improvement of signal-to-noise ratio and resolution
- G01R33/563—Image enhancement or correction, e.g. subtraction or averaging techniques, e.g. improvement of signal-to-noise ratio and resolution of moving material, e.g. flow contrast angiography
- G01R33/56366—Perfusion imaging
-
- G—PHYSICS
- G06—COMPUTING OR CALCULATING; COUNTING
- G06T—IMAGE DATA PROCESSING OR GENERATION, IN GENERAL
- G06T7/00—Image analysis
- G06T7/0002—Inspection of images, e.g. flaw detection
- G06T7/0012—Biomedical image inspection
-
- G—PHYSICS
- G06—COMPUTING OR CALCULATING; COUNTING
- G06T—IMAGE DATA PROCESSING OR GENERATION, IN GENERAL
- G06T7/00—Image analysis
- G06T7/30—Determination of transform parameters for the alignment of images, i.e. image registration
-
- G—PHYSICS
- G06—COMPUTING OR CALCULATING; COUNTING
- G06T—IMAGE DATA PROCESSING OR GENERATION, IN GENERAL
- G06T9/00—Image coding
- G06T9/20—Contour coding, e.g. using detection of edges
-
- A—HUMAN NECESSITIES
- A61—MEDICAL OR VETERINARY SCIENCE; HYGIENE
- A61B—DIAGNOSIS; SURGERY; IDENTIFICATION
- A61B5/00—Measuring for diagnostic purposes; Identification of persons
- A61B5/74—Details of notification to user or communication with user or patient; User input means
- A61B5/742—Details of notification to user or communication with user or patient; User input means using visual displays
- A61B5/7425—Displaying combinations of multiple images regardless of image source, e.g. displaying a reference anatomical image with a live image
-
- A—HUMAN NECESSITIES
- A61—MEDICAL OR VETERINARY SCIENCE; HYGIENE
- A61B—DIAGNOSIS; SURGERY; IDENTIFICATION
- A61B6/00—Apparatus or devices for radiation diagnosis; Apparatus or devices for radiation diagnosis combined with radiation therapy equipment
- A61B6/48—Diagnostic techniques
- A61B6/481—Diagnostic techniques involving the use of contrast agents
-
- A—HUMAN NECESSITIES
- A61—MEDICAL OR VETERINARY SCIENCE; HYGIENE
- A61B—DIAGNOSIS; SURGERY; IDENTIFICATION
- A61B6/00—Apparatus or devices for radiation diagnosis; Apparatus or devices for radiation diagnosis combined with radiation therapy equipment
- A61B6/50—Apparatus or devices for radiation diagnosis; Apparatus or devices for radiation diagnosis combined with radiation therapy equipment specially adapted for specific body parts; specially adapted for specific clinical applications
- A61B6/507—Apparatus or devices for radiation diagnosis; Apparatus or devices for radiation diagnosis combined with radiation therapy equipment specially adapted for specific body parts; specially adapted for specific clinical applications for determination of haemodynamic parameters, e.g. perfusion CT
-
- A—HUMAN NECESSITIES
- A61—MEDICAL OR VETERINARY SCIENCE; HYGIENE
- A61B—DIAGNOSIS; SURGERY; IDENTIFICATION
- A61B8/00—Diagnosis using ultrasonic, sonic or infrasonic waves
- A61B8/08—Clinical applications
- A61B8/0808—Clinical applications for diagnosis of the brain
-
- G—PHYSICS
- G01—MEASURING; TESTING
- G01R—MEASURING ELECTRIC VARIABLES; MEASURING MAGNETIC VARIABLES
- G01R33/00—Arrangements or instruments for measuring magnetic variables
- G01R33/20—Arrangements or instruments for measuring magnetic variables involving magnetic resonance
-
- G—PHYSICS
- G01—MEASURING; TESTING
- G01R—MEASURING ELECTRIC VARIABLES; MEASURING MAGNETIC VARIABLES
- G01R33/00—Arrangements or instruments for measuring magnetic variables
- G01R33/20—Arrangements or instruments for measuring magnetic variables involving magnetic resonance
- G01R33/28—Details of apparatus provided for in groups G01R33/44 - G01R33/64
- G01R33/285—Invasive instruments, e.g. catheters or biopsy needles, specially adapted for tracking, guiding or visualization by NMR
-
- G—PHYSICS
- G01—MEASURING; TESTING
- G01R—MEASURING ELECTRIC VARIABLES; MEASURING MAGNETIC VARIABLES
- G01R33/00—Arrangements or instruments for measuring magnetic variables
- G01R33/20—Arrangements or instruments for measuring magnetic variables involving magnetic resonance
- G01R33/44—Arrangements or instruments for measuring magnetic variables involving magnetic resonance using nuclear magnetic resonance [NMR]
- G01R33/48—NMR imaging systems
- G01R33/4806—Functional imaging of brain activation
-
- G—PHYSICS
- G01—MEASURING; TESTING
- G01R—MEASURING ELECTRIC VARIABLES; MEASURING MAGNETIC VARIABLES
- G01R33/00—Arrangements or instruments for measuring magnetic variables
- G01R33/20—Arrangements or instruments for measuring magnetic variables involving magnetic resonance
- G01R33/44—Arrangements or instruments for measuring magnetic variables involving magnetic resonance using nuclear magnetic resonance [NMR]
- G01R33/48—NMR imaging systems
- G01R33/54—Signal processing systems, e.g. using pulse sequences ; Generation or control of pulse sequences; Operator console
- G01R33/56—Image enhancement or correction, e.g. subtraction or averaging techniques, e.g. improvement of signal-to-noise ratio and resolution
- G01R33/5602—Image enhancement or correction, e.g. subtraction or averaging techniques, e.g. improvement of signal-to-noise ratio and resolution by filtering or weighting based on different relaxation times within the sample, e.g. T1 weighting using an inversion pulse
-
- G—PHYSICS
- G01—MEASURING; TESTING
- G01R—MEASURING ELECTRIC VARIABLES; MEASURING MAGNETIC VARIABLES
- G01R33/00—Arrangements or instruments for measuring magnetic variables
- G01R33/20—Arrangements or instruments for measuring magnetic variables involving magnetic resonance
- G01R33/44—Arrangements or instruments for measuring magnetic variables involving magnetic resonance using nuclear magnetic resonance [NMR]
- G01R33/48—NMR imaging systems
- G01R33/54—Signal processing systems, e.g. using pulse sequences ; Generation or control of pulse sequences; Operator console
- G01R33/56—Image enhancement or correction, e.g. subtraction or averaging techniques, e.g. improvement of signal-to-noise ratio and resolution
- G01R33/5608—Data processing and visualization specially adapted for MR, e.g. for feature analysis and pattern recognition on the basis of measured MR data, segmentation of measured MR data, edge contour detection on the basis of measured MR data, for enhancing measured MR data in terms of signal-to-noise ratio by means of noise filtering or apodization, for enhancing measured MR data in terms of resolution by means for deblurring, windowing, zero filling, or generation of gray-scaled images, colour-coded images or images displaying vectors instead of pixels
-
- G—PHYSICS
- G01—MEASURING; TESTING
- G01R—MEASURING ELECTRIC VARIABLES; MEASURING MAGNETIC VARIABLES
- G01R33/00—Arrangements or instruments for measuring magnetic variables
- G01R33/20—Arrangements or instruments for measuring magnetic variables involving magnetic resonance
- G01R33/44—Arrangements or instruments for measuring magnetic variables involving magnetic resonance using nuclear magnetic resonance [NMR]
- G01R33/48—NMR imaging systems
- G01R33/54—Signal processing systems, e.g. using pulse sequences ; Generation or control of pulse sequences; Operator console
- G01R33/56—Image enhancement or correction, e.g. subtraction or averaging techniques, e.g. improvement of signal-to-noise ratio and resolution
- G01R33/563—Image enhancement or correction, e.g. subtraction or averaging techniques, e.g. improvement of signal-to-noise ratio and resolution of moving material, e.g. flow contrast angiography
- G01R33/56341—Diffusion imaging
-
- G—PHYSICS
- G01—MEASURING; TESTING
- G01R—MEASURING ELECTRIC VARIABLES; MEASURING MAGNETIC VARIABLES
- G01R33/00—Arrangements or instruments for measuring magnetic variables
- G01R33/20—Arrangements or instruments for measuring magnetic variables involving magnetic resonance
- G01R33/44—Arrangements or instruments for measuring magnetic variables involving magnetic resonance using nuclear magnetic resonance [NMR]
- G01R33/48—NMR imaging systems
- G01R33/54—Signal processing systems, e.g. using pulse sequences ; Generation or control of pulse sequences; Operator console
- G01R33/56—Image enhancement or correction, e.g. subtraction or averaging techniques, e.g. improvement of signal-to-noise ratio and resolution
- G01R33/563—Image enhancement or correction, e.g. subtraction or averaging techniques, e.g. improvement of signal-to-noise ratio and resolution of moving material, e.g. flow contrast angiography
- G01R33/5635—Angiography, e.g. contrast-enhanced angiography [CE-MRA] or time-of-flight angiography [TOF-MRA]
Definitions
- the present exemplary embodiments relate to an image display apparatus, an image display method, and a magnetic resonance imaging apparatus, and particularly relate to an image display apparatus, an image display method, and a magnetic resonance imaging apparatus according to which change in details due to a difference of the imaging methods can be easily observed without moving an observation point between images.
- MRI Magnetic Resonance Imaging
- T 1 W image longitudinal relaxation weighted image
- T 2 W image transverse relaxation weighted image
- proton density image a flair image
- f-MRI functional Magnetic Resonance Imaging
- MRS Magnetic Resonance Spectroscopy
- CT X-ray Computed Tomography
- functional image such as a functional image of a blood flow, as well as a usual anatomical image based on CT values.
- an ultrasound diagnosis apparatus uses a method of superimposing and displaying a monochrome image and a color image, onto both of which the same portion is imaged, which is called a fusion method.
- a fusion method a method of superimposing and displaying a monochrome image and a color image, onto both of which the same portion is imaged.
- another method is proposed for enabling a comparative reading without movement of an observation point when there is a plurality of images taken of the same portion, by displaying the images in the substantially same position on a screen by switching the images one by one (for example, see JP-A 2006-95279 (KOKAI)).
- an image display apparatus includes a region-of-interest setting unit that sets a region of interest on each of a plurality of images that is imaged by a diagnostic imaging apparatus and includes a same portion of a subject; a feature analysis unit that performs a feature analysis on each of the images based on pixel values of pixels included in the region of interest set by the region-of-interest setting unit; and a display control unit that causes a display unit to display the images in a substantially same position in a display area included in the display unit by switching the images in an order prescribed, and to display a result of the feature analysis obtained by the feature analysis unit in same display area.
- an image display apparatus includes a mode changing unit that changes a display mode of image with respect to each of a plurality of images that is imaged by a diagnostic imaging apparatus and includes a same portion of a subject; and a display control unit that causes a display unit to display the images of each of which the display mode is changed by the mode changing unit in a substantially same position in a display area included in the display unit by switching the images in an order prescribed.
- an image display method includes setting a region of interest on each of a plurality of images that is imaged by a diagnostic imaging apparatus and includes a same portion of a subject; performing a feature analysis on each of the images based on pixel values of pixels included in the region of interest; and causing a display unit to display the images in a substantially same position in a display area included in the display unit by switching the images in an order prescribed, and to display a result of the feature analysis in same display area.
- an image display method includes changing a display mode of image with respect to each of a plurality of images that is imaged by a diagnostic imaging apparatus and includes a same portion of a subject; and causing a display unit to display the images of each of which the display mode is changed, by switching the images in an order prescribed, in a substantially same position in a display area included in the display unit.
- a magnetic resonance imaging apparatus includes an imaging unit that takes a plurality of images that includes a same portion of a subject; a region-of-interest setting unit that sets a region of interest on each of the images taken by the imaging unit; a feature analysis unit that performs a feature analysis on each of the images based on pixel values of pixels included in the region of interest set by the region-of-interest setting unit; and a display control unit that causes a display unit to display the images in a substantially same position in a display area included in the display unit by switching the images in an order prescribed, and to display a result of the feature analysis obtained by the feature analysis unit in same display area.
- a magnetic resonance imaging apparatus includes an imaging unit that takes a plurality of images that includes a same portion of a subject; a mode changing unit that changes a display mode of image with respect to each of the images taken by the imaging unit; and a display control unit that causes a display unit to display the images of which the display mode is changed by the mode changing unit, by switching the images in an order prescribed, in a substantially same position in a display area included in the display unit.
- FIG. 1 is a schematic diagram of a general configuration of a Magnetic Resonance Imaging (MRI) apparatus according to a first embodiment of the present invention
- FIG. 2 is a functional block diagram of a configuration of a control unit according to the first embodiment
- FIGS. 3A to 3E are schematic diagrams for explaining an example of an image registration method performed by a registration processing unit according to the first embodiment
- FIG. 4 is a schematic diagram for explaining another example of an image registration method performed by the registration processing unit according to the first embodiment
- FIG. 5 is a flowchart of a process/procedure of image display performed by a control unit according to the first embodiment
- FIG. 6 is a schematic diagram of a flow of image display performed by the control unit according to the first embodiment
- FIG. 7 is a schematic diagram of another flow of image display performed by the control unit according to the first embodiment.
- FIG. 8 is a flowchart of a process/procedure of image display performed by a control unit according to a second embodiment of the present invention.
- FIG. 9 is a schematic diagram of a flow of image display performed by the control unit according to the second embodiment.
- FIG. 10 is a schematic diagram of another flow of image display performed by the control unit according to the second embodiment.
- FIG. 11 is a functional block diagram of a configuration of an image display apparatus according to a third embodiment of the present invention.
- FIG. 12 is a flowchart of a process/procedure of image display performed by a control unit according to the third embodiment.
- FIG. 13 is a schematic diagram of a flow of image display performed by the control unit according to the third embodiment.
- MRI apparatus a Magnetic Resonance Imaging apparatus
- FIG. 1 is a schematic diagram of a general configuration of the MRI apparatus 100 according to the first embodiment.
- the MRI apparatus 100 includes a static magnetic-field magnet 1 , a gradient magnetic-field coil 2 , a gradient magnetic-field power source 3 , a couch 4 , a couch control unit 5 , a Radio Frequency (RF) transmitting coil 6 , a transmitting unit 7 , an RF receiving coil 8 , a receiving unit 9 , a sequence control unit 10 and a computer system 20 .
- RF Radio Frequency
- the static magnetic-field magnet 1 is a magnet formed in a hollow drum shape, and generates a uniform static magnetic field in its inside space.
- a permanent magnet or a superconducting magnet is used as the static magnetic-field magnet 1 .
- the gradient magnetic-field coil 2 is a coil formed in a hollow drum shape, and is arranged on the inner side of the static magnetic-field magnet 1 .
- the gradient magnetic-field coil 2 is formed of three coils in combination corresponding to x, y and z axes orthogonal to one another, and the three coils generate gradient magnetic fields of which field strengths vary along three directions of the x, y and z axes, respectively, by individually receiving a current supply from the gradient magnetic-field power source 3 , which will be described later. It is assumed that the z axis direction is the same direction as that of the static magnetic field.
- the gradient magnetic-field power source 3 is a device that supplies a current to the gradient magnetic-field coil 2 .
- the gradient magnetic fields of the x, y and z axes generated by the gradient magnetic-field coil 2 correspond to, for example, a slice-selective gradient magnetic field Gs, a phase-encoding gradient magnetic field Ge, and a readout gradient magnetic field Gr, respectively.
- the slice-selective gradient magnetic field Gs is used for arbitrarily setting a scan cross-section.
- the phase-encoding gradient magnetic field Ge is used for changing the phase of a magnetic resonance signal in accordance with a spatial position.
- the readout gradient magnetic field Gr is used for changing the frequency of a magnetic resonance signal in accordance with a spatial position.
- the couch 4 is a device that includes a top plate 4 a on which a subject P is to be placed; and under the control of the couch control unit 5 , which will be described later.
- the couch 4 inserts the top plate 4 a on which the subject P is placed into a hole (a scanning space) of the gradient magnetic-field coil 2 .
- the couch 4 is placed such that the longitudinal direction of the couch 4 is to be parallel to the central axis of the static magnetic-field magnet 1 .
- the couch control unit 5 is a device that controls the couch 4 under the control of a control unit 26 , and moves the top plate 4 a in the longitudinal direction and upward and downward by driving the couch 4 .
- the RF transmitting coil 6 is a coil arranged on the inner side of the gradient magnetic-field coil 2 , and generates a radio-frequency magnetic field by receiving supply of a radio-frequency pulse from the transmitting unit 7 .
- the transmitting unit 7 is a device that transmits a radio-frequency pulse corresponding to a Larmor frequency to the RF transmitting coil 6 .
- the RF receiving coil 8 is a coil arranged on the inner side of the gradient magnetic-field coil 2 , and receives a magnetic resonance signal emitted from the subject P owing to an influence of the radio-frequency magnetic field described above. Upon receiving a magnetic resonance signal, the RF receiving coil 8 outputs the magnetic resonance signal to the receiving unit 9 .
- the receiving unit 9 creates k-space data based on the magnetic resonance signal output by the RF receiving coil 8 . Specifically, the receiving unit 9 creates k-space data by converting a magnetic resonance signal output from the RF receiving coil 8 into digital. The k-space data is associated with information about spatial frequencies of a PE direction, an RO direction, and an SE direction by the slice-selective gradient magnetic field Gs, the phase-encoding gradient magnetic field Ge, and the readout gradient magnetic field Gr. After creating k-space data, the receiving unit 9 transmits the k-space data to the sequence control unit 10 .
- the sequence control unit 10 performs scanning of the subject P by activating the gradient magnetic-field power source 3 , the transmitting unit 7 and the receiving unit 9 , based on sequence information transmitted from the computer system 20 .
- the sequence information defines a procedure for scanning, such as the strength of power to be supplied to the gradient magnetic-field coil 2 by the gradient magnetic-field power source 3 and the timing of supplying the power, the strength of an RF signal to be transmitted to the RF transmitting coil 6 by the transmitting unit 7 and the timing of transmitting the RF signal, and the timing of detecting a magnetic resonance signal by the receiving unit 9 .
- the sequence control unit 10 transfers the k-space data to the computer system 20 .
- the computer system 20 performs total control of the MRI apparatus 100 , data collection, image reconstruction, and the like.
- the computer system 20 particularly includes an interface unit 21 , an image reconstructing unit 22 , a storage unit 23 , an input unit 24 , a display unit 25 and the control unit 26 .
- the interface unit 21 controls input and output of various signals that are given and received to and from the sequence control unit 10 .
- the interface unit 21 transmits sequence information to the sequence control unit 10 , and receives k-space data from the sequence control unit 10 .
- the interface unit 21 stores k-space data in the storage unit 23 with respect to each subject P.
- the image reconstructing unit 22 creates spectrum data of a desired nuclear spin inside the subject P or image data by performing post-processing, i.e., reconstruction processing, such as Fourier transform processing, on k-space data stored in the storage unit 23 .
- post-processing i.e., reconstruction processing, such as Fourier transform processing
- the storage unit 23 stores k-space data received by the interface unit 21 , and image data created by the image reconstructing unit 22 , with respect to each subject P.
- the input unit 24 receives various instructions and information input from an operator.
- a pointing device such as a mouse or a trackball
- a selecting device such as a mode switch
- an input device such as a keyboard
- the display unit 25 displays various information, such as spectrum data or image data, under the control of the control unit 26 .
- a display device such as a liquid crystal display, can be used as the display unit 25 .
- the control unit 26 includes a Central Processing Unit (CPU) and a memory (neither of which is shown) and carries out total control of the MRI apparatus 100 . Specifically, the control unit 26 controls a scan by creating sequence information based on imaging conditions input by the operator via the input unit 24 , and transmitting the created sequence information to the sequence control unit 10 , and controls reconstruction of an image performed based on k-space data sent from the sequence control unit 10 as a result of the scan.
- CPU Central Processing Unit
- memory either of which is shown
- Magnetic Resonance (MR) imaging is performed by using a protocol in which a plurality of different sequences is combined, different kinds of images are generally obtained through one time of imaging.
- a perfusion imaging protocol can be listed as follows: a T 1 weighted image (T 1 W image) imaging sequence, a T 2 weighted image (T 2 W image) imaging sequence, and a protocol in which a flair-image imaging sequence and a dynamic-image imaging sequence are combined.
- the control unit 26 sets a Region Of Interest (ROI) on each of a plurality of images that includes the same portion of a subject, and performs a feature analysis on each of the images based on pixel values of pixels included in the set ROI.
- the control unit 26 then causes the display unit 25 to display each of the images in the substantially same position in a display area included in the display unit 25 by switching the images in a certain order, and to display a result of the feature analysis in the same display area. Consequently, according to the first embodiment, change in details due to a difference of the imaging methods can be easily observed without moving an observation point between images.
- ROI Region Of Interest
- FIG. 2 is a functional block diagram of a configuration of the control unit 26 according to the first embodiment.
- the control unit 26 particularly includes a registration processing unit 26 a, an image-correction processing unit 26 b, an ROI setting unit 26 c , a feature-analysis processing unit 26 d and a display control unit 26 e.
- the registration processing unit 26 a performs registration between a plurality of images on which a portion of a subject to be examined is imaged. Specifically, the registration processing unit 26 a reads from the storage unit 23 a plurality of images on which the same portion of a subject to be examined is imaged, and aligns the sizes and the positions of the read images.
- any of various generally-known image-registration methods for example, registration based on anatomical information, can be used.
- the registration processing unit 26 a performs registration by reading a plurality of medical images, for example, different kinds of images and images along different time sequences that are taken by the same kind of diagnostic imaging apparatus through different imaging methods, or images taken by different diagnostic imaging apparatuses.
- the registration processing unit 26 a performs registration by reading images taken through different imaging methods, such as, a T 1 W image, a T 2 W image, a proton density image, a flair image, a fat suppression image, a diffusion image, a perfusion image, a functional Magnetic Resonance Imaging (f-MRI) image and/or an MR spectroscopy.
- images taken through different imaging methods such as, a T 1 W image, a T 2 W image, a proton density image, a flair image, a fat suppression image, a diffusion image, a perfusion image, a functional Magnetic Resonance Imaging (f-MRI) image and/or an MR spectroscopy.
- f-MRI Magnetic Resonance Imaging
- the registration processing unit 26 a performs registration by reading images taken under imaging conditions that include a different setting value among imaging parameters.
- the imaging parameters include an Echo Time (TE), a Repetition Time (TR) and a b factor that indicates the strength of a Motion Probing Gradient (MPG) pulse.
- TE Echo Time
- TR Repetition Time
- MPG Motion Probing Gradient
- an MRI apparatus can image a cross-section of a subject in an arbitrary direction among three-dimensional directions. Therefore, positional information about an image taken by the MRI apparatus is expressed in a coordinate system that is uniquely determined based on a pose of a patient during a scan.
- a coordinate system is called “a patient coordinate system”, and is determined with respect to each scan based on a posture of the patient (a supine position, a prone position, a right recumbent position, or a left recumbent position), and an insert direction into the apparatus (from the head, or from the foot).
- an apparatus coordinate system is unique to an apparatus, has the origin point at the center of the magnetic field, and is expressed with three coordinate axes respectively along three directions in the apparatus, namely, an upward-and-downward direction, a right-and-left direction, and a fore-and-aft direction of the apparatus.
- Morphological images for example, a T 1 W image and a T 2 W image, are often taken of the same area in the same examination in many cases. Consequently, positions of the morphological images, such as a T 1 W image and a T 2 W image, are indicated in the same patient coordinate system. For this reason, morphological images can be easily registered by using positional information with respect to a patient coordinate system generally attached to an image.
- FIGS. 3A to 3E are schematic diagrams for explaining an example of an image registration method performed by the registration processing unit 26 a according to the first embodiment.
- DWI Diffusion Weighted Imaging
- PWI Perfusion Weighted Imaging
- the registration processing unit 26 a extracts the region of a portion subjected to registration from both a DWI image and a PWI image. Specifically, the registration processing unit 26 a extracts the region of a portion subjected to registration from among voxels included in both the DWI image and the PWI image by performing generally-known segmentation processing. The registration processing unit 26 a then extracts voxels positioned on the boundary of the extracted region as boundary voxels 31 , as shown in FIG. 3A .
- FIG. 3A depicts part of the boundary voxels 31 .
- the registration processing unit 26 a extracts shape voxels that express the shape of each region extracted from the DWI image and the PWI image. Specifically, the registration processing unit 26 a selects a certain number of voxels as shape voxels 32 from among boundary voxels included in both the DWI image and the PWI image, as shown in FIG. 3B . For example, the registration processing unit 26 a selects the shape voxels 32 with certain intervals from among a plurality of boundary voxels arranged along the boundary of the region.
- the registration processing unit 26 a associates the shape voxels between the DWI image and the PWI image. Specifically, as shown in FIG. 3C , the registration processing unit 26 a makes every combination of the shape voxels 32 between the DWI image and the PWI image in every pattern, and calculates a distance between combined voxels in every combination. The registration processing unit 26 a then specifies a pattern of combinations of the shape voxels 32 in which the total of distances between the voxels becomes the minimum. When calculating, for example, the registration processing unit 26 a calculates the position of each voxel based on the patient coordinates included in information attached to each image, and then calculates a distance between voxels based on the calculated positions.
- the registration processing unit 26 a then registers the position of each voxel by each pair of associated shape voxels. Specifically, as shown in FIG. 3D , the registration processing unit 26 a moves the position of each of the shape voxels 32 in the PWI image to match up with the position of a corresponding one of the shape voxels 32 in the DWI image, by each combination of the shape voxels 32 , according to the combinations of the shape voxels 32 in which the total of the distances between the voxels is the minimum.
- the registration processing unit 26 a then registers the position of each voxel included in the region of a portion subjected to registration based on a transformation matrix. Specifically, the registration processing unit 26 a calculates the transformation matrix between voxels 33 and the boundary voxels 31 in the region extracted from the PWI image by weighting the transformation of an adjacent shape voxel. The registration processing unit 26 a then moves each voxel based on the transformation matrix, as shown in FIG. 3E . Each of the arrows shown in FIGS. 3D and 3E indicates a vector representing the transformation of the transformation matrix.
- the registration processing unit 26 a can precisely perform registration of an image that has a distortion, such as a diffusion image and a perfusion image, by changing a style, such as the size and/or the shape, of a portion included in the image subjected to registration.
- a distortion such as a diffusion image and a perfusion image
- a method of performing registration of an image is not limited to this.
- registration of each image can be performed by receiving from an operator an operation of setting an arbitrary number of reference points on each image subjected to registration, and associating the reference points set by the operator. Accordingly, for example, as the operator sets reference points along the contour of the same portion drawn on each image, registration of each image can be performed so as to match up the position of the portion.
- FIG. 4 is a schematic diagram for explaining another example of an image registration method performed by the registration processing unit 26 a according to the first embodiment.
- FIG. 4 it is assumed that six T 1 W images I 11 to I 16 and five T 2 W images I 21 to I 25 are taken of the same portion in a slice direction.
- the slice direction is a z-axis direction of the patient coordinate system.
- the slice direction is an x-axis direction of the patient coordinate system.
- the slice direction is a y-axis direction of the patient coordinate system. It is assumed that the T 1 W images I 11 to I 16 are taken at slice intervals different from those for the T 2 W images I 21 to I 25 . Moreover, it is assumed that the position of the T 1 W image I 11 matches the position of the T 2 W image I 21 , and the position of the T 1 W image I 16 matches the position of the T 2 W image I 25 .
- the registration processing unit 26 a creates an interpolation image I 33 to be in the same position as that of the T 1 W image I 13 in the slice direction by using the T 2 W image I 22 and the T 2 W image I 24 on the opposite sides of the T 2 W image I 23 .
- the registration processing unit 26 a performs registration of the interpolation image I 33 and the T 1 W image I 13 in the direction orthogonal to the slice direction, as required. Any known technology can be used as a method of creating the interpolation image I 33 .
- the image-correction processing unit 26 b performs a correction of an image registered by the registration processing unit 26 a.
- the image-correction processing unit 26 b performs a distortion correction, or a correction for eliminating noise, on an image registered by the registration processing unit 26 a.
- any of generally-known various methods of image correction can be used.
- the image-correction processing unit 26 b can change a display style of each image by performing correction processing. For example, the image-correction processing unit 26 b changes the size of each image, or changes the shape of each image.
- the ROI setting unit 26 c sets an ROI on each image corrected by the image-correction processing unit 26 b. For example, to begin with, the ROI setting unit 26 c receives an operation of specifying a point of interest on one of a plurality of images displayed on the display unit 25 , from the operator via the input unit 24 . The ROI setting unit 26 c then sets on the image an ROI of a certain size that has the center at the received point of interest, and applies the same ROI to each of the other images.
- the ROI setting unit 26 c receives an operation of specifying a region (for example, a region of a rectangle or a circle) on one of the images displayed on the display unit 25 via the input unit 24 .
- the ROI setting unit 26 c sets on the image the received region as an ROI, and applies the same ROI to each of the other images.
- the ROI setting unit 26 c sets similarly the ROI on the other images, thereby omitting a procedure of setting a point of interest and an ROI on each of the images.
- the feature-analysis processing unit 26 d performs a feature analysis on each image corrected by the image-correction processing unit 26 b based on pixel values of pixels included in each ROI set by the ROI setting unit 26 c. For example, the feature-analysis processing unit 26 d performs a feature analysis by calculating statistics about pixel values, such as an average and a standard deviation of the pixel values.
- the display control unit 26 e causes the display unit 25 to display each image corrected by the image-correction processing unit 26 b in substantially the same position in the display area included in the display unit 25 by switching the images in a certain order (like turning pages), and to display a result of the feature analysis obtained by the feature-analysis processing unit 26 d in the same display area.
- the display control unit 26 e can cause display of a portion of an image on which an ROI is set by the ROI setting unit 26 c, for example, in an enlarged manner under a certain magnification. Accordingly, a region subjected to a diagnosis can be more precisely observed.
- FIG. 5 is a flowchart of a process/procedure of image display performed by the control unit 26 according to the first embodiment.
- FIG. 6 is a schematic diagram of a flow of image display performed by the control unit 26 according to the first embodiment.
- processing when displaying a T 1 W image, a T 2 W image, and a flair image of a brain.
- the registration processing unit 26 a receives input of a T 1 W image, a T 2 W image, and a flair image of a brain of the same subject (Step S 101 ), and registers each of the input images (Step S 102 ).
- the image-correction processing unit 26 b then corrects each of the images registered by the registration processing unit 26 a (Step S 103 ).
- the registration processing unit 26 a When performing registration, the registration processing unit 26 a performs registration of each of the images based on, for example, positional information with respect to a patient coordinate system attached to each image. When performing the registration, the registration processing unit 26 a stores the amount of movement of the coordinates generated through the registration into a storage unit, such as an internal memory, with respect to each of the images. If a style of an image, such as the size or the shape, is changed through the correction processing, the image-correction processing unit 26 b stores information indicating the size and the shape of the changed image into the storage unit with respect to each of the images.
- the display control unit 26 e causes the display unit 25 to display one of the images corrected by the image-correction processing unit 26 b, for example, the T 1 W image, in the display area included in the display unit 25 (Step S 104 ).
- the image to be displayed at Step S 104 is hereinafter referred to as a “reference image”. Different images can be set for respective kinds of diseases as a reference image, which can be arbitrarily changed in accordance with an instruction made by the operator.
- the ROI setting unit 26 c sets an ROI on each of the images based on the point of interest (Step S 106 ).
- the example shown in FIG. 6 depicts a case in which an ROI is set on “superior frontal gyrus” in terms of anatomy.
- the ROI setting unit 26 c When setting each ROI, stores positional information indicating the position of the set ROI into the storage unit with respect to each of the images. Furthermore, the ROI setting unit 26 c calculates a magnification when enlarging an image in the set ROI to a certain size for enlarged display and stores the calculated magnification into the storage unit with respect to each of the images.
- the feature-analysis processing unit 26 d creates a histogram of pixel values in the ROI as a feature analysis.
- the feature-analysis processing unit 26 d creates a histogram of statistics, such as an average value and an integrated value of the pixel values (Step S 107 ).
- the display control unit 26 e creates an enlarged image of the ROI image by image (Step S 108 ) and, furthermore, as shown in FIG. 6 , causes the display unit 25 to display an enlarged image 42 of the T 1 W image on which the histogram created by the feature-analysis processing unit 26 d is superimposed, in the display area included in the display unit 25 (Step S 109 ).
- the display control unit 26 e makes the histogram transparent and superimposes the transparent histogram on the enlarged image 42 .
- the display control unit 26 e can make the histogram opaque and superimpose the opaque histogram on the enlarged image 42 .
- the display control unit 26 e specifies the position and the size of the ROI with respect to each of the images based on the amount of movement of the coordinates, information indicating the size and the shape of image changed through correction processing, and positional information about the ROI, which are stored in the storage unit. Moreover, the display control unit 26 e creates the enlarged image, image-by-image, by enlarging an image in the ROI of which the position and the size are specified, based on the magnification stored in the storage unit.
- the operator then performs a certain operation of image switching on the displayed enlarged image 42 via the keyboard or the mouse of the input unit 24 (Yes at Step S 110 ), and then the display control unit 26 e causes the display unit 25 to display the enlarged image 42 of the T 1 W image, an enlarged image 43 of the T 2 W image, or an enlarged image 44 of the flair image, on each of which the histogram created by the feature-analysis processing unit 26 d is superimposed, by switching the enlarged images, in the substantially same position in the display area included in the display unit 25 (Step S 111 ), as shown in FIG. 6 .
- FIG. 6 depicts an example when displaying the histogram created from the pixel values of the respective images by arranging it on each of the images.
- the display control unit 26 e causes display of a flame of an image and display of a histogram in the same color with respect to each type of image.
- the display control unit 26 e displays the flame and the histogram of the T 1 W image in red, those of the T 2 W image in green, and those of the flair image in blue. Accordingly, the operator can easily establish associations between the histograms and the respective images.
- the ROI setting unit 26 c included in the control unit 26 sets an ROI on each of a T 1 W image, a T 2 W image, and a flair image of the brain of the subject P.
- the feature-analysis processing unit 26 d creates a histogram of statistics with respect to each of the images based on pixel values of pixels included in the ROIs set by the ROI setting unit 26 c.
- the display control unit 26 e then causes the display unit 25 to display one of the images in substantially the same position in the display area included in the display unit 25 by switching the images in a certain order, and to display the histogram created by the feature-analysis processing unit 26 d in the same display area.
- FIG. 7 is a schematic diagram of another flow of image display performed by the control unit 26 according to the first embodiment.
- the display control unit 26 e displays the reference image 41 indicating an ROI in parallel with one of the enlarged images 42 to 44 . Accordingly, the position of a region displayed in an enlarged manner can be easily grasped in the portion to be examined. For example, a relative position of the ROI in the brain region can be easily grasped.
- the first embodiment is explained above in a case of arranging and displaying a histogram created from pixel values of respective images on each of the images.
- the present invention is not limited to this and, for example, it can be configured such that the display control unit 26 e displays a corresponding result of a feature analysis (a histogram) on each of the images.
- the display control unit 26 e displays one of results of feature analyses by switching them image-by-image in accordance with switching of display of the images. Accordingly, the feature values of each of the images can be easily grasped by associating it with the image.
- the display control unit 26 e switches the images in accordance with an operation performed by an operator by using a keyboard and/or a mouse
- it can be configured to switch images automatically at certain time intervals. Accordingly, comparative reading of a plurality of images can be performed by switching them even under a situation where the keyboard and the mouse cannot be operated.
- the display control unit 26 e can change the order of switching images in accordance with an instruction from the operator. Accordingly, the operator can change the order of image display so as to perform comparative reading easily in accordance with the type of each image on which the operator performs comparative reading.
- the first embodiment is explained above in a case of displaying a T 1 W image, a T 2 W image, and a flair image of a brain.
- the present invention is not limited to this, and can be similarly applied to a case of displaying other kinds of images.
- ischemic penumbra area a region that does not match when superimposing the extracted segmentation regions.
- the specified region is called an “ischemic penumbra area”, and considered as a region that can be relieved by an early recovery of blood flow. For this reason, it is meaningful to specify the ischemic penumbra area accurately, for performing a diagnosis and a treatment of cerebral infarction.
- a case of displaying a diffusion image and a perfusion image of a brain is explained below as a second embodiment according to the present invention.
- a diffusion image and a perfusion image are displayed by switching them, while constantly superimposing the boundary of a segmentation region. Accordingly, an ischemic penumbra area can be accurately and easily specified, and a diagnosis and a treatment of cerebral infarction can be promptly performed.
- An MRI apparatus basically includes a configuration similar to that shown in FIGS. 1 and 2 , except that only processing to be performed by the control unit 26 is different; therefore, a flow of image display performed by the control unit 26 is explained below with reference to FIGS. 8 and 9 .
- FIG. 8 is a flowchart of a process/procedure of image display performed by the control unit 26 according to the second embodiment.
- FIG. 9 is a schematic diagram of a flow of image display performed by the control unit 26 according to the second embodiment.
- processing when displaying separately a diffusion image and a perfusion image of a brain taken four hours after an episode of a symptom.
- the registration processing unit 26 a receives input of a diffusion image and a perfusion image of a brain of the same subject taken four hours after an episode of a symptom (Step S 201 ), and then registers each of the input images (Step S 202 ).
- the image-correction processing unit 26 b then corrects each of the images registered by the registration processing unit 26 a (Step S 203 ).
- the registration processing unit 26 a When performing registration, the registration processing unit 26 a performs registration of the images based on, for example, positional information with respect to a patient coordinate system attached to each image. When performing the registration, the registration processing unit 26 a stores the amount of movement of the coordinates (for example, using a transformation matrix) generated through the registration into a storage unit, such as an internal memory, with respect to each of the images. If a style of an image, such as the size or the shape, is changed through the correction processing, the image-correction processing unit 26 b stores information that indicates the size and the shape of the changed image into the storage unit with respect to each of the images.
- a style of an image such as the size or the shape
- the display control unit 26 e arranges the images corrected by the image-correction processing unit 26 b, and then causes the display unit 25 to display the images in the display area included in the display unit 25 (Step S 204 ).
- the ROI setting unit 26 c sets a point of interest in the same position on the other image on which the operator does not specify a point of interest.
- the ROI setting unit 26 c extracts a segmentation region as an ROI from each of the images with reference to a pixel at each point of interest (Step S 206 ).
- a segmentation region performed at Step S 206 , one of generally-known various region-extraction methods, for example, a Region Growing method, can be used.
- the ROI setting unit 26 c When extracting the segmentation region, stores positional information indicating the position of the extracted segmentation region into the storage unit with respect to each of the images.
- the feature-analysis processing unit 26 d extracts the boundary of the segmentation region created by the ROI setting unit 26 c from each of the images as a feature analysis (Step S 207 ).
- the display control unit 26 e displays the perfusion image 52 on which the segmentation regions extracted from the respective images are superimposed (Step S 208 ).
- the display control unit 26 e can display the diffusion image on which the segmentation regions extracted from the respective images are superimposed.
- the display control unit 26 e specifies the position of each segmentation region on each image based on the amount of movement of the coordinates, information indicating the size and the shape of image that is changed through correction processing, and positional information about the segmentation region, which are stored in the storage unit, and then superimposes the segmentation regions.
- Step S 209 The operator then performs a certain operation of image switching on a displayed image via the keyboard or the mouse of the input unit 24 (Yes at Step S 209 ), and then the display control unit 26 e causes the display unit 25 to display the diffusion image 51 or the perfusion image 52 on which the segmentation regions extracted from the respective images by the feature-analysis processing unit 26 d are superimposed, by switching the images, in substantially the same position in the display area included in the display unit 25 (Step S 210 ).
- FIG. 9 depicts an example of the perfusion image 52 on which the segmentation regions are superimposed.
- the ROI setting unit 26 c included in the control unit 26 creates segmentation regions from a diffusion image and a perfusion image of a brain as an ROI by performing certain region-extracting processing, and the feature-analysis processing unit 26 d extracts a boundary of each segmentation created by the ROI setting unit 26 c with respect to each of the images, as a feature analysis.
- the display control unit 26 e then superimposes one on another of respective boundaries of the segmentation regions in the respective images extracted by the feature-analysis processing unit 26 d, and causes display of the superimposed boundaries on an image in a superimposed manner.
- a region indicated by using segmentation regions in a plurality of images for example, an ischemic penumbra area in a brain, can be accurately and easily specified, a diagnosis and a treatment can be promptly and effectively performed.
- FIG. 10 is a schematic diagram of another flow of image display performed by the control unit 26 according to the second embodiment.
- the display control unit 26 e when displaying a diffusion image 61 taken four hours after an episode of a symptom, a perfusion image 62 taken four hours after the episode, and a T 2 W image 63 taken 14 days after the episode, the display control unit 26 e superimposes a boundary A of a segmentation region extracted from the diffusion image 61 , a boundary B of a segmentation region extracted from the perfusion image 62 , and a boundary C of a segmentation region extracted from the T 2 W image 63 , on the respective images, and then displays each of the images by switching them.
- the boundary C indicates a region in which tissue is necrosis.
- FIG. 10 depicts an example of the T 2 W image 63 taken 14 days after the episode on which the boundaries A to C are superimposed.
- a tissue image for example, a T 2 W image
- a functional image for example, a diffusion image and/or a perfusion image
- the display control unit 26 e can vary the colors of the boundaries when displaying the boundaries in a superimposed manner. Accordingly, each of the boundaries can be easily identified.
- the exemplary embodiments are not limited to this, and can be similarly applied to other diagnostic imaging apparatuses.
- the exemplary embodiments can be similarly applied to, for example, an X-ray diagnosis apparatus, an X-ray Computed Tomography (CT) apparatus, an ultrasound diagnosis apparatus, a Single Photon Emission Computed Tomography (SPECT) apparatus, and a Positron Emission Tomography (PET) apparatus.
- CT X-ray Computed Tomography
- SPECT Single Photon Emission Computed Tomography
- PET Positron Emission Tomography
- the first embodiment and the second embodiment are explained above in cases where after performing registration of a plurality of images, a segmentation region is extracted from each of the images, and then the extracted segmentation regions are displayed on each of the images in a superimposed manner.
- a segmentation region is extracted from each of the images, and then registration can be performed only between the extracted segmentation regions.
- the display control unit 26 e registers one with another of segmentation regions extracted from respective images by the feature-analysis processing unit 26 d, and then superimposes them on one another.
- the display control unit 26 e then performs registration of the superimposed segmentation regions with an image to be displayed, and then superimposes them on one another and displays them. Accordingly, registration of the whole image does not need to be performed with respect to each of the images, so that the load of processing related to the registration can be reduced.
- the first embodiment and the second embodiment are explained above in cases where the present invention is applied to an MRI apparatus; however, the present invention is not limited to this, and can be similarly applied to an image display apparatus (also called a viewer) that displays images taken by various diagnostic imaging apparatuses, such as an MRI apparatus, an X-ray diagnosis apparatus, an X-ray CT apparatus, an ultrasound diagnosis apparatus, a SPECT apparatus, a PET apparatus, and an endoscope.
- an MRI apparatus an X-ray diagnosis apparatus
- an X-ray CT apparatus an ultrasound diagnosis apparatus
- SPECT apparatus SPECT apparatus
- PET apparatus SPECT apparatus
- endoscope an endoscope
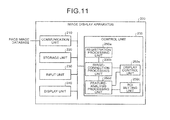
- FIG. 11 is a functional block diagram of a configuration of an image display apparatus 200 according to the third embodiment.
- the image display apparatus 200 according to the third embodiment includes a communication unit 210 , a storage unit 220 , an input unit 230 , a display unit 240 , and a control unit 250 .
- the communication unit 210 controls transmission and reception of information that is exchanged between the image display apparatus 200 and a Picture Archiving and Communication System (PACS), an image database, or the like, via a network.
- PACS Picture Archiving and Communication System
- the PACS is an image administration system included in various diagnostic imaging apparatuses and image storage devices connected via a network.
- the image database is a database that stores various images taken by various diagnostic imaging apparatuses.
- Such image data transmitted from the PACS or the image database are typically tomographic images or projection images, and further includes tomographic images of multiple cross-sections, and volume data expressed with voxels.
- the transmitted image data can be data obtained before image creation.
- an MRI apparatus performs registration in some cases by calculating the amount of movement by measuring correlation between data in frequency space.
- image data can be attached with information, such as imaging parameters, slice (scanning) position, imaging time and imaging conditions.
- the storage unit 220 stores various information, for example, an image received from the PACS or an image database via the communication unit 210 , and various programs to be executed by the control unit 250 .
- the input unit 230 receives various instructions and information input from an operator.
- a pointing device such as a mouse or a trackball
- an input device such as a keyboard
- the display unit 240 displays various information, such as an image taken by a diagnostic imaging apparatus.
- a display device such as a liquid crystal display, can be used as the display unit 240 , as required.
- the control unit 250 includes a CPU and a memory (neither of which are shown) and carries out total control of the image display apparatus 200 .
- the control unit 250 sets an ROI on each of a plurality of images that includes the same portion of a subject, and performs a feature analysis on each of the images based on pixel values of pixels included in the set ROI.
- the control unit 250 then causes the display unit 240 to display each of the images in substantially the same position in a display area included in the display unit 240 by switching the images in a certain order, and to display a result of the feature analysis in the same display area. Consequently, according to the third embodiment, change in details due to a difference of the imaging methods can be easily observed without moving an observation point between images.
- control unit 250 particularly includes a registration processing unit 250 a, an image-correction processing unit 250 b, an ROI setting unit 250 c, a feature-analysis processing unit 250 d and a display control unit 250 e. Respective functions of the units are basically similar to those of the registration processing unit 26 a , the image-correction processing unit 26 b, the ROI setting unit 26 c, the feature-analysis processing unit 26 d, and the display control unit 26 e shown in FIG. 2 ; therefore, detailed explanations are omitted below.
- FIG. 12 is a flowchart of a process/procedure of image display performed by the control unit 250 according to the third embodiment.
- FIG. 13 is a schematic diagram of a flow of image display performed by the control unit 250 according to the third embodiment.
- timings include an artery phase, a portal-venous phase and an equilibrium phase.
- the equilibrium phase is the late phase enhanced after several minutes.
- concentration of residual contrast agent in each of the phases is meaningful information.
- the third embodiment is explained below in a case of displaying respective images of the liver in the artery phase, the portal-venous phase and the equilibrium phase, obtained through a dynamic CT scan.
- the registration processing unit 250 a receives input of respective images of a liver of the same subject in an artery phase, a portal-venous phase and an equilibrium phase, obtained through a dynamic CT scan (Step S 301 ), and registers each of the input images (Step S 302 ).
- the registration processing of images performed at Step S 302 can be omitted. Accordingly, processing time for calculation can be reduced.
- the image-correction processing unit 250 b then corrects each of the images registered by the registration processing unit 250 a (Step S 303 ).
- the display control unit 250 e causes the display unit 240 to display (a) an image 71 in the artery phase of the liver, (b) an image 72 in the portal-venous phase, and (c) an image 73 in the equilibrium phase, each of which is corrected by the image-correction processing unit 250 b, in an arranged manner in the display area included in the display unit 240 (Step S 304 ).
- the ROI setting unit 250 c similarly sets the ROI in the same position on each of the images in the other phases on which the operator does not specify an ROI.
- the feature-analysis processing unit 250 d sets an abnormal area and a normal area on each of the images based on the ROI set by the ROI setting unit 250 c (Step S 306 ). Specifically, as shown in FIG. 13 , the feature-analysis processing unit 250 d sets the ROI set by the ROI setting unit 250 c to an abnormal area, and sets an extended area extended from the abnormal area by a certain distance to a normal area.
- the feature-analysis processing unit 250 d then calculates a Time Density Curve (TDC) of each of the abnormal area and the normal area based on pixel values of each of the images, as a feature analysis (Step S 307 ).
- TDC Time Density Curve
- the feature-analysis processing unit 250 d can calculate a TDC that indicates pixel values, and otherwise can calculate a TDC that indicates differences from reference values that are pixel values of an image taken before a contrast agent is injected.
- the display control unit 250 e causes the display unit 240 to display a graph 75 of the TDCs created by the feature-analysis processing unit 250 d in the display area included in the display unit 240 (Step S 308 ).
- a curve H denotes the TDC of the normal area
- a curve G denotes the TDC of the abnormal area.
- the display control unit 250 e can display the respective ROIs set on (a) the image 71 in the artery phase, (b) the image 72 in the portal-venous phase, and (c) the image 73 in the equilibrium phase (regions D, E, F, on the images 71 to 73 ) and respective lines indicating the artery phase, the portal-venous phase, and the equilibrium phase in the graph 75 of the TDCs (lines D, E and F) in the same colors phase by phase. Accordingly, the image in each phase and the concentration in each phase (corresponding to the level of a pixel value) can be easily observed in an associated manner.
- the display control unit 250 e creates enlarged images including the abnormal area and the normal area respectively from the image 71 in the artery phase, the image 72 in the portal-venous phase, and the image 73 in the equilibrium phase (Step S 309 ); and then causes the display unit 240 to display an enlarged image 74 in the artery phase on which the abnormal area and the normal area set by the ROI setting unit 250 c are superimposed in the display area included in the display unit 240 (Step S 310 ). Otherwise, the display control unit 250 e can cause display of an enlarged image in the portal-venous phase or in the equilibrium phase, instead of the enlarged image 74 in the artery phase.
- the display control unit 250 e causes the display unit 240 to display one of the respective enlarged images in the artery phase, the portal-venous phase and the equilibrium phase, on each of which the abnormal area and the normal area set by the ROI setting unit 250 c are superimposed, by switching the enlarged images, in substantially the same position in the display area included in the display unit 240 (Step S 312 ).
- the display control unit 250 e can display a line indicating the abnormal area on the enlarged image (line G on the enlarged image 74 ) and a curve indicating the TDC of the abnormal area in the graph 75 of the TDCs (curve G in the graph 75 ) in the same color, and a line indicating the normal area on the enlarged image (line H on the enlarged image 74 ) and a curve indicating the TDC of the normal area in the graph 75 of the TDCs (curve H in the graph 75 ) in the same color.
- the curves in the graph 75 of the TDCs and the abnormal area and the normal area superimposed on the image 71 in the artery phase, the image 72 in the portal-venous phase, and the image 73 in the equilibrium phase can be easily observed in an associated manner.
- one of the regions D, E and F in FIG. 13 corresponding to a switched and displayed image can be displayed in a highlighted manner.
- the ROI setting unit 250 c of the control unit 250 sets an ROI on each of a plurality of images of a liver obtained through a dynamic CT scan; and the feature-analysis processing unit 250 d sets an abnormal area and a normal area on each of the images based on pixel values of pixels included in the ROI set by the ROI setting unit 250 c, and calculates TDCs of the set abnormal area and the set normal area.
- the display control unit 250 e then causes the display unit 240 to display the images in substantially the same position in the display area included in the display unit 240 by switching the images in a certain order, and to display the abnormal area and the normal area, and the TDCs of the respective areas, in the same display area. Consequently, according to the third embodiment, change in details due to a difference of the imaging methods can be easily observed without moving an observation point between images. Specifically, the degree of remaining contrast agent in a liver can be visually confirmed.
- the image switching display and the display of feature values of ROI described in the above embodiments can be similarly applied to, for example, a plurality of CT images, MR images, ultrasound images, SPECT images, PET images and endoscope images, taken under different imaging conditions (including imaging time).
- the above display can be similarly applied to display of a combined image of some of those images.
- Examples of such combination include CT and MR, CT and PET, CT and SPECT, Digital Subtraction Angiographies (DSA) and MR, PET and MR, PET and an ultrasound diagnosis apparatus (US), SPECT and MR, SPECT and US, US and CT, US and MR, an X-ray diagnosis apparatus (X-ray) and CT, X-ray and MR, and X-ray and US.
- DSA Digital Subtraction Angiographies
- US ultrasound diagnosis apparatus
- SPECT and MR SPECT and US
- US and CT US and MR
- X-ray diagnosis apparatus X-ray
- CT X-ray and MR
- X-ray and US X-ray and US.
- a plurality of kinds of images taken of the same portion through various methods is displayed in substantially the same position on a screen by being switched, and feature values are additionally displayed, so that change in details due to a difference of imaging methods can be easily observed while fixing an observation point at a screen position of a portion of interest. Accordingly, an image reader can improve the efficiency of image reading, and can perform a diagnosis and a treatment promptly. Moreover, because a statistical result is also displayed, a diagnosis that is quantitative, but not qualitative, can be performed.
- anatomical details (ROI) on each image can be comparatively read without moving the observation point, and a determination on presence or absence of diseases, screening between benign and malign characteristics, and a decision about a treatment flow, can be performed.
- ROI anatomical details
- the image display apparatus, the image display method and the magnetic resonance imaging apparatus according to the embodiments of the present invention are useful when performing comparative reading of various images, and particularly suitable when one needs to perform a quantitative diagnosis based on a grasp of features of various images.
Landscapes
- Health & Medical Sciences (AREA)
- Engineering & Computer Science (AREA)
- Life Sciences & Earth Sciences (AREA)
- Physics & Mathematics (AREA)
- Nuclear Medicine, Radiotherapy & Molecular Imaging (AREA)
- Medical Informatics (AREA)
- General Health & Medical Sciences (AREA)
- High Energy & Nuclear Physics (AREA)
- Radiology & Medical Imaging (AREA)
- Animal Behavior & Ethology (AREA)
- Pathology (AREA)
- Heart & Thoracic Surgery (AREA)
- Biophysics (AREA)
- Public Health (AREA)
- Veterinary Medicine (AREA)
- Molecular Biology (AREA)
- Surgery (AREA)
- Biomedical Technology (AREA)
- General Physics & Mathematics (AREA)
- Optics & Photonics (AREA)
- Condensed Matter Physics & Semiconductors (AREA)
- Theoretical Computer Science (AREA)
- Human Computer Interaction (AREA)
- Signal Processing (AREA)
- Neurology (AREA)
- Pulmonology (AREA)
- Vascular Medicine (AREA)
- Computer Vision & Pattern Recognition (AREA)
- Quality & Reliability (AREA)
- Spectroscopy & Molecular Physics (AREA)
- Psychology (AREA)
- Neurosurgery (AREA)
- Physiology (AREA)
- Multimedia (AREA)
- Magnetic Resonance Imaging Apparatus (AREA)
- Apparatus For Radiation Diagnosis (AREA)
- Measuring And Recording Apparatus For Diagnosis (AREA)
Abstract
In a Magnetic Resonance Imaging (MRI) apparatus, a Region Of Interest (ROI) setting unit included in a control unit sets an ROI on each of a T1 weighted image, a T2 weighted image, and a flair image of a brain of a subject, and a feature-analysis processing unit creates a histogram of statistics with respect to each of a plurality of images based on pixel values of pixels included in the ROI set by the ROI setting unit. A display control unit then causes a display unit to display the images in substantially the same position in a display area included in the display unit by switching the images in a certain order, and to display the histogram created by the feature-analysis processing unit in the same display area.
Description
- This is a division of U.S. Ser. No. 12/603,961 filed Oct. 22, 2009, the entire content of which is incorporated herein by reference.
- This application is also based upon and claims the benefit of priority from prior Japanese Patent Application No. 2008-274842 filed on Oct. 24, 2008, and No. 2009-208519 filed on Sep. 9, 2009, the entire contents of both of which are incorporated herein by reference.
- 1. Technical Field
- The present exemplary embodiments relate to an image display apparatus, an image display method, and a magnetic resonance imaging apparatus, and particularly relate to an image display apparatus, an image display method, and a magnetic resonance imaging apparatus according to which change in details due to a difference of the imaging methods can be easily observed without moving an observation point between images.
- 2. Description of Related Art
- Conventionally, various diagnoses and treatments are carried out in medical practice with the use of various images that are taken by using various diagnostic imaging apparatuses. For example, when using a Magnetic Resonance Imaging (MRI) apparatus, it can take various kinds of images, for example, a longitudinal relaxation weighted image (T1W image), a transverse relaxation weighted image (T2W image), a proton density image, a flair image, a fat suppression image, a diffusion image, a perfusion image, a functional Magnetic Resonance Imaging (f-MRI) image, and a Magnetic Resonance Spectroscopy (MRS); the list is endless. Moreover, when using an X-ray Computed Tomography (CT) apparatus, it can take a functional image, such as a functional image of a blood flow, as well as a usual anatomical image based on CT values.
- Usually, when reading a plurality of different images, for example, films are arranged on a schaukasten, or images are arranged on a monitor; and then a diagnosis is carried out while moving an observer's eyes from a point to a point corresponding to the same anatomical portion between respective images. According to such diagnosis, because images are read by moving the observer's eyes to respective regions of interest among several kinds of arranged images, it takes a long time to read the images. It is also very difficult to perform a diagnosis while comparing anatomical details between images because it is carried out with a movement of an observation point.
- For this reason, for example, an ultrasound diagnosis apparatus uses a method of superimposing and displaying a monochrome image and a color image, onto both of which the same portion is imaged, which is called a fusion method. Apart from this, another method is proposed for enabling a comparative reading without movement of an observation point when there is a plurality of images taken of the same portion, by displaying the images in the substantially same position on a screen by switching the images one by one (for example, see JP-A 2006-95279 (KOKAI)).
- However, according to conventional technology, it is difficult to observe easily changes in details due to a difference of imaging methods. For example, according to display by a fusion method, because at least two images are superimposed, one of the superimposed images is limited to an image of a small spatial resolution, such as a monochrome image, or a topical image. According to the method of displaying images in the substantially same position by switching them, although reduction in movement of an observation point is taken into account, an observation of change in details due to a difference of imaging methods is not considered.
- According to one aspect of the exemplary embodiments, an image display apparatus includes a region-of-interest setting unit that sets a region of interest on each of a plurality of images that is imaged by a diagnostic imaging apparatus and includes a same portion of a subject; a feature analysis unit that performs a feature analysis on each of the images based on pixel values of pixels included in the region of interest set by the region-of-interest setting unit; and a display control unit that causes a display unit to display the images in a substantially same position in a display area included in the display unit by switching the images in an order prescribed, and to display a result of the feature analysis obtained by the feature analysis unit in same display area.
- According to another aspect of the exemplary embodiments, an image display apparatus includes a mode changing unit that changes a display mode of image with respect to each of a plurality of images that is imaged by a diagnostic imaging apparatus and includes a same portion of a subject; and a display control unit that causes a display unit to display the images of each of which the display mode is changed by the mode changing unit in a substantially same position in a display area included in the display unit by switching the images in an order prescribed.
- According to still another aspect of the exemplary embodiments, an image display method includes setting a region of interest on each of a plurality of images that is imaged by a diagnostic imaging apparatus and includes a same portion of a subject; performing a feature analysis on each of the images based on pixel values of pixels included in the region of interest; and causing a display unit to display the images in a substantially same position in a display area included in the display unit by switching the images in an order prescribed, and to display a result of the feature analysis in same display area.
- According to yet another aspect of the exemplary embodiments, an image display method includes changing a display mode of image with respect to each of a plurality of images that is imaged by a diagnostic imaging apparatus and includes a same portion of a subject; and causing a display unit to display the images of each of which the display mode is changed, by switching the images in an order prescribed, in a substantially same position in a display area included in the display unit.
- According to an additional aspect the exemplary embodiments, a magnetic resonance imaging apparatus includes an imaging unit that takes a plurality of images that includes a same portion of a subject; a region-of-interest setting unit that sets a region of interest on each of the images taken by the imaging unit; a feature analysis unit that performs a feature analysis on each of the images based on pixel values of pixels included in the region of interest set by the region-of-interest setting unit; and a display control unit that causes a display unit to display the images in a substantially same position in a display area included in the display unit by switching the images in an order prescribed, and to display a result of the feature analysis obtained by the feature analysis unit in same display area.
- According to a still further aspect of the exemplary embodiment, a magnetic resonance imaging apparatus includes an imaging unit that takes a plurality of images that includes a same portion of a subject; a mode changing unit that changes a display mode of image with respect to each of the images taken by the imaging unit; and a display control unit that causes a display unit to display the images of which the display mode is changed by the mode changing unit, by switching the images in an order prescribed, in a substantially same position in a display area included in the display unit.
-
FIG. 1 is a schematic diagram of a general configuration of a Magnetic Resonance Imaging (MRI) apparatus according to a first embodiment of the present invention; -
FIG. 2 is a functional block diagram of a configuration of a control unit according to the first embodiment; -
FIGS. 3A to 3E are schematic diagrams for explaining an example of an image registration method performed by a registration processing unit according to the first embodiment; -
FIG. 4 is a schematic diagram for explaining another example of an image registration method performed by the registration processing unit according to the first embodiment; -
FIG. 5 is a flowchart of a process/procedure of image display performed by a control unit according to the first embodiment; -
FIG. 6 is a schematic diagram of a flow of image display performed by the control unit according to the first embodiment; -
FIG. 7 is a schematic diagram of another flow of image display performed by the control unit according to the first embodiment; -
FIG. 8 is a flowchart of a process/procedure of image display performed by a control unit according to a second embodiment of the present invention; -
FIG. 9 is a schematic diagram of a flow of image display performed by the control unit according to the second embodiment; -
FIG. 10 is a schematic diagram of another flow of image display performed by the control unit according to the second embodiment; -
FIG. 11 is a functional block diagram of a configuration of an image display apparatus according to a third embodiment of the present invention; -
FIG. 12 is a flowchart of a process/procedure of image display performed by a control unit according to the third embodiment; and -
FIG. 13 is a schematic diagram of a flow of image display performed by the control unit according to the third embodiment. - Exemplary embodiments of an image display apparatus, an image display method, and a magnetic resonance imaging apparatus according to the present invention will be explained below in detail with reference to the accompanying drawings. Hereinafter, a Magnetic Resonance Imaging apparatus is referred to as an MRI apparatus.
- A first embodiment according to the present invention is explained below about an MRI apparatus to which the present invention is applied. First of all, a general configuration of an MRI apparatus 100 according to the first embodiment is explained below with reference to
FIG. 1 .FIG. 1 is a schematic diagram of a general configuration of the MRI apparatus 100 according to the first embodiment. As shown inFIG. 1 , the MRI apparatus 100 includes a static magnetic-field magnet 1, a gradient magnetic-field coil 2, a gradient magnetic-field power source 3, a couch 4, acouch control unit 5, a Radio Frequency (RF) transmittingcoil 6, a transmittingunit 7, an RF receiving coil 8, areceiving unit 9, asequence control unit 10 and acomputer system 20. - The static magnetic-
field magnet 1 is a magnet formed in a hollow drum shape, and generates a uniform static magnetic field in its inside space. For example, a permanent magnet or a superconducting magnet is used as the static magnetic-field magnet 1. - The gradient magnetic-
field coil 2 is a coil formed in a hollow drum shape, and is arranged on the inner side of the static magnetic-field magnet 1. The gradient magnetic-field coil 2 is formed of three coils in combination corresponding to x, y and z axes orthogonal to one another, and the three coils generate gradient magnetic fields of which field strengths vary along three directions of the x, y and z axes, respectively, by individually receiving a current supply from the gradient magnetic-field power source 3, which will be described later. It is assumed that the z axis direction is the same direction as that of the static magnetic field. The gradient magnetic-field power source 3 is a device that supplies a current to the gradient magnetic-field coil 2. - The gradient magnetic fields of the x, y and z axes generated by the gradient magnetic-
field coil 2 correspond to, for example, a slice-selective gradient magnetic field Gs, a phase-encoding gradient magnetic field Ge, and a readout gradient magnetic field Gr, respectively. The slice-selective gradient magnetic field Gs is used for arbitrarily setting a scan cross-section. The phase-encoding gradient magnetic field Ge is used for changing the phase of a magnetic resonance signal in accordance with a spatial position. The readout gradient magnetic field Gr is used for changing the frequency of a magnetic resonance signal in accordance with a spatial position. - The couch 4 is a device that includes a
top plate 4 a on which a subject P is to be placed; and under the control of thecouch control unit 5, which will be described later. The couch 4 inserts thetop plate 4 a on which the subject P is placed into a hole (a scanning space) of the gradient magnetic-field coil 2. Usually, the couch 4 is placed such that the longitudinal direction of the couch 4 is to be parallel to the central axis of the static magnetic-field magnet 1. Thecouch control unit 5 is a device that controls the couch 4 under the control of acontrol unit 26, and moves thetop plate 4 a in the longitudinal direction and upward and downward by driving the couch 4. - The
RF transmitting coil 6 is a coil arranged on the inner side of the gradient magnetic-field coil 2, and generates a radio-frequency magnetic field by receiving supply of a radio-frequency pulse from the transmittingunit 7. The transmittingunit 7 is a device that transmits a radio-frequency pulse corresponding to a Larmor frequency to theRF transmitting coil 6. - The RF receiving coil 8 is a coil arranged on the inner side of the gradient magnetic-
field coil 2, and receives a magnetic resonance signal emitted from the subject P owing to an influence of the radio-frequency magnetic field described above. Upon receiving a magnetic resonance signal, the RF receiving coil 8 outputs the magnetic resonance signal to the receivingunit 9. - The receiving
unit 9 creates k-space data based on the magnetic resonance signal output by the RF receiving coil 8. Specifically, the receivingunit 9 creates k-space data by converting a magnetic resonance signal output from the RF receiving coil 8 into digital. The k-space data is associated with information about spatial frequencies of a PE direction, an RO direction, and an SE direction by the slice-selective gradient magnetic field Gs, the phase-encoding gradient magnetic field Ge, and the readout gradient magnetic field Gr. After creating k-space data, the receivingunit 9 transmits the k-space data to thesequence control unit 10. - The
sequence control unit 10 performs scanning of the subject P by activating the gradient magnetic-field power source 3, the transmittingunit 7 and the receivingunit 9, based on sequence information transmitted from thecomputer system 20. The sequence information defines a procedure for scanning, such as the strength of power to be supplied to the gradient magnetic-field coil 2 by the gradient magnetic-field power source 3 and the timing of supplying the power, the strength of an RF signal to be transmitted to theRF transmitting coil 6 by the transmittingunit 7 and the timing of transmitting the RF signal, and the timing of detecting a magnetic resonance signal by the receivingunit 9. - When k-space data is transmitted from the receiving
unit 9 as a result of scanning the subject P by activating the gradient magnetic-field power source 3, the transmittingunit 7 and the receivingunit 9, thesequence control unit 10 transfers the k-space data to thecomputer system 20. - The
computer system 20 performs total control of the MRI apparatus 100, data collection, image reconstruction, and the like. Thecomputer system 20 particularly includes aninterface unit 21, animage reconstructing unit 22, astorage unit 23, aninput unit 24, adisplay unit 25 and thecontrol unit 26. - The
interface unit 21 controls input and output of various signals that are given and received to and from thesequence control unit 10. For example, theinterface unit 21 transmits sequence information to thesequence control unit 10, and receives k-space data from thesequence control unit 10. When having received k-space data, theinterface unit 21 stores k-space data in thestorage unit 23 with respect to each subject P. - The
image reconstructing unit 22 creates spectrum data of a desired nuclear spin inside the subject P or image data by performing post-processing, i.e., reconstruction processing, such as Fourier transform processing, on k-space data stored in thestorage unit 23. - The
storage unit 23 stores k-space data received by theinterface unit 21, and image data created by theimage reconstructing unit 22, with respect to each subject P. - The
input unit 24 receives various instructions and information input from an operator. As theinput unit 24, a pointing device, such as a mouse or a trackball, a selecting device, such as a mode switch, and an input device, such as a keyboard, can be used as required. - The
display unit 25 displays various information, such as spectrum data or image data, under the control of thecontrol unit 26. A display device, such as a liquid crystal display, can be used as thedisplay unit 25. - The
control unit 26 includes a Central Processing Unit (CPU) and a memory (neither of which is shown) and carries out total control of the MRI apparatus 100. Specifically, thecontrol unit 26 controls a scan by creating sequence information based on imaging conditions input by the operator via theinput unit 24, and transmitting the created sequence information to thesequence control unit 10, and controls reconstruction of an image performed based on k-space data sent from thesequence control unit 10 as a result of the scan. - Because Magnetic Resonance (MR) imaging is performed by using a protocol in which a plurality of different sequences is combined, different kinds of images are generally obtained through one time of imaging. Examples of a perfusion imaging protocol can be listed as follows: a T1 weighted image (T1W image) imaging sequence, a T2 weighted image (T2W image) imaging sequence, and a protocol in which a flair-image imaging sequence and a dynamic-image imaging sequence are combined.
- The general configuration of the MRI apparatus 100 according to the first embodiment has been explained above. Under such configuration, according to the first embodiment, the
control unit 26 sets a Region Of Interest (ROI) on each of a plurality of images that includes the same portion of a subject, and performs a feature analysis on each of the images based on pixel values of pixels included in the set ROI. Thecontrol unit 26 then causes thedisplay unit 25 to display each of the images in the substantially same position in a display area included in thedisplay unit 25 by switching the images in a certain order, and to display a result of the feature analysis in the same display area. Consequently, according to the first embodiment, change in details due to a difference of the imaging methods can be easily observed without moving an observation point between images. - Details of the
control unit 26 according to the first embodiment are explained below. First of all, a configuration of thecontrol unit 26 according to the first embodiment is explained below with reference toFIG. 2 .FIG. 2 is a functional block diagram of a configuration of thecontrol unit 26 according to the first embodiment. As shown inFIG. 2 , thecontrol unit 26 particularly includes aregistration processing unit 26 a, an image-correction processing unit 26 b, anROI setting unit 26 c, a feature-analysis processing unit 26 d and adisplay control unit 26 e. - The
registration processing unit 26 a performs registration between a plurality of images on which a portion of a subject to be examined is imaged. Specifically, theregistration processing unit 26 a reads from the storage unit 23 a plurality of images on which the same portion of a subject to be examined is imaged, and aligns the sizes and the positions of the read images. For the registration of images to be performed here, any of various generally-known image-registration methods, for example, registration based on anatomical information, can be used. - The
registration processing unit 26 a performs registration by reading a plurality of medical images, for example, different kinds of images and images along different time sequences that are taken by the same kind of diagnostic imaging apparatus through different imaging methods, or images taken by different diagnostic imaging apparatuses. For example, theregistration processing unit 26 a performs registration by reading images taken through different imaging methods, such as, a T1W image, a T2W image, a proton density image, a flair image, a fat suppression image, a diffusion image, a perfusion image, a functional Magnetic Resonance Imaging (f-MRI) image and/or an MR spectroscopy. - Moreover, for example, the
registration processing unit 26 a performs registration by reading images taken under imaging conditions that include a different setting value among imaging parameters. The imaging parameters include an Echo Time (TE), a Repetition Time (TR) and a b factor that indicates the strength of a Motion Probing Gradient (MPG) pulse. - Generally, an MRI apparatus can image a cross-section of a subject in an arbitrary direction among three-dimensional directions. Therefore, positional information about an image taken by the MRI apparatus is expressed in a coordinate system that is uniquely determined based on a pose of a patient during a scan. Such coordinate system is called “a patient coordinate system”, and is determined with respect to each scan based on a posture of the patient (a supine position, a prone position, a right recumbent position, or a left recumbent position), and an insert direction into the apparatus (from the head, or from the foot). On the other hand, a coordinate system called “an apparatus coordinate system” is unique to an apparatus, has the origin point at the center of the magnetic field, and is expressed with three coordinate axes respectively along three directions in the apparatus, namely, an upward-and-downward direction, a right-and-left direction, and a fore-and-aft direction of the apparatus.
- Morphological images, for example, a T1W image and a T2W image, are often taken of the same area in the same examination in many cases. Consequently, positions of the morphological images, such as a T1W image and a T2W image, are indicated in the same patient coordinate system. For this reason, morphological images can be easily registered by using positional information with respect to a patient coordinate system generally attached to an image.
- On the other hand, functional images, for example, a diffusion image and a perfusion image, generally have a distortion, so that it is difficult to perform registration simply based on a patient coordinate system. Therefore, the
registration processing unit 26 a extracts a region that indicates a characteristic portion from each image, and performs registration with reference to the extracted region.FIGS. 3A to 3E are schematic diagrams for explaining an example of an image registration method performed by theregistration processing unit 26 a according to the first embodiment. Explained below is a case of registration between a Diffusion Weighted Imaging (DWI) image and a Perfusion Weighted Imaging (PWI) image. - For example, to begin with, the
registration processing unit 26 a extracts the region of a portion subjected to registration from both a DWI image and a PWI image. Specifically, theregistration processing unit 26 a extracts the region of a portion subjected to registration from among voxels included in both the DWI image and the PWI image by performing generally-known segmentation processing. Theregistration processing unit 26 a then extracts voxels positioned on the boundary of the extracted region asboundary voxels 31, as shown inFIG. 3A .FIG. 3A depicts part of theboundary voxels 31. - Furthermore, the
registration processing unit 26 a extracts shape voxels that express the shape of each region extracted from the DWI image and the PWI image. Specifically, theregistration processing unit 26 a selects a certain number of voxels asshape voxels 32 from among boundary voxels included in both the DWI image and the PWI image, as shown inFIG. 3B . For example, theregistration processing unit 26 a selects theshape voxels 32 with certain intervals from among a plurality of boundary voxels arranged along the boundary of the region. - Subsequently, the
registration processing unit 26 a associates the shape voxels between the DWI image and the PWI image. Specifically, as shown inFIG. 3C , theregistration processing unit 26 a makes every combination of theshape voxels 32 between the DWI image and the PWI image in every pattern, and calculates a distance between combined voxels in every combination. Theregistration processing unit 26 a then specifies a pattern of combinations of theshape voxels 32 in which the total of distances between the voxels becomes the minimum. When calculating, for example, theregistration processing unit 26 a calculates the position of each voxel based on the patient coordinates included in information attached to each image, and then calculates a distance between voxels based on the calculated positions. - The
registration processing unit 26 a then registers the position of each voxel by each pair of associated shape voxels. Specifically, as shown inFIG. 3D , theregistration processing unit 26 a moves the position of each of theshape voxels 32 in the PWI image to match up with the position of a corresponding one of theshape voxels 32 in the DWI image, by each combination of the shape voxels 32, according to the combinations of theshape voxels 32 in which the total of the distances between the voxels is the minimum. - The
registration processing unit 26 a then registers the position of each voxel included in the region of a portion subjected to registration based on a transformation matrix. Specifically, theregistration processing unit 26 a calculates the transformation matrix betweenvoxels 33 and theboundary voxels 31 in the region extracted from the PWI image by weighting the transformation of an adjacent shape voxel. Theregistration processing unit 26 a then moves each voxel based on the transformation matrix, as shown inFIG. 3E . Each of the arrows shown inFIGS. 3D and 3E indicates a vector representing the transformation of the transformation matrix. - In this way, the
registration processing unit 26 a can precisely perform registration of an image that has a distortion, such as a diffusion image and a perfusion image, by changing a style, such as the size and/or the shape, of a portion included in the image subjected to registration. - A method of performing registration of an image is not limited to this. For example, registration of each image can be performed by receiving from an operator an operation of setting an arbitrary number of reference points on each image subjected to registration, and associating the reference points set by the operator. Accordingly, for example, as the operator sets reference points along the contour of the same portion drawn on each image, registration of each image can be performed so as to match up the position of the portion.
- Registration of an image is not limited to two-dimensional directions, and can be performed in three-dimensional directions.
FIG. 4 is a schematic diagram for explaining another example of an image registration method performed by theregistration processing unit 26 a according to the first embodiment. For example, as shown inFIG. 4 , it is assumed that six T1W images I11 to I16 and five T2W images I21 to I25 are taken of the same portion in a slice direction. When each of the images is an axial image, the slice direction is a z-axis direction of the patient coordinate system. When each of the images is a sagittal image, the slice direction is an x-axis direction of the patient coordinate system. When each of the images is a coronal image, the slice direction is a y-axis direction of the patient coordinate system. It is assumed that the T1W images I11 to I16 are taken at slice intervals different from those for the T2W images I21 to I25. Moreover, it is assumed that the position of the T1W image I11 matches the position of the T2W image I21, and the position of the T1W image I16 matches the position of the T2W image I25. - In such case, for example, if performing registration between the T1W image I13 and the T2W image I23, the images are different in position in the slice direction. In such case, for example, the
registration processing unit 26 a creates an interpolation image I33 to be in the same position as that of the T1W image I13 in the slice direction by using the T2W image I22 and the T2W image I24 on the opposite sides of the T2W image I23. After that, theregistration processing unit 26 a performs registration of the interpolation image I33 and the T1W image I13 in the direction orthogonal to the slice direction, as required. Any known technology can be used as a method of creating the interpolation image I33. - The image-
correction processing unit 26 b performs a correction of an image registered by theregistration processing unit 26 a. For example, the image-correction processing unit 26 b performs a distortion correction, or a correction for eliminating noise, on an image registered by theregistration processing unit 26 a. For such correction of an image, any of generally-known various methods of image correction can be used. - The image-
correction processing unit 26 b can change a display style of each image by performing correction processing. For example, the image-correction processing unit 26 b changes the size of each image, or changes the shape of each image. - The
ROI setting unit 26 c sets an ROI on each image corrected by the image-correction processing unit 26 b. For example, to begin with, theROI setting unit 26 c receives an operation of specifying a point of interest on one of a plurality of images displayed on thedisplay unit 25, from the operator via theinput unit 24. TheROI setting unit 26 c then sets on the image an ROI of a certain size that has the center at the received point of interest, and applies the same ROI to each of the other images. - Moreover, the
ROI setting unit 26 c receives an operation of specifying a region (for example, a region of a rectangle or a circle) on one of the images displayed on thedisplay unit 25 via theinput unit 24. TheROI setting unit 26 c then sets on the image the received region as an ROI, and applies the same ROI to each of the other images. - In this way, when setting an ROI on one of a plurality of images, the
ROI setting unit 26 c sets similarly the ROI on the other images, thereby omitting a procedure of setting a point of interest and an ROI on each of the images. - The feature-
analysis processing unit 26 d performs a feature analysis on each image corrected by the image-correction processing unit 26 b based on pixel values of pixels included in each ROI set by theROI setting unit 26 c. For example, the feature-analysis processing unit 26 d performs a feature analysis by calculating statistics about pixel values, such as an average and a standard deviation of the pixel values. - The
display control unit 26 e causes thedisplay unit 25 to display each image corrected by the image-correction processing unit 26 b in substantially the same position in the display area included in thedisplay unit 25 by switching the images in a certain order (like turning pages), and to display a result of the feature analysis obtained by the feature-analysis processing unit 26 d in the same display area. - The
display control unit 26 e can cause display of a portion of an image on which an ROI is set by theROI setting unit 26 c, for example, in an enlarged manner under a certain magnification. Accordingly, a region subjected to a diagnosis can be more precisely observed. - A flow of image display performed by the
control unit 26 according to the first embodiment is explained below with reference toFIGS. 5 and 6 .FIG. 5 is a flowchart of a process/procedure of image display performed by thecontrol unit 26 according to the first embodiment.FIG. 6 is a schematic diagram of a flow of image display performed by thecontrol unit 26 according to the first embodiment. Explained below is an example of processing when displaying a T1W image, a T2W image, and a flair image of a brain. - As shown in
FIG. 5 , according to thecontrol unit 26 of the first embodiment, to begin with, theregistration processing unit 26 a receives input of a T1W image, a T2W image, and a flair image of a brain of the same subject (Step S101), and registers each of the input images (Step S102). The image-correction processing unit 26 b then corrects each of the images registered by theregistration processing unit 26 a (Step S103). - When performing registration, the
registration processing unit 26 a performs registration of each of the images based on, for example, positional information with respect to a patient coordinate system attached to each image. When performing the registration, theregistration processing unit 26 a stores the amount of movement of the coordinates generated through the registration into a storage unit, such as an internal memory, with respect to each of the images. If a style of an image, such as the size or the shape, is changed through the correction processing, the image-correction processing unit 26 b stores information indicating the size and the shape of the changed image into the storage unit with respect to each of the images. - Subsequently, the
display control unit 26 e causes thedisplay unit 25 to display one of the images corrected by the image-correction processing unit 26 b, for example, the T1W image, in the display area included in the display unit 25 (Step S104). The image to be displayed at Step S104 is hereinafter referred to as a “reference image”. Different images can be set for respective kinds of diseases as a reference image, which can be arbitrarily changed in accordance with an instruction made by the operator. - As shown in
FIG. 6 , when the operator then specifies a point of interest on areference image 41 of the displayed T1W image (Yes at Step S105), theROI setting unit 26 c sets an ROI on each of the images based on the point of interest (Step S106). The example shown inFIG. 6 depicts a case in which an ROI is set on “superior frontal gyrus” in terms of anatomy. - When setting each ROI, the
ROI setting unit 26 c stores positional information indicating the position of the set ROI into the storage unit with respect to each of the images. Furthermore, theROI setting unit 26 c calculates a magnification when enlarging an image in the set ROI to a certain size for enlarged display and stores the calculated magnification into the storage unit with respect to each of the images. - Subsequently, the feature-
analysis processing unit 26 d creates a histogram of pixel values in the ROI as a feature analysis. For example, the feature-analysis processing unit 26 d creates a histogram of statistics, such as an average value and an integrated value of the pixel values (Step S107). - After that, the
display control unit 26 e creates an enlarged image of the ROI image by image (Step S108) and, furthermore, as shown inFIG. 6 , causes thedisplay unit 25 to display anenlarged image 42 of the T1W image on which the histogram created by the feature-analysis processing unit 26 d is superimposed, in the display area included in the display unit 25 (Step S109). For example, thedisplay control unit 26 e makes the histogram transparent and superimposes the transparent histogram on theenlarged image 42. Thedisplay control unit 26 e can make the histogram opaque and superimpose the opaque histogram on theenlarged image 42. - When creating an enlarged image at Step S108, the
display control unit 26 e specifies the position and the size of the ROI with respect to each of the images based on the amount of movement of the coordinates, information indicating the size and the shape of image changed through correction processing, and positional information about the ROI, which are stored in the storage unit. Moreover, thedisplay control unit 26 e creates the enlarged image, image-by-image, by enlarging an image in the ROI of which the position and the size are specified, based on the magnification stored in the storage unit. - The operator then performs a certain operation of image switching on the displayed
enlarged image 42 via the keyboard or the mouse of the input unit 24 (Yes at Step S110), and then thedisplay control unit 26 e causes thedisplay unit 25 to display theenlarged image 42 of the T1W image, anenlarged image 43 of the T2W image, or anenlarged image 44 of the flair image, on each of which the histogram created by the feature-analysis processing unit 26 d is superimposed, by switching the enlarged images, in the substantially same position in the display area included in the display unit 25 (Step S111), as shown inFIG. 6 . -
FIG. 6 depicts an example when displaying the histogram created from the pixel values of the respective images by arranging it on each of the images. In such case, for example, it can be configured such that thedisplay control unit 26 e causes display of a flame of an image and display of a histogram in the same color with respect to each type of image. In such case, for example, thedisplay control unit 26 e displays the flame and the histogram of the T1W image in red, those of the T2W image in green, and those of the flair image in blue. Accordingly, the operator can easily establish associations between the histograms and the respective images. - As described above, according to the MRI apparatus 100 of the first embodiment, the
ROI setting unit 26 c included in thecontrol unit 26 sets an ROI on each of a T1W image, a T2W image, and a flair image of the brain of the subject P. The feature-analysis processing unit 26 d creates a histogram of statistics with respect to each of the images based on pixel values of pixels included in the ROIs set by theROI setting unit 26 c. Thedisplay control unit 26 e then causes thedisplay unit 25 to display one of the images in substantially the same position in the display area included in thedisplay unit 25 by switching the images in a certain order, and to display the histogram created by the feature-analysis processing unit 26 d in the same display area. Consequently, according to the first embodiment, change in details due to a difference of the imaging methods can be easily observed without moving an observation point between images. Specifically, by displaying a histogram of statistics together with an image, a diagnosis that is quantitative, but not qualitative, can be performed. - The first embodiment is explained above in a case of displaying only an enlarged image after an ROI is set. However, the present invention is not limited to this and, for example, it can be configured to display a reference image in parallel with an enlarged image.
FIG. 7 is a schematic diagram of another flow of image display performed by thecontrol unit 26 according to the first embodiment. - In this case, for example, as shown in
FIG. 7 , thedisplay control unit 26 e displays thereference image 41 indicating an ROI in parallel with one of theenlarged images 42 to 44. Accordingly, the position of a region displayed in an enlarged manner can be easily grasped in the portion to be examined. For example, a relative position of the ROI in the brain region can be easily grasped. - Moreover, as shown in
FIG. 6 , the first embodiment is explained above in a case of arranging and displaying a histogram created from pixel values of respective images on each of the images. However, the present invention is not limited to this and, for example, it can be configured such that thedisplay control unit 26 e displays a corresponding result of a feature analysis (a histogram) on each of the images. In such case, thedisplay control unit 26 e displays one of results of feature analyses by switching them image-by-image in accordance with switching of display of the images. Accordingly, the feature values of each of the images can be easily grasped by associating it with the image. - Furthermore, although explained above is a case where the
display control unit 26 e switches the images in accordance with an operation performed by an operator by using a keyboard and/or a mouse, it can be configured to switch images automatically at certain time intervals. Accordingly, comparative reading of a plurality of images can be performed by switching them even under a situation where the keyboard and the mouse cannot be operated. - Moreover, the
display control unit 26 e can change the order of switching images in accordance with an instruction from the operator. Accordingly, the operator can change the order of image display so as to perform comparative reading easily in accordance with the type of each image on which the operator performs comparative reading. - The first embodiment is explained above in a case of displaying a T1W image, a T2W image, and a flair image of a brain. However, the present invention is not limited to this, and can be similarly applied to a case of displaying other kinds of images.
- Conventionally, the usefulness of an evaluation performed in combination on a diffusion image and a perfusion image taken by an MRI apparatus has gained recognition, particularly in examinations of cerebral infarction. Specifically in an examination of cerebral infarction by using a diffusion image and a perfusion image, a segmentation region including a portion in doubt about cerebral infarction is extracted from each of the diffusion image and the perfusion image, and then a region that does not match when superimposing the extracted segmentation regions (hereinafter, “mismatch area”) is specified. The specified region is called an “ischemic penumbra area”, and considered as a region that can be relieved by an early recovery of blood flow. For this reason, it is meaningful to specify the ischemic penumbra area accurately, for performing a diagnosis and a treatment of cerebral infarction.
- A case of displaying a diffusion image and a perfusion image of a brain is explained below as a second embodiment according to the present invention. According to the second embodiment, a diffusion image and a perfusion image are displayed by switching them, while constantly superimposing the boundary of a segmentation region. Accordingly, an ischemic penumbra area can be accurately and easily specified, and a diagnosis and a treatment of cerebral infarction can be promptly performed.
- An MRI apparatus according to the second embodiment basically includes a configuration similar to that shown in
FIGS. 1 and 2 , except that only processing to be performed by thecontrol unit 26 is different; therefore, a flow of image display performed by thecontrol unit 26 is explained below with reference toFIGS. 8 and 9 . -
FIG. 8 is a flowchart of a process/procedure of image display performed by thecontrol unit 26 according to the second embodiment.FIG. 9 is a schematic diagram of a flow of image display performed by thecontrol unit 26 according to the second embodiment. Explained below is an example of processing when displaying separately a diffusion image and a perfusion image of a brain taken four hours after an episode of a symptom. - As shown in
FIG. 8 , according to thecontrol unit 26 of the second embodiment, to begin with, theregistration processing unit 26 a receives input of a diffusion image and a perfusion image of a brain of the same subject taken four hours after an episode of a symptom (Step S201), and then registers each of the input images (Step S202). The image-correction processing unit 26 b then corrects each of the images registered by theregistration processing unit 26 a (Step S203). - When performing registration, the
registration processing unit 26 a performs registration of the images based on, for example, positional information with respect to a patient coordinate system attached to each image. When performing the registration, theregistration processing unit 26 a stores the amount of movement of the coordinates (for example, using a transformation matrix) generated through the registration into a storage unit, such as an internal memory, with respect to each of the images. If a style of an image, such as the size or the shape, is changed through the correction processing, the image-correction processing unit 26 b stores information that indicates the size and the shape of the changed image into the storage unit with respect to each of the images. - Subsequently, the
display control unit 26 e arranges the images corrected by the image-correction processing unit 26 b, and then causes thedisplay unit 25 to display the images in the display area included in the display unit 25 (Step S204). As shown inFIG. 9 , when the operator specifies a point of interest on one of adiffusion image 51 and aperfusion image 52, both of which are displayed (Yes at Step S205), theROI setting unit 26 c sets a point of interest in the same position on the other image on which the operator does not specify a point of interest. - Furthermore, the
ROI setting unit 26 c extracts a segmentation region as an ROI from each of the images with reference to a pixel at each point of interest (Step S206). For the extraction of a segmentation region performed at Step S206, one of generally-known various region-extraction methods, for example, a Region Growing method, can be used. - When extracting the segmentation region, the
ROI setting unit 26 c stores positional information indicating the position of the extracted segmentation region into the storage unit with respect to each of the images. - Subsequently, the feature-
analysis processing unit 26 d extracts the boundary of the segmentation region created by theROI setting unit 26 c from each of the images as a feature analysis (Step S207). - After that, as shown in
FIG. 9 , thedisplay control unit 26 e displays theperfusion image 52 on which the segmentation regions extracted from the respective images are superimposed (Step S208). At Step S208, instead of the perfusion image, thedisplay control unit 26 e can display the diffusion image on which the segmentation regions extracted from the respective images are superimposed. - When superimposing the segmentation regions, the
display control unit 26 e specifies the position of each segmentation region on each image based on the amount of movement of the coordinates, information indicating the size and the shape of image that is changed through correction processing, and positional information about the segmentation region, which are stored in the storage unit, and then superimposes the segmentation regions. - The operator then performs a certain operation of image switching on a displayed image via the keyboard or the mouse of the input unit 24 (Yes at Step S209), and then the
display control unit 26 e causes thedisplay unit 25 to display thediffusion image 51 or theperfusion image 52 on which the segmentation regions extracted from the respective images by the feature-analysis processing unit 26 d are superimposed, by switching the images, in substantially the same position in the display area included in the display unit 25 (Step S210).FIG. 9 depicts an example of theperfusion image 52 on which the segmentation regions are superimposed. - As described above, according to the second embodiment, in the MRI apparatus 100, the
ROI setting unit 26 c included in thecontrol unit 26 creates segmentation regions from a diffusion image and a perfusion image of a brain as an ROI by performing certain region-extracting processing, and the feature-analysis processing unit 26 d extracts a boundary of each segmentation created by theROI setting unit 26 c with respect to each of the images, as a feature analysis. Thedisplay control unit 26 e then superimposes one on another of respective boundaries of the segmentation regions in the respective images extracted by the feature-analysis processing unit 26 d, and causes display of the superimposed boundaries on an image in a superimposed manner. Consequently, according to the second embodiment, because a region indicated by using segmentation regions in a plurality of images, for example, an ischemic penumbra area in a brain, can be accurately and easily specified, a diagnosis and a treatment can be promptly and effectively performed. - The second embodiment is explained above in a case of displaying a diffusion image and a perfusion image taken at the same timing (four hours after an episode of a symptom). However, the present invention is not limited to this and, for example, can be similarly applied to a case of displaying a plurality of images taken at different timings.
FIG. 10 is a schematic diagram of another flow of image display performed by thecontrol unit 26 according to the second embodiment. - For example, as shown in
FIG. 10 , when displaying a diffusion image 61 taken four hours after an episode of a symptom, aperfusion image 62 taken four hours after the episode, and a T2W image 63 taken 14 days after the episode, thedisplay control unit 26 e superimposes a boundary A of a segmentation region extracted from the diffusion image 61, a boundary B of a segmentation region extracted from theperfusion image 62, and a boundary C of a segmentation region extracted from the T2W image 63, on the respective images, and then displays each of the images by switching them. The boundary C indicates a region in which tissue is necrosis.FIG. 10 depicts an example of the T2W image 63 taken 14 days after the episode on which the boundaries A to C are superimposed. - In this way, by constantly displaying the boundary of a segmentation region in a tissue image (for example, a T2W image) taken after the elapse of a certain time period from an episode of a symptom, and further displaying the boundary of a segmentation in a functional image (for example, a diffusion image and/or a perfusion image) taken immediately after the episode in a superimposed manner, a progress of the symptom about a lesion portion from immediately after the episode can be efficiently observed.
- Furthermore, the
display control unit 26 e can vary the colors of the boundaries when displaying the boundaries in a superimposed manner. Accordingly, each of the boundaries can be easily identified. - Although the first embodiment and the second embodiment are explained above in cases where the present invention is applied to an MRI apparatus, the exemplary embodiments are not limited to this, and can be similarly applied to other diagnostic imaging apparatuses. The exemplary embodiments can be similarly applied to, for example, an X-ray diagnosis apparatus, an X-ray Computed Tomography (CT) apparatus, an ultrasound diagnosis apparatus, a Single Photon Emission Computed Tomography (SPECT) apparatus, and a Positron Emission Tomography (PET) apparatus.
- Moreover, the first embodiment and the second embodiment are explained above in cases where after performing registration of a plurality of images, a segmentation region is extracted from each of the images, and then the extracted segmentation regions are displayed on each of the images in a superimposed manner. In contrast, for example, before registration of the images, a segmentation region is extracted from each of the images, and then registration can be performed only between the extracted segmentation regions.
- In such case, for example, at first, the
display control unit 26 e registers one with another of segmentation regions extracted from respective images by the feature-analysis processing unit 26 d, and then superimposes them on one another. Thedisplay control unit 26 e then performs registration of the superimposed segmentation regions with an image to be displayed, and then superimposes them on one another and displays them. Accordingly, registration of the whole image does not need to be performed with respect to each of the images, so that the load of processing related to the registration can be reduced. - Furthermore, the first embodiment and the second embodiment are explained above in cases where the present invention is applied to an MRI apparatus; however, the present invention is not limited to this, and can be similarly applied to an image display apparatus (also called a viewer) that displays images taken by various diagnostic imaging apparatuses, such as an MRI apparatus, an X-ray diagnosis apparatus, an X-ray CT apparatus, an ultrasound diagnosis apparatus, a SPECT apparatus, a PET apparatus, and an endoscope.
- A case of applying the present invention to an image display apparatus is explained below as a third embodiment according to the present invention. At first, a configuration of the image display apparatus according to the third embodiment is explained below with reference to
FIG. 11 .FIG. 11 is a functional block diagram of a configuration of animage display apparatus 200 according to the third embodiment. As shown inFIG. 11 , theimage display apparatus 200 according to the third embodiment includes acommunication unit 210, astorage unit 220, aninput unit 230, adisplay unit 240, and acontrol unit 250. - The
communication unit 210 controls transmission and reception of information that is exchanged between theimage display apparatus 200 and a Picture Archiving and Communication System (PACS), an image database, or the like, via a network. The PACS is an image administration system included in various diagnostic imaging apparatuses and image storage devices connected via a network. The image database is a database that stores various images taken by various diagnostic imaging apparatuses. - Such image data transmitted from the PACS or the image database are typically tomographic images or projection images, and further includes tomographic images of multiple cross-sections, and volume data expressed with voxels. Moreover, the transmitted image data can be data obtained before image creation. For example, an MRI apparatus performs registration in some cases by calculating the amount of movement by measuring correlation between data in frequency space. Furthermore, such image data can be attached with information, such as imaging parameters, slice (scanning) position, imaging time and imaging conditions.
- The
storage unit 220 stores various information, for example, an image received from the PACS or an image database via thecommunication unit 210, and various programs to be executed by thecontrol unit 250. - The
input unit 230 receives various instructions and information input from an operator. A pointing device, such as a mouse or a trackball, and an input device, such as a keyboard, can be used as theinput unit 230, as required. - The
display unit 240 displays various information, such as an image taken by a diagnostic imaging apparatus. A display device, such as a liquid crystal display, can be used as thedisplay unit 240, as required. - The
control unit 250 includes a CPU and a memory (neither of which are shown) and carries out total control of theimage display apparatus 200. According to the third embodiment, thecontrol unit 250 sets an ROI on each of a plurality of images that includes the same portion of a subject, and performs a feature analysis on each of the images based on pixel values of pixels included in the set ROI. Thecontrol unit 250 then causes thedisplay unit 240 to display each of the images in substantially the same position in a display area included in thedisplay unit 240 by switching the images in a certain order, and to display a result of the feature analysis in the same display area. Consequently, according to the third embodiment, change in details due to a difference of the imaging methods can be easily observed without moving an observation point between images. - Specifically, the
control unit 250 particularly includes aregistration processing unit 250 a, an image-correction processing unit 250 b, anROI setting unit 250 c, a feature-analysis processing unit 250 d and adisplay control unit 250 e. Respective functions of the units are basically similar to those of theregistration processing unit 26 a, the image-correction processing unit 26 b, theROI setting unit 26 c, the feature-analysis processing unit 26 d, and thedisplay control unit 26 e shown inFIG. 2 ; therefore, detailed explanations are omitted below. - A flow of image display performed by the
control unit 250 according to the third embodiment is explained below with reference toFIGS. 12 and 13 .FIG. 12 is a flowchart of a process/procedure of image display performed by thecontrol unit 250 according to the third embodiment.FIG. 13 is a schematic diagram of a flow of image display performed by thecontrol unit 250 according to the third embodiment. Explained below is an example of processing when displaying images of a liver taken along a time sequence by dynamic imaging with the use of an X-ray CT apparatus (hereinafter, “dynamic CT scan”). - According to dynamic imaging of a liver, imaging is carried out at a plurality of different timings after a contrast agent is injected into a subject. The timings include an artery phase, a portal-venous phase and an equilibrium phase. The equilibrium phase is the late phase enhanced after several minutes. The concentration of residual contrast agent in each of the phases is meaningful information. The third embodiment is explained below in a case of displaying respective images of the liver in the artery phase, the portal-venous phase and the equilibrium phase, obtained through a dynamic CT scan.
- As shown in
FIG. 12 , according to thecontrol unit 250 of the third embodiment, to begin with, theregistration processing unit 250 a receives input of respective images of a liver of the same subject in an artery phase, a portal-venous phase and an equilibrium phase, obtained through a dynamic CT scan (Step S301), and registers each of the input images (Step S302). The registration processing of images performed at Step S302 can be omitted. Accordingly, processing time for calculation can be reduced. - The image-
correction processing unit 250 b then corrects each of the images registered by theregistration processing unit 250 a (Step S303). - Subsequently, as shown in
FIG. 13 , thedisplay control unit 250 e causes thedisplay unit 240 to display (a) animage 71 in the artery phase of the liver, (b) animage 72 in the portal-venous phase, and (c) animage 73 in the equilibrium phase, each of which is corrected by the image-correction processing unit 250 b, in an arranged manner in the display area included in the display unit 240 (Step S304). - As shown in
FIG. 13 , when the operator then specifies an ROI on one of (a) theimage 71 in the artery phase, (b) theimage 72 in the portal-venous phase, and (c) theimage 73 in the equilibrium phase (D on theimage 71, E on theimage 72, or F on the image 73) (Yes at Step S305), theROI setting unit 250 c similarly sets the ROI in the same position on each of the images in the other phases on which the operator does not specify an ROI. - Subsequently, the feature-
analysis processing unit 250 d sets an abnormal area and a normal area on each of the images based on the ROI set by theROI setting unit 250 c (Step S306). Specifically, as shown inFIG. 13 , the feature-analysis processing unit 250 d sets the ROI set by theROI setting unit 250 c to an abnormal area, and sets an extended area extended from the abnormal area by a certain distance to a normal area. - The feature-
analysis processing unit 250 d then calculates a Time Density Curve (TDC) of each of the abnormal area and the normal area based on pixel values of each of the images, as a feature analysis (Step S307). At Step S307, the feature-analysis processing unit 250 d can calculate a TDC that indicates pixel values, and otherwise can calculate a TDC that indicates differences from reference values that are pixel values of an image taken before a contrast agent is injected. - After that, as shown in
FIG. 13 , thedisplay control unit 250 e causes thedisplay unit 240 to display agraph 75 of the TDCs created by the feature-analysis processing unit 250 d in the display area included in the display unit 240 (Step S308). According to thegraph 75, a curve H denotes the TDC of the normal area, and a curve G denotes the TDC of the abnormal area. - As shown in
FIG. 13 , thedisplay control unit 250 e can display the respective ROIs set on (a) theimage 71 in the artery phase, (b) theimage 72 in the portal-venous phase, and (c) theimage 73 in the equilibrium phase (regions D, E, F, on theimages 71 to 73) and respective lines indicating the artery phase, the portal-venous phase, and the equilibrium phase in thegraph 75 of the TDCs (lines D, E and F) in the same colors phase by phase. Accordingly, the image in each phase and the concentration in each phase (corresponding to the level of a pixel value) can be easily observed in an associated manner. - Subsequently, the
display control unit 250 e creates enlarged images including the abnormal area and the normal area respectively from theimage 71 in the artery phase, theimage 72 in the portal-venous phase, and theimage 73 in the equilibrium phase (Step S309); and then causes thedisplay unit 240 to display anenlarged image 74 in the artery phase on which the abnormal area and the normal area set by theROI setting unit 250 c are superimposed in the display area included in the display unit 240 (Step S310). Otherwise, thedisplay control unit 250 e can cause display of an enlarged image in the portal-venous phase or in the equilibrium phase, instead of theenlarged image 74 in the artery phase. - When the operator performs a certain operation of image switching on a displayed image via the keyboard or the mouse of the input unit 230 (Yes at Step S311), the
display control unit 250 e causes thedisplay unit 240 to display one of the respective enlarged images in the artery phase, the portal-venous phase and the equilibrium phase, on each of which the abnormal area and the normal area set by theROI setting unit 250 c are superimposed, by switching the enlarged images, in substantially the same position in the display area included in the display unit 240 (Step S312). - As shown in
FIG. 13 , thedisplay control unit 250 e can display a line indicating the abnormal area on the enlarged image (line G on the enlarged image 74) and a curve indicating the TDC of the abnormal area in thegraph 75 of the TDCs (curve G in the graph 75) in the same color, and a line indicating the normal area on the enlarged image (line H on the enlarged image 74) and a curve indicating the TDC of the normal area in thegraph 75 of the TDCs (curve H in the graph 75) in the same color. Accordingly, the curves in thegraph 75 of the TDCs and the abnormal area and the normal area superimposed on theimage 71 in the artery phase, theimage 72 in the portal-venous phase, and theimage 73 in the equilibrium phase can be easily observed in an associated manner. - Alternatively, one of the regions D, E and F in
FIG. 13 corresponding to a switched and displayed image can be displayed in a highlighted manner. - As described above, according to the third embodiment, in the
image display apparatus 200, theROI setting unit 250 c of thecontrol unit 250 sets an ROI on each of a plurality of images of a liver obtained through a dynamic CT scan; and the feature-analysis processing unit 250 d sets an abnormal area and a normal area on each of the images based on pixel values of pixels included in the ROI set by theROI setting unit 250 c, and calculates TDCs of the set abnormal area and the set normal area. Thedisplay control unit 250 e then causes thedisplay unit 240 to display the images in substantially the same position in the display area included in thedisplay unit 240 by switching the images in a certain order, and to display the abnormal area and the normal area, and the TDCs of the respective areas, in the same display area. Consequently, according to the third embodiment, change in details due to a difference of the imaging methods can be easily observed without moving an observation point between images. Specifically, the degree of remaining contrast agent in a liver can be visually confirmed. - In addition to the image used in the above embodiments, the image switching display and the display of feature values of ROI described in the above embodiments can be similarly applied to, for example, a plurality of CT images, MR images, ultrasound images, SPECT images, PET images and endoscope images, taken under different imaging conditions (including imaging time). Moreover, the above display can be similarly applied to display of a combined image of some of those images. Examples of such combination include CT and MR, CT and PET, CT and SPECT, Digital Subtraction Angiographies (DSA) and MR, PET and MR, PET and an ultrasound diagnosis apparatus (US), SPECT and MR, SPECT and US, US and CT, US and MR, an X-ray diagnosis apparatus (X-ray) and CT, X-ray and MR, and X-ray and US.
- As described above, according to the first, the second, or the third embodiment, a plurality of kinds of images taken of the same portion through various methods is displayed in substantially the same position on a screen by being switched, and feature values are additionally displayed, so that change in details due to a difference of imaging methods can be easily observed while fixing an observation point at a screen position of a portion of interest. Accordingly, an image reader can improve the efficiency of image reading, and can perform a diagnosis and a treatment promptly. Moreover, because a statistical result is also displayed, a diagnosis that is quantitative, but not qualitative, can be performed.
- In other words, according to the first, the second, or the third embodiment, by displaying an image effective for an image diagnosis and its feature values, with the use of a plurality of medical images, anatomical details (ROI) on each image can be comparatively read without moving the observation point, and a determination on presence or absence of diseases, screening between benign and malign characteristics, and a decision about a treatment flow, can be performed.
- As described above, the image display apparatus, the image display method and the magnetic resonance imaging apparatus according to the embodiments of the present invention are useful when performing comparative reading of various images, and particularly suitable when one needs to perform a quantitative diagnosis based on a grasp of features of various images.
- Additional advantages and modifications will readily occur to those skilled in the art. Therefore, the invention in its broader aspects is not limited to the specific details and representative embodiments shown and described herein. Accordingly, various modifications may be made without departing from the spirit or scope of the general inventive concept as defined by the appended claims and their equivalents.
Claims (5)
1. An image display apparatus comprising:
a mode changing unit that changes a display mode of image with respect to each of a plurality of images that is imaged by a diagnostic imaging apparatus and includes a same portion of a subject; and
a display control unit that causes a display unit to display the images of each of which the display mode is changed by the mode changing unit in a substantially same position in a display area included in the display unit by switching the images in an order prescribed.
2. The image display apparatus according to claim 1 , wherein the mode changing unit changes a size of image with respect to each of the images.
3. The image display apparatus according to claim 1 , wherein the mode changing unit changes a shape of image with respect to each of the images.
4. An image display method comprising:
changing a display mode of image with respect to each of a plurality of images that is imaged by a diagnostic imaging apparatus and includes a same portion of a subject; and
causing a display unit to display the images of each of which the display mode is changed, by switching the images in an order prescribed, in a substantially same position in a display area included in the display unit.
5. A magnetic resonance imaging apparatus comprising:
an imaging unit that takes a plurality of images that includes a same portion of a subject;
a mode changing unit that changes a display mode of image with respect to each of the images taken by the imaging unit; and
a display control unit that causes a display unit to display the images of which the display mode is changed by the mode changing unit, by switching the images in an order prescribed, in a substantially same position in a display area included in the display unit.
Priority Applications (1)
| Application Number | Priority Date | Filing Date | Title |
|---|---|---|---|
| US13/493,242 US20120249498A1 (en) | 2008-10-24 | 2012-06-11 | Image display apparatus, image display method, and magnetic resonance imaging apparatus |
Applications Claiming Priority (6)
| Application Number | Priority Date | Filing Date | Title |
|---|---|---|---|
| JP2008-274842 | 2008-10-24 | ||
| JP2008274842 | 2008-10-24 | ||
| JP2009-208519 | 2009-09-09 | ||
| JP2009208519A JP5562598B2 (en) | 2008-10-24 | 2009-09-09 | Image display apparatus, image display method, and magnetic resonance imaging apparatus |
| US12/603,961 US9706943B2 (en) | 2008-10-24 | 2009-10-22 | Image display apparatus, image display method, and magnetic resonance imaging apparatus |
| US13/493,242 US20120249498A1 (en) | 2008-10-24 | 2012-06-11 | Image display apparatus, image display method, and magnetic resonance imaging apparatus |
Related Parent Applications (1)
| Application Number | Title | Priority Date | Filing Date |
|---|---|---|---|
| US12/603,961 Division US9706943B2 (en) | 2008-10-24 | 2009-10-22 | Image display apparatus, image display method, and magnetic resonance imaging apparatus |
Publications (1)
| Publication Number | Publication Date |
|---|---|
| US20120249498A1 true US20120249498A1 (en) | 2012-10-04 |
Family
ID=42118145
Family Applications (2)
| Application Number | Title | Priority Date | Filing Date |
|---|---|---|---|
| US12/603,961 Active 2030-03-07 US9706943B2 (en) | 2008-10-24 | 2009-10-22 | Image display apparatus, image display method, and magnetic resonance imaging apparatus |
| US13/493,242 Abandoned US20120249498A1 (en) | 2008-10-24 | 2012-06-11 | Image display apparatus, image display method, and magnetic resonance imaging apparatus |
Family Applications Before (1)
| Application Number | Title | Priority Date | Filing Date |
|---|---|---|---|
| US12/603,961 Active 2030-03-07 US9706943B2 (en) | 2008-10-24 | 2009-10-22 | Image display apparatus, image display method, and magnetic resonance imaging apparatus |
Country Status (3)
| Country | Link |
|---|---|
| US (2) | US9706943B2 (en) |
| JP (1) | JP5562598B2 (en) |
| CN (2) | CN102525467B (en) |
Cited By (5)
| Publication number | Priority date | Publication date | Assignee | Title |
|---|---|---|---|---|
| US20160239988A1 (en) * | 2015-02-12 | 2016-08-18 | Miriam Keil | Evaluation of a dynamic contrast medium distribution |
| US20170071497A1 (en) * | 2015-09-10 | 2017-03-16 | Toshiba Medical Systems Corporation | Magnetic resonance imaging apparatus and image processing apparatus |
| CN106510707A (en) * | 2015-09-10 | 2017-03-22 | 东芝医疗系统株式会社 | Magnetic resonance imaging apparatus and image processing apparatus |
| US9987018B2 (en) | 2009-12-22 | 2018-06-05 | Cook Medical Technologies Llc | Medical devices with detachable pivotable jaws |
| US11733335B2 (en) | 2016-11-21 | 2023-08-22 | Siemens Healthcare Gmbh | Method for recording diagnostic measurement data of a head of an examination object in head imaging via a magnetic resonance device |
Families Citing this family (43)
| Publication number | Priority date | Publication date | Assignee | Title |
|---|---|---|---|---|
| US7944207B2 (en) * | 2005-06-14 | 2011-05-17 | Hitachi Medical Corporation | Magnetic resonance imaging apparatus and method |
| JP5562598B2 (en) * | 2008-10-24 | 2014-07-30 | 株式会社東芝 | Image display apparatus, image display method, and magnetic resonance imaging apparatus |
| CN102754125B (en) * | 2009-12-10 | 2016-05-25 | 皇家飞利浦电子股份有限公司 | The system of assessing for the quick accurate quantification of traumatic brain injury |
| JP5819300B2 (en) * | 2010-07-15 | 2015-11-24 | 株式会社日立メディコ | Medical image imaging apparatus and imaging slice determination method |
| JP5765899B2 (en) * | 2010-08-30 | 2015-08-19 | キヤノン株式会社 | Control apparatus and control method |
| US20120113146A1 (en) * | 2010-11-10 | 2012-05-10 | Patrick Michael Virtue | Methods, apparatus and articles of manufacture to combine segmentations of medical diagnostic images |
| JP5292440B2 (en) * | 2011-06-03 | 2013-09-18 | 富士フイルム株式会社 | Ultrasonic diagnostic equipment |
| JP5173053B2 (en) * | 2011-07-19 | 2013-03-27 | 株式会社東芝 | Image processing system, apparatus, method, and medical image diagnostic apparatus |
| US10049445B2 (en) * | 2011-07-29 | 2018-08-14 | Canon Kabushiki Kaisha | Image processing apparatus and image processing method of a three-dimensional medical image |
| WO2013191036A1 (en) | 2012-06-20 | 2013-12-27 | 株式会社 東芝 | Medical image processing device, magnetic resonance imaging device, medical image processing method, and magnetic resonance imaging method |
| DE102012222073B4 (en) * | 2012-12-03 | 2014-12-18 | Siemens Aktiengesellschaft | Method for evaluating image data sets and combination image recording device |
| CN104103083A (en) * | 2013-04-03 | 2014-10-15 | 株式会社东芝 | Image processing device, method and medical imaging device |
| WO2014184887A1 (en) * | 2013-05-15 | 2014-11-20 | 株式会社日立製作所 | Image diagnosis support system |
| CN103793908A (en) * | 2014-01-17 | 2014-05-14 | 首都医科大学 | Method for constructing prediction model of multifunctional veins based on brain nuclear magnetic resonance image |
| PL2933743T3 (en) * | 2014-04-18 | 2019-10-31 | Univ Rennes | Method of characterizing molecular diffusion within a body from a set of diffusion-weighted magnetic resonance signals and apparatus for carrying out such a method |
| JP6510189B2 (en) * | 2014-06-23 | 2019-05-08 | キヤノンメディカルシステムズ株式会社 | Medical image processing device |
| CN105989596B (en) * | 2015-02-12 | 2019-09-10 | 东芝医疗系统株式会社 | Medical image processing devices and method and MR imaging apparatus |
| JP6501647B2 (en) * | 2015-06-23 | 2019-04-17 | キヤノン株式会社 | IMAGE PROCESSING APPARATUS, CONTROL METHOD THEREOF, AND PROGRAM |
| JP6615603B2 (en) * | 2015-12-24 | 2019-12-04 | キヤノンメディカルシステムズ株式会社 | Medical image diagnostic apparatus and medical image diagnostic program |
| JP6745633B2 (en) * | 2016-04-13 | 2020-08-26 | キヤノン株式会社 | Image processing apparatus, image processing method, and program |
| JP2018000374A (en) * | 2016-06-29 | 2018-01-11 | ゼネラル・エレクトリック・カンパニイ | Image processor and program |
| JP2018143287A (en) * | 2017-03-01 | 2018-09-20 | 株式会社日立製作所 | Image display control apparatus, X-ray CT apparatus, and image display method |
| JP6885896B2 (en) * | 2017-04-10 | 2021-06-16 | 富士フイルム株式会社 | Automatic layout device and automatic layout method and automatic layout program |
| US10733730B2 (en) | 2017-06-19 | 2020-08-04 | Viz.ai Inc. | Method and system for computer-aided triage |
| WO2018236905A1 (en) | 2017-06-19 | 2018-12-27 | Viz.ai, Inc. | A method and system for computer-aided triage |
| EP3653106B1 (en) * | 2017-07-14 | 2025-07-09 | FUJIFILM Corporation | Medical image processing device, endoscope system, diagnosis assistance device, and medical operation assistance device |
| DE102017220697A1 (en) * | 2017-11-20 | 2019-05-23 | Siemens Healthcare Gmbh | Method for operating an MRI system and MRI system |
| EP3495832A1 (en) * | 2017-12-11 | 2019-06-12 | Koninklijke Philips N.V. | Diffusion mr imaging with fat suppression |
| EP4579590A1 (en) * | 2017-12-13 | 2025-07-02 | Washington University | System and method for determining segments for ablation |
| KR102107893B1 (en) * | 2018-02-14 | 2020-05-07 | 가톨릭대학교 산학협력단 | Medical image information reading apparatus and reading method |
| CN108414957A (en) * | 2018-03-06 | 2018-08-17 | 莒县人民医院 | A kind of real-time magnetic resonance image-forming data acquisition analysis method and system |
| JP7084193B2 (en) * | 2018-04-10 | 2022-06-14 | ザイオソフト株式会社 | Medical image processing equipment, medical image processing methods, and medical image processing programs |
| US11462318B2 (en) | 2019-06-27 | 2022-10-04 | Viz.ai Inc. | Method and system for computer-aided triage of stroke |
| WO2021021641A1 (en) * | 2019-07-30 | 2021-02-04 | Viz.ai Inc. | Method and system for computer-aided triage of stroke |
| CN111798410A (en) * | 2020-06-01 | 2020-10-20 | 深圳市第二人民医院(深圳市转化医学研究院) | Cancer cell pathological grading method, device, equipment and medium based on deep learning model |
| CN118285839A (en) * | 2020-06-17 | 2024-07-05 | 深圳迈瑞生物医疗电子股份有限公司 | Ultrasonic contrast imaging method and ultrasonic imaging device |
| IL300047A (en) | 2020-07-24 | 2023-03-01 | Viz Ai Inc | A method and system for the initial screening of an aneurysm using a computer |
| EP3985605A1 (en) * | 2020-10-15 | 2022-04-20 | Koninklijke Philips N.V. | Image segmentation methods and systems |
| US11694807B2 (en) | 2021-06-17 | 2023-07-04 | Viz.ai Inc. | Method and system for computer-aided decision guidance |
| CN114166849B (en) * | 2021-11-29 | 2022-12-20 | 广州海谷电子科技有限公司 | Method for detecting defects of printed carbon lines and moisture-sensitive film of humidity sensor |
| CN115170543A (en) * | 2022-07-26 | 2022-10-11 | 上海联影医疗科技股份有限公司 | Magnetic resonance image processing method, device, equipment and storage medium |
| JP2024157166A (en) * | 2023-04-25 | 2024-11-07 | キヤノンメディカルシステムズ株式会社 | Magnetic resonance imaging apparatus and magnetic resonance imaging method |
| JP7769261B1 (en) * | 2024-12-11 | 2025-11-13 | キヤノンマーケティングジャパン株式会社 | Information processing system, information processing method and program |
Citations (4)
| Publication number | Priority date | Publication date | Assignee | Title |
|---|---|---|---|---|
| US20020072672A1 (en) * | 2000-12-07 | 2002-06-13 | Roundhill David N. | Analysis of cardiac performance using ultrasonic diagnostic images |
| US20060058624A1 (en) * | 2004-08-30 | 2006-03-16 | Kabushiki Kaisha Toshiba | Medical image display apparatus |
| US20080086028A1 (en) * | 2005-04-08 | 2008-04-10 | Olympus Corporation | Image display apparatus |
| US20090240136A9 (en) * | 2001-10-04 | 2009-09-24 | Ying Sun | Contrast-invariant registration of cardiac and renal magnetic resonance perfusion images |
Family Cites Families (18)
| Publication number | Priority date | Publication date | Assignee | Title |
|---|---|---|---|---|
| JPS63317144A (en) * | 1987-06-22 | 1988-12-26 | Hitachi Ltd | Magnetic resonance image synthesizing system |
| JPH01291826A (en) * | 1988-05-20 | 1989-11-24 | Toshiba Corp | Imaging diagnostic device |
| JPH0876741A (en) * | 1994-09-02 | 1996-03-22 | Konica Corp | Image display device |
| JPH10305015A (en) * | 1997-05-09 | 1998-11-17 | Toshiba Iyou Syst Eng Kk | Image display method and apparatus using afterimage effect |
| JP3453085B2 (en) | 1998-07-23 | 2003-10-06 | ジーイー横河メディカルシステム株式会社 | X-ray CT system |
| JP4087517B2 (en) * | 1998-11-25 | 2008-05-21 | 株式会社日立製作所 | Region extraction method |
| JP2000172391A (en) * | 1998-12-09 | 2000-06-23 | Nec Corp | Pointing device, method for arranging selected frame and recording medium capable of executing method |
| JP2005028051A (en) * | 2003-07-11 | 2005-02-03 | Matsushita Electric Ind Co Ltd | Image display device and image display method |
| JP4891577B2 (en) * | 2004-08-30 | 2012-03-07 | 株式会社東芝 | Medical image display device |
| JP2007029248A (en) * | 2005-07-25 | 2007-02-08 | Hitachi Medical Corp | Comparative interpretation support apparatus and image processing program |
| WO2007052634A1 (en) * | 2005-11-02 | 2007-05-10 | Hitachi Medical Corporation | Image analyzing device and method |
| US8019142B2 (en) * | 2005-11-21 | 2011-09-13 | Agency For Science, Technology And Research | Superimposing brain atlas images and brain images with delineation of infarct and penumbra for stroke diagnosis |
| JP4936865B2 (en) * | 2006-01-06 | 2012-05-23 | 株式会社東芝 | Magnetic resonance imaging apparatus, coil system of magnetic resonance imaging apparatus, and received signal processing method in magnetic resonance imaging apparatus |
| JP4745080B2 (en) | 2006-02-20 | 2011-08-10 | 猛 中浦 | X-ray diagnostic apparatus, image processing apparatus, and program |
| FR2918868A1 (en) * | 2006-06-06 | 2009-01-23 | Guerbet Sa | METHOD OF DIAGNOSTIC IMAGING USING IN COMBINATION WITH WATER DIFFUSION IMAGING, CONTRAST AGENTS |
| US20080009707A1 (en) * | 2006-06-15 | 2008-01-10 | Theriault Richard H | Three-dimensional rendering of MRI results using automatic segmentation |
| US7355407B1 (en) * | 2006-12-03 | 2008-04-08 | Toshiba Medical Systems Corp. | Methods and apparatus for single-shot magnetic resonance imaging with optimized isotropic diffusion weighting |
| JP5562598B2 (en) * | 2008-10-24 | 2014-07-30 | 株式会社東芝 | Image display apparatus, image display method, and magnetic resonance imaging apparatus |
-
2009
- 2009-09-09 JP JP2009208519A patent/JP5562598B2/en active Active
- 2009-10-22 US US12/603,961 patent/US9706943B2/en active Active
- 2009-10-23 CN CN201210007869.XA patent/CN102525467B/en active Active
- 2009-10-23 CN CN200910207021A patent/CN101721211A/en active Pending
-
2012
- 2012-06-11 US US13/493,242 patent/US20120249498A1/en not_active Abandoned
Patent Citations (4)
| Publication number | Priority date | Publication date | Assignee | Title |
|---|---|---|---|---|
| US20020072672A1 (en) * | 2000-12-07 | 2002-06-13 | Roundhill David N. | Analysis of cardiac performance using ultrasonic diagnostic images |
| US20090240136A9 (en) * | 2001-10-04 | 2009-09-24 | Ying Sun | Contrast-invariant registration of cardiac and renal magnetic resonance perfusion images |
| US20060058624A1 (en) * | 2004-08-30 | 2006-03-16 | Kabushiki Kaisha Toshiba | Medical image display apparatus |
| US20080086028A1 (en) * | 2005-04-08 | 2008-04-10 | Olympus Corporation | Image display apparatus |
Cited By (7)
| Publication number | Priority date | Publication date | Assignee | Title |
|---|---|---|---|---|
| US9987018B2 (en) | 2009-12-22 | 2018-06-05 | Cook Medical Technologies Llc | Medical devices with detachable pivotable jaws |
| US10813650B2 (en) | 2009-12-22 | 2020-10-27 | Cook Medical Technologies Llc | Medical devices with detachable pivotable jaws |
| US20160239988A1 (en) * | 2015-02-12 | 2016-08-18 | Miriam Keil | Evaluation of a dynamic contrast medium distribution |
| US20170071497A1 (en) * | 2015-09-10 | 2017-03-16 | Toshiba Medical Systems Corporation | Magnetic resonance imaging apparatus and image processing apparatus |
| CN106510707A (en) * | 2015-09-10 | 2017-03-22 | 东芝医疗系统株式会社 | Magnetic resonance imaging apparatus and image processing apparatus |
| US10080508B2 (en) * | 2015-09-10 | 2018-09-25 | Toshiba Medical Systems Corporation | Magnetic resonance imaging apparatus and image processing apparatus |
| US11733335B2 (en) | 2016-11-21 | 2023-08-22 | Siemens Healthcare Gmbh | Method for recording diagnostic measurement data of a head of an examination object in head imaging via a magnetic resonance device |
Also Published As
| Publication number | Publication date |
|---|---|
| CN101721211A (en) | 2010-06-09 |
| US20100106002A1 (en) | 2010-04-29 |
| CN102525467B (en) | 2016-01-20 |
| CN102525467A (en) | 2012-07-04 |
| JP5562598B2 (en) | 2014-07-30 |
| US9706943B2 (en) | 2017-07-18 |
| JP2010119831A (en) | 2010-06-03 |
Similar Documents
| Publication | Publication Date | Title |
|---|---|---|
| US9706943B2 (en) | Image display apparatus, image display method, and magnetic resonance imaging apparatus | |
| US10307077B2 (en) | Medical image display apparatus | |
| US8571288B2 (en) | Image display apparatus and magnetic resonance imaging apparatus | |
| US11903745B2 (en) | Image processing apparatus | |
| CN102525466B (en) | Image processing apparatus and MR imaging apparatus | |
| US10672126B2 (en) | Image processing apparatus and magnetic resonance imaging apparatus | |
| US20190223750A1 (en) | Medical image diagnostic apparatus and medical image display apparatus for volume image correlations | |
| US8301225B2 (en) | Magnetic resonance imaging apparatus, image processing apparatus, and image processing method | |
| US20120283546A1 (en) | Automatic or Semi-Automatic Whole Body MR Scanning System | |
| JP2019005557A (en) | Image processing apparatus, magnetic resonance imaging apparatus, and image processing program | |
| CN104717920B (en) | Magnetic resonance imaging apparatus and magnetic resonance imaging method | |
| US10492687B2 (en) | Magnetic resonance imaging apparatus and image processing apparatus | |
| US8855382B2 (en) | MRI mammography with facilitated comparison to other mammography images | |
| US20080212863A1 (en) | Image processing apparatus, image processing method, and magnetic resonance imaging apparatus | |
| JP2011139799A (en) | Image processor and magnetic resonance imaging apparatus | |
| US10168852B2 (en) | Magnetic resonance imaging apparatus | |
| US20240090791A1 (en) | Anatomy Masking for MRI | |
| US20170071497A1 (en) | Magnetic resonance imaging apparatus and image processing apparatus | |
| US12171612B2 (en) | Imaging assisting apparatus and storage medium storing therein imaging assisting computer program | |
| US9629569B2 (en) | Magnetic resonance imaging apparatus and image generation method for guidance and positioning | |
| US10976397B2 (en) | MRI apparatus utilizing non-ultrashort TE(UTE) imaging to generate a mask image for performance of mask processing | |
| US20160089103A1 (en) | Systems and methods for optimized image acquisition with image-guided decision support | |
| JP6181381B2 (en) | Image analysis apparatus and magnetic resonance imaging apparatus | |
| JP2019146788A (en) | Magnetic resonance imaging apparatus | |
| JP7106292B2 (en) | Magnetic resonance imaging system |
Legal Events
| Date | Code | Title | Description |
|---|---|---|---|
| STCB | Information on status: application discontinuation |
Free format text: ABANDONED -- FAILURE TO RESPOND TO AN OFFICE ACTION |