US11860210B2 - Electrical phase identification using a clustering algorithm - Google Patents
Electrical phase identification using a clustering algorithm Download PDFInfo
- Publication number
- US11860210B2 US11860210B2 US17/732,505 US202217732505A US11860210B2 US 11860210 B2 US11860210 B2 US 11860210B2 US 202217732505 A US202217732505 A US 202217732505A US 11860210 B2 US11860210 B2 US 11860210B2
- Authority
- US
- United States
- Prior art keywords
- electricity
- electricity meters
- meter
- line
- kernels
- Prior art date
- Legal status (The legal status is an assumption and is not a legal conclusion. Google has not performed a legal analysis and makes no representation as to the accuracy of the status listed.)
- Active, expires
Links
Images


Classifications
-
- G—PHYSICS
- G01—MEASURING; TESTING
- G01R—MEASURING ELECTRIC VARIABLES; MEASURING MAGNETIC VARIABLES
- G01R22/00—Arrangements for measuring time integral of electric power or current, e.g. electricity meters
- G01R22/06—Arrangements for measuring time integral of electric power or current, e.g. electricity meters by electronic methods
- G01R22/10—Arrangements for measuring time integral of electric power or current, e.g. electricity meters by electronic methods using digital techniques
-
- G—PHYSICS
- G01—MEASURING; TESTING
- G01R—MEASURING ELECTRIC VARIABLES; MEASURING MAGNETIC VARIABLES
- G01R29/00—Arrangements for measuring or indicating electric quantities not covered by groups G01R19/00 - G01R27/00
- G01R29/18—Indicating phase sequence; Indicating synchronism
-
- G—PHYSICS
- G01—MEASURING; TESTING
- G01R—MEASURING ELECTRIC VARIABLES; MEASURING MAGNETIC VARIABLES
- G01R19/00—Arrangements for measuring currents or voltages or for indicating presence or sign thereof
- G01R19/25—Arrangements for measuring currents or voltages or for indicating presence or sign thereof using digital measurement techniques
- G01R19/2513—Arrangements for monitoring electric power systems, e.g. power lines or loads; Logging
-
- G—PHYSICS
- G01—MEASURING; TESTING
- G01R—MEASURING ELECTRIC VARIABLES; MEASURING MAGNETIC VARIABLES
- G01R22/00—Arrangements for measuring time integral of electric power or current, e.g. electricity meters
- G01R22/06—Arrangements for measuring time integral of electric power or current, e.g. electricity meters by electronic methods
- G01R22/061—Details of electronic electricity meters
- G01R22/063—Details of electronic electricity meters related to remote communication
-
- H—ELECTRICITY
- H02—GENERATION; CONVERSION OR DISTRIBUTION OF ELECTRIC POWER
- H02J—CIRCUIT ARRANGEMENTS OR SYSTEMS FOR SUPPLYING OR DISTRIBUTING ELECTRIC POWER; SYSTEMS FOR STORING ELECTRIC ENERGY
- H02J13/00—Circuit arrangements for providing remote indication of network conditions, e.g. an instantaneous record of the open or closed condition of each circuitbreaker in the network; Circuit arrangements for providing remote control of switching means in a power distribution network, e.g. switching in and out of current consumers by using a pulse code signal carried by the network
- H02J13/00032—Systems characterised by the controlled or operated power network elements or equipment, the power network elements or equipment not otherwise provided for
- H02J13/00034—Systems characterised by the controlled or operated power network elements or equipment, the power network elements or equipment not otherwise provided for the elements or equipment being or involving an electric power substation
-
- H02J13/333—
-
- H—ELECTRICITY
- H02—GENERATION; CONVERSION OR DISTRIBUTION OF ELECTRIC POWER
- H02J—CIRCUIT ARRANGEMENTS OR SYSTEMS FOR SUPPLYING OR DISTRIBUTING ELECTRIC POWER; SYSTEMS FOR STORING ELECTRIC ENERGY
- H02J3/00—Circuit arrangements for AC mains or AC distribution networks
- H02J3/12—Circuit arrangements for AC mains or AC distribution networks for adjusting voltage in AC networks by changing a characteristic of the network load
Definitions
- the present disclosure generally relates to the field of phase-balancing, and more specifically to methods, apparatus, and system for providing phase identification for electricity meters connected to an electrical grid.
- Phase-balancing such as balancing the electrical load on each of three electrical phases, in an electrical grid is an important consideration for utility providers. Phase-balancing may be complicated if electrical utility company records are incorrect, which frequently happens, for example, when linemen move a customer's connection, i.e., the customer's electricity meter, from one phase to another to better balance the load, but fail to record their actions and update the phase information of the customer's meter. Poorly balanced load reduces operational efficiency, and increases the likelihood of equipment failure and delays power outage management.
- An improved and/or correct understanding of the topology has many advantages for advanced metering infrastructure (AMI) having automated meter reading (AMR) and other features associated with smart electricity meters. Correct understanding of the phase of a meter can help to improve an understanding of the topology of the electrical grid.
- AMI advanced metering infrastructure
- AMR automated meter reading
- FIG. 1 illustrates an example power distribution environment.
- FIG. 2 illustrates a schematic diagram of an example transformer.
- FIG. 3 illustrates an example set of voltage graphs for various phases.
- FIGS. 4 A and 4 B illustrate an example process for identifying a phase at an electricity meter level.
- FIG. 5 illustrates an example detail process of one of the blocks of FIG. 4 .
- FIG. 6 illustrates an example detail process of another block of the blocks of FIG. 4 .
- FIG. 7 A illustrates an example display of the clusters of electricity meters.
- FIG. 7 B illustrates example display of a phase map of the electricity meters of FIG. 7 A .
- FIG. 8 illustrates an example block diagram of a system for identifying electrical phase.
- Electricity is generated in three phases, A, B, and C, and on each phase, voltage oscillates in a sine wave, for example, at 60 Hz.
- Each of three phases of electricity is transmitted on a separate power line and there may be a fourth line, N, a ground or neutral wire with no voltage on it. These lines interact with each other at transformers, or where power is consumed.
- FIG. 1 illustrates an example power distribution environment 100 .
- a power plant 102 generates electricity, which is carried by high voltage lines 104 to a power substation 106 .
- the power substation 106 provides electricity via a feeder 108 to a transformer 110 .
- the feeder 108 is a power line consisting of individual powered lines with phase A, B, and C servicing a plurality of premises connected via the transformer 110 and electricity meters 112 A, 112 B, and 112 C providing electricity to associated premises 114 A, 114 B, and 114 C.
- FIG. 2 illustrates a schematic diagram of an example transformer 200 , such as a distribution transformer.
- Transformers are used to adjust voltage, and can be wired between a powered line and the neutral line, in which case, an output phase corresponds to the phase of the powered line.
- the transformers can also be wired between two powered lines, in which case, an output phase differs from all three powered lines and may be referred as a hybrid phase. Therefore, there are six possible phases at the metering level: Phase A-N(or A), Phase B-N (or B), Phase C-N(or C), Phase A-B, Phase B-C, and Phase A-C.
- Phases A, B, and C are shown as on lines 202 , 204 , and 206 , respectively.
- a secondary winding 214 has three outputs, a first output 216 , a second output, or a center tap, 218 , and a third output 220 , which are connected to a line-a 222 , a neutral line 224 , and a line-b 226 , respectively.
- the transformer 200 in this example is a step-down transformer that reduces the voltage of the powered lines, in this case, Phases B 204 and C 206 , from 2400 V to 120 V between the line-a 222 and the neutral 224 and between the line-b 226 and the neutral 224 , and to 240 V between the line-a 222 and the line-b 226 .
- FIG. 3 illustrates an example set of voltage graphs 300 for various phases.
- Phase A 302 is set as a reference
- Phase B 304 is 120° ahead of Phase A 302
- Phase C 306 is 240° ahead of Phase A 302 .
- Each phase has a voltage of 120 V RMS and a frequency of 60 Hz.
- Phase A-B 308 , Phase B-C 310 , and Phase C-A 312 are also shown. As shown, depending on the phase, the voltage behaves differently in magnitude over time.
- Poor phase balancing such as overloading one phase, overloading equipment connected to a phase, or connecting to an incorrect phase, may cause operational inefficiency and equipment overheating, for example, increase in early equipment failure, delays in power outage response/management, and safety hazard.
- FIGS. 4 A and 4 B illustrate an example process 400 for identifying a phase at an electricity meter level.
- a feeder is a power line consisting of individual powered lines with phase A, B, and C servicing a plurality of premises connected via electricity meters.
- the distinct powered lines are presumed to experience different fluctuations in RMS voltage as a result of differing loads. Those fluctuations are expected be seen by all electricity meters connected to that line, and voltage readings on the same phase of the feeder are expected to be highly correlated compared to voltage readings on other phases. Accordingly, voltage readings collected from each electricity meter on the feeder over a preselected collection time period, such as from Jan. 1, 2020 to Dec. 31, 2020, may be entered as the voltage time series data.
- the voltage readings may be taken at a preselected interval, such as every five minutes with accuracy of ⁇ 0.15 V.
- AMI advanced metering infrastructure
- AMR automated meter reading
- the voltage time series data may be automatically transmitted from each electricity meter to, and collected by, a central office of the utility service provider or a third party.
- an existing meter-phase connectivity record which is the current record of information regarding each meter's connection to phase connections, may also be entered.
- the existing meter-phase connectivity record may not be up to date due to, for example, when linemen move a customer's electricity meter from one phase to another to better balance the load, but fail to record their actions and update the phase information of the customer's meter.
- the voltage time series data of each electricity meter for a preselected analysis period of the preselected collection time period is filtered to omit problematic data or electricity meter.
- expected average voltages may be 120 V, 208 V, 240 V, 277 V, and 480 V for the feeder, then values that are more than ⁇ 5% out of the expected average voltages may be omitted.
- Frozen periods identified as extended periods of time with constant voltage on a given meter, may be omitted.
- Jump outliers identified as large interval-to-interval voltage changes outside of a preselected threshold, may be omitted.
- Electricity meters with insufficient amount of data over the collection time period may be omitted. Electricity meters having location information inconsistent with actual geographical locations of the electricity meters may be omitted, or the location information may be corrected and the voltage time series data of those electricity meters with the corrected location information may be used.
- voltage correlation of every meter-to-meter combination is calculated.
- the voltage correlation may be calculated using Pearson correlation coefficient (PCC) to determine the correlation between voltage at meter A and voltage at meter B, that is, how a change in voltage at meter A affects a change in voltage at meter B.
- Pearson correlation coefficient, ⁇ has a value between ⁇ 1 and 1, and is given by, for the correlation between X and Y:
- three initial kernels, K 1 containing most of the electricity meters for Phases A, B, and C, is determined.
- an agglomerative cluster loop or method may be utilized to determine the three initial kernels. Examples of the agglomerative cluster method include analyses based on a single-linkage distance, Ward linkage distance, dendrogram step-through, and the like. Additionally, or alternatively, a Gaussian mixture model may be utilized to perform the clustering.
- a median first order difference voltage for each preselected interval is determined for each of the initial kernels.
- Correlation, PCC 1 K1 , PCC 2 K1 , and PCC 3 K1 , with each of the three initial kernel for each meter are calculated at block 412 .
- a hybrid index for the three initial kernels may be calculated based on a median of the correlations, PCC 1 K1 , PCC 2 K1 , and PCC 3 K1 .
- the hybrid index may be defined as the ratio of the second highest (median) correlation to the highest correlation,
- Hybrid ⁇ Index K ⁇ 1 median ⁇ ( PCC 1 K ⁇ 1 , PCC 2 K ⁇ 1 , PCC 3 K ⁇ 1 ) max ⁇ ( PCC 1 K ⁇ 1 , PCC 2 K ⁇ 1 , PCC 3 K ⁇ 1 ) .
- the hybrid index may also be defined, or calculated as:
- alt_Hybrid ⁇ Index K ⁇ 1 ⁇ [ - P ⁇ C ⁇ C 1 K ⁇ 1 + P ⁇ C ⁇ C 2 K ⁇ 1 ] 2 2 + [ P ⁇ C ⁇ C 1 K ⁇ 1 + P ⁇ C ⁇ C 2 K ⁇ 1 - 2 * P ⁇ C ⁇ C 3 K ⁇ 1 ] 2 6 ⁇ 1 / 2 .
- the hybrid index is used to separate out the line-to-line connections from the line-to-neutral connections as described later in more detail.
- new kernels for each phase, K 2 are determined at block 416 .
- the correlation between each of the electricity meters and the new kernels, PCC 1 K1 , PCC 2 K2 , and PCC 3 K2 are calculated at block 418 , and Hybrid Index K2 is calculated at block 420 .
- average correlation with each phase for the new kernels, K 2 , mean(PCC 1 K2 ), mean(PCC 2 K2 ), and mean(PCC 3 K2 ), and average hybrid index for K 2 , mean(Hybrid Index K 2 ), are calculated.
- the electricity meters are then clustered into three groups based on the average hybrid index for K 2 , mean(Hybrid Index K2 ) at block 424 .
- the three groups include a group with a high hybrid index, which is considered to be the line-to-line phase group, a group with low hybrid index, which is considered to be line-to-neutral phase group, and a group with in-between hybrid index values is used as a band separating the high and low hybrid index groups.
- the electricity meters of the high hybrid index group, X are grouped into three line-to-line phases, A-B, B-C, and C-A, based on the average correlation, mean(PCC 1 K2 ), mean(PCC 2 K2 ), and mean(PCC 3 K2 ).
- the agglomerative cluster method as described above may be utilized.
- the electricity meters of the low hybrid index group, Y are grouped into three line-to-neutral phases, A, B, and C, based on the phase having the highest average correlation, mean(PCC 1 K2 ), mean(PCC 2 K2 ), and mean(PCC 3 K2 ) with the meter.
- the three line-to-line groups of electricity meters and the three line-to-neutral groups of electricity meters are combined as new kernels, K 3 , having six phases, A, B, C, A-B, B-C, and C-A, at block 430 .
- the filtered data from block 404 is used to calculate correlation of each electricity meter with each of the six kernels of K 3 , PCC 1 K3 , PCC 2 K3 , PCC 3 K3 , PCC 4 K3 , PCC 5 K3 , and PCC 6 K3 , and hybrid index based on the correlation with line-to-neutral kernels, PCC 1 K3 , PCC 2 K3 , and PCC 3 K3 , is calculated at block 434 .
- an average hybrid index, mean(Hybrid Index K3 ) is calculated.
- the electricity meters are grouped into two groups, a line-to-line group and a line-to-neutral group at block 440 .
- the agglomerative cluster method described above may be utilized to group electricity meters with a high average hybrid index into the line-to-line group and electricity meters with a low average hybrid index into the line-to-neutral group.
- a predicted phase is assigned to each meter based on the highest correlation at block 442 .
- the predicted phase may then be output for comparison with the existing meter-phase connectivity record.
- FIG. 5 illustrates an example detail process of block 408 of FIG. 4 .
- three largest clusters of electricity meters are determined. For all possible number of clusters from three to the number of meters in the sample, the largest three clusters, from large to small, L 1 , L 2 , and L 3 are determined. At block 504 , a ratio of the third largest cluster size to the largest cluster size,
- R 1 ⁇ to ⁇ 3 size L ⁇ 3 size L ⁇ 1 , is calculated.
- min N Clusters the lowest possible number of clusters, such that R 1to3 is greater than a preselected criteria, is determined, which ensures that the three initial kernels obtained are not too imbalanced. For example, for the preselected criteria of 0.5, the largest cluster is no larger than twice the size of the smallest cluster.
- the agglomerative cluster method may be utilized to group the electricity meters into the min N Clusters calculated in block 506 .
- the three largest clusters are selected as the three initial kernels, and the process proceeds to block 410 .
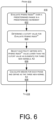
- FIG. 6 illustrates an example detail process of block 416 of FIG. 4 .
- a predetermined range, for example from 0.75 to 0.85, of Hybrid Index K1 is evaluated in a predetermined increment, for example, 0.01, and a cutoff value of Hybrid Index K1 is determined at block 604 .
- the cutoff value of Hybrid Index K1 may be defined as a value of Hybrid Index K1 below which there exist a first sufficient number of electricity meters for each phase and, above which there exist a second sufficient number of electricity meters, where the first and second sufficient numbers may be preselected.
- electricity meters with Hybrid Index K1 value lower than the cutoff value are selected as the elements for three new kernels, K 2 , and median of each phase is calculated and defined as three new kernels, K 2 , at block 608 .
- the process then proceeds to block 418 .
- FIG. 7 A illustrates an example display 700 of the clusters of electricity meters.
- Clusters of electricity meters may be displayed when each meter is plotted in 3D coordinates based on its correlation to phases A, B and C.
- the display 700 is a 2D view of the 3D plot viewed from the point (1,1,1) facing the origin (0,0,0) as shown by a graphical representation 702 .
- FIG. 7 B illustrates an example display 704 of phases of the electricity meters of FIG. 7 A plotted over the locations of the electricity meters on a map.
- FIG. 8 illustrates an example block diagram of a system 800 for identifying electrical phase.
- the system 800 may comprise one or more processors (processors) 802 communicatively coupled to memory 804 .
- the processors 802 may include one or more central processing units (CPUs), graphics processing units (GPUs), both CPUs and GPUs, or other processing units or components known in the art.
- the processors 802 may execute computer-executable instructions stored in the memory 804 to perform functions or operations, with one or more of components communicatively coupled to the one or more processors 802 and the memory 804 , as described above with reference to FIGS. 4 - 7 .
- the memory 804 may store a phase analysis application 806 that is executed for analyzing the phases as described above with reference to FIGS. 4 - 7 .
- the memory 804 may be volatile, such as RAM, non-volatile, such as ROM, flash memory, miniature hard drive, memory card, and the like, or some combination thereof.
- the memory 804 may store computer-executable instructions that are executable by the processors 802 .
- the components of the system 800 coupled to the processors 802 and the memory 804 may comprise a user interface (UI) 806 , including a display 808 , and a communication module 810 .
- the communication module 810 may communicate with a plurality of electricity meters 812 to receive the voltage time series data collected as discussed above with reference to FIGS. 4 - 6 , as indicated by an arrow 814 .
- the electricity meters 812 may communicate with a central office 816 of the utility provider, or a third party, as shown by an arrow 818 , and the central office 816 may collect the voltage time series data.
- the central office 816 may communicate the collected voltage time series data to the communication module 810 as shown by an arrow 820 .
- communications 814 , 818 , and 820 between the communication module 810 and the electricity meters 812 , the electricity meters 812 and the central office 816 , and the central office 816 and the communication module 810 , respectively, are shown as wireless communications, the communications 814 , 818 , and 820 may be established in various ways, such as via a cellular network, Wi-Fi network, cable network, landline telephone network, and the like.
- each of the electricity meters 812 may comprise one or more processors, memory coupled to the processors, a metrology module coupled to the processors, and a communication module coupled to the processors.
- the processors may include one or more central processing units (CPUs), graphics processing units (GPUs), both CPUs and GPUs, or other processing units or components known in the art.
- the processors may execute computer-executable instructions stored in the memory to perform functions or operations with one or more of components communicatively coupled to the one or more processors and the memory, such as measuring the voltage and storing voltage time series data in the memory or transmitting to the central office 816 or to the communication module 810 of the system 800 .
- the memory may be volatile, such as RAM, non-volatile, such as ROM, flash memory, miniature hard drive, memory card, and the like, or some combination thereof.
- the memory may store computer-executable instructions that are executable by the processors.
- the electricity meter 812 may receive instructions from the central office 816 regarding the preselected collection time period and the preselected interval, for example, changing the collection time period to two years and the interval to two minutes.
- Computer-readable medium includes routines, applications, application modules, program modules, programs, components, data structures, algorithms, and the like.
- Computer-readable and -executable instructions can be implemented on various system configurations, including single-processor or multiprocessor systems, minicomputers, mainframe computers, personal computers, hand-held computing devices, microprocessor-based, programmable consumer electronics, combinations thereof, and the like.
- the computer-readable storage media may include volatile memory (such as random-access memory (RAM)) and/or non-volatile memory (such as read-only memory (ROM), flash memory, etc.).
- volatile memory such as random-access memory (RAM)
- non-volatile memory such as read-only memory (ROM), flash memory, etc.
- the computer-readable storage media may also include additional removable storage and/or non-removable storage including, but not limited to, flash memory, magnetic storage, optical storage, and/or tape storage that may provide non-volatile storage of computer-readable instructions, data structures, program modules, and the like.
- a non-transitory computer-readable storage medium is an example of computer-readable media.
- Computer-readable media includes at least two types of computer-readable media, namely computer-readable storage media and communications media.
- Computer-readable storage media includes volatile and non-volatile, removable and non-removable media implemented in any process or technology for storage of information such as computer-readable instructions, data structures, program modules, or other data.
- Computer-readable storage media includes, but is not limited to, phase change memory (PRAM), static random-access memory (SRAM), dynamic random-access memory (DRAM), other types of random-access memory (RAM), read-only memory (ROM), electrically erasable programmable read-only memory (EEPROM), flash memory or other memory technology, compact disk read-only memory (CD-ROM), digital versatile disks (DVD) or other optical storage, magnetic cassettes, magnetic tape, magnetic disk storage or other magnetic storage devices, or any other non-transmission medium that can be used to store information for access by a computing device.
- communication media may embody computer-readable instructions, data structures, program modules, or other data in a modulated data signal, such as a carrier wave, or other transmission mechanism. As defined herein, computer-readable storage media do not include signals such as communication media.
- the computer-readable instructions stored on one or more non-transitory computer-readable storage media when executed by one or more processors, may perform operations described above with reference to FIGS. 4 - 7 .
- computer-readable instructions include routines, programs, objects, components, data structures, and the like that perform particular functions or implement particular abstract data types.
- the order in which the operations are described is not intended to be construed as a limitation, and any number of the described operations can be combined in any order and/or in parallel to implement the processes.
Landscapes
- Engineering & Computer Science (AREA)
- Power Engineering (AREA)
- Physics & Mathematics (AREA)
- General Physics & Mathematics (AREA)
- Remote Monitoring And Control Of Power-Distribution Networks (AREA)
- Measurement Of Current Or Voltage (AREA)
Abstract
Description
where:
-
- cov is the covariance,
- σX is the standard deviation of X, and
- σY is the standard deviation of Y.
- PCC may be calculated for every meter-to-meter pairing, and the results may be stored in a matrix.
Alternatively, the hybrid index may also be defined, or calculated as:
The hybrid index is used to separate out the line-to-line connections from the line-to-neutral connections as described later in more detail. Based on the Hybrid IndexK1, new kernels for each phase, K2, are determined at
is calculated. At block 506, the lowest possible number of clusters, min NClusters, such that R1to3 is greater than a preselected criteria, is determined, which ensures that the three initial kernels obtained are not too imbalanced. For example, for the preselected criteria of 0.5, the largest cluster is no larger than twice the size of the smallest cluster. At block 508, the agglomerative cluster method may be utilized to group the electricity meters into the min NClusters calculated in block 506. At
Claims (20)
Priority Applications (5)
| Application Number | Priority Date | Filing Date | Title |
|---|---|---|---|
| US17/732,505 US11860210B2 (en) | 2021-09-20 | 2022-04-28 | Electrical phase identification using a clustering algorithm |
| EP22747539.9A EP4405691B1 (en) | 2021-09-20 | 2022-07-05 | Electrical phase identification using a clustering algorithm |
| AU2022344934A AU2022344934A1 (en) | 2021-09-20 | 2022-07-05 | Electrical phase identification using a clustering algorithm |
| PCT/US2022/036137 WO2023043522A1 (en) | 2021-09-20 | 2022-07-05 | Electrical phase identification using a clustering algorithm |
| CA3229840A CA3229840A1 (en) | 2021-09-20 | 2022-07-05 | Electrical phase identification using a clustering algorithm |
Applications Claiming Priority (2)
| Application Number | Priority Date | Filing Date | Title |
|---|---|---|---|
| US202163246269P | 2021-09-20 | 2021-09-20 | |
| US17/732,505 US11860210B2 (en) | 2021-09-20 | 2022-04-28 | Electrical phase identification using a clustering algorithm |
Publications (2)
| Publication Number | Publication Date |
|---|---|
| US20230100242A1 US20230100242A1 (en) | 2023-03-30 |
| US11860210B2 true US11860210B2 (en) | 2024-01-02 |
Family
ID=82701701
Family Applications (1)
| Application Number | Title | Priority Date | Filing Date |
|---|---|---|---|
| US17/732,505 Active 2042-04-28 US11860210B2 (en) | 2021-09-20 | 2022-04-28 | Electrical phase identification using a clustering algorithm |
Country Status (5)
| Country | Link |
|---|---|
| US (1) | US11860210B2 (en) |
| EP (1) | EP4405691B1 (en) |
| AU (1) | AU2022344934A1 (en) |
| CA (1) | CA3229840A1 (en) |
| WO (1) | WO2023043522A1 (en) |
Families Citing this family (2)
| Publication number | Priority date | Publication date | Assignee | Title |
|---|---|---|---|---|
| CN116506287B (en) * | 2023-06-27 | 2023-09-12 | 北京智芯微电子科技有限公司 | Identification method, system and equipment for ammeter in same meter box |
| CN120373795B (en) * | 2025-06-23 | 2025-09-05 | 南京新联电子股份有限公司 | Data acquisition modeling method for electricity consumption information acquisition |
Citations (5)
| Publication number | Priority date | Publication date | Assignee | Title |
|---|---|---|---|---|
| US20190041436A1 (en) | 2017-08-07 | 2019-02-07 | Landis+Gyr Innovations, Inc. | Determining meter phase using interval voltage measurements |
| US20200150309A1 (en) * | 2018-11-09 | 2020-05-14 | Itron, Inc. | Techniques for geolocation and cloud detection with voltage data from solar homes |
| US20210265839A1 (en) | 2020-02-25 | 2021-08-26 | Landis+Gyr Innovations, Inc. | Automatic discovery of electrical supply network topology and phase |
| US20210351614A1 (en) * | 2020-05-07 | 2021-11-11 | Itron, Inc. | Detecting hot socket conditions in utility electricity meters |
| US11258855B2 (en) * | 2014-10-17 | 2022-02-22 | Florida Power & Light Company | System and method for analyzing and monitoring smart meter network communications |
-
2022
- 2022-04-28 US US17/732,505 patent/US11860210B2/en active Active
- 2022-07-05 WO PCT/US2022/036137 patent/WO2023043522A1/en not_active Ceased
- 2022-07-05 CA CA3229840A patent/CA3229840A1/en active Pending
- 2022-07-05 EP EP22747539.9A patent/EP4405691B1/en active Active
- 2022-07-05 AU AU2022344934A patent/AU2022344934A1/en active Pending
Patent Citations (5)
| Publication number | Priority date | Publication date | Assignee | Title |
|---|---|---|---|---|
| US11258855B2 (en) * | 2014-10-17 | 2022-02-22 | Florida Power & Light Company | System and method for analyzing and monitoring smart meter network communications |
| US20190041436A1 (en) | 2017-08-07 | 2019-02-07 | Landis+Gyr Innovations, Inc. | Determining meter phase using interval voltage measurements |
| US20200150309A1 (en) * | 2018-11-09 | 2020-05-14 | Itron, Inc. | Techniques for geolocation and cloud detection with voltage data from solar homes |
| US20210265839A1 (en) | 2020-02-25 | 2021-08-26 | Landis+Gyr Innovations, Inc. | Automatic discovery of electrical supply network topology and phase |
| US20210351614A1 (en) * | 2020-05-07 | 2021-11-11 | Itron, Inc. | Detecting hot socket conditions in utility electricity meters |
Non-Patent Citations (3)
| Title |
|---|
| Hosseini Zohreh Set al: "Machine Learning-Enabled Distribution Network Phase Identification", IEEE Transactions on Power Systems, IEEE, USA, vo1. 36, No. 2, Jul. 22, 2020 (Jul. 22, 2020), pp. 842-850, XP011839326, ISSN: 0885-8950, DOI: 10.1109/TPWRS.2020.3011133 [retrieved on Feb. 18, 2021] the whole document. |
| The PCT Search Report and Written Opinion dated Nov. 2, 2022 for PCT application No. PCT/US2022/036137, 13 pages. |
| Therrien Francis et al: "Assessment of Measurement-Based Phase Identification Methods", IEEE Open Access Journal of Power and Energy, IEEE, vol. 8, Mar. 22, 2021 (Mar. 22, 2021), pp. 128-137, XP011846957, DOI: 10.1109/OAJPE.2021.3067632 [retrieved on Mar. 29, 2021] the whole document. |
Also Published As
| Publication number | Publication date |
|---|---|
| EP4405691B1 (en) | 2025-10-22 |
| EP4405691A1 (en) | 2024-07-31 |
| AU2022344934A1 (en) | 2024-03-14 |
| US20230100242A1 (en) | 2023-03-30 |
| WO2023043522A1 (en) | 2023-03-23 |
| CA3229840A1 (en) | 2023-03-23 |
Similar Documents
| Publication | Publication Date | Title |
|---|---|---|
| Miraftabzadeh et al. | K-means and alternative clustering methods in modern power systems | |
| CN113267692B (en) | Low-voltage transformer area line loss intelligent diagnosis and analysis method and system | |
| Tastu et al. | Probabilistic forecasts of wind power generation accounting for geographically dispersed information | |
| US9292794B2 (en) | Voltage-based clustering to infer connectivity information in smart grids | |
| Cicilio et al. | Resilience in an evolving electrical grid | |
| US9043174B2 (en) | Estimating loss rates of links in smart grids | |
| US10312681B2 (en) | Automatic network device electrical phase identification | |
| US11860210B2 (en) | Electrical phase identification using a clustering algorithm | |
| Chanda et al. | Quantifying resiliency of smart power distribution systems with distributed energy resources | |
| US9841456B2 (en) | Electric outage detection and localization | |
| KR20150056583A (en) | Methods and systems for estimating recoverable utility revenue | |
| US20150149396A1 (en) | Non-technical loss detection and localization | |
| CN110348674A (en) | A kind of power grid risk assessment method, system and computer readable storage medium | |
| JP4203993B2 (en) | Power system analysis support method | |
| Blaauwbroek et al. | Distribution network monitoring: Interaction between EU legal conditions and state estimation accuracy | |
| CN112198375A (en) | Phase identification method, device, device and storage medium for single-phase users | |
| JP6135454B2 (en) | Estimation program, estimation apparatus, and estimation method | |
| Shin et al. | Spatiotemporal load-analysis model for electric power distribution facilities using consumer meter-reading data | |
| US20240235197A1 (en) | Meter-to-transformer connectivity | |
| US20240388100A1 (en) | Automatic detection of grid-connected distributed energy resources | |
| Arya et al. | Voltage analytics to infer customer phase | |
| Sănduleac et al. | Power networks observability, control and automation using Unbundled Smart Meters | |
| Wu et al. | Survey on negative line loss rate of transformer region: Rectification measures and challenges | |
| US12212140B2 (en) | System and method for determining a local conservative voltage reduction CVR factor | |
| Abubakar | Sizing of battery energy storage systems in isolated photovoltaic plants using predicted solar radiation data |
Legal Events
| Date | Code | Title | Description |
|---|---|---|---|
| FEPP | Fee payment procedure |
Free format text: ENTITY STATUS SET TO UNDISCOUNTED (ORIGINAL EVENT CODE: BIG.); ENTITY STATUS OF PATENT OWNER: LARGE ENTITY |
|
| STPP | Information on status: patent application and granting procedure in general |
Free format text: DOCKETED NEW CASE - READY FOR EXAMINATION |
|
| STPP | Information on status: patent application and granting procedure in general |
Free format text: NOTICE OF ALLOWANCE MAILED -- APPLICATION RECEIVED IN OFFICE OF PUBLICATIONS |
|
| STPP | Information on status: patent application and granting procedure in general |
Free format text: AWAITING TC RESP., ISSUE FEE NOT PAID |
|
| STPP | Information on status: patent application and granting procedure in general |
Free format text: NOTICE OF ALLOWANCE MAILED -- APPLICATION RECEIVED IN OFFICE OF PUBLICATIONS |
|
| AS | Assignment |
Owner name: ITRON, INC., WASHINGTON Free format text: ASSIGNMENT OF ASSIGNORS INTEREST;ASSIGNORS:DU, YINGJUAN;STELLARUM, BRENDAN;REEL/FRAME:064992/0212 Effective date: 20220428 |
|
| STPP | Information on status: patent application and granting procedure in general |
Free format text: PUBLICATIONS -- ISSUE FEE PAYMENT RECEIVED |
|
| STPP | Information on status: patent application and granting procedure in general |
Free format text: PUBLICATIONS -- ISSUE FEE PAYMENT VERIFIED |
|
| STCF | Information on status: patent grant |
Free format text: PATENTED CASE |
|
| AS | Assignment |
Owner name: WELLS FARGO BANK, NATIONAL ASSOCIATION, NORTH CAROLINA Free format text: SECURITY INTEREST;ASSIGNOR:ITRON, INC.;REEL/FRAME:072870/0873 Effective date: 20250912 |