US11800373B2 - System and method for 3D propagation modelling for planning of a radio network - Google Patents
System and method for 3D propagation modelling for planning of a radio network Download PDFInfo
- Publication number
- US11800373B2 US11800373B2 US17/816,917 US202217816917A US11800373B2 US 11800373 B2 US11800373 B2 US 11800373B2 US 202217816917 A US202217816917 A US 202217816917A US 11800373 B2 US11800373 B2 US 11800373B2
- Authority
- US
- United States
- Prior art keywords
- network
- parameters
- radio network
- propagation
- sites
- Prior art date
- Legal status (The legal status is an assumption and is not a legal conclusion. Google has not performed a legal analysis and makes no representation as to the accuracy of the status listed.)
- Active
Links
Images


Classifications
-
- H—ELECTRICITY
- H04—ELECTRIC COMMUNICATION TECHNIQUE
- H04W—WIRELESS COMMUNICATION NETWORKS
- H04W16/00—Network planning, e.g. coverage or traffic planning tools; Network deployment, e.g. resource partitioning or cells structures
- H04W16/18—Network planning tools
-
- H—ELECTRICITY
- H04—ELECTRIC COMMUNICATION TECHNIQUE
- H04W—WIRELESS COMMUNICATION NETWORKS
- H04W24/00—Supervisory, monitoring or testing arrangements
- H04W24/08—Testing, supervising or monitoring using real traffic
Definitions
- the present invention relates generally to wireless network, and more particularly, to 3D propagation modelling for planning of a radio network.
- E-UTRA Evolved Universal Terrestrial Radio Access
- LTE Long Term Evolution
- the UMTS which is the successor to Global System for Mobile Communications (GSM) technologies, currently supports various air interface standards, such as Wideband-Code Division Multiple Access (W-CDMA), Time Division-Code Division Multiple Access (TD-CDMA), and Time Division-Synchronous Code Division Multiple Access (TD-SCDMA).
- W-CDMA Wideband-Code Division Multiple Access
- TD-CDMA Time Division-Code Division Multiple Access
- TD-SCDMA Time Division-Synchronous Code Division Multiple Access
- the UMTS also supports enhanced 3G data communications protocols, such as High-Speed Packet Access (HSPA), which provides higher data transfer speeds and capacity to associated UMTS networks. With the capacity and higher data transfer speeds, there are many problems associated with the cells and the optimization of the cells.
- HSPA High-Speed Packet Access
- the Radio Frequency (RF) characteristics define the area of coverage for a cell tower.
- a sector is a geographical area, having a distinct size and shape, covered by a single antenna.
- a service provider may use several antennas to provide 360 degrees of RF coverage for a cell.
- a service provider may use one cell tower to provide wireless communication services to subscribers for a few tens of meters radius in urban settings, while for a rural area, the service provider may use one cell tower for an area of several square miles.
- every service operator needs a complete view of the network and the ability to accurately analyze different deployment scenarios.
- the accuracy of RF Planning has a direct impact on how the network scenario can be optimized in order to maximize network capacity, coverage and network performance.
- the calibration of RF planning is often required when deploying in new frequency bands and new geographical areas.
- the RF planning is a multi-step process and iterative in nature and is a very vital step for a wireless communication technology and is carried out manually by changing physical parameters of a site, as per the conventional approach.
- LTE radio network planning also works just like other cellular technologies. Whenever new cellular technology is considered for mass deployment, many RF parameters are subjected to a tuning process with a view to find out an optimum value. However, this phase is time-consuming and is expensive. Therefore, before commercial deployment, if an extensive simulation is carried out, then the tuning phase can be facilitated in numerous ways. Hence, running simulation before mass commercial deployment minimizes the cost with a greater extent. Clearly, optimizing vital parameters in a least possible time is a challenging issue for network operators.
- the RF planning tool based prediction is an essential requirement in the process of network planning.
- the conventional techniques for modeling RF propagation are based on either empirical measurements or ray-tracing methods.
- Empirical methods for example, are based solely on extensive measurements made in generic settings at different sites, and are therefore dependent on the site locations, the measurement methods, measurement frequencies, and the like.
- the signal strength is measured at a number of different locations and at different heights, with different empirical models used for different generic propagation problems, e.g. for rural, suburban, and urban propagation environments.
- there is no consideration of details of the propagation environment e.g. actual building and street locations and configurations. Therefore, while empirical methods can predict order-of-magnitude of average propagation loss, they cannot predict fine details about the propagation channel like dead zones and multipath interference.
- empirical methods are based on statistics regarding experiments without sufficient underlying logic to enable generalization to environments other than those in which the experiments were conducted.
- the method of ray-tracing is a deterministic method which is based on geometrical optics and the uniform theory of diffraction (UTD) and can be used to calculate propagation mechanisms such as the direct (LOS), reflected, transmitted, diffracted, and some combined rays.
- the ray-tracing method is not based on extensive measurements, but rather relies on site-specific information such as actual geometric and structural information of the building, e.g. the façade structure and geometry.
- the basic procedure of the ray-tracing method is the shooting-and-bouncing ray (SBR) algorithm involving three basic processes, with the first process launching a ray. The second process is determining if the ray hits an object in what is known as the ray-object intersection test. Moreover, the third is determining whether a ray is received at a receiver location.
- SBR shooting-and-bouncing ray
- the 2D propagation models such as Standard Propagation Model (SPM) are widely used in RF planning; but are less accurate because of non-consideration of high-resolution clutter map, actual building height and multipath effects in simulation.
- SPM Standard Propagation Model
- Standard Propagation Model is one of the most popular 2D propagation model. It is represented by (1).
- L model K 1 +K 2 ⁇ log 10 ( d )+ K 3 ⁇ log 10 ( H Txeff )+ K 4 ⁇ DiffractionLoss+ K 5 ⁇ log 10 ( d ) ⁇ log 10 ( H Txeff )+ K 6 ⁇ ( H Rxeff )+ K clutter ⁇ f (clutter) (1)
- DTM Digital Terrain Map
- Raster layer comprises the details of various clutters like dense urban, medium urban, suburban, rural, low vegetation, dense vegetation, water bodies, open area etc. with mean clutter height.
- the resolution of the raster layer could be in between 5-100m. This impacts highly on the accuracy of the prediction performance.
- one of the drawbacks with 2D propagation model is a separate model requirement for each morphology.
- Dense urban, medium urban, suburban and rural etc. require separately tuned 2D propagation models.
- SPM based predictions can only provide an idea of the received signal.
- SPM based predictions may only provide a rough estimate of the received signal around the base station, as coverage is highly impacted by surrounding obstacles.
- Embodiments of the present disclosure may relate to a method of 3D propagation modelling for the planning of a radio network.
- the method includes collecting, by a processor, one or more first network parameters of a radio network across one or more radio network sites in a first geographical region, wherein the one or more first network parameters are collected from a Radio Frequency (RF) scanner and from at least one user equipment (UE) simultaneously.
- the method further includes performing, by the processor, a prediction analysis for planning of the network across the one or more radio network sites, wherein the prediction analysis is performed by using a Continuous-Wave (CW) based 3D propagation model with the collected one or more first network parameters, wherein based on the prediction analyses, one or more second network parameters for each of the one or more radio network sites are generated.
- RF Radio Frequency
- UE user equipment
- the method includes optimizing, by the processor, the 3D propagation model used for the planning of the radio network in the first geographical region, by tuning one or more propagation path loss parameters of the 3D propagation model to compensate for propagation path losses associated with a Line-of-sight (LOS) transmission and a Non-line-of-sight (NLOS) transmission in the radio network, the tuning being performed based on a comparison of the generated one or more second network parameters with the at least one Key Point Indicator (KPI) of the 3D propagation model.
- KPI Key Point Indicator
- the embodiments of the present disclosure may relate to a network entity for 3D propagation modelling for the planning of a radio network.
- the network entity includes a processor configured to collect one or more first network parameters of a radio network across one or more radio network sites in a first geographical region, wherein the one or more first network parameters are collected from a Radio Frequency (RF) scanner and from at least one user equipment (UE) simultaneously.
- the processor is configured to perform a prediction analysis for planning of the network across the one or more radio network sites, wherein the prediction analysis is performed by using a Continuous-Wave (CW) based 3D propagation model with the collected one or more first network parameters, wherein based on the prediction analysis, one or more second network parameters for each of the one or more radio network sites are generated.
- CW Continuous-Wave
- the processor is configured to optimize the 3D propagation model used for the planning of the radio network in the first geographical region, by tuning one or more propagation path loss parameters of the 3D propagation model to compensate for propagation path losses associated with a Line-of-sight (LOS) transmission and a Non-line-of-sight (NLOS) transmission in the radio network, the tuning being performed based on a comparison of the generated one or more second network parameters with the at least one Key Point Indicator (KPI) of the 3D propagation model.
- KPI Key Point Indicator
- FIG. 1 is a diagram of exemplary components of a network entity, in accordance with an embodiment of the present invention.
- FIG. 2 is a simplified flow diagram of a method of 3D propagation modelling for the planning of a radio network, in accordance with an embodiment of the present invention.
- FIG. 3 is a simplified flow diagram illustrating the step [ 204 ] of FIG. 2 in detail.
- FIG. 4 is a simplified flow diagram illustrating the step [ 206 ] of FIG. 2 in detail.
- FIG. 5 is a simplified flow diagram illustrating the step [ 208 ] of FIG. 2 in detail.
- FIG. 6 is a simplified flow diagram illustrating obtaining of 3D propagation models of remaining geographies from a 3D propagation model of a first geography, in accordance with an embodiment of the present invention.
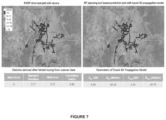
- FIG. 7 illustrates the prediction and measurement sample correlation along with 3D propagation model parameters for Aurangabad city based on the implementation of the present invention.
- FIG. 8 illustrates the prediction and measurement sample correlation along with 3D propagation model parameters for Kochi city based on the implementation of the present invention.
- FIG. 9 illustrates the prediction and measurement sample correlation along with 3D propagation model parameters for Jaipur city based on the implementation of the present invention.
- FIG. 10 illustrates prediction and measurement sample correlation along with 3D propagation model parameters for Dehradun city based on the implementation of the present invention.
- FIG. 11 illustrates the prediction and measurement sample correlation along with 3D propagation model parameters for Lucknow city based on the implementation of the present invention.
- the present invention provides a system and method for 3D propagation modelling wherein automatic tuning of propagation path loss parameters of a Continuous Wave (CW) based 3D propagation model for LOS (line of sight) and NLOS (non-line of sight) radio transmissions in a first geographical area, is performed. Further, in the present invention, 3D propagation models for remaining geographies having similar geographical area and clutter types as the first geographical area, are generated without performing any drive test while compensating the propagation path loss parameters of the generated model using periodically measured user equipment (UE) data. The generated 3D models may be updated dynamically as the 3D models are developed based on UE data updated from time to time.
- UE user equipment
- FIG. 1 illustrates a diagram of exemplary components of a network entity [ 100 ].
- the network entity [ 100 ] may include antennas [ 110 ], transceivers (TX/RX) [ 120 ], a processing system [ 130 ], and an interface (I/F) [ 140 ].
- the antennas [ 110 ] may include one or more directional and/or omnidirectional antennas.
- Transceivers [ 120 ] may be associated with the antennas [ 110 ] and may include transceiver circuitry for transmitting and/or receiving symbol sequences in a network, such as a wireless network, via antennas [ 110 ].
- the processing system [ 130 ] may control an operation of the network entity [ 100 ].
- the processing system [ 130 ] may also process information received via the transceivers [ 120 ] and/or the interface [ 140 ].
- the processing system [ 130 ] may include a processor [ 132 ] and a memory [ 134 ].
- the processor [ 132 ] may include one or more processors, microprocessors, application specific integrated circuits (ASICs), field programmable gate arrays (FPGAs), and the like.
- the processor [ 132 ] may process information received via transceivers [ 120 ] and/or interface [ 140 ].
- the processor [ 132 ] may transmit control messages and/or data messages and may cause those control messages and/or data messages to be transmitted via transceivers [ 120 ] and/or interface [ 140 ].
- the processor [ 132 ] may also process control messages and/or data messages received from transceivers [ 120 ] and/or interface [ 140 ].
- the memory [ 134 ] may include a random access memory (RAM), a read-only memory (ROM), and/or another type of memory to store data and instructions that may be used by the processor [ 132 ].
- the interface [ 140 ] may include one or more circuitries, such as line cards that allow the network entity to transmit data to and receive data from another network entity.
- the interface [ 140 ] may include I/O interfaces through which the network entity [ 100 ] may receive user inputs and/or data from a user.
- the network entity [ 100 ] may perform certain operations in response to the processor [ 132 ] executing software instructions of an application contained in a computer-readable medium, such as memory [ 134 ].
- a computer-readable medium may be defined as a physical or logical memory device.
- a logical memory device may include memory space within a single physical memory device or spread across multiple physical memory devices.
- the software instructions may be read into memory [ 134 ] from another computer-readable medium or from another device via antennas [ 110 ] and transceivers [ 120 ].
- the software instructions contained in memory [ 134 ] may cause the processor [ 132 ] to perform processes described herein.
- hardwired circuitry may be used in place of or in combination with software instructions to implement processes described herein.
- embodiments described herein are not limited to any specific combination of hardware circuitry and software.
- FIG. 1 shows exemplary components of the network entity [ 100 ]
- the network node may contain fewer, different, differently arranged, or additional components than depicted in FIG. 1 .
- one or more components of the network entity may perform one or more other tasks described as being performed by one or more other components of the network entity.
- the network entity [ 100 ] collects one or more first network parameters of a radio network across one or more radio network sites in a first geographical region. Further, the network entity [ 100 ] collects one or more UE parameters of at least one user equipment (UE) connected to the radio network.
- the step [ 204 ] of FIG. 2 is further described in detail in step [ 204 A]-[ 204 E] of FIG. 3 .
- the network entity [ 100 ] performs a prediction analysis for planning of the network across the one or more radio network sites.
- the prediction analysis is performed by using a Continuous-Wave (CW) based 3D propagation model with the collected one or more first network parameters, wherein based on the prediction analysis, one or more second network parameters for each of the one or more radio network sites are generated by the network entity [ 100 ].
- CW Continuous-Wave
- the step [ 206 ] of FIG. 2 is further described in detail with reference to steps [ 206 A]-[ 206 G] of FIG. 4 .
- the network entity [ 100 ] optimizes the 3D propagation model used for the planning of the radio network in the first geographical region, by tuning one or more propagation path loss parameters of the 3D propagation model to compensate for propagation path losses associated with a Line-of-sight (LOS) transmission and a Non-line-of-sight (NLOS) transmission in the radio network, based on a comparison of the generated one or more second network parameters with the at least one Key Point Indicator (KPI) of the 3D propagation model.
- KPI Key Point Indicator
- the network entity [ 100 ] selects a predetermined number of on-air sites (i.e., radio network sites) covering all morphologies such as Dense urban (DU), medium urban (MU), suburban (SU), and rural (RU) of the first geographical region, such as a city. For example, the network entity [ 100 ] may select at least 20% radio network sites of a selected city out of total scope cities. Subsequently, at step [ 204 B], the network entity [ 100 ] determines whether the radio network sites across all the morphologies are less than the predetermined number of sites, for example, less than 20%.
- on-air sites i.e., radio network sites
- DU Dense urban
- MU medium urban
- SU suburban
- RU rural
- the network entity [ 100 ] repeats the step [ 204 A]. In an event, the radio network sites across all the morphologies are greater than the predetermined number of sites, then step [ 204 C] is performed by the network entity [ 100 ].
- drive route maps are created in and around the first geographical area to collect drive map data, wherein the drive map data may include at least the one or more network parameters and the one or more UE parameters.
- the drive map data may be in the form of a Spider Web in which there may be a dense route near a radio network site and an open route far away from the radio network site.
- the network entity [ 100 ] may then collect the one or more network parameters including but not limited to Reference Signal Received Power (RSRP) data samples, for the radio network sites using an RF scanner. Further, the one or more network parameters may include Physical Cell Identity (PCI) information for a serving cell as well as neighbour cells across each of the one or more radio network sites.
- the network entity [ 100 ] may collect the one or more network parameters from an RF scanner, and at step [ 204 E], the network entity [ 100 ] may collect the one or more network parameters from at least one UE.
- RSRP Reference Signal Received Power
- PCI Physical Cell Identity
- the network entity [ 100 ] receives an input data, wherein the input data is a pre-generated 3D map data.
- the input data may include 3D building vector data of the first geographical region, Digital Terrain Model (DTM) having clutter height data of the first geographical region, an available Continuous Wave (CW) based 3D propagation model of any geographical region other than the first geographical region, database of on-air radio network sites of the first geographical region.
- DTM Digital Terrain Model
- CW Continuous Wave
- the collected one or more first network parameters are combined with the received input data, by the network entity [ 100 ].
- a planning module for planning of the radio network across the radio network sites is created, wherein the planning of the radio network comprising at least one of: configuring of the one or more radio network sites, configuring of Reference Signal Energy Per Resource Element (RS-EPRE) parameter of the radio network across the one or more radio network sites, configuring of Physical Cell Identity (PCI) of cells across the radio network, configuring of antenna patterns of one or more antennas facilitating the radio network, and/or configuring of site physical parameters of the one or more radio network sites.
- the physical site parameters may include but are not limited to E-Tilt, M-Tilt and Azimuth.
- the input data is imported into the module created at step [ 206 B].
- the network entity [ 100 ] generates a scanner drive data for the one or more radio network sites based on the processing of the pre-generated 3D map data (i.e., the input data) along with the collected one or more first network parameters.
- the network entity [ 100 ] filters the generated scanner drive data to extract drive samples for generating predicted values, wherein the drive samples are extracted based on a comparison of the one or more first network parameters with predetermined reference values.
- the network entity [ 100 ] performs the prediction analysis by using the 3D propagation model with the collected one or more network parameters and with the determined predicted values to generate the one or more second network parameters.
- the one or more second network parameters correspond to parameters generated by prediction analysis between measured and predicted data on a drive path of the RF scanner of all PCI mapped radio network sites.
- the network entity [ 100 ] performs cell-wise validation of key-point indicator (KPI)s of the 3D propagation model, wherein the KPIs may include but not limited to Mean Error (ME), Standard Deviation (SD) and Correlation Factor (CF).
- KPI key-point indicator
- the network entity [ 100 ] determines the Mean Error (ME), Standard Deviation (SD) and Correlation Factor (CF) samples for each of the radio network site, wherein the ME, SD, and CF are determined for the serving cell and the neighbouring cells in each of the radio network site.
- the network entity [ 100 ] determines whether cumulative prediction analysis of the radio network sites, as described in step [ 206 ], matches one or more pre-stored reference KPIs of the 3D propagation model. In an event, the cumulative prediction analysis matches the pre-stored reference KPIs, the step [ 208 D] is performed, else the step [ 208 C] is performed.
- the network entity [ 100 ] filters samples of the radio network sites having a high value of mean error, low correlation and high standard deviation, after the prediction analysis is performed.
- the network entity [ 100 ] determines correction factor ⁇ and ⁇ values, respectively for the one or more first network parameters collected from the RF scanner and the UE.
- the correction factor is determined after calculating an error based on the difference between the predicted RSRP and the measured RSRP.
- the network entity [ 100 ] performs tuning of one or more propagation path loss parameters of the 3D propagation model by correcting the one or more propagation path loss parameters based on the determined correction factor ⁇ and ⁇ so that the KPIs of the 3D propagation model matches the at least one pre-stored reference KPI.
- the one or more propagation path loss parameters are tuned to compensate for propagation path losses associated with a Line-of-sight (LOS) transmission and a Non-line-of-sight (NLOS) transmission in the radio network.
- the network entity [ 100 ] may repeat the aforementioned steps 204 A- 204 E of FIG. 3 , steps 206 A- 206 G of FIG. 4 and steps 208 A- 208 E of FIG. 5 to make a 3D propagation model of the pre-determined number of geographical regions other than the first geographical region.
- the network entity [ 100 ] may create a 3D propagation model of other geographical regions having similar geography and clutter type as of the first geographical region, while tuning the propagation path loss components of the generated model based on UE data which is periodically received from a user equipment (UE), without requiring to perform a drive test using the RF scanner.
- UE user equipment
- RF scanner based drive data is collected for ‘n’ number of radio network sites.
- the mean value of RSRP error between predicted data by an RF planning tool and scanner based measured data for n sites are a 1 , a 2 , a 3 , . . . , a n and their correlation factors with RF prediction data are c 1 , c 2 , c 3 , . . . , c n .
- the standard deviation of n sites are ⁇ 1 , ⁇ 2 , ⁇ 3 , . . . , ⁇ n .
- overall mean error for drive data of the entire city is derived by,
- Equation (3) shows that the value of ⁇ is within the confidence interval of correlation.
- SD Standard deviation
- Received Power new EIRP ⁇ ( A 1+ B ⁇ log 10 ( D )+ ⁇ L DET +L ANT +L FS +L C ) (6)
- the above equation (6) may be used for 3D predictions with the condition of Standard deviation (SD) ⁇ 8, otherwise, convergence cannot be achieved within confidence interval because of larger deviation from mean path.
- SD Standard deviation
- FIG. 7 shows prediction and measurement sample correlation along with 3D propagation model parameters for Aurangabad city.
- FIG. 8 shows the prediction and measurement sample correlation along with 3D propagation model parameters for Kochi city.
- FIG. 9 shows the prediction and measurement sample correlation along with 3D propagation model parameters for Jaipur city.
- FIG. 10 shows prediction and measurement sample correlation along with 3D propagation model parameters for Dehradun city.
- FIG. 11 shows prediction and measurement sample correlation along with 3D propagation model parameters for Lucknow city.
- the units, interfaces, modules, and/or components depicted in the figures and described herein may be present in the form of a hardware, a software and a combination thereof. Connection/s shown between these units/components/modules/interfaces in the exemplary system architecture [ 100 A] may interact with each other through various wired links, wireless links, logical links and/or physical links. Further, the units/components/modules/interfaces may be connected in other possible ways.
Abstract
Description
-
- (i) 2D propagation model
- (ii) 3D propagation model
L model =K 1 +K 2·log10(d)+K 3·log10(H Txeff)+K 4·DiffractionLoss+K 5·log10(d)·log10(H Txeff)+K 6·(H Rxeff)+K clutter ·f(clutter) (1)
Where,
-
- K1—constant offset (dB)
- K2—Multiplying factor for log10 (d)
- d—Distance between transmitter and receiver (m)
- K3—Multiplying factor for log10 (HTxeff)
- HTxeff—Effective height of the transmitter antenna (m)
- K4—Multiplying factor for diffraction calculation
- K5—Multiplying factor for log10 (d)·log10 (HTxeff)
- K6—Multiplying factor for log10 (HRxeff)
- HRxeff—Effective UE antenna height (m)
- Kclutter—Multiplying factor for f (clutter)
- f (clutter)—Average of weighted losses due to clutter
Received Power=EIRP−(A(far,near)+B·log10(D)+γ·L DET +L ANT +L FS +L C) (2)
Where,
-
- EIRP—Sum of the transmit power plus the maximum antenna gain (dBm)
- D—Tx-Rx distance (m)
- LDET—Deterministic loss from direct-path or from multi-path combination (dB)
- LANT—Antenna loss from direct-path or from multi-path combination, including antenna correction (dB)
- LFS—Propagation loss in free-space at a distance 1 m (dB)
- LC—Clutter loss, including clutter attenuation and in-building propagation loss (dB)
- A—Additional loss (dB) (Anear for the receivers in the near area, Afar for the receivers in the far area)
- B—Additional loss per distance decade (dB/dec) (Bnear for the receivers in the near area, Bfar for the receivers in the far area)
- γ—Weight of the deterministic loss
-
- 1. While tuning the propagation path, there are loss parameters for Line-of-sight (LOS) and Non-line-of-sight (NLOS) in the existing CW based ray tracing propagation models.
- 2. The conventional 3D propagation model cannot create modelling having a similar geographical area and clutter types without performing any drive test.
- 3. It is not possible to provide accurate 3D propagation models due to channel interfering noise of the measured frequency channel.
- 4. The prior arts fail to provide accurate 3D propagation models that can be tuned automatically based on periodically captured UE data.
Where, μi∈{0,1}
μi=0 for ci<0.5 and μi=1 for 0.5<ci<1, i=1, 2, 3, . . . , n
wherein, equation (3) shows that the value of α is within the confidence interval of correlation.
A1=A(far,near)+α+β (5)
Received Powernew =EIRP−(A1+B·log10(D)+γ·L DET +L ANT +L FS +L C) (6)
Claims (20)
Priority Applications (1)
| Application Number | Priority Date | Filing Date | Title |
|---|---|---|---|
| US17/816,917 US11800373B2 (en) | 2018-07-17 | 2022-08-02 | System and method for 3D propagation modelling for planning of a radio network |
Applications Claiming Priority (5)
| Application Number | Priority Date | Filing Date | Title |
|---|---|---|---|
| IN201821026563 | 2018-07-17 | ||
| IN201821026563 | 2018-07-17 | ||
| PCT/IB2019/056050 WO2020016765A1 (en) | 2018-07-17 | 2019-07-16 | System and method for 3d propagation modelling for planning of a radio network |
| US202117261388A | 2021-01-19 | 2021-01-19 | |
| US17/816,917 US11800373B2 (en) | 2018-07-17 | 2022-08-02 | System and method for 3D propagation modelling for planning of a radio network |
Related Parent Applications (2)
| Application Number | Title | Priority Date | Filing Date |
|---|---|---|---|
| PCT/IB2019/056050 Continuation WO2020016765A1 (en) | 2018-07-17 | 2019-07-16 | System and method for 3d propagation modelling for planning of a radio network |
| US17/261,388 Continuation US11405800B2 (en) | 2018-07-17 | 2019-07-16 | System and method for 3D propagation modelling for planning of a radio network |
Publications (2)
| Publication Number | Publication Date |
|---|---|
| US20220386135A1 US20220386135A1 (en) | 2022-12-01 |
| US11800373B2 true US11800373B2 (en) | 2023-10-24 |
Family
ID=69164304
Family Applications (2)
| Application Number | Title | Priority Date | Filing Date |
|---|---|---|---|
| US17/261,388 Active 2039-07-26 US11405800B2 (en) | 2018-07-17 | 2019-07-16 | System and method for 3D propagation modelling for planning of a radio network |
| US17/816,917 Active US11800373B2 (en) | 2018-07-17 | 2022-08-02 | System and method for 3D propagation modelling for planning of a radio network |
Family Applications Before (1)
| Application Number | Title | Priority Date | Filing Date |
|---|---|---|---|
| US17/261,388 Active 2039-07-26 US11405800B2 (en) | 2018-07-17 | 2019-07-16 | System and method for 3D propagation modelling for planning of a radio network |
Country Status (3)
| Country | Link |
|---|---|
| US (2) | US11405800B2 (en) |
| EP (1) | EP3824657A4 (en) |
| WO (1) | WO2020016765A1 (en) |
Families Citing this family (10)
| Publication number | Priority date | Publication date | Assignee | Title |
|---|---|---|---|---|
| EP3824565A1 (en) * | 2018-07-20 | 2021-05-26 | Nokia Technologies OY | Active antenna array dithering to improve scanning efficiency and reduce beam indices |
| US11044158B2 (en) * | 2019-08-26 | 2021-06-22 | CACI, Inc.—Federal | Self-configuring wireless networks |
| WO2022215133A1 (en) * | 2021-04-05 | 2022-10-13 | 日本電信電話株式会社 | Communication design assistance device, communication design assistance method, and program |
| WO2022215132A1 (en) * | 2021-04-05 | 2022-10-13 | 日本電信電話株式会社 | Communication design assistance device, communication design assistance method, and program |
| WO2022215134A1 (en) * | 2021-04-05 | 2022-10-13 | 日本電信電話株式会社 | Communication design assistance device, communication design assistance method, and program |
| CN113573335A (en) * | 2021-07-12 | 2021-10-29 | 昆明理工大学 | Indoor signal tracking method |
| CN114363806A (en) * | 2021-12-30 | 2022-04-15 | 北京红山信息科技研究院有限公司 | High-precision 5G triangulation method |
| CN114449567B (en) * | 2021-12-30 | 2023-09-08 | 武汉船舶通信研究所(中国船舶重工集团公司第七二二研究所) | Path loss prediction method in ship |
| CN114971388B (en) * | 2022-06-20 | 2023-06-13 | 山东安能信息技术有限公司 | Power distribution network line loss fine management system based on big data |
| CN117459169A (en) * | 2023-12-22 | 2024-01-26 | 北京未尔锐创科技有限公司 | Self-adaptive matching method and system for electric wave propagation model |
Citations (4)
| Publication number | Priority date | Publication date | Assignee | Title |
|---|---|---|---|---|
| US20080062942A1 (en) * | 2003-04-04 | 2008-03-13 | Hills Alexander H | Dynamic Transmit Power Configuration System for Wireless Network Environments |
| CN102195690A (en) | 2010-03-16 | 2011-09-21 | 埃克提克斯有限责任公司 | Method for estimating/optimizing capacity gain and coverage range generated by multi-antenna configuration in honeycomb wireless network |
| US20150126209A1 (en) * | 2012-06-01 | 2015-05-07 | Alcatel Lucent | Network analysis for radio resource activation in green mobile networks |
| US20190200346A1 (en) * | 2013-12-26 | 2019-06-27 | Sony Corporation | Device and method for controlling working state change of small cell |
Family Cites Families (1)
| Publication number | Priority date | Publication date | Assignee | Title |
|---|---|---|---|---|
| CN105430664B (en) * | 2015-10-30 | 2019-05-28 | 上海华为技术有限公司 | It is a kind of to be fitted the method and apparatus that path loss is propagated in prediction based on classification |
-
2019
- 2019-07-16 EP EP19837040.5A patent/EP3824657A4/en active Pending
- 2019-07-16 US US17/261,388 patent/US11405800B2/en active Active
- 2019-07-16 WO PCT/IB2019/056050 patent/WO2020016765A1/en unknown
-
2022
- 2022-08-02 US US17/816,917 patent/US11800373B2/en active Active
Patent Citations (5)
| Publication number | Priority date | Publication date | Assignee | Title |
|---|---|---|---|---|
| US20080062942A1 (en) * | 2003-04-04 | 2008-03-13 | Hills Alexander H | Dynamic Transmit Power Configuration System for Wireless Network Environments |
| CN102195690A (en) | 2010-03-16 | 2011-09-21 | 埃克提克斯有限责任公司 | Method for estimating/optimizing capacity gain and coverage range generated by multi-antenna configuration in honeycomb wireless network |
| US20150126209A1 (en) * | 2012-06-01 | 2015-05-07 | Alcatel Lucent | Network analysis for radio resource activation in green mobile networks |
| US9338787B2 (en) | 2012-06-01 | 2016-05-10 | Alcatel Lucent | Network analysis for radio resource activation in green mobile networks |
| US20190200346A1 (en) * | 2013-12-26 | 2019-06-27 | Sony Corporation | Device and method for controlling working state change of small cell |
Non-Patent Citations (2)
| Title |
|---|
| International Search Report, PCT/IB2019/056050, filed Jul. 16, 2019, 3 pages. |
| Written Opinion of the International Searching Authority, dated Nov. 29, 2019, 5 pages. |
Also Published As
| Publication number | Publication date |
|---|---|
| US20210345129A1 (en) | 2021-11-04 |
| US20220386135A1 (en) | 2022-12-01 |
| US11405800B2 (en) | 2022-08-02 |
| EP3824657A1 (en) | 2021-05-26 |
| WO2020016765A1 (en) | 2020-01-23 |
| EP3824657A4 (en) | 2022-10-12 |
Similar Documents
| Publication | Publication Date | Title |
|---|---|---|
| US11800373B2 (en) | System and method for 3D propagation modelling for planning of a radio network | |
| Roslee et al. | Optimization of Hata propagation prediction model in suburban area in Malaysia | |
| EP3890361B1 (en) | Cell longitude and latitude prediction method and device, server, base station, and storage medium | |
| US20030129987A1 (en) | System and method for frequency planning in wireless communication networks | |
| Chebil et al. | Comparison between measured and predicted path loss for mobile communication in Malaysia | |
| Ibhaze et al. | An empirical propagation model for path loss prediction at 2100MHz in a dense urban environment | |
| CN102480743B (en) | Positioning method of cross-cell coverage, apparatus and system thereof | |
| Popoola et al. | Calibrating the standard path loss model for urban environments using field measurements and geospatial data | |
| CN106231621A (en) | A kind of many scene adaptives optimization method of propagation model in FDD LTE system | |
| CN102075979B (en) | Method and device for positioning in-band interference | |
| US9264919B2 (en) | Method, node and system for management of a mobile network | |
| Ibhaze et al. | Developing smart cities through optimal wireless mobile network | |
| Kora et al. | Accurate radio coverage assessment methods investigation for 3G/4G networks | |
| CN114520997A (en) | Method, device, equipment and storage medium for positioning 5G network interference source | |
| Akande et al. | Performance analysis and optimization of cost 231-hata model for mobile communication in Nigeria | |
| Neuland et al. | Influence of positioning error on X-map estimation in LTE | |
| Tahat et al. | Analysis of propagation models at 2.1 GHz for simulation of a live 3G cellular network | |
| KR101495503B1 (en) | Method for Estimating Azimuth, Apparatus And Computer-Readable Recording Medium with Program Therefor | |
| ALMĂJANU et al. | Radio coverage analysis for mobile communication networks using ics telecom | |
| Koudouridis et al. | A method for the generation of radio signal coverage maps for dense networks | |
| US20230059993A1 (en) | Wireless telecommunications network | |
| Joshi et al. | A Review on Empirical data collection and analysis of Bertoni's model at 1. 8 GHz | |
| Storsaeter et al. | A GIS-based tool for optimizing C-ITS communication infrastructure | |
| US20230262486A1 (en) | Method for managing a radio access communications network, and radio access communications system operating according to said method | |
| Vieira et al. | Introducing Redundancy in the Radio Planning of LPWA Networks for Internet of Things. |
Legal Events
| Date | Code | Title | Description |
|---|---|---|---|
| AS | Assignment |
Owner name: JIO PLATFORMS LIMITED, INDIA Free format text: ASSIGNMENT OF ASSIGNORS INTEREST;ASSIGNOR:RELIANCE JIO INFOCOMM LIMITED;REEL/FRAME:060701/0314 Effective date: 20220627 Owner name: RELIANCE JIO INFOCOMM LIMITED, INDIA Free format text: ASSIGNMENT OF ASSIGNORS INTEREST;ASSIGNORS:GUPTA, DEEPAK;DALWADI, GAURAV;SHAH, BRIJESH I.;AND OTHERS;REEL/FRAME:060701/0235 Effective date: 20220517 |
|
| FEPP | Fee payment procedure |
Free format text: ENTITY STATUS SET TO UNDISCOUNTED (ORIGINAL EVENT CODE: BIG.); ENTITY STATUS OF PATENT OWNER: LARGE ENTITY |
|
| STPP | Information on status: patent application and granting procedure in general |
Free format text: DOCKETED NEW CASE - READY FOR EXAMINATION |
|
| STPP | Information on status: patent application and granting procedure in general |
Free format text: NOTICE OF ALLOWANCE MAILED -- APPLICATION RECEIVED IN OFFICE OF PUBLICATIONS |
|
| STPP | Information on status: patent application and granting procedure in general |
Free format text: PUBLICATIONS -- ISSUE FEE PAYMENT VERIFIED |
|
| STCF | Information on status: patent grant |
Free format text: PATENTED CASE |