US11786186B2 - Super-resolution tomosynthesis imaging systems and methods - Google Patents
Super-resolution tomosynthesis imaging systems and methods Download PDFInfo
- Publication number
- US11786186B2 US11786186B2 US17/535,131 US202117535131A US11786186B2 US 11786186 B2 US11786186 B2 US 11786186B2 US 202117535131 A US202117535131 A US 202117535131A US 11786186 B2 US11786186 B2 US 11786186B2
- Authority
- US
- United States
- Prior art keywords
- source
- detector
- distance
- along
- scan path
- Prior art date
- Legal status (The legal status is an assumption and is not a legal conclusion. Google has not performed a legal analysis and makes no representation as to the accuracy of the status listed.)
- Active
Links
- 238000003384 imaging method Methods 0.000 title claims abstract description 54
- 238000000034 method Methods 0.000 title claims description 17
- 239000002245 particle Substances 0.000 claims abstract description 28
- 230000008859 change Effects 0.000 claims abstract description 27
- 230000000149 penetrating effect Effects 0.000 claims abstract description 26
- 230000001747 exhibiting effect Effects 0.000 claims abstract description 9
- 230000004044 response Effects 0.000 claims abstract description 3
- 230000033001 locomotion Effects 0.000 claims description 63
- 238000001514 detection method Methods 0.000 claims description 8
- 210000000481 breast Anatomy 0.000 description 36
- 210000000779 thoracic wall Anatomy 0.000 description 20
- 230000006870 function Effects 0.000 description 19
- 238000004088 simulation Methods 0.000 description 9
- 238000012360 testing method Methods 0.000 description 8
- 210000001519 tissue Anatomy 0.000 description 8
- 230000001186 cumulative effect Effects 0.000 description 6
- 238000013459 approach Methods 0.000 description 5
- 208000004434 Calcinosis Diseases 0.000 description 4
- 230000008901 benefit Effects 0.000 description 4
- 238000004364 calculation method Methods 0.000 description 4
- 230000006872 improvement Effects 0.000 description 4
- 206010028980 Neoplasm Diseases 0.000 description 3
- 201000011510 cancer Diseases 0.000 description 3
- 230000006835 compression Effects 0.000 description 3
- 238000007906 compression Methods 0.000 description 3
- 230000001419 dependent effect Effects 0.000 description 3
- 238000013461 design Methods 0.000 description 3
- 230000010354 integration Effects 0.000 description 3
- 230000001174 ascending effect Effects 0.000 description 2
- 210000000038 chest Anatomy 0.000 description 2
- 238000010586 diagram Methods 0.000 description 2
- 230000003902 lesion Effects 0.000 description 2
- 238000005259 measurement Methods 0.000 description 2
- 238000012986 modification Methods 0.000 description 2
- 230000004048 modification Effects 0.000 description 2
- 238000002601 radiography Methods 0.000 description 2
- 238000011160 research Methods 0.000 description 2
- 238000005070 sampling Methods 0.000 description 2
- 230000035945 sensitivity Effects 0.000 description 2
- 238000013519 translation Methods 0.000 description 2
- 241000208140 Acer Species 0.000 description 1
- 238000012935 Averaging Methods 0.000 description 1
- 208000010392 Bone Fractures Diseases 0.000 description 1
- 206010006187 Breast cancer Diseases 0.000 description 1
- 208000026310 Breast neoplasm Diseases 0.000 description 1
- 206010056342 Pulmonary mass Diseases 0.000 description 1
- 241001201483 Selenia <moth> Species 0.000 description 1
- 241000748245 Villanova Species 0.000 description 1
- 210000003484 anatomy Anatomy 0.000 description 1
- 238000003491 array Methods 0.000 description 1
- 230000002308 calcification Effects 0.000 description 1
- 238000003745 diagnosis Methods 0.000 description 1
- 238000006073 displacement reaction Methods 0.000 description 1
- 230000000694 effects Effects 0.000 description 1
- 230000001788 irregular Effects 0.000 description 1
- 238000012886 linear function Methods 0.000 description 1
- 210000004072 lung Anatomy 0.000 description 1
- 230000036210 malignancy Effects 0.000 description 1
- 230000003211 malignant effect Effects 0.000 description 1
- 238000009607 mammography Methods 0.000 description 1
- 238000009659 non-destructive testing Methods 0.000 description 1
- 230000003121 nonmonotonic effect Effects 0.000 description 1
- 230000003534 oscillatory effect Effects 0.000 description 1
- 230000008569 process Effects 0.000 description 1
- 238000012545 processing Methods 0.000 description 1
- 238000009877 rendering Methods 0.000 description 1
- 238000006467 substitution reaction Methods 0.000 description 1
- 238000003325 tomography Methods 0.000 description 1
Images


Classifications
-
- G—PHYSICS
- G01—MEASURING; TESTING
- G01N—INVESTIGATING OR ANALYSING MATERIALS BY DETERMINING THEIR CHEMICAL OR PHYSICAL PROPERTIES
- G01N23/00—Investigating or analysing materials by the use of wave or particle radiation, e.g. X-rays or neutrons, not covered by groups G01N3/00 – G01N17/00, G01N21/00 or G01N22/00
- G01N23/02—Investigating or analysing materials by the use of wave or particle radiation, e.g. X-rays or neutrons, not covered by groups G01N3/00 – G01N17/00, G01N21/00 or G01N22/00 by transmitting the radiation through the material
- G01N23/04—Investigating or analysing materials by the use of wave or particle radiation, e.g. X-rays or neutrons, not covered by groups G01N3/00 – G01N17/00, G01N21/00 or G01N22/00 by transmitting the radiation through the material and forming images of the material
- G01N23/044—Investigating or analysing materials by the use of wave or particle radiation, e.g. X-rays or neutrons, not covered by groups G01N3/00 – G01N17/00, G01N21/00 or G01N22/00 by transmitting the radiation through the material and forming images of the material using laminography or tomosynthesis
-
- A—HUMAN NECESSITIES
- A61—MEDICAL OR VETERINARY SCIENCE; HYGIENE
- A61B—DIAGNOSIS; SURGERY; IDENTIFICATION
- A61B6/00—Apparatus or devices for radiation diagnosis; Apparatus or devices for radiation diagnosis combined with radiation therapy equipment
- A61B6/02—Arrangements for diagnosis sequentially in different planes; Stereoscopic radiation diagnosis
- A61B6/025—Tomosynthesis
-
- A—HUMAN NECESSITIES
- A61—MEDICAL OR VETERINARY SCIENCE; HYGIENE
- A61B—DIAGNOSIS; SURGERY; IDENTIFICATION
- A61B6/00—Apparatus or devices for radiation diagnosis; Apparatus or devices for radiation diagnosis combined with radiation therapy equipment
- A61B6/02—Arrangements for diagnosis sequentially in different planes; Stereoscopic radiation diagnosis
- A61B6/027—Arrangements for diagnosis sequentially in different planes; Stereoscopic radiation diagnosis characterised by the use of a particular data acquisition trajectory, e.g. helical or spiral
-
- A—HUMAN NECESSITIES
- A61—MEDICAL OR VETERINARY SCIENCE; HYGIENE
- A61B—DIAGNOSIS; SURGERY; IDENTIFICATION
- A61B6/00—Apparatus or devices for radiation diagnosis; Apparatus or devices for radiation diagnosis combined with radiation therapy equipment
- A61B6/44—Constructional features of apparatus for radiation diagnosis
- A61B6/4429—Constructional features of apparatus for radiation diagnosis related to the mounting of source units and detector units
- A61B6/4452—Constructional features of apparatus for radiation diagnosis related to the mounting of source units and detector units the source unit and the detector unit being able to move relative to each other
-
- A—HUMAN NECESSITIES
- A61—MEDICAL OR VETERINARY SCIENCE; HYGIENE
- A61B—DIAGNOSIS; SURGERY; IDENTIFICATION
- A61B6/00—Apparatus or devices for radiation diagnosis; Apparatus or devices for radiation diagnosis combined with radiation therapy equipment
- A61B6/46—Arrangements for interfacing with the operator or the patient
- A61B6/461—Displaying means of special interest
-
- A—HUMAN NECESSITIES
- A61—MEDICAL OR VETERINARY SCIENCE; HYGIENE
- A61B—DIAGNOSIS; SURGERY; IDENTIFICATION
- A61B6/00—Apparatus or devices for radiation diagnosis; Apparatus or devices for radiation diagnosis combined with radiation therapy equipment
- A61B6/50—Apparatus or devices for radiation diagnosis; Apparatus or devices for radiation diagnosis combined with radiation therapy equipment specially adapted for specific body parts; specially adapted for specific clinical applications
- A61B6/502—Apparatus or devices for radiation diagnosis; Apparatus or devices for radiation diagnosis combined with radiation therapy equipment specially adapted for specific body parts; specially adapted for specific clinical applications for diagnosis of breast, i.e. mammography
-
- A—HUMAN NECESSITIES
- A61—MEDICAL OR VETERINARY SCIENCE; HYGIENE
- A61B—DIAGNOSIS; SURGERY; IDENTIFICATION
- A61B6/00—Apparatus or devices for radiation diagnosis; Apparatus or devices for radiation diagnosis combined with radiation therapy equipment
- A61B6/54—Control of apparatus or devices for radiation diagnosis
-
- G—PHYSICS
- G01—MEASURING; TESTING
- G01N—INVESTIGATING OR ANALYSING MATERIALS BY DETERMINING THEIR CHEMICAL OR PHYSICAL PROPERTIES
- G01N23/00—Investigating or analysing materials by the use of wave or particle radiation, e.g. X-rays or neutrons, not covered by groups G01N3/00 – G01N17/00, G01N21/00 or G01N22/00
- G01N23/02—Investigating or analysing materials by the use of wave or particle radiation, e.g. X-rays or neutrons, not covered by groups G01N3/00 – G01N17/00, G01N21/00 or G01N22/00 by transmitting the radiation through the material
- G01N23/04—Investigating or analysing materials by the use of wave or particle radiation, e.g. X-rays or neutrons, not covered by groups G01N3/00 – G01N17/00, G01N21/00 or G01N22/00 by transmitting the radiation through the material and forming images of the material
- G01N23/046—Investigating or analysing materials by the use of wave or particle radiation, e.g. X-rays or neutrons, not covered by groups G01N3/00 – G01N17/00, G01N21/00 or G01N22/00 by transmitting the radiation through the material and forming images of the material using tomography, e.g. computed tomography [CT]
-
- A—HUMAN NECESSITIES
- A61—MEDICAL OR VETERINARY SCIENCE; HYGIENE
- A61B—DIAGNOSIS; SURGERY; IDENTIFICATION
- A61B6/00—Apparatus or devices for radiation diagnosis; Apparatus or devices for radiation diagnosis combined with radiation therapy equipment
- A61B6/04—Positioning of patients; Tiltable beds or the like
- A61B6/0407—Supports, e.g. tables or beds, for the body or parts of the body
- A61B6/0414—Supports, e.g. tables or beds, for the body or parts of the body with compression means
Definitions
- a 3-dimensional image of an object or anatomy is typically generated from a limited number of low-dose x-ray projections acquired from different angles.
- the x-ray source is typically moved in an arc around an object being imaged (such as a breast) while a series of projection images are captured with a detector including an array of pixels.
- the arc is along a scan direction that is aligned with rows of pixels within the pixel array.
- Data from the resultant projection images is then processed by a computer to create a 3-dimensional tomographic volume.
- digital breast tomosynthesis DBT
- DT digital breast tomosynthesis
- chest imaging DT has been shown to improve the sensitivity and specificity of lung nodule detection relative to traditional two-dimensional projection radiography.
- DT has also had value in musculoskeletal imaging and in non-destructive testing.
- DT's oblique x-ray incidence shifts the image of features within an object in sub-pixel detector element increments along the scan direction with each projection angle.
- DT is capable of “super-resolution”, a term which is used to denote sub-pixel resolution, i.e., resolution that is finer than the physical size of the detector elements.
- super-resolution is achievable over a broad range of positions along the scan direction (e.g., parallel to the chest wall side of the breast support in current DBT systems), it cannot be achieved over as broad of a range of positions perpendicular to the scan direction (e.g., the chest wall—nipple direction in current DBT systems).
- microcalcifications can indicate the early stage of breast cancer.
- the form and morphology of the microcalcifications are important factors in determining whether the microcalcifications are benign or malignant. Improved visibility and conspicuity of lesions help in the determination of the probability of malignancy. It is therefore desirable to determine and set acquisition parameters to optimize super-resolution.
- An embodiment of a super-resolution digital tomosynthesis system for imaging an object includes a source configured to emit penetrating particles toward an object; a detector configured to acquire a series of projection images of the object in response to the penetrating particles from the one source; positioning apparatus configured to position the source and the detector; and an imaging system coupled to the source, the detector, and the positioning apparatus.
- the imaging system is configured to control the positioning apparatus to position the source in relation to the detector along a scan path and change a distance between the source and the detector; control the source and the detector to acquire the series of projection images along the scan path with the distance change between the source and detector; and construct a tomographic volume exhibiting super-resolution from data representing the acquired series of projection images.
- An embodiment of a super-resolution digital tomosynthesis method for imaging an object includes positioning a source of penetrating particles along a scan path with respect a detector, changing a distance between the source and the detector as the source is positioned along the scan path; acquiring a series of images along the scan path with the change of the distance between the source and the detector; and constructing a tomographic volume exhibiting super-resolution from data representing the acquired series of projection images.
- FIG. 1 A is a block diagram of a tomosynthesis system for imaging an object in accordance with aspects of the invention
- FIG. 1 B is a block diagram of an imaging system for use in the tomosynthesis system of FIG. 1 A in accordance with aspects of the invention
- FIG. 2 A is a perspective view of a source, detector, and positioning apparatus for use in a tomosynthesis system for imaging an object in accordance with aspects of the invention
- FIG. 2 B is a perspective view of an implementation of the tomosynthesis system for imaging an object of FIG. 2 A ;
- FIG. 3 is a flow chart of tomosynthesis imaging steps for imaging an object in accordance with aspects of the invention.
- FIG. 4 is an illustration of backprojections of detector elements at various depths in the reconstruction for acquisition geometries with constant and variable magnification per projection in accordance with aspects of the invention
- FIG. 5 is an illustration of a T-shaped x-ray tube trajectory according to an aspect of the invention.
- FIG. 6 is an illustration of the cross section of a sinusoidal test object in the plane of the chest wall in a breast imaging example in accordance with an aspect of the invention
- FIG. 7 is an illustration of the focal spot and an arbitrary detector position according to an aspect of the invention.
- FIG. 8 A is an illustration depicting a T-shaped x-ray tube trajectory in accordance with an embodiment of the invention.
- FIG. 8 B is a graph of the x-coordinate of the focal spot plotted as a function of the projection number according to an embodiment of the invention.
- FIG. 8 C is a graph depicting the focal spot in the plane of the chest wall for the first nine projections and increasingly displaced anterior to the chest wall in the remaining projections in accordance with an aspect of the invention
- FIG. 8 D is a graph depicting three detector trajectories plotted as a function of the projection number according to an aspect of the invention.
- FIGS. 9 A and 9 B are illustrations of tissue coverage in two projection images in accordance with an aspect of the invention.
- FIGS. 10 A and 10 B are graphs illustrating simulations of reconstructions of a sinusoidal test object at different depths in accordance with a conventional acquisition geometry for tomosynthesis
- FIGS. 10 C and 10 D are graphs illustrating Fourier transforms of the respective reconstructions of FIGS. 10 A and 10 B ;
- FIGS. 11 A- 11 F are graphs of r-factor plotted as a function of depth for simulations using varying numbers of projections and varying angular ranges between such projections in accordance with a conventional acquisition geometry for tomosynthesis;
- FIGS. 12 A and 12 B are graphs illustrating the r-factor as a function of depth for a stationary detector and a rotating detector respectively in accordance with a conventional acquisition geometry for tomosynthesis;
- FIG. 13 is an illustration depicting a set up for acquiring a projection image of a bar pattern phantom in accordance with a conventional acquisition geometry for tomosynthesis;
- FIGS. 14 A and 14 B are images of reconstruction planes aligned with the oblique plane of the bar pattern of FIG. 13 in accordance with a conventional acquisition geometry for tomosynthesis;
- FIGS. 15 A and 15 B are graphs illustrating signal as a function of position in the respective reconstructions of FIGS. 14 A and 14 B ;
- FIG. 16 A is a graph depicting the histogram of r-factor values obtained from 500 randomly sampled points in a volume of interest for a tomosynthesis system with a stationary detector with the conventional acquisition geometry;
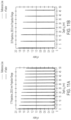
- FIG. 16 B is a graph depicting cumulative histograms of r-factor values obtained from 500 randomly sampled points in a volume of interest for two orientations of the input frequency and for the three detector trajectories shown in FIG. 8 D according to aspects of the invention;
- FIG. 16 C is an illustration depicting how the 99 th percentile of the histogram of FIG. 16 A varies among 200 bootstrapped simulations of 500 randomly sampled points in the volume of interest;
- FIG. 16 D is a graph of the bootstrapped 95% confidence interval for the 99 th percentile plotted as a function of the range of detector motion for two orientations of the input frequency according to aspects of the invention.
- FIG. 17 is a graph illustrating cumulative histograms of the r-factor obtained from 500 randomly sampled points in a volume of interest for four acquisition geometries and two orientations of the input frequency in accordance with aspects of the invention
- FIGS. 18 A- 18 D are graphs of the bootstrapped 95% confidence interval for the 99 th percentile plotted as a function of the number of projections for the respective orientations and acquisition geometries of FIG. 17 ;
- FIG. 19 A is a photograph depicting a Defrise phantom object
- FIG. 19 B is an illustration depicting an acquisition geometry with T-shaped source motion for imaging the Defrise phantom object of FIG. 19 A according to aspects of the invention
- FIG. 19 C is a reconstruction of a Defrise phantom obtained using a conventional tomosynthesis acquisition geometry
- FIG. 19 D is a reconstruction of a Defrise phantom obtained using a tomosynthesis acquisition geometry with T-shaped source motion in accordance with aspects of the invention.
- FIG. 19 E is a graph of signal as a function of position in the reconstructions of FIGS. 19 C and 19 D ;
- FIGS. 20 A- 20 C are reconstructions of a star-pattern phantom in acquisition geometries with different trajectories for the source and detector according to aspects of the invention
- FIG. 21 is a graph of signal in the reconstruction of a star-pattern phantom illustrating the calculation of modulation contrast in accordance with aspects of the invention.
- FIGS. 22 A- 22 C are graphs of signal in the reconstruction of a star-pattern phantom at a frequency below the detector alias frequency for the respective acquisition geometries of FIGS. 20 A- 20 C in accordance with aspects of the invention.
- aspects of the present invention provide for improved tomosynthesis systems for providing super-resolution imaging of an object.
- improved super-resolution images may be obtained (e.g., by changing the distance between a source and the detector during scanning of the object) by varying the magnification of the projected image of the object onto the detector.
- the present invention may be used to obtain super-resolution images for objects including inanimate objects, such as luggage, or anatomical features of a living being, such as a lung or a breast.
- FIG. 1 depicts a tomosynthesis system 100 for imaging an object 102 in accordance with aspects of the invention.
- the illustrated system 100 includes a source 104 that emits penetrating particles toward a detector 106 , with the object positioned in between the source 104 and the detector 106 .
- Penetrating particles that pass through the object 102 create a projection image of the object on the detector 106 .
- the penetrating particles may be x-rays, photons, neutrons, beta particles, or other particles capable of passing through the object and creating a projection image on a detector 106 .
- the source 104 may be a conventional x-ray tube configured to emit x-rays toward the object 102 and the detector 106 .
- the detector 106 may be a conventional x-ray detector including an array of pixels.
- the array of pixels may be square, another geometric shape, a combination of geometric shapes, or irregular. Additionally, the array of pixels may be formed from a two-dimensional array of pixels or a series of one-dimensional arrays of pixels.
- Other suitable sources 104 and detectors 106 e.g., those capable of emitting and detecting other penetrating particles will be understood by one of skill in the art from the description herein. Additionally, although a single source 104 and a single detector 106 are illustrated, additional sources 104 and detectors 106 may also be employed.
- Positioning apparatus 108 is coupled to the object 102 (e.g., via a support member for the object 102 , which is described in further detail below), the source 104 , and the detector 106 . As described in further detail below, the positioning apparatus 108 is configured to position the source 104 relative to the object 102 and the detector 106 along a scan path and to change a distance between the source 104 and the detector 106 by moving the detector 106 substantially perpendicular to the scan path, e.g., in a z-direction.
- the scan path may be a linear path, an arc path, or a more complex path. An embodiment of a more complex scan path is illustrated in FIGS. 5 , 8 A, 8 B and 8 C .
- the detector 106 may move in a direction substantially perpendicular to the arc's tangent at the location of the source.
- the term “substantially” refers to a range of values.
- the phrase “substantially perpendicular” includes ⁇ 30 degrees from a true 90 degrees perpendicular with respect to a reference plane, e.g., from 60 degrees to 120 degrees of an arc's tangent.
- the source 104 emits penetrating particles at a series of locations along the scan path.
- the distance between the source 104 and the detector 106 is changed such that the magnification of the projected image of the object as detected by the detector 106 varies as the source 104 travels along the scan path.
- the variations in the magnification over the range of positions of the source 104 along the scan path of the image of the object enables super-resolution to be obtained throughout the reconstructed volume.
- varying the magnification of the projected image of the object by positioning/moving the detector 106 to change the distance between the source 104 and the detector 106 over the entirety of the positions of the source 104 along the scan path obtains super-resolution throughout the reconstructed volume.
- the object 102 remains stationary and the positioning apparatus is coupled to the source 104 to move the source 104 along a scan path and is coupled to the detector 106 to move the detector 106 such that the distance between the source 104 and the detector 106 is changed.
- the positioning apparatus is coupled to the source 104 to move the source 104 along a scan path and is coupled to the detector 106 to move the detector 106 such that the distance between the source 104 and the detector 106 is changed.
- Other suitable arrangements that vary the distance between the source 104 and the detector 106 during the acquisition of the projections will be understood by one of skill in the art from the description herein and are considered within the scope of the invention.
- An imaging system 110 is coupled to the source 104 , the detector 106 , and the positioning apparatus 108 .
- the imaging system 110 instructs the positioning apparatus 108 to position the object 102 /source 104 /detector 106 , instructs the source 104 to emit penetrating particles, captures data from the detector 106 representing projection images of the object 102 responsive to the emitted penetrating particles, and constructs a tomographic volume of the object that is capable of exhibiting super-resolution. Additionally, the imaging system may display super-resolution images generated from the tomographic volume.
- the imaging system 110 may include, for example, user input devices such as a keyboard and a mouse for receiving operator instructions to manipulate images, user output devises such as a display for displaying super-resolution images, and an internal and/or external memory for storing instructions for implementing one or more of the steps described herein, for storing data from acquired images, and for storing constructed tomographic volumes. Suitable input and output devices and memory will be understood by one of skill in the art from the description herein.
- the imaging system 110 includes a position controller 112 , an acquisition controller 114 , and an image controller 116 .
- the position controller 112 may control positioning apparatus 108 to position the object 102 , the source 104 , and/or the detector 106 relative to one another to enable a series of images to be captured along a scan path with a variable magnification of the detected penetrating particles by positioning the detector 106 , the source 104 , or a combination thereof to change the distance between the source 104 and the detector 106 during the acquisition of the projections.
- the acquisition controller 114 may control the source 104 and the detector 106 to respectively emit penetrating particles and capture projected images of the object 102 responsive to the emitted penetrating particles.
- the acquisition controller may interface with the position controller 112 to ensure the object 102 , source 104 , and detector 106 are accurately positioned relative to one another during the capture of each of the series of images.
- the image controller 116 may process data representing the projected images on the detector 106 to construct a tomographic volume capable of exhibiting super-resolution by taking the scan path and the variable magnification of penetrating detected particles into consideration. Additionally, the image controller 116 may display super-resolution images developed from the tomographic volume.
- controller 112 position controller 112 /acquisition controller 114 , and image controller 116
- the functionality of these controllers can be performed by more or fewer controllers and/or by one or more processors. Additionally, the controllers/processors may reside in a single housing or may be dispersed across a network.
- FIGS. 2 A- 2 B depict an embodiment of a source 104 , detector 106 , and positioning apparatus 108 ( FIG. 1 ) for use in imaging a human breast. Suitable modifications will be understood by one of skill in the art from the description herein for imaging other objects.
- a breast may be positioned within an object receiving area 200 .
- the illustrated object receiving area 200 includes a breast support 202 , and a compression paddle 204 .
- the breast may be positioned on the breast support 202 , which is fixed in position, and the compression paddle 204 may be lowered in a conventional manner into contact with the breast to reduce movement of the breast during the acquisition of images.
- the breast support 202 and a movable breast compression paddle 204 are mounted orthogonal to a central ray of penetrating particles emitted by the source 104 .
- the source 104 illustrated in FIG. 2 A includes a conventional x-ray tube and the illustrated detector 106 includes a conventional 2-dimensional x-ray detector.
- the positioning apparatus 108 in the embodiment illustrated in FIG. 2 A includes an angular drive 205 (e.g., an electro-mechanical drive) coupled to the source 104 to move the source 104 along a scan path (e.g., an arc in the x/z plane) and micro positioners 212 (e.g., electro-mechanical drivers) for positioning the detector 106 .
- angular drive 205 e.g., an electro-mechanical drive
- micro positioners 212 e.g., electro-mechanical drivers
- Micro-positioners 212 a are coupled to the detector 106 to position the detector 106 in order to change a distance between the source 104 and the detector 106 , e.g., in the z-direction to vary the magnification of the projected image of the object. Additional micro-positioners, such as micro-positioners 212 b , may be used to position the detector 106 in other directions to, e.g., introduce an offset in one or more directions, such as in the y-direction. In one embodiment, four micro-positioners 212 a (one at each corner of detector 106 ) are configured to position the detector 106 in the z-direction, while micro-positioners 212 b are configured to position the detector 106 in the y-direction. The addition of micro-positioners 212 allows sub-pixel positioning accuracy for the array of pixels in detector 106 . The micro-positioners 212 may be amplified piezoelectric actuators. Super-resolution can be optimized by considering the acquisition geometry and the system components.
- the micro-positioners 212 are coupled to a rotary stage 210 having an axis of rotation that extends along a detection surface of the detector 106 .
- the rotary stage 210 rotates on a slewing bearing 208 that supports the load of the object receiving area 200 , the source 104 , the detector 106 , and the micro-positioners 212 .
- a rotary arm 206 is positioned between the source 104 and the detector 106 .
- the axis of rotation is illustrated as extending along the surface of the detector 106 , other axes of rotations may be employed, e.g., one extending though the object being imaged. In other embodiments, the scan path may be linear.
- FIG. 3 depicts a flow chart 300 of exemplary steps for constructing a tomographic volume capable of exhibiting super-resolution by taking the scan path and the variable magnification of the projected image of the object into consideration.
- steps of flow chart 300 are described with reference to the apparatus depicted in FIGS. 1 A, 1 B, and 2 , it will be understood that other apparatus may be used in accordance with the invention. Likewise, the apparatus depicted in FIGS. 1 A, 1 B, and 2 may perform other methods. Additionally, in some embodiments, one or more steps of flow chart 300 may be omitted or performed in an order other than depicted (including at the same time).
- a source is positioned with respect to an object and a detector along a scan path.
- the source may be source 104 and the detector may be detector 106 .
- the source 104 is configured to move along a scan path with respect to the object 102 and the detector 106 .
- the source 104 may be moved along a scan path that is an arc within a plane substantially parallel to the chest wall.
- the breast remains stationary during the imaging and the detector 106 may remain stationary or may move such that the detecting surface of the detector 106 is normal to the penetrating rays emitted by the source 104 .
- the detector is moved to change a distance between the source (e.g., source 104 ) and the detector (e.g., detector 106 ).
- the detector e.g., detector 106
- variable magnification of the projected image of the object as detected by the detector 106 may be obtained.
- the detection surface of the detector 106 may be moved in a z-direction, e.g., directly towards or away from the object 102 , to change the distance between the source 104 and the detector 106 .
- the z-direction is substantially parallel to the plane of the chest wall, such as in a breast imaging application.
- the z-direction is directly towards or away from the object 102 and/or source 104 .
- the detector 106 may be moved to change the distance between the source 104 and the detector 106 at the same time as the positioning is performed in step 302 . Alternatively, steps 302 and 304 may be performed sequentially in steps.
- the movement of the source 104 and the detector 106 for positioning along the scan path (step 302 ) and/or to change the distance between the source 104 and the detector 106 may be a continuous motion, a step-and-shoot motion, or a modulated smooth motion with oscillatory velocity.
- the acquisition controller 114 of imaging system 110 may control the movement.
- a projection image of the object is acquired.
- Each projection image may be acquired by emitting penetrating particles from the source 104 toward a detector 106 with the object 102 positioned in between.
- the detector 106 detects the projection image responsive to the emitted penetrating particles that strike the detector surface of the detector 106 .
- the acquisition controller 114 may control acquisition by instructing the source 104 to emit penetrating particles and instructing the detector 106 to capture an image.
- steps 302 - 306 may be performed nine times.
- a tomographic volume capable of exhibiting super-resolution is constructed from data representing the acquired series of projection images taking the scan path and the variable magnification of the detected penetrating particles into consideration.
- An imaging system 110 e.g., an image controller 116 may construct the tomographic volume based on data representing the projection images acquired by the detector 106 .
- Movement of the source 104 relative to the object 102 and the detector 106 results in features within the object 102 being projected onto different positions on the detection surface of the detector 106 in the scan path.
- the shift in position along the scan path e.g., lateral to the chest wall, enables super-resolution in the scan path.
- isotropic super-resolution may be obtained.
- super-resolution is obtained without offsetting or shifting the detector 106 with respect to the source 104 in the x-direction or y-direction by moving the detector 106 or source 104 in said directions.
- super-resolution images are generated from the constructed tomographic volume.
- the reconstruction grid should have smaller pixels than the detector 106 in order to achieve super-resolution.
- the imaging controller 116 of the imaging system 110 may generate super-resolution images under the control of an operator. Additional details regarding generation of super-resolution images are found below and in U.S. Pat. No. 8,233,690 to Ng et al., titled Dynamic Tomographic Image Reconstruction and Rendering On-Demand, which is incorporated fully herein by reference.
- the inventors recognized that due to the motion of the source 104 along a scan path relative to the object 102 and the surface of the detector 106 , there are shifts in the features of the object 102 along the scan path, allowing for super-resolution along this direction. Moreover, the inventors recognized that to achieve sub-pixel sampling gain along a secondary direction (e.g., the y-direction), the detector 106 may be translated along the y-direction. The secondary motion promotes shifts in the image of an object 102 along the y-direction with each projection, which may enable super-resolution with respect to the motion in the y-direction. In one embodiment, a system that varies the source 104 and/or the detector 106 along the y-direction provides improved results for imaging objects that have a conical shape, substantially conical shape, or the like.
- the inventors discovered that by reducing the angular spacing between the projections of the particles from the source 104 and/or by increasing the number of projections, the number of anisotropies in the images may be reduced. Thus, the range of positions over which super-resolution imaging in achieved may be increased.
- reducing the angular spacing between projections or increasing the total number of projections may be limited by increased costs and reduced efficiencies.
- reducing the angular spacing or increasing the total number of projections does not provide super-resolution everywhere in the reconstructed volume.
- Systems 100 with detector motion along the y direction advantageously increase the number of points with super-resolution if frequency is oriented along the y direction.
- the tissue coverage at the chest wall is increasingly reduced as the detector is translated anteriorly along the +y direction.
- Embodiments of systems 100 with the detector motion along the z direction offers the advantage of increased points with super-resolution and do not have the reduced tissue coverage, which is an additional advantage.
- the inventors discovered that super-resolution may be obtained over the entire reconstructed volume by varying the magnification of the projected image of the object as detected by the detector 106 .
- the effect of varying the position of detector 106 along the z-direction as a function of the acquisition angle is to vary the magnification of the projected images as a function of the acquisition angle. For example, moving the detector 106 or the source 104 in the z-direction to change a distance between the source 104 and the detector 106 as the source 104 is positioned along the scan path varies the magnification of the projected images to achieve super-resolution over the entire reconstructed volume.
- the source 104 may be moved in the z-direction with respect to the detector 106 and/or the detector 106 may be moved in the z-direction with respect to the source 104 . Additionally and/or alternatively, the source 104 and the detector 106 may be moved in the z-direction at a similar rate, such that the distance between the source 104 and the detector 106 is the same at each imaging position, but the distance between the object and the source and detector varies.
- the inventors further discovered that moving the source 104 or detector 106 in the z-direction may be performed to optimize and/or maximize the amount of tissue scanned at each position (further discussed in Example 2).
- the z-direction is defined with respect to a plane defined by the detector, such as a surface of the detector.
- the z-direction may be a direction that extends perpendicular to the plane defined by the surface of the detector.
- the detector 106 is elevated/moved toward the breast support when the source 104 is positioned farthest from the chest wall.
- the detector 106 is elevated/moved as close as possible to the breast support when the source 104 is positioned farthest from the chest wall. Additionally and/or alternatively, the imaging system may vary the detector 106 with respect to the source 104 in both the y-direction and the z-direction.
- the inventors discovered that the positioning of the detector 106 to change the distance between the source 104 and the detector 106 may achieve super-resolution while avoiding excessive or problematic focal spot unsharpness. These results are surprising because in radiography one normally attempts to minimize the distance between the object 102 and the detector 106 to avoid focal spot unsharpness. However, the inventors discovered that by changing the distance between the source 104 and the detector 106 by moving the detector 106 in the z-direction, e.g., a motion of about 50 mm, super-resolution may be achieved over the reconstructed volume while avoiding excessive or problematic focal spot unsharpness.
- the range of motion is specified as a fraction of the average distance between the source 104 and the detector, for example, if the average source 104 to detector 106 distance is 600 mm, then a 10% range of motion is 60 mm.
- the term “about” refers to a range of motion that is less than 20% of the average distance between the source 104 and detector 106 .
- FIG. 4 illustrates projection images that are backprojected to various planes (A through G).
- planes A and F
- planes B, C, D, E, and G
- the individual pixels do not align and, thus, super-resolution is achieved because of the subpixel shifts.
- the z coordinate of the detector 106 is varied between projections. As can be seen, there are no planes were the pixels are perfectly superimposed and, thus, super-resolution is achieved everywhere throughout the reconstructed volume.
- the r-factor is preferably less than unity at as many positions as practically possible.
- Example 1 demonstrates an embodiment of a tomosynthesis system that includes movement of the focal spot along the posteroanterior (hereafter “PA”) direction in a breast imaging application, which improves the modulation in the reconstruction of a Defrise phantom (e.g., as illustrated in FIG. 19 using a prototype tomosynthesis system that was constructed for research use at the University of Pennsylvania).
- PA posteroanterior
- FIG. 5 One example of a trajectory following this design is shown in FIG. 5 .
- the x-ray tube motion is “T-shaped”, with projections along the x direction as well as the bisecting mid-line.
- the projections are acquired along the x direction over the extent Q x (i.e., 1 ⁇ n ⁇ N x ), and the projections are acquired along the y direction over the extent Q y (i.e., 1+N x ⁇ n ⁇ N t ).
- OA ⁇ x FS ⁇ i + y FS ⁇ j + z FS ⁇ k , ( 1 )
- x FS ⁇ ( 2 ⁇ n - N x - 1 ) ⁇ Q x 2 ⁇ ( N x - 1 ) , 1 ⁇ n ⁇ N x 0 , 1 + N x ⁇ n ⁇ N t ( 2 )
- y FS ⁇ 0 , 1 ⁇ n ⁇ N x ( n - N x ) ⁇ Q y N t - N x , 1 + N x ⁇ n ⁇ N t ( 3 )
- FIG. 8 B- 8 C show the x- and y-coordinates of the focal spot, respectively, as a function of the projection number (n).
- This Example provides modeling for an embodiment of tomosynthesis system that includes movement of the detector along the z direction as a technique for optimizing super-resolution.
- a breast imaging example is considered such that the position of the detector relative to the breast support is denoted b z .
- b z may be assumed to be a linear function of the projection number, so that the increment of translation between each projection is (b z2 ⁇ b z1 )/(N t ⁇ 1).
- b z b z ⁇ 1 + ( b z ⁇ 2 - b z ⁇ 1 ) ⁇ ( n - 1 ) N t - 1 ( 6 )
- the detector moves closer to the x-ray source with each successive projection, as illustrated by the fact that the trajectory is an increasing function. In a cranial-caudal (CC) view for a breast imaging application, this trajectory is inferior-to-superior.
- CC cranial-caudal
- FIGS. 9 A and 9 B illustrate the advantage to using an ascending motion as opposed to a descending motion based on the focal spot positions.
- a ray is drawn between the point O′ and a focal spot position anterior to the chest wall.
- This focal spot position corresponds to a point in the bisecting mid-line of the trajectory shown in FIG. 5 .
- FIGS. 9 A and 9 B illustrate that one way to optimize and/or maximize the tissue coverage is to elevate the detector closer to the focal spot.
- the detector is preferably elevated as close as possible to the breast support. Since the focal spot is translated further away from the chest wall with each increasing projection (see, e.g., FIG. 8 C ), the tissue coverage can be maximized by ascending the detector as opposed to descending the detector during the acquisition of the projections.
- FIG. 8 D there is a fixed increment of detector motion per projection. Though not shown explicitly, alternate trajectories can be considered in which there is a different increment of detector motion per projection. Also, while the detector trajectory of FIG. 8 D is a monotonic function, non-monotonic trajectories can also be considered in accordance with an embodiment of the invention. In summary, FIG. 8 D is merely an example of a detector trajectory in which there is motion along the z direction.
- This calculation of the vector ⁇ right arrow over (AB) ⁇ may be used to determine the line integral of the ray through the object, and thus to calculate the signal for each projection image.
- the line integral through the test object can be determined based on the equation of the ray from the focal spot at A to the detector at B.
- w is a free parameter ranging from zero at point A to unity at point B.
- the values of z at the entrance (“entr”) and exit surfaces of the test object are z 0 + ⁇ /2 and z 0 ⁇ /2, respectively, where s is the thickness of the test object as shown in FIG. 6 .
- s is the thickness of the test object as shown in FIG. 6 .
- ⁇ obj C obj ⁇ cos ⁇ ( 2 ⁇ ⁇ ⁇ f 0 ⁇ [ ( x - x 0 ) ⁇ cos ⁇ + ( y - y 0 ) ⁇ sin ⁇ ] ) ⁇ rect ⁇ ( z - z 0 ⁇ ) , ( 18 ) and where the differential length (ds) along the ray is given by the expression
- the cosine function attains the amplitude C obj at the x- and y-coordinates of x 0 and y 0 , respectively.
- the line integral simplifies as follows:
- ⁇ ⁇ obj - ⁇ 1 ⁇ 3 ⁇ cos ⁇ [ 2 ⁇ ⁇ ⁇ f 0 ⁇ 3 ⁇ ( ⁇ 1 ⁇ cos ⁇ + ⁇ 2 ⁇ sin ⁇ ) ⁇ ( z 0 - z FS ) + ⁇ 2 ] ⁇ sinc ⁇ [ ⁇ ⁇ f 0 ⁇ 3 ⁇ ( ⁇ 1 ⁇ cos ⁇ + ⁇ 2 ⁇ sin ⁇ ) ] ( 25 )
- This expression can in turn be used to calculate the signal in each detector element (del).
- the centroid of each del may be given by the coordinate (m x ⁇ x ,(m y 1/2) ⁇ y ), where a x and a y are the del dimensions along the two respective directions and where m x and m y are integer indices. While m x can be any integer, m y must be non-negative, since signal is not recorded posterior to the chest wall (e.g., FIGS. 9 A and 9 B ). Assuming that each del is uniformly sensitive to x rays, the signal recorded by the m th del is thus
- u 0 , 1 a x ⁇ ( j del , 1 - 1 / 2
- the reconstruction may be calculated using simple backprojection (hereafter “SBP”).
- SBP simple backprojection
- Eqs. (28)-(29) can be derived using a computer algebra system (e.g., Maple 16, Maplesoft, Waterloo, Ontario) to solve Eqs. (11)-(14) for u 1 and u 2 .
- This detector position corresponds to the del with indices
- Eq. (34) can be used to evaluate the reconstruction along the x′′ direction.
- the one-dimensional (1D) Fourier transform of ⁇ SBP may be calculated. While the Fourier transform is usually calculated with infinite integration limits, it is useful to calculate the integral over a finite interval in order to quantify super-resolution locally, and thus to determine anisotropies that vary with position. As shown below, a middle sum can be used to evaluate this integral
- the existence of a major peak at another frequency indicates that the input object is not properly resolved.
- the limits of integration in Eq. (35) are chosen to be ⁇ 3.125 mm and +3.125 mm. This interval corresponds to 50 cycles of a 8.0 mm ⁇ 1 input frequency. This frequency is further discussed in Example 3 as an example of a frequency that exceeds the alias frequency of a detector with 0.085 mm pixelation.
- the input frequency is assumed to be oriented along the tube travel direction (x).
- the reconstruction in FIG. 10 B is step-like, with the width of each step matching the del size (0.085 mm). The appearance of this reconstruction is similar to a single projection image.
- FIGS. 10 C and 10 D The 1D Fourier transforms of these reconstructions are calculated in FIGS. 10 C and 10 D .
- FIGS. 10 A- 10 D illustrate that the feasibility of super-resolution is dependent on depth (z 0 ).
- the r-factor is the ratio of the amplitude of the largest peak less than the alias frequency (e.g., 5.88 mm ⁇ 1 ) to the amplitude at the input frequency. Super-resolution is achieved provided that r ⁇ 1, but aliasing is present provided that r ⁇ 1.
- FIGS. 11 A- 11 F quantify the anisotropies in super-resolution as a function of the depth z 0 using the r-factor. There are sharp peaks corresponding to multiple depths at which super-resolution cannot be achieved.
- FIGS. 11 A- 11 F illustrate that the anisotropies are dependent upon the range of source motion (Q x ) and the number of projections (N t ). In an acquisition geometry with a 200.0 mm range of source motion and 17 projections, super-resolution cannot be achieved at 14 depths between 0 and 50.0 mm above the breast support.
- FIGS. 11 A- 11 F demonstrates that one way to minimize the number of anisotropies is to increase the number of projections. Assuming a 200.0 mm range of source motion, there are seven sharp peaks if 33 projections are used, and there are five sharp peaks if 51 projections are used.
- the number of anisotropies can be minimized by reducing the range of source motion. For example, by changing the range of source motion from 200.0 mm to 100.0 mm, the number of sharp peaks is reduced from 14 to seven, assuming that there are 17 projections.
- the spacing between the anisotropies can be minimized either by increasing the number of projections or by reducing the range of source motion. These two approaches are similar in that they both reduce the spacing between the source positions in the acquisition of the projections.
- FIGS. 12 A and 12 B demonstrates that the existence of sharp peaks depends on whether a stationary detector or a rotating detector is used. For example, in a system with a stationary detector ( FIG. 12 A ), there may be 14 sharp peaks for which the r-factor exceeds unity. By contrast, in an example of a system with 0.50° of detector rotation per projection ( FIG. 12 B ), the r-factor does not exceed unity at any depth. This result indicates that the use of detector rotation is a tool for minimizing anisotropies in super-resolution.
- FIG. 12 B is prepared using equations which account for detector rotation.
- This Example experimentally confirms the anisotropies by orienting the plane of a bar pattern (BP) phantom at an angle ( ⁇ ) relative to the breast support using a goniometry stand ( FIG. 13 ).
- This approach allows the test frequency to be visualized over a continuous range of depths (z 0 ) in a single DBT acquisition.
- the input frequency is aligned with the x direction, similar to Example 3, regardless of the specific value of ⁇ that is used to angle the phantom.
- DBT images were acquired with a Selenia Dimensions system (Hologic Inc., Bedford, Mass.).
- the DBT acquisition was performed with a W/AI target-filter combination at 30 kVp and 25 mAs.
- the reconstruction was then calculated with the software PiccoloTM (available from Real Time Tomography, LLC of Villanova, Pa.). This software has a feature that allows the user to alter the angle of the reconstruction plane, so that it matches the oblique plane of the phantom.
- FIGS. 14 A and 14 B illustrates the reconstruction of the frequency 5.0 line pairs per millimeter (Ip/mm). This frequency exceeds the alias frequency (3.57 Ip/mm) for a 0.140 mm detector.
- the reconstruction was performed with smaller pixelation than the detector (0.0215 mm), which is an important condition for achieving super-resolution. As such, the reconstruction was magnified by a factor of 6.51 relative to the detector.
- FIG. 14 A confirms the models discussed above by illustrating that super-resolution is not achievable at all depths (z 0 ). There are aliasing artifacts indicated by the arrows.
- FIG. 15 A shows the signal through one artifact (the middle artifact out of the three). The peaks and troughs in this plot do not match those of the reference frequency (5.0 mm ⁇ 1 ), reflecting the presence of aliasing.
- FIG. 15 B illustrates the plot profile of this reconstruction.
- the plot profile was created at the same z-coordinate as the middle aliasing artifact in FIG. 14 A .
- the positions of each peak and trough match the reference frequency, indicating that the test object is resolved.
- FIG. 14 B indicates that there are no aliasing artifacts at any depth.
- the quality of super-resolution that is achieved in FIG. 14 B is clearly different from that of FIG. 14 A .
- There is sharper, higher-quality super-resolution in FIG. 14 A e.g., at the regions to the left and right of the arrows.
- the simulations in previous examples demonstrate that the quality of super-resolution can be modeled by the r-factor.
- the r-factor should be as close to zero as possible to achieve high-quality super-resolution.
- the relatively poor-quality super-resolution that is seen in FIG. 14 B is to be expected based on the results shown in FIG. 12 B .
- Examples 3 and 4 indicate that there is variation in the quality of super-resolution throughout the 3D image.
- One way to quantify this variation is to determine the r-factor at every point in a volume-of-interest (VOI), and calculate a histogram.
- An alternate approach is to calculate the histogram by randomly sampling 500 points in the VOI, which is depicted in FIG. 16 A for a breast imaging example.
- the VOI is a rectangular prism with dimensions 200.0 ⁇ 100.0 ⁇ 50.0 (in mm) and 0.050 mm spacing between points in each direction.
- the VOI is centered on the point (0, 55.0, 25.0) (in mm).
- Example 2 it was noted that the Fourier transform of ⁇ SBP is evaluated over an interval that is 6.25 mm wide. Considering the frequency along a 90° polar angle, this interval could include positions posterior to the chest wall, for which there is no signal recorded by the detector ( FIGS. 9 A- 9 B ). As a result, the r-factor is not well-defined if the y-coordinate of the point-of-interest is less than 3.125 mm. A VOI was chosen for which the y-coordinate of each point is 5.0 mm or higher. This approach is designed to ensure that the reconstruction is well-defined over the interval used to calculate the Fourier transform.
- This system is similar to the one simulated in Example 3, for which there is linear source motion and a stationary detector. It was confirmed that super-resolution cannot be achieved at all points in the VOI. The r-factor exceeded unity at 45 points out of 500. Hence, there is aliasing at 9.0% of the points in the VOI.
- FIG. 16 B There are two polar angles considered in FIG. 16 B to model different orientations of the input frequency.
- the 0° angle is analyzed first, corresponding to frequency oriented along the x direction. This direction is left-to-right in a CC view in a breast imaging application.
- the r-factor exceeds unity at 9.0% of the points if there is no detector motion.
- FIG. 16 B demonstrates that by introducing detector motion along the z direction, super-resolution can be achieved at all points in the reconstruction, since the r-factor does not exceed unity at any point in the VOI. If 50.0 mm of net motion is used as opposed to 25.0 mm of net motion, the plateau is shifted further to the left, indicating an improvement in the r-factor.
- the 90° polar angle is also analyzed in FIG. 16 B .
- This orientation corresponds to frequency along the y direction. Along the y direction, there are no sub-pixel shifts in the image of an object between projections. For this reason, super-resolution cannot be achieved anywhere in the VOI, as the r-factor exceeds unity at all points.
- FIG. 16 B indicates that by introducing detector motion along the z direction, the r-factor is below unity for all points in the VOI, and hence super-resolution is achieved everywhere.
- FIG. 16 C illustrates how the 99th percentile varies among 200 bootstrapped simulations of 500 random points.
- the detector is stationary and frequency is oriented along the 0° polar angle, similar to FIG. 16 A .
- FIG. 16 C can be used to calculate a 95% confidence interval (CI 95 ) for the 99th percentile. Since CI 95 varies between 1.60 and 1.82, FIG. 16 C illustrates how the conventional design does not ensure super-resolution at a sufficiently large number of points in the VOI.
- FIG. 16 D it was analyzed how the CI 95 is impacted by the net increment of detector motion.
- the detector position at the start of the scan (b z1 ) is varied between ⁇ 25.0 mm (net 0.0 mm motion) and ⁇ 75.0 mm (net 50.0 mm motion).
- This simulation assumes that the detector position at the end of the scan (b z2 ) is constant ( ⁇ 25.0 mm), as is the case in FIG. 8 D .
- FIG. 16 D demonstrates that detector motion along the z direction is necessary for ensuring that at least 99% of the points exhibit super-resolution.
- the r-factor should be as small as possible to achieve super-resolution with high quality.
- the lowest possible r-factor is achieved using 50.0 mm of net detector motion.
- the 95% confidence intervals are [0.425, 0.468] and [0.294, 0.306] for the 0° and 90° polar angles, respectively.
- FIG. 17 demonstrates that re-designing the source motion yields an improvement along this polar angle, since the r-factor is below unity at 53.8% of the points in the VOI (Geometry III).
- the 99 th percentile of each geometry should be analyzed, as in the previous Examples.
- One shortcoming of the geometries with a stationary detector (I and III) is that the 99 th percentile exceeds unity, regardless of polar angle. Use of detector motion along the z direction ensures that the 99 th percentile is below unity, yielding super-resolution at 99% of points in the VOI.
- FIGS. 18 A- 18 D illustrate that the system should be designed with either geometry II or geometry IV. While the trend is not perfectly monotonic, FIGS. 18 B and 18 D also demonstrate that the 99 th percentile can be minimized by increasing the number of projections, yielding an improvement in the quality of super-resolution.
- FIGS. 20 A- 20 C show the limiting resolution along the PA direction for Geometry I ( FIG. 20 A ), Geometry II ( FIG. 20 B ) and Geometry III ( FIG. 20 C ) As seen by comparing FIGS. 20 A- 20 C , the highest resolution is achieved in the geometry with detector motion along the z direction (Geometry II, FIG. 20 B ).
- FIG. 21 illustrates a plot of signal as a function of position in the reconstruction. This graph can be used to calculate modulation contrast.
- FIGS. 22 A- 22 C illustrate the calculation of modulation contrast at the frequency 3.75 mm ⁇ 1 in Geometries I, II, and III. This frequency is below the detector alias frequency (5.88 mm ⁇ 1 ).
Landscapes
- Health & Medical Sciences (AREA)
- Life Sciences & Earth Sciences (AREA)
- Engineering & Computer Science (AREA)
- Medical Informatics (AREA)
- General Health & Medical Sciences (AREA)
- Physics & Mathematics (AREA)
- Pathology (AREA)
- Nuclear Medicine, Radiotherapy & Molecular Imaging (AREA)
- Radiology & Medical Imaging (AREA)
- Heart & Thoracic Surgery (AREA)
- Veterinary Medicine (AREA)
- High Energy & Nuclear Physics (AREA)
- Biophysics (AREA)
- Biomedical Technology (AREA)
- Optics & Photonics (AREA)
- Molecular Biology (AREA)
- Surgery (AREA)
- Animal Behavior & Ethology (AREA)
- Public Health (AREA)
- Dentistry (AREA)
- Oral & Maxillofacial Surgery (AREA)
- Chemical & Material Sciences (AREA)
- Analytical Chemistry (AREA)
- Biochemistry (AREA)
- General Physics & Mathematics (AREA)
- Immunology (AREA)
- Human Computer Interaction (AREA)
- Pulmonology (AREA)
- Theoretical Computer Science (AREA)
- Apparatus For Radiation Diagnosis (AREA)
Abstract
Description
N t =N x +N y−1, (4)
where Nx is the number of projections along the x direction and Ny is the number of projections along the bisecting mid-line.
{right arrow over (OO′)}=b z K, (5)
where O′ denotes the primed origin (the midpoint of the chest wall side of the detector). For the purpose of this application, bz is taken to vary from bz1 at the start of the scan (n=1) to bz2 at the end of the scan (n=Nt). Also, bz may be assumed to be a linear function of the projection number, so that the increment of translation between each projection is (bz2−bz1)/(Nt−1).
{right arrow over (O′B)}=u 0,1 i+u 0,2 j, (7)
it follows that
where
ξ1 ≡u 0,1 −x FS (11)
ξ2 ≡u 0,2 −y FS (12)
ξ3 ≡b z −z FS. (13)
where the attenuation coefficient (μobj) is taken to vary sinusoidally along the polar angle α (
and where the differential length (ds) along the ray is given by the expression
where
κ1 =C obj·√{square root over (ξ1 2+ξ2 2+ξ3 2)} (23)
κ2=2πf 0[(x FS −x 0)cos α+(y FS −y 0)sin α]. (24)
Eq. (27) illustrates how a middle sum can be used to evaluate this double integral.
where └ ┘ denotes the floor function, which is defined as follows.
└v 1┘≡max{v 2 ∈
Averaging the backprojected signal for all projections at the point (x, y, z) yields the SBP reconstruction.
where x″min and x″max are the integration limits. Assuming that the frequency is measured along the x″ direction, the Fourier transform should peak at the frequencies f″x=±f0 and should be zero elsewhere. The existence of a major peak at another frequency indicates that the input object is not properly resolved. For the purpose of this example, the limits of integration in Eq. (35) are chosen to be −3.125 mm and +3.125 mm. This interval corresponds to 50 cycles of a 8.0 mm−1 input frequency. This frequency is further discussed in Example 3 as an example of a frequency that exceeds the alias frequency of a detector with 0.085 mm pixelation.
| TABLE 1 | ||
| Geometry | Source Motion | Detector Motion |
| I | Linear (x) | None |
| II | Linear (x) | z Direction |
| III | T-Shaped (x and y) | None |
| IV | T-Shaped (x and y) | z Direction |
Claims (24)
Priority Applications (1)
| Application Number | Priority Date | Filing Date | Title |
|---|---|---|---|
| US17/535,131 US11786186B2 (en) | 2016-02-26 | 2021-11-24 | Super-resolution tomosynthesis imaging systems and methods |
Applications Claiming Priority (3)
| Application Number | Priority Date | Filing Date | Title |
|---|---|---|---|
| US201662300290P | 2016-02-26 | 2016-02-26 | |
| US15/443,737 US11185294B2 (en) | 2016-02-26 | 2017-02-27 | Super-resolution tomosynthesis imaging systems and methods |
| US17/535,131 US11786186B2 (en) | 2016-02-26 | 2021-11-24 | Super-resolution tomosynthesis imaging systems and methods |
Related Parent Applications (1)
| Application Number | Title | Priority Date | Filing Date |
|---|---|---|---|
| US15/443,737 Continuation US11185294B2 (en) | 2016-02-26 | 2017-02-27 | Super-resolution tomosynthesis imaging systems and methods |
Publications (2)
| Publication Number | Publication Date |
|---|---|
| US20220160312A1 US20220160312A1 (en) | 2022-05-26 |
| US11786186B2 true US11786186B2 (en) | 2023-10-17 |
Family
ID=59679098
Family Applications (2)
| Application Number | Title | Priority Date | Filing Date |
|---|---|---|---|
| US15/443,737 Active 2037-07-27 US11185294B2 (en) | 2016-02-26 | 2017-02-27 | Super-resolution tomosynthesis imaging systems and methods |
| US17/535,131 Active US11786186B2 (en) | 2016-02-26 | 2021-11-24 | Super-resolution tomosynthesis imaging systems and methods |
Family Applications Before (1)
| Application Number | Title | Priority Date | Filing Date |
|---|---|---|---|
| US15/443,737 Active 2037-07-27 US11185294B2 (en) | 2016-02-26 | 2017-02-27 | Super-resolution tomosynthesis imaging systems and methods |
Country Status (1)
| Country | Link |
|---|---|
| US (2) | US11185294B2 (en) |
Families Citing this family (7)
| Publication number | Priority date | Publication date | Assignee | Title |
|---|---|---|---|---|
| US11185294B2 (en) * | 2016-02-26 | 2021-11-30 | The Trustees Of The University Of Pennsylvania | Super-resolution tomosynthesis imaging systems and methods |
| KR102072684B1 (en) * | 2018-02-07 | 2020-02-03 | 주식회사 뷰웍스 | A Mammography Device |
| US10692184B2 (en) * | 2018-07-05 | 2020-06-23 | SVXR, Inc. | Super-resolution X-ray imaging method and apparatus |
| DE202019101293U1 (en) * | 2018-10-25 | 2019-05-28 | Universität Zürich Prorektorat Forschung | Portable rail system for producing cross-sectional images using conventional X-ray equipment |
| US11692951B2 (en) * | 2021-02-24 | 2023-07-04 | GE Precision Healthcare LLC | System and method for specimen imaging using an existing mammography imaging system |
| CN113892959B (en) * | 2021-09-26 | 2024-03-26 | 有方(合肥)医疗科技有限公司 | X-ray imaging system |
| US12094080B2 (en) | 2022-09-13 | 2024-09-17 | Shanghai United Imaging Intelligence Co., Ltd. | System and method for magnifying an image based on trained neural networks |
Citations (22)
| Publication number | Priority date | Publication date | Assignee | Title |
|---|---|---|---|---|
| JPH10314161A (en) | 1997-05-15 | 1998-12-02 | Ge Yokogawa Medical Syst Ltd | Double density interpolation method and x-ray ct device |
| US20020110303A1 (en) * | 2001-02-09 | 2002-08-15 | Werkheiser Arthur H. | Electro-optical transducer |
| US20020176540A1 (en) | 2001-05-16 | 2002-11-28 | Fuji Photo Film Co., Ltd. | Method of and apparatus for taking radiation images |
| US20050175143A1 (en) | 2002-06-03 | 2005-08-11 | Osamu Miyazaki | Multi-slice x-ray ct device |
| US20050226369A1 (en) | 2004-03-11 | 2005-10-13 | Peter Martin | Digital x-ray tomosynthesis system |
| US20100067822A1 (en) | 2005-01-19 | 2010-03-18 | U.S. Government As Represented By The Secretary Of The Army | System and method of super-resolution imaging from a sequence of translated and rotated low-resolution images |
| US7817773B2 (en) | 2007-01-05 | 2010-10-19 | Dexela Limited | Variable speed three-dimensional imaging system |
| US20110026667A1 (en) | 2008-03-31 | 2011-02-03 | Koninklijke Philips Electronics N.V. | Fast tomosynthesis scanner apparatus and ct-based method based on rotational step-and-shoot image acquistion without focal spot motion during continuous tube movement for use in cone-beam volume ct mammography imaging |
| US20110069812A1 (en) | 2009-09-24 | 2011-03-24 | Fujifilm Corporation | Radiation imaging apparatus |
| US20110155660A1 (en) | 2006-05-12 | 2011-06-30 | Mickols William E | Modified membrane |
| US20110255660A1 (en) | 2008-12-22 | 2011-10-20 | Omron Corporation | X-ray inspection method and x-ray inspection apparatus |
| US20120014498A1 (en) | 2010-07-16 | 2012-01-19 | Fujifilm Corporation | Radiographic imaging apparatus, method and program |
| WO2012077694A1 (en) | 2010-12-10 | 2012-06-14 | 株式会社 日立メディコ | X-ray ct device and image reconstitution method |
| US8233690B2 (en) | 2008-04-30 | 2012-07-31 | Real-Time Tomography, Llc | Dynamic tomographic image reconstruction and rendering on-demand |
| US8391581B2 (en) | 2007-12-27 | 2013-03-05 | Omron Corporation | X-ray inspecting apparatus and X-ray inspecting method |
| US8509512B2 (en) | 2009-01-08 | 2013-08-13 | Omron Corporation | Examination method, examination apparatus and examination program |
| WO2014011681A2 (en) | 2012-07-09 | 2014-01-16 | The Trustees Of The Universtiy Of Pennsylvania | Super-resolution tomosynthesis imaging systems and methods |
| US20140294138A1 (en) * | 2011-10-19 | 2014-10-02 | Siemens Aktiengesellschaft | Out of plane artifact reduction in digital breast tomosynthesis and ct |
| US20160042537A1 (en) | 2013-03-15 | 2016-02-11 | Real Time Tomography, Llc | Enhancements for displaying and viewing tomosynthesis images |
| US20160302742A1 (en) * | 2013-12-04 | 2016-10-20 | The Trustees Of The University Of Pennsylvania | Dynamic four-dimensional contrast enhanced tomosynthesis |
| US20170055927A1 (en) * | 2015-08-31 | 2017-03-02 | General Electric Company | Iterative X-Ray Imaging Optimization Method And System |
| US11185294B2 (en) * | 2016-02-26 | 2021-11-30 | The Trustees Of The University Of Pennsylvania | Super-resolution tomosynthesis imaging systems and methods |
-
2017
- 2017-02-27 US US15/443,737 patent/US11185294B2/en active Active
-
2021
- 2021-11-24 US US17/535,131 patent/US11786186B2/en active Active
Patent Citations (23)
| Publication number | Priority date | Publication date | Assignee | Title |
|---|---|---|---|---|
| JPH10314161A (en) | 1997-05-15 | 1998-12-02 | Ge Yokogawa Medical Syst Ltd | Double density interpolation method and x-ray ct device |
| US20020110303A1 (en) * | 2001-02-09 | 2002-08-15 | Werkheiser Arthur H. | Electro-optical transducer |
| US20020176540A1 (en) | 2001-05-16 | 2002-11-28 | Fuji Photo Film Co., Ltd. | Method of and apparatus for taking radiation images |
| US20050175143A1 (en) | 2002-06-03 | 2005-08-11 | Osamu Miyazaki | Multi-slice x-ray ct device |
| US20050226369A1 (en) | 2004-03-11 | 2005-10-13 | Peter Martin | Digital x-ray tomosynthesis system |
| US20100067822A1 (en) | 2005-01-19 | 2010-03-18 | U.S. Government As Represented By The Secretary Of The Army | System and method of super-resolution imaging from a sequence of translated and rotated low-resolution images |
| US20110155660A1 (en) | 2006-05-12 | 2011-06-30 | Mickols William E | Modified membrane |
| US7817773B2 (en) | 2007-01-05 | 2010-10-19 | Dexela Limited | Variable speed three-dimensional imaging system |
| US8391581B2 (en) | 2007-12-27 | 2013-03-05 | Omron Corporation | X-ray inspecting apparatus and X-ray inspecting method |
| US20110026667A1 (en) | 2008-03-31 | 2011-02-03 | Koninklijke Philips Electronics N.V. | Fast tomosynthesis scanner apparatus and ct-based method based on rotational step-and-shoot image acquistion without focal spot motion during continuous tube movement for use in cone-beam volume ct mammography imaging |
| US8233690B2 (en) | 2008-04-30 | 2012-07-31 | Real-Time Tomography, Llc | Dynamic tomographic image reconstruction and rendering on-demand |
| US20110255660A1 (en) | 2008-12-22 | 2011-10-20 | Omron Corporation | X-ray inspection method and x-ray inspection apparatus |
| US8509512B2 (en) | 2009-01-08 | 2013-08-13 | Omron Corporation | Examination method, examination apparatus and examination program |
| US20110069812A1 (en) | 2009-09-24 | 2011-03-24 | Fujifilm Corporation | Radiation imaging apparatus |
| US20120014498A1 (en) | 2010-07-16 | 2012-01-19 | Fujifilm Corporation | Radiographic imaging apparatus, method and program |
| WO2012077694A1 (en) | 2010-12-10 | 2012-06-14 | 株式会社 日立メディコ | X-ray ct device and image reconstitution method |
| US20140294138A1 (en) * | 2011-10-19 | 2014-10-02 | Siemens Aktiengesellschaft | Out of plane artifact reduction in digital breast tomosynthesis and ct |
| WO2014011681A2 (en) | 2012-07-09 | 2014-01-16 | The Trustees Of The Universtiy Of Pennsylvania | Super-resolution tomosynthesis imaging systems and methods |
| US9743891B2 (en) | 2012-07-09 | 2017-08-29 | The Trustees Of The University Of Pennsylvania | Super-resolution tomosynthesis imaging systems and methods |
| US20160042537A1 (en) | 2013-03-15 | 2016-02-11 | Real Time Tomography, Llc | Enhancements for displaying and viewing tomosynthesis images |
| US20160302742A1 (en) * | 2013-12-04 | 2016-10-20 | The Trustees Of The University Of Pennsylvania | Dynamic four-dimensional contrast enhanced tomosynthesis |
| US20170055927A1 (en) * | 2015-08-31 | 2017-03-02 | General Electric Company | Iterative X-Ray Imaging Optimization Method And System |
| US11185294B2 (en) * | 2016-02-26 | 2021-11-30 | The Trustees Of The University Of Pennsylvania | Super-resolution tomosynthesis imaging systems and methods |
Non-Patent Citations (22)
| Title |
|---|
| Abstract of Disclosure 16-78114 Modeling Acquisition Geometries with Improved Super-Resolution in Digital Breast Tomosynthesis, dated Oct. 30, 2015, 1 page. |
| Acciavatti et al., "Calculation of OTF, NPS, and DQE for Oblique X-Ray Incidence on Turbid Granular Phosphors", 2010, LNCS 6136, pp. 436-443. |
| Acciavatti et al., "Investigating the Potential for Super-Resolution in Digital Breast Tomosynthesis", University of Pennsylvania—Mar. 2016, 12 pages. |
| Acciavatti et al., "Modeling Acquisition Geometries with Improved Super-Resolution in Digital Breast Tomosynthesis", Perelman School of Medicine at the University of Pennsylvania—Mar. 2016, 12 pages. |
| Acciavatti et al., "Observation of Super-Resolution in Digital Breast Tomosynethesis", Med. Phys. vol. 39, No. 12, Dec. 2012—pp. 7518-7539. |
| Acciavatti et al., "Optimization of phosphor-based dectector design for oblique x-ray incidence in digital breast tomosynthesis", Med. Phys. vol. 38, No. 11, Nov. 2011—pp. 6188-6202. |
| Acciavatti et al., "Optimizing the Acquisition Geometry for Digital Breast Tomosynthesis Using Defrise Phantom", Medical Imaging 2014: Physics of Medical Imaging, edited by Bruce R. Whiting, Christoph Hoeschen, Despina Kontos, Proc. of SPIE, 2014, vol. 9033—12 pages. |
| Acciavatti et al., "Proposing an Acquisition Geometry that Optimizes Super-Resolution in Digital Breast Tomosynthesis", 2012, LNCS 7361, pp. 386-393. |
| Badano et al., "Oblique incidence effects in direct x-ray detectors: A first-order approximation using a physics-based analytical model", Med. Phys., vol. 38, No. 4, Apr. 2011—5 pages. |
| Dziok et al., "Certain results for a class of convex functions related to a shell-like curve connected with Fibonacci numbers", Computer and Mathematics with Applications, vol. 61 (2011) pp. 2605-2613. |
| Freed et al., "A fast angle-dependent, analytical model of Csl detector response for optimization of 3D x-ray breast imaging systems" Med. Phys. vol. 37, No. 6, Jun. 2010, pp. 2593-2605. |
| Friedwald et al., "Breast Cancer screening using tomosynthesis in combination with digital mammography", JAMA, 2014; vol. 311, No. 24, pp. 2499-2507. |
| International Search Report and Written Opinion for International Application No. PCT/US2013/049789, dated Dec. 30, 2013, 8 pages. |
| Kuo et al., "Dynamic reconstruction and rendering of 3D Tomosynthesis images", Med. Imaging 2011: Physics of Medical Imaging, Proc. of SPIE, vol. 7961, 72014,—11 pages. |
| Lee et al., "Improved imaging performance of a 14 x 17-inch Direct Radiograph tm System using Se/TFT detector", Proc. of SPIE, vol. 3336, Medical Imaging 1998: Physics of Medical Imaging, (May 1998)—pp. 14-23. |
| Maidment et al., "Construction of a prototype digital breast tomosynthesis system with superior spatial resolution", powerpoint presentation, University of Pennsylvania, 2012—27 pages. |
| Mazin et al., "Fourier rebinning algorithm for inverse geometry CT", Med. Phys. vol. 35, No. 11, Nov. 2008—pp. 4857-4862. |
| Pokrajac et al., "Optimized generation of high resolution breast anthropomorphic software phantoms", Med. Phys., vol. 39, No. 4, Apr. 2012—pp. 2290-2302. |
| Poplack et al., "Digital breast Tomosynthesis: Initial experience in 96 women with abnormal digital screening mammography", AJR: 189, Sep. 2007—pp. 616-623. |
| Rafferty et al., "Assessing radiologist performance using combined digital mammography and breast Tomosynthesis compared with digital mammography alone: Results of a multicenter, multireader trial", radiology.rsna.org, Radiology vol. 266, No. 1—Jan. 2013—pp. 104-113. |
| Rafferty, E., "Tomosynthesis: New weapon in breast cancer fight", http://www.axisimagingnews.com/2004/04/tomosynthesis-new-weapon-in-breast-cancer-fight, 2004—2 pages. |
| Zhao et al., "Three-Dimensional linear system analysis for breast tomosynthesis", Med. Phys. vol. 35, No. 12, Dec. 2008—pp. 5219-5232. |
Also Published As
| Publication number | Publication date |
|---|---|
| US20220160312A1 (en) | 2022-05-26 |
| US11185294B2 (en) | 2021-11-30 |
| US20170245810A1 (en) | 2017-08-31 |
Similar Documents
| Publication | Publication Date | Title |
|---|---|---|
| US11786186B2 (en) | Super-resolution tomosynthesis imaging systems and methods | |
| US7142633B2 (en) | Enhanced X-ray imaging system and method | |
| US8938111B2 (en) | Computed tomography imaging process and system | |
| US9743891B2 (en) | Super-resolution tomosynthesis imaging systems and methods | |
| US7711087B2 (en) | Patient setup using tomosynthesis techniques | |
| US8798353B2 (en) | Apparatus and method for two-view tomosynthesis imaging | |
| US7844094B2 (en) | Systems and methods for determining geometric parameters of imaging devices | |
| US7561659B2 (en) | Method for reconstructing a local high resolution X-ray CT image and apparatus for reconstructing a local high resolution X-ray CT image | |
| CN1575762B (en) | Linear track based digital tomosynthesis system and method | |
| US8005184B2 (en) | Ultra low radiation dose X-ray CT scanner | |
| JP6091507B2 (en) | Determination of deflection of compression elements based on images | |
| US8781064B2 (en) | Apparatus and method for non-rotational computer tomography | |
| US8964933B2 (en) | X-ray computed tomography apparatus, medical image processing apparatus, X-ray computed tomography method, and medical image processing method | |
| JP4342164B2 (en) | Computed tomography equipment | |
| JP2005021675A (en) | Tomograph apparatus | |
| JP2007512034A (en) | Image reconstruction method for divergent beam scanner | |
| CN114067013A (en) | System and method for reprojection and backprojection via a homographic resampling transform | |
| CN107249465B (en) | Tomographic imaging device and method for sparse angular sampling | |
| CN105979875A (en) | Generating a breast parameter map | |
| KR102387403B1 (en) | Projection data correction method for truncation artifact reduction | |
| US6778629B1 (en) | Computed tomography method involving a helical relative motion | |
| Kulkarni et al. | Monte-Carlo simulation of a slot-scanning digital mammography system for tomosynthesis | |
| Bolton | Automated 3D reconstruction of Lodox Statscan images for forensic application | |
| JP2017176384A (en) | Radiographic apparatus, radiographic system, radiographic method, and program | |
| Yoon et al. | A fast and accurate tomosynthesis simulation model |
Legal Events
| Date | Code | Title | Description |
|---|---|---|---|
| FEPP | Fee payment procedure |
Free format text: ENTITY STATUS SET TO UNDISCOUNTED (ORIGINAL EVENT CODE: BIG.); ENTITY STATUS OF PATENT OWNER: SMALL ENTITY |
|
| FEPP | Fee payment procedure |
Free format text: ENTITY STATUS SET TO SMALL (ORIGINAL EVENT CODE: SMAL); ENTITY STATUS OF PATENT OWNER: SMALL ENTITY |
|
| AS | Assignment |
Owner name: THE TRUSTEES OF THE UNIVERSITY OF PENNSYLVANIA, PENNSYLVANIA Free format text: ASSIGNMENT OF ASSIGNORS INTEREST;ASSIGNORS:MAIDMENT, ANDREW D.A.;ACCIAVATTI, RAYMOND J.;REEL/FRAME:058391/0964 Effective date: 20161209 Owner name: REAL TIME TOMOGRAPHY, LLC, PENNSYLVANIA Free format text: ASSIGNMENT OF ASSIGNORS INTEREST;ASSIGNORS:NG, SUSAN;RINGER, PETER A.;KUO, JOHNNY;SIGNING DATES FROM 20170427 TO 20170505;REEL/FRAME:058392/0037 |
|
| STPP | Information on status: patent application and granting procedure in general |
Free format text: DOCKETED NEW CASE - READY FOR EXAMINATION |
|
| STPP | Information on status: patent application and granting procedure in general |
Free format text: NON FINAL ACTION MAILED |
|
| STPP | Information on status: patent application and granting procedure in general |
Free format text: NOTICE OF ALLOWANCE MAILED -- APPLICATION RECEIVED IN OFFICE OF PUBLICATIONS |
|
| STPP | Information on status: patent application and granting procedure in general |
Free format text: PUBLICATIONS -- ISSUE FEE PAYMENT VERIFIED |
|
| STCF | Information on status: patent grant |
Free format text: PATENTED CASE |