US11733161B2 - Method of determining concentration of subject based on fraction bound measurement - Google Patents
Method of determining concentration of subject based on fraction bound measurement Download PDFInfo
- Publication number
- US11733161B2 US11733161B2 US16/907,728 US202016907728A US11733161B2 US 11733161 B2 US11733161 B2 US 11733161B2 US 202016907728 A US202016907728 A US 202016907728A US 11733161 B2 US11733161 B2 US 11733161B2
- Authority
- US
- United States
- Prior art keywords
- subject
- concentration
- fraction bound
- optical
- signal
- Prior art date
- Legal status (The legal status is an assumption and is not a legal conclusion. Google has not performed a legal analysis and makes no representation as to the accuracy of the status listed.)
- Active, expires
Links
Images


Classifications
-
- G—PHYSICS
- G01—MEASURING; TESTING
- G01N—INVESTIGATING OR ANALYSING MATERIALS BY DETERMINING THEIR CHEMICAL OR PHYSICAL PROPERTIES
- G01N21/00—Investigating or analysing materials by the use of optical means, i.e. using sub-millimetre waves, infrared, visible or ultraviolet light
- G01N21/17—Systems in which incident light is modified in accordance with the properties of the material investigated
- G01N21/55—Specular reflectivity
- G01N21/552—Attenuated total reflection
- G01N21/553—Attenuated total reflection and using surface plasmons
- G01N21/554—Attenuated total reflection and using surface plasmons detecting the surface plasmon resonance of nanostructured metals, e.g. localised surface plasmon resonance
-
- G—PHYSICS
- G01—MEASURING; TESTING
- G01N—INVESTIGATING OR ANALYSING MATERIALS BY DETERMINING THEIR CHEMICAL OR PHYSICAL PROPERTIES
- G01N21/00—Investigating or analysing materials by the use of optical means, i.e. using sub-millimetre waves, infrared, visible or ultraviolet light
- G01N21/62—Systems in which the material investigated is excited whereby it emits light or causes a change in wavelength of the incident light
- G01N21/63—Systems in which the material investigated is excited whereby it emits light or causes a change in wavelength of the incident light optically excited
- G01N21/65—Raman scattering
- G01N21/658—Raman scattering enhancement Raman, e.g. surface plasmons
-
- G—PHYSICS
- G01—MEASURING; TESTING
- G01N—INVESTIGATING OR ANALYSING MATERIALS BY DETERMINING THEIR CHEMICAL OR PHYSICAL PROPERTIES
- G01N21/00—Investigating or analysing materials by the use of optical means, i.e. using sub-millimetre waves, infrared, visible or ultraviolet light
- G01N21/75—Systems in which material is subjected to a chemical reaction, the progress or the result of the reaction being investigated
- G01N21/76—Chemiluminescence; Bioluminescence
-
- G—PHYSICS
- G01—MEASURING; TESTING
- G01N—INVESTIGATING OR ANALYSING MATERIALS BY DETERMINING THEIR CHEMICAL OR PHYSICAL PROPERTIES
- G01N21/00—Investigating or analysing materials by the use of optical means, i.e. using sub-millimetre waves, infrared, visible or ultraviolet light
- G01N21/75—Systems in which material is subjected to a chemical reaction, the progress or the result of the reaction being investigated
- G01N21/77—Systems in which material is subjected to a chemical reaction, the progress or the result of the reaction being investigated by observing the effect on a chemical indicator
-
- G—PHYSICS
- G01—MEASURING; TESTING
- G01N—INVESTIGATING OR ANALYSING MATERIALS BY DETERMINING THEIR CHEMICAL OR PHYSICAL PROPERTIES
- G01N33/00—Investigating or analysing materials by specific methods not covered by groups G01N1/00 - G01N31/00
- G01N33/48—Biological material, e.g. blood, urine; Haemocytometers
- G01N33/50—Chemical analysis of biological material, e.g. blood, urine; Testing involving biospecific ligand binding methods; Immunological testing
- G01N33/53—Immunoassay; Biospecific binding assay; Materials therefor
-
- G—PHYSICS
- G01—MEASURING; TESTING
- G01N—INVESTIGATING OR ANALYSING MATERIALS BY DETERMINING THEIR CHEMICAL OR PHYSICAL PROPERTIES
- G01N21/00—Investigating or analysing materials by the use of optical means, i.e. using sub-millimetre waves, infrared, visible or ultraviolet light
- G01N21/75—Systems in which material is subjected to a chemical reaction, the progress or the result of the reaction being investigated
- G01N21/77—Systems in which material is subjected to a chemical reaction, the progress or the result of the reaction being investigated by observing the effect on a chemical indicator
- G01N2021/7769—Measurement method of reaction-produced change in sensor
- G01N2021/7789—Cavity or resonator
-
- G—PHYSICS
- G01—MEASURING; TESTING
- G01N—INVESTIGATING OR ANALYSING MATERIALS BY DETERMINING THEIR CHEMICAL OR PHYSICAL PROPERTIES
- G01N2201/00—Features of devices classified in G01N21/00
- G01N2201/06—Illumination; Optics
- G01N2201/062—LED's
Definitions
- the following embodiments relate to a method of determining a concentration of a subject and, more particularly, to a method of determining a concentration of a subject based on fraction bound measurement.
- the measurement of the concentration of a subject based on fraction bound measurement is a scheme being actively used in various fields.
- a surface plasmon resonance resonator or a whispering gallery mode (WGM) resonator being actively researched as optical sensors, after a ligand is fixed to a surface of an optical device, when a subject to be detected reacts to the ligand fixed to the surface, the concentration and dynamic characteristic of the subject are analyzed using a fraction bound based on an optical signal measured through the reaction.
- WGM whispering gallery mode
- the existing method of determining a concentration based on fraction bound measurement adopts a method of reacting, with ligands, a reference sample whose concentration is already known and a sample whose concentration is to be known, respectively, and determining a relative concentration by comparing initial reaction velocities through separate measurements.
- a concentration can be determined only when the measurement of a signal at the initial step of a reaction is successful. The determination of the concentration is impossible if corresponding timing is missed. At the initial step of a reaction, it is difficult to measure a concentration due to the arrangement of an optical part or device for measurement.
- WGM whispering gallery mode
- the WGM refers to a specific resonance mode contained within a resonator having a smooth edge, such a sphere or disk, due to continuous and internal total reflection.
- a detection event is monitored based on a change in the WGM resonant frequency which occurs as the length of the optical path of a photon circulating in the resonator is increased when a specific molecule is combined with a surface.
- a fundamental limit to hinder the development of a practical WGM sensor device chiefly results from a light coupling method based on evanescent coupling in which a waveguide must have proper physical dimensions in order to satisfy a phase matching condition.
- a waveguide must have proper physical dimensions in order to satisfy a phase matching condition.
- a tapered optical fiber that is, a waveguide commonly used for coupling, is unstable mechanically, and has a difficulty in being combined with a microfluidic channel.
- a bus waveguide uniformly implemented in a resonator chip is very robust, but requires significant micro manufacture precision in order to control the gap and additional efforts for implementing proper optical coupling at the end of the waveguide, such as end-fire coupling.
- a WGM sensor based on an optical active resonator has emerged as a promising alternative.
- a pump light exposed at the top of the optical active resonator induces an emission spectrum peak along with a resonance mode, which is detected by a spectrometer through a free space optical system.
- a sensor system can be significantly simplified in a practical form because a direct physical contact for driving an optical device is not necessary.
- the detection of a specific molecule has recently been proved in a chip integrated with a fusion channel based on the approach method.
- a polymer microcavity doped with laser dyes is used in the active resonator.
- the active resonator needs to be pumped using a high pulse laser (86 nJ/pulse), and sensitivity thereof is maintained lower than common sensitivity expected in the WGM resonator sensor.
- a silicon-rich silicon nitride (SRSN) microcavity in which a silicon nano-clusters functions as an active compound was proposed. The detection of a molecule in the air was proved based on the microcavity, but an actual sensor platform integrated with a microfluidic channel and the real-time detection of a specific molecule based on the actual sensor platform has not yet been proved.
- SRSN silicon-rich silicon nitride
- Embodiments are related to a method of determining a concentration of a subject based on fraction bound measurement and, more particularly, providing a fast and efficient technology capable of determining a relative concentration of a sample based on a comparison with a reference signal through only one signal measurement at any reaction timing in addition to an initial stage.
- embodiments provide a method of determining a concentration of a subject based on fraction bound measurement, which enables accurate measurement by offsetting an external factor that may affect experiment results through the simultaneous measurement of a reference signal and a sample signal.
- a method of determining a concentration of a subject based on fraction bound measurement may include fixing a ligand to a surface of an optical device, measuring a fraction bound of a subject to be detected based on an optical signal when the subject reacts to the ligand fixed to the surface of the optical device, and determining a relative value of a concentration of the subject based on a ratio of measured values of the fraction bounds of the subject and a reference signal.
- Measuring the fraction bound of the subject based on the optical signal may include measuring the fraction bound of the subject indicative of the number of ligands combined with the subject against a total number of the ligands.
- Measuring the fraction bound of the subject based on the optical signal may include analyzing the fraction bound through a Langmuir model in an environment in which the ligand has been fixed to the surface of the optical device.
- Determining a relative value of a concentration of the subject may include determining the relative value of the concentration of the subject based on a ratio of measured values of fraction bounds of the subject and reference signal defined in each step of the reaction when the subject reacts to the ligand fixed to the surface of the optical device.
- Determining a relative value of a concentration of the subject may include determining the relative value of the concentration of the subject based on a ratio of measured values of fraction bounds of the subject and reference signal defined in an initial step, intermediate step and saturation step of the reaction.
- the ratio of the measured values of the fraction bounds of the subject and reference signal in the intermediate step may have a middle value between the ratio of the measured values of the fraction bounds of the subject and reference signal in the initial step and the ratio of the measured values of the fraction bounds of the subject and reference signal in the saturation step.
- the relative concentration of the subject may be determined based on a comparison with the reference signal through only one signal measurement at any reaction timing by determining the relative value of the concentration of the subject based on the ratio of the measured values of the fraction bounds of the subject and reference signal.
- Measuring a fraction bound of the subject based on the optical signal may include measuring the fraction bound of the reference signal and measuring the fraction bound of the subject.
- Measuring a fraction bound of the subject based on the optical signal may include simultaneously measuring the fraction bound of the reference signal and the fraction bound of the subject in such a way as to enable accurate measurement by offsetting external factors capable of affecting experiments.
- Measuring the fraction bound of the subject based on the optical signal may include simultaneously measuring signals of a plurality of samples in an identical condition in such a way as to enable accurate measurement by offsetting external factors which may affect experiments.
- the method further includes fabricating an optical active resonator used as the optical device in the fraction bound measurement.
- Fabricating the optical active resonator may include forming silicon nano-clusters within a plurality of silicon nitride disk plates and disposing the plurality of silicon nitride disk plates in such a way as to be spaced apart from each other at a given interval to form a nano-slot.
- Photoluminescence (PL) may be emitted by only top pump beam radiation through absorption cross sections of the silicon nano-clusters.
- the method further includes radiating a pump beam of a single light-emitting diode (LED) over the optical active resonator for the fraction bound measurement.
- the PL may be emitted by only top pump beam radiation of the single LED through the absorption cross sections of the silicon nano-clusters.
- an apparatus for determining a concentration of a subject based on fraction bound measurement may include a setup unit configured to fix a ligand to a surface of an optical device, a fraction bound measurement unit configured to measure a fraction bound of a subject to be detected based on an optical signal when the subject reacts to the ligand fixed to the surface of the optical device, and a concentration determination unit configured to determine a relative value of a concentration of the subject based on a ratio of measured values of the fraction bounds of the subject and a reference signal.
- the fraction bound measurement unit may measure the fraction bound of the subject indicative of the number of ligands combined with the subject against a total number of the ligands.
- the fraction bound measurement unit may analyze the fraction bound through a Langmuir model in an environment in which the ligand may have been fixed to the surface of the optical device.
- the concentration determination unit may determine the relative value of the concentration of the subject based on a ratio of measured values of fraction bounds of the subject and reference signal defined in each step of the reaction when the subject reacts to the ligand fixed to the surface of the optical device.
- the concentration determination unit may determine the relative value of the concentration of the subject based on a ratio of measured values of fraction bounds of the subject and reference signal defined in an initial step, intermediate step and saturation step of the reaction.
- the ratio of the measured values of the fraction bounds of the subject and reference signal in the intermediate step may have a middle value between the ratio of the measured values of the fraction bounds of the subject and reference signal in the initial step and the ratio of the measured values of the fraction bounds of the subject and reference signal in the saturation step.
- the concentration determination unit may determine the relative concentration of the subject based on a comparison with the reference signal through only one signal measurement at any reaction timing by determining the relative value of the concentration of the subject based on the ratio of the measured values of the fraction bounds of the subject and reference signal.
- the fraction bound measurement unit simultaneously may measure the fraction bound of the reference signal and the fraction bound of the subject in such a way as to enable accurate measurement by offsetting external factors which may affect experiments.
- FIG. 1 A illustrates an example of a fraction bound measurement method based on an optical resonator according to an embodiment.
- FIG. 1 B illustrates an example of a fraction bound signal measured for each concentration according to an embodiment.
- FIG. 2 is a flowchart illustrating a method of determining a concentration of a subject based on fraction bound measurement according to an embodiment.
- FIG. 3 is a block diagram illustrating an apparatus for determining a concentration of a subject based on fraction bound measurement according to an embodiment.
- FIG. 4 A illustrates an image of the scanning electron microscope (SEM) of a 12 ⁇ m disk resonator according to an embodiment.
- FIG. 4 B is a partially enlarged view of FIG. 4 A and illustrates two disks and a 25 nm slot according to an embodiment.
- FIG. 4 C is a diagram illustrating an on-chip sensor according to an embodiment.
- FIG. 5 is a diagram for describing an optical active resonator according to an embodiment.
- FIG. 6 is a flowchart illustrating a method of fabricating the optical active resonator according to an embodiment.
- FIG. 7 is a diagram for describing a laser pump-based optical active resonator according to an embodiment.
- FIG. 8 is a diagram for describing an LED pump-based optical active resonator according to an embodiment.
- FIG. 9 A illustrates resonance modes measured by the photodetector according to an embodiment.
- FIG. 9 B illustrates shifts of resonance modes attributable to a reaction between a subject and a ligand according to an embodiment.
- FIG. 10 A illustrates fraction bounds of actual measured streptavidin for each concentration according to an embodiment.
- FIG. 10 B illustrates fraction bounds for each concentration in the saturation state of the reaction according to an embodiment.
- FIG. 10 C illustrates an error rate graph of concentrations determines in the method of measuring a concentration based on the ratio of the reference signal and the sample signal according to an embodiment.
- FIG. 10 D illustrates that a method of measuring a concentration based on the ratio of a reference signal and a sample signal has been applied to actual experiments according to an embodiment.
- FIG. 11 is a diagram for describing the configuration of a top pump configuration including an LED according to an embodiment.
- FIG. 12 is a diagram illustrating signals measured by the spectrometer according to an embodiment.
- FIG. 13 A illustrates the PL spectrum of the SRSN resonator pumped by a single LED in an air environment according to an embodiment.
- FIG. 13 B illustrates resonant frequencies of the SRSN resonator when glycerol diluted at the three different concentrations was serially injected into the microfluidic channel according to an embodiment.
- the following embodiments relate to a method of determining a concentration of a subject based on fraction bound measurement, and provide a fast and efficient method capable of determining a relative concentration of a sample. If the method is used, a concentration can be determined based on a comparison with a reference signal through only one signal measurement at any reaction timing in addition to an initial stage. Furthermore, the following embodiments provide a method capable of accurately measuring a concentration by offsetting an external factor which may affect experiment results through the simultaneous measurement of a reference signal and a sample signal.
- FIG. 1 A illustrates an example of a fraction bound measurement method based on an optical resonator.
- FIG. 1 B illustrates an example of a fraction bound signal measured for each concentration.
- a fraction bound based on an optical signal may be measured as illustrated in FIG. 1 B .
- a concentration and dynamic characteristic of the subject may be analyzed using the measured fraction bound based on the optical signal.
- a surface plasmon resonance resonator or a whispering gallery mode (WGM) resonator may be used as the optical device.
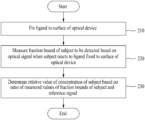
- FIG. 2 is a flowchart illustrating a method of determining a concentration of a subject based on fraction bound measurement according to an embodiment.
- the method of determining a concentration of a subject based on fraction bound measurement may include the step 210 of fixing a ligand to a surface of an optical device, the step 220 of measuring a fraction bound of a subject to be detected based on an optical signal when the subject reacts to the ligand fixed to the surface of the optical device, and the step 230 of determining a relative value of a concentration of the subject based on the ratio of measured values of the fraction bounds of the subject and a reference signal.
- the method of determining a concentration of a subject based on fraction bound measurement may further include the step of fabricating an optical active resonator used as the optical device in the fraction bound measurement. Furthermore, the method may further include the step of radiating the pump beam of a single LED over an optical active resonator for the fraction bound measurement.
- a method of determining a concentration of a subject based on fraction bound measurement is described more specifically below.
- the method of determining a concentration of a subject based on fraction bound measurement may be described more specifically by taking an apparatus for determining a concentration of a subject based on fraction bound measurement as an example.
- FIG. 3 is a block diagram illustrating an apparatus 300 for determining a concentration of a subject based on fraction bound measurement according to an embodiment.
- the apparatus 300 for determining a concentration of a subject based on fraction bound measurement may include a setup unit 310 , a fraction bound measurement unit 320 and a concentration determination unit 330 .
- the apparatus may further include an optical active resonator fabrication unit and a light emitting diode (LED) radiation unit.
- LED light emitting diode
- the setup unit 310 may fix a ligand to a surface of an optical device.
- a photodetector such as a surface plasmon resonance resonator or a WGM resonator
- the optical device may be an optical active resonator.
- the optical active resonator may include a silicon nitride disk plate and a silicon nano-clusters, and may further include a nano-slot. Such an optical active resonator is described in detail below.
- the fraction bound measurement unit 320 may measure a fraction bound of the subject based on an optical signal.
- the fraction bound measurement unit 320 may measure the fraction bound of the subject, indicating the number of ligands combined with the subject against a total number of ligands.
- the fraction bound measurement unit 320 may analyze the fraction bound of the subject through a Langmuir model in an environment in which the ligand has been fixed to the surface of the optical device.
- the sample signal may mean a fraction bound measurement signal of a subject.
- Detection performed in an environment in which a ligand has been fixed to a surface of an optical device may be analyzed through the Langmuir model.
- a fraction bound “fb” is a value proportional to a signal and may be represented as in the following equation.
- the step of measuring, by the fraction bound measurement unit 320 , the fraction bound of the subject based on the optical signal may include the step of measuring a fraction bound of a reference signal and the step of measuring a fraction bound of the subject.
- the fraction bound measurement unit 320 may measure the fraction bound of the reference signal and the fraction bound of the subject at the same time in such a way as to enable accurate measurement by offsetting external factors which may affect experiments.
- the fraction bound measurement unit 320 may measure signals of a plurality of samples at the same time in the same condition in such a way as to enable accurate measurement by offsetting external factors which may affect experiments.
- signals of several samples may be measured at the same time in the same condition.
- external factors e.g., temperature change and pre-processing state
- This has an effect in that a signal is filtered by offsetting common noise in a differential amplifier.
- the concentration determination unit 330 may determine a relative value of the concentration of the subject based on the ratio of measured values of the fraction bounds of the subject and the reference signal. More specifically, when the subject reacts to the ligand fixed to the surface of the optical device, the concentration determination unit 330 may determine a relative value of the concentration of the subject based on the ratio of measured values of the fraction bounds of the subject and reference signal defined in each step of the reaction. For example, the concentration determination unit 330 may determine a relative value of the concentration of the subject based on the ratio of measured values of the fraction bounds of the subject and reference signal defined in each of the initial step, intermediate step and saturation step of the reaction.
- the ratio of measured values of the fraction bounds of the subject and reference signal in the intermediate step may have a middle value between the ratio of measured values of the fraction bounds of the subject and reference signal in the initial step and the ratio of measured values of the fraction bounds of the subject and reference signal in the saturation step.
- the concentration determination unit 330 determines a relative value of the concentration of the subject based on the ratio of measured values of the fraction bounds of the subject and reference signal as described above, the concentration determination unit 330 can determine a relative concentration of the subject based on a comparison with the reference signal through only one signal measurement at any reaction timing.
- the ratio of the reference signal and the sample signal may be defined as R(t), and may be represented as in the following equation.
- R(t) In each step of the reaction, R(t) may be defined as follows.
- R(t) may be defined as in the following equation.
- R(t) may be defined as in the following equation.
- R(t) may be defined as in the following equation.
- R(t) has a middle value between R(t) in the initial state and R(t) in the saturation state.
- the reason for this is that R(t) is a monotone function (R′(t) ⁇ 0 or R′(t)>0)
- a relative value of the concentration can be determined based on the value R(t). That is, the concentration can be determined based on a comparison between the signals through one measurement at any timing. Furthermore, an error rate can be determined based on the determined concentration through an error rate graph.
- the method proposed through embodiments is fast and efficient because a concentration can be determined through one measurement.
- a concentration can be determined at any time without being limited to reaction timing.
- a measured error rate can also be determined based on the measured concentration. Accordingly, an experiment design for more accurate concentration measurement is possible.
- a reference sample and a subject sample signal can be measured at the same time. Accordingly, more accurate measurement is possible because a change attributable to external factors (e.g., temperature change and pre-processing state) which may affect a measured signal can be offset.
- the apparatus may further include the optical active resonator fabrication unit and the LED radiation unit.
- the optical active resonator fabrication unit may fabricate an optical active resonator used as an optical device in fraction bound measurement.
- the step of fabricating, by the optical active resonator fabrication unit, an optical active resonator includes the step of forming silicon nano-clusters within a plurality of silicon nitride disk plates and a step in which the plurality of silicon nitride disk plates are spaced apart from each other at a given interval to form nano-slots.
- PL can be emitted by only top pump beam radiation through an absorption cross section of the silicon nano-clusters.
- the LED radiation unit may radiate the pump beam of a single LED over the optical active resonator for fraction bound measurement. Accordingly, PL can be emitted by only the top pump beam radiation of the single LED through the absorption cross section of the silicon nano-clusters.
- the nano-slot can focus a resonance mode within the optical active resonator, and may be filled with a medium including a material to be detected, which has a lower refractive index than the silicon nitride disk plate. This is described in detail below.
- An optical resonator-based sensor has a high quality factor and high sensitivity because it has a simple structure and can contain light within the resonator for a long time. As a result, the sensor has an advantage in that it has a low limit of detection, that is, a quantitative index of sensor performance.
- the optical resonator-based sensor can perform detection without labeling which may cause physical or chemical distortion because the detection is performed according to a mechanism based on an interaction between light and a subject. Furthermore, the optical resonator-based sensor can monitor whether a material is present and a change of a concentration in real time. A signal measured by the sensor can be converted into an electronic signal.
- a major cause may include the evanescent field coupling system of the optical resonator.
- the evanescent field coupling system is expensive, requires a wavelength-variable laser having a large volume, and also requires an optical waveguide for optically coupling laser light into the optical resonator.
- a nanooptical fiber is an optical waveguide commonly used in such applications.
- the nanooptical fiber can perform optical coupling by only control of a location of several tens of nanometers based on expensive equipment, such as a piezo stage.
- an optical coupling system based on a nanooptical fiber becomes a major cause to make impossible an on-chip device implementation because mechanical coupling with a microfluidic channel is difficult in terms of its structure.
- Such a technology is a complex technology which may be implemented by only a skilled researcher in a limited laboratory environment. For this reason, clinical utilization and commercialization for the optical coupling system are impossible.
- the following embodiments relate to an on-chip sensor device in which an optical active resonator and a microfluidic channel have been combined and a method of fabricating the same, and may provide a whispering gallery mode (WGM) sensor not having labeling, which has been integrated with a microfluidic channel based on an optically active silicon-rich silicon nitride (SRSN) resonator having a nano-slot structure.
- WGM whispering gallery mode
- SRSN optically active silicon-rich silicon nitride
- a proper operation of the developed sensor was limited by real-time measurement for molecule bonding dynamics of a streptavidin-biotin complex that shows a connection ratio of 3 ⁇ 10 ⁇ 4 M ⁇ 1 s ⁇ 1 and a separation constant of 380 nM corresponding to previously reported values.
- An interaction between light and a material has been improved in the nano-slot structure.
- 0.012 nm/nM that is, improved sensitivity of 20 times or more, can be proved through real-time measurement of the streptavidin-biotin complex using the WGM sensor capable of remote reading.
- the concentration of a material to be analyzed can be determined with substantially necessary accuracy through a comparison with a concentration reference known as a single measurement using a newly proposed detection method similar to balanced detection.
- setup complexity and a cost can be significantly reduced by providing the detection of a whispering gallery mode (WGM) using an LED as a pump source for the first time.
- WGM whispering gallery mode
- a photodetector for fraction bound measurement and a method of fabricating the same are described below.
- FIG. 4 is a diagram illustrating an example of an on-chip sensor device in which an optical active resonator and a microfluidic channel have been combined. More specifically, FIG. 4 A illustrates an image of the scanning electron microscope (SEM) of a 12 ⁇ m disk resonator. FIG. 4 B is a partially enlarged view of FIG. 4 A and illustrates two disks and a 25 nm slot. FIG. 4 C is a diagram illustrating an on-chip sensor. In this case, the fabricated disk resonator has been integrated with a micro fluid channel.
- SEM scanning electron microscope
- the fabricated resonator is located in a polydimetylsiloxane (PDMS) microfluidic channel having a height of 270 ⁇ m, a width of 3 mm, and a length of 8 mm as illustrated in FIG. 4 C , and may be prepared using the existing soft lithography scheme.
- PDMS polydimetylsiloxane
- FIG. 5 is a diagram for describing an optical active resonator according to an embodiment.
- the optical active resonator 500 may include silicon nitride disk plates 510 and silicon nano-clusters 520 , and may further include a nano-slot 530 .
- One or more silicon nitride disk plates 510 may be configured. Particularly, a plurality of silicon nitride disk plates 510 may be spaced apart from each other at a given interval.
- the silicon nano-clusters 520 may be formed within the silicon nitride disk plates 510 .
- Such silicon nano-clusters 520 may be formed by depositing an SRSN material on the silicon nitride disk plate 510 through a semiconductor process and heating the SRSN material.
- efficient PL can be emitted through absorption cross sections of the silicon nano-clusters 520 by only top pump beam radiation.
- the silicon nano-clusters 520 may be introduced into the optical active resonator 500 .
- the silicon nano-cluster 520 may be formed by heating the SRSN material at a high temperature (e.g., 1200° C.).
- the nano-slot 530 may be formed by disposing a plurality of the silicon nitride disk plates 510 so that they are spaced apart from each other at a given interval. For example, two silicon nitride disk plates 510 may be disposed in a nanoscale distance in parallel to form the nano-slot 530 .
- the nano-slot 530 can focus a resonance mode within the optical active resonator 500 , and may be filled with a medium including a material to be detected, which has a lower refractive index than the silicon nitride disk plate 510 .
- two silicon nitride disk plates 510 are disposed to overlap with a gap therebetween.
- Light and a material to be measured can interact with each other within the gap. At this time, light can be absorbed and emitted without a physical contact.
- the optical active resonator may operate in the water by controlling the size. Accordingly, emission efficiency of the optical active resonator can be further improved by optimizing the size.
- a resonance mode of the optical active resonator can be focused on the nano-gap by introducing the nano-gap having a nanometer scale into an optical device.
- the nano-gap having several tens of nanometers may be formed within the optical active resonator so that a resonance mode within the optical active resonator is focused on the nano-gap.
- the results of numerical calculation based on the fabricated structure showed that strong light was focused on the nano-gap.
- PL can be emitted by only the top pump beam radiation of a laser light source through absorption cross sections of the silicon nano-clusters 520 . Moreover, PL can be emitted by only the top pump beam radiation of a single LED through absorption cross sections of the silicon nano-clusters 520 in addition to the laser light source.
- the optical active resonator 500 fabricated as described above can be easily combined with a microfluidic channel and can provide an on-chip sensor not having labeling. That is, an on-chip high-sensitivity optical active resonator 500 combined with the microfluidic channel can be provided.
- the fabricated optical active resonator 500 can be easily combined with the microfluidic channel and developed as an on-chip platform.
- Such an on-chip platform may also be developed as a cheap light source-based sensor platform, such as a single LED, in addition to a laser light source.
- the intensity of an LED is sufficient to excite the WGM of a resonator in a water-soluble environment (in the water), and generates a resonant peak of a PL emission spectrum. Since the emission region of the LED is much greater than that of the resonator, an LED module has only to be positioned at the top of the microfluid chip. Accordingly, measurement setup can be simplified because additional elements, such as a beam splitter, an object lens, and a CCD necessary for the concentrated and precise arrangement of a pump laser and a laser beam, are not necessary.
- the silicon nano-clusters that is, an efficient active medium
- the optical active resonator can be used for actual clinical experiments not laboratory environment and can be easily used by anyone in addition to a skilled person.
- light can be concentrated on the nano-gap by introducing the nano-gap having a nanometer scale into the optical device.
- Very high detection sensitivity compared to the existing resonance mode element within the nano-gap strongly focused on a subject can be secured. For example, upon streptavidin detection, sensitivity is 0.012 nm/nM. This is 20 times higher than the sensitivity of the existing optical active resonator-based sensor.
- FIG. 6 is a flowchart illustrating a method of fabricating the optical active resonator according to an embodiment.
- the method of fabricating an optical active resonator may include the step 610 of forming silicon nano-clusters within a plurality of silicon nitride disk plates and a step 620 in which the plurality of silicon nitride disk plates is spaced apart from each other at a given interval to form a nano-slot.
- Photoluminescence (PL) may be emitted by only top pump beam radiation through absorption cross sections of the silicon nano-clusters.
- the method may further include a step 630 in which the optical active resonator is combined with a microfluidic channel to provide an on-chip sensor not having labeling.
- silicon nano-clusters may be formed within a plurality of silicon nitride disk plates.
- the silicon nano-clusters may be formed by depositing an SRSN material on the silicon nitride disk plates through a semiconductor process and the heating the SRSN material.
- the plurality of silicon nitride disk plates may be spaced apart from each other at a given interval to form a nano-slot.
- the nano-slot can focus a resonance mode within the optical resonator, and may be filled with a medium including a material to be detected, which has a lower refractive index than the silicon nitride disk plates. Accordingly, PL can be emitted by only the top pump beam radiation of a single LED in addition to a laser light source through absorption cross sections of the silicon nano-clusters.
- the optical active resonator may be combined with a microfluidic channel to provide an on-chip sensor not having labeling.
- a tapered fiber is an element widely used for the signal reading of a WGM resonator sensor based on phase matching evanescent coupling.
- an active WGM resonator may be added to a silicon nitride resonator into which the silicon nano-clusters emitting strong light have been inserted in a 700 nm wavelength range in which absorption by water is maintained low.
- efficient absorption of pump lighting is enabled even through an upper lighting method not through a cavity mode through very large absorption cross section of the silicon nano-clusters.
- a nano-slot structure in which two pieces of silicon nitride disk plates are disposed in parallel in a nanoscale distance may be introduced.
- a process of fabricating an actual device may be started by depositing an SRSN film on a silicon substrate through ion beam sputtering whose silicon concentration is controlled by a nitrogen gas. Excess silicon may be changed into silicon nano-clusters by a post-annealing process performed in an argon environment. Such a film preparation condition has been optimized to achieve maximum PL intensity using an Ar pump laser of 20 W/cm 2 in a 457.9 nm wavelength. In order to form a slot structure, a silicon dioxide film was deposited by an ion beam between the SRSN film deposits.
- the disk pattern of a photoresist defined by the existing photolithography along with a contact aligner may be delivered to a hard mask layer of amorphous silicon by the first reactive ion etching (RIE), and may be delivered to an accumulated multi-layer film by the second RIE.
- the amorphous silicon hard mask may be removed by wet etch in a KOH solution, which is performed to undercut silicon at the bottom of the resonator structure.
- the silicon dioxide film may be etched by a buffered oxidation etchant to form a nano-slot between the SRSN disks.
- a device design and fabrication condition can be finely optimized to obtain a high quality coefficient of the optical active resonator under a water-soluble environment essential for measurement in a microfluidic channel using top pumping.
- One embodiment can provide a high-sensitivity SRSN microcavity sensor in a simple and practical form, which has been integrated with a microfluidic channel, by increasing the quality coefficient of a PL emission and water-soluble environment.
- the excitation of a WGM can be measured by a spectrometer through free space optics without an optical component for a direct physical contact.
- An interaction between light and a material can be increased and sensitivity can be increased by embedding, in the microcavity, a nano-slot structure on which a mode field has been focused and in which biomolecular detection is performed.
- the molecular detection action was proved through a streptavidin-biotin complex.
- the WGM is configured in the optical active resonator using an LED pump source for focusing and aligning a laser beam on the optical active resonator by excluding an expensive laser pump source and an optical component from the measurement setup for the first time.
- Such a simple LED-based detection platform may be applied to refractive detection for glycerol diluted in water, causing sensitivity of 226.67 nm/refractive index unit (RIU).
- an interaction between streptavidin and biotin may be measured. Performance of a developed microfluid WGM resonator sensor was verified below by the real-time measurement of a bio-molecule interaction based on a streptavidin-biotin complex whose noncovalent bond is significantly strong.
- the SRSN resonator may be pre-processed using biotin.
- streptavidin of a DPBS flows into a fluid channel
- streptavidin starts to attach biotin on a surface of the optical active resonator.
- Streptavidin that has closely attached biotin on the surface of the resonator may increase the length of an optical path of a resonance mode. Accordingly, a resonance movement may occur because the resonance state of the optical active resonator is changed.
- FIG. 7 is a diagram for describing a laser pump-based optical active resonator according to an embodiment.
- FIG. 7 illustrates the state in which experiments for measuring a resonant frequency movement in real time using the optical active resonator described with reference to FIG. 5 according to an embodiment have been set up.
- a laser light source may be used as a light source. That is, FIG. 7 illustrates an optical setup method and actual setup state for fraction bound measurement based on a photodetector.
- a beam of a 457.9 nm wavelength argon laser 730 may be concentrated on the top of an SRSN resonator 710 through the PDMS wall of a micro microfluidic channel 720 .
- the laser intensity of a focal plane is 20 W/cm 2 and may obtain strong PL emission including a characteristic cavity mode profile by stimulating silicon nano-clusters.
- the PL emission is collected through the side wall of the microfluidic channel 720 by an objective lens 750 (numerical aperture: 0.15).
- a transverse magnetic (TM) polarization component may be selectively captured by a polarity bond.
- Real-time frequency spectra that have reached a spectrometer 780 may show the respective measured TM modes of the SRSN WGM resonator as in FIGS. 9 A and 9 B .
- the TM mode may be selectively measured as a cavity TM mode because the TM mode has a slot structure and can be firmly fixed compared to a TE mode.
- a beam splitter 740 may be configured between the argon laser 730 and the objective lens 750 and between the objective lens 750 and a CCD camera 760 .
- a separate objective lens, a polarizer 770 and the spectrometer 780 may be configured for measurement.
- FIG. 8 is a diagram for describing an LED pump-based optical active resonator according to an embodiment.
- FIG. 8 illustrates the state in which experiments for measuring a resonant frequency movement in real time using the optical active resonator described with reference to FIG. 5 according to an embodiment have been set up.
- An LED laser light source may be used as a light source.
- a beam of an LED light source 830 may be concentrated on the top of an SRSN resonator 810 through the PDMS wall of a microfluidic channel 820 .
- a separate objective lens, a polarizer 840 and a spectrometer 850 may be configured for measurement.
- FIG. 9 is a diagram illustrating TM modes of the SRSN WGM resonator measured using the spectrometer according to an embodiment.
- FIG. 9 A illustrates resonance modes measured by the photodetector.
- Each of basic mode families that belong to many resonance modes illustrated in FIG. 9 A and that are indicated by dots may be distinguished from a high-level mode by comparing the measured free spectral range (FSR) of each mode family with a value estimated by numerical analysis.
- the FSR of a TM basic mode is 7.9 nm and greater than 15,000 calculated in the full width half maximum (FWHM) of a measured PL peak, which corresponds to the resolution limit of the spectrometer.
- FIG. 9 B illustrates shifts of resonance modes attributable to a reaction between a subject and a ligand. A fraction bound may be measured using such a shift.
- the high-level mode disappears in a PL spectrum measured in a water-soluble environment of FIG. 9 B .
- the reason for this is that if a refractive index between the resonator structure and the environment is reduced, a higher level mode and a resonator diameter so that a severe and additional emission loss can be caused selectively (not a basic mode) are carefully selected.
- Such a clear spectrum facilitates analysis because it prevents an overlap between other modes.
- the FSR of the mode is 7.2 nm and is well matched with the FSR of the basic mode in the water-soluble environment estimated by number analysis.
- a mode Q coefficient in the water-soluble condition is about 8,500 and 0.08 nm calculated in the FWHM of a PL peak.
- FIG. 9 B illustrates resonant frequency movements attributable to a bonding event of streptavidin for surface-processed biotin in the form of PL spectra before and after streptavidin having a 144 nM concentration.
- the PL spectrum is measured after the state of a frequency movement is a saturation state.
- a peak shift of 1.72 nm may provide sensitivity of 0.012 nm/nM.
- a resolution limit defined by the FWHM of a resonance mode is about 0.08 nm, and a detection limit of the device is proved as 6.7 nM in the case of streptavidin.
- the sensitivity of the device according to embodiments is 22 times higher than the sensitivity of an active WGM sensor not having direct physical coupling, which was reported before.
- FIGS. 10 A to 10 D are diagram illustrating the real-time peak shifts of resonant wavelengths of a material to be detected according to an embodiment.
- FIG. 10 A illustrates fraction bounds of actual measured streptavidin for each concentration, and illustrates real-time peak shifts of resonant wavelengths continuously measured at intervals of several minutes after four types of concentrations (e.g., 9 nM, 36 nM, 54 nM, and 90 nM) of streptavidin diluted in the DPBS medium were injected into the microfluidic channel.
- concentrations e.g. 9 nM, 36 nM, 54 nM, and 90 nM
- a fraction proportional to a bio sensor signal may be defined as the number of ligands and analysis complexes based on the Langmuir model, and may be divided by a total number of ligands represent in the following equation in a connection step.
- fb ⁇ ( t , c ) fbeq ⁇ ( c ) ⁇ [ 1 - exp ⁇ ( k on obs ⁇ t ) ] ( 7 )
- fbeq ⁇ ( c ) c c + K d ( 8 )
- k on obs c ⁇ k on + k off ( 9 )
- Equation 7 k on obs is a rate constant which may be observed based on an internal combustion relation ratio “kon” and dissociation rate “koff” in addition to “c.”
- Equation 8 fbeq(c) is an equilibrium fraction, c is the concentration of an analysis material, and Kd is a differentiation constant and defined as
- Equation 7 for measured data points.
- Kd, kon and koff can be derived by substituting the two values with Equation 8 and Equation 9 and solving both the equations at the same time.
- Association rates obtained from the suitable curve are 1.2 ⁇ 10 4 M ⁇ 1 s ⁇ 1 , 4.2 ⁇ 10 3 M ⁇ 1 s ⁇ 1 , 3.2 ⁇ 10 3 M ⁇ 1 s ⁇ 1 , and 6.4 ⁇ 10 3 M ⁇ 1 s ⁇ 1 with respect to streptavidin concentrations of 9 nM, 36 nM, 54 nM, and 90 nM, respectively. These are quite matched with the previously reported association rates. A slightly higher association rate of 9 nM streptavidin occurs due to the detection limit of the 0.05 nm ( FIG. 10 A ) spectrometer. This is not sufficient for accurate measurement of a frequency movement attributable to the kinetics of a low concentration.
- Bovine Serum Albumin also flows into the microfluidic channel for 35 minutes through the WGM resonator into which biotin has been processed.
- the BSA is not specially combined with biotin. Accordingly, the BSA induces a much lower frequency movement of 0.25 nm in 1 mg/mL, that is, a concentration several hundreds of times higher than that of streptavidin used in the experiments.
- an initial slope in the association step is linearly proportional to the concentration of the analysis material according to the first rule of Fick. Such a trend evidently appears on the inside of FIG. 10 A .
- a point indicates an initial slope in the association step for each concentration.
- a line indicates a linear suitable value of a data point at which the slope corresponds to the association rate “kon.”
- FIG. 10 A at the final timing, a streptavidin and biotin reaction enters the saturation state.
- a frequency movement is analyzed in detail in FIG. 10 B .
- FIG. 10 B illustrates fraction bounds for each concentration in the saturation state of the reaction.
- a square point indicates a frequency movement in the saturation state according to a streptavidin concentration, and the square points are combined by Equation 8 called a Hill model function indicated by a line.
- an x axis indicates a linear scale.
- a figure within FIG. 10 B illustrates the log scale of the same data. From the drawings, it was experimentally proved that Kd and koff of the streptavidin-biotin complex are 3.8 ⁇ 10 ⁇ 7 M (dotted line in FIG. 10 B ) and 1.4 ⁇ 10-2 s ⁇ 1 , respectively, and are well matched with the previous report based on the function of fbeq(c).
- R(t) corresponds to
- Csample Creference that is, the ratio of the original concentration.
- R(t) may be arranged as
- FIG. 10 C illustrates an error rate graph of concentrations determines in the method of measuring a concentration based on the ratio of the reference signal and the sample signal.
- FIG. 10 C illustrates an error rate graph of concentrations determines in the method of measuring a concentration based on the ratio of the reference signal and the sample signal.
- a maximum error rate increases based on the normalized concentration, information on a maximum concentration equal to or lower than a value on which an unknown concentration can be measured with higher accuracy than a specific error rate can be obtained.
- the standardized concentration of the reference is fixed to 10% of Kd
- a concentration of an unknown analysis material less than 22% of Kd can be measured at an error rate of less than 10% through one measurement at any timing.
- FIG. 10 D illustrates that a method of measuring a concentration based on the ratio of a reference signal and a sample signal has been applied to actual experiments.
- circles and squares indicate peak shift ratios based on the real-time measurement data of FIG. 10 A and are matched with a solid-line trend.
- a point indicates an experiments value
- a line indicates a calculated value.
- Average error rates of measurement data having concentration ratios of 0.4 and 0.6 are 4.2% and 10.9%, respectively.
- Such an experiment value is very close to a maximum error rate of a normalized concentration indicated by the dots in FIG. 10 C .
- a relatively great deviation occurs between measurements and a unique peak shift ratio chiefly due to the inaccuracy of peak shift measurement attributable to a quantized error according to the resolution limit of the spectrometer.
- FIG. 11 is a diagram for describing the configuration of a top pump configuration including an LED according to an embodiment.
- an argon laser that is, the pump supply source of the SRSN resonator may be substituted with a commercialized high-intensity LED that emits light in an absorption wavelength of the silicon nano-clusters due to the high absorption cross sections of the silicon nano-clusters.
- 18 LEDs having a center wavelength 365 nm may be used in the top pump source because the silicon nano-clusters more efficiently absorb UV than a visible ray. If absorption by a fluid channel PDMS wall is neglected, valid intensity of an LED assembly part on a surface of the resonator chip spaced apart from the LED by 4 mm is about 5.6 W/cm 2 .
- the intensity of the LED is smaller than that (20 W/cm 2 ) of the argon laser, but is sufficient to excite the WGM of the resonator in a water-soluble environment, so a resonant peak of an emission spectrum is generated. Since the emission region of the LED is much greater than that of the resonator, the LED is sufficient for arrangement if the LED module has only to be positioned at the top of the microfluid chip. Accordingly, measurement setup can be simplified as indicated outside a dotted line in FIG. 11 because additional elements, such as a beam splitter, an object lens and a CCD that require the intensive and precise arrangement of a pump laser and laser beam, are not necessary.
- FIG. 12 is a diagram illustrating signals measured by the spectrometer according to an embodiment.
- FIG. 12 illustrates the measured signals of the spectrometer before and after a reaction in a simultaneous measurement platform, such as that illustrated in FIG. 11 , and may be represented as in the following equation.
- f 0 that is, a reference signal
- f 1 that is, a sample signal
- FIGS. 13 A and 13 B is a diagram illustrating a PL spectrum of the SRSN resonator and resonant frequencies of the SRSN resonator using the top pump including an LED according to an embodiment.
- FIG. 13 A illustrates the PL spectrum of the SRSN resonator pumped by a single LED in an air environment.
- the FSR and quality coefficient of a TM basic mode are precisely the same as values (9.1 nm and 15,000, respectively) of an argon laser pump.
- mass-detection experiments were performed in which a concentration of a target chemical material uniformly distributed to a medium could be measured by detecting a change in the refractive index.
- Glycerol was diluted at three concentrations of 5%, 10% and 20% in DI (ionization) water.
- the refractive indices of the mixed medium were 1.338, 1.345 and 1.359, respectively, in the DI water 1.331.
- FIG. 13 B A figure within FIG. 13 B illustrates resonant frequencies of the SRSN resonator when glycerol diluted at the three different concentrations was serially injected into the microfluidic channel. Measured wavelengths of resonance are very similar to linear frequency movements of 226.67 nm/RIU that are numerically estimated in COMSOL multi-physics with respect to the TM basic mode indicated in FIG. 13 B . When a resolution limit value of 0.08 nm defined by the FWHM of a resonance mode is considered, the limit of detection for a change of the glycerol concentration is about 0.25%.
- an optically active SRSN resonator sensor integrated with the microfluidic channel has been developed in a practical form free from the existing strict severe connection method dependent on a tapered fiber.
- the sensitivity of the device checked through the real-time measurement of the streptavidin-biotin complex was 0.012 nm/nM, which is 20 times or high compared to the previously reported active WGM sensor not having a physical and direct coupling.
- the nano-slot structure of a 25 nm slot introduced to increase sensitivity does not greatly change a molecule dynamic relation because characteristic parameters, such as kon, koff, and Kd, are identified to be the same as the previously reported values.
- the fast and efficient method capable of calculating a concentration of an analysis material through one measurement at a time based on a relative peak shift for a reference sample. If the method is combined with the LED-based platform, peak shifts of a sample and reference sample can be measured at the same time in single measurement setup as in FIG. 11 .
- a change in the resonant frequency caused by external factors that uniformly affect the resonator, such as a temperature change and a surface pre-processing condition can be automatically offset by a noise offset operation of balanced detection.
- the approach method can open a road on which a cost-efficient on-chip (not having labeling) sensor can be implemented for practical applications capable of operating by single measurement setup for use convenience.
- the aforementioned apparatus may be implemented in the form of a hardware component, a software component or a combination of a hardware component and a software component.
- the apparatus and components described in the embodiments may be implemented using one or more general-purpose computers or special-purpose computers, like a processor, a controller, an arithmetic logic unit (ALU), a digital signal processor, a microcomputer, a field programmable array (FPA), a programmable logic unit (PLU), a microprocessor or any other device capable of executing or responding to an instruction.
- the processor may perform an operating system (OS) and one or more software applications executed on the OS.
- OS operating system
- software applications executed on the OS.
- the processor may access, store, manipulate, process and generate data in response to the execution of software.
- the processor may include a plurality of processing elements and/or a plurality of types of processing elements.
- the processor may include a plurality of processors or a single processor and a single controller.
- a different processing configuration such as a parallel processor, is also possible.
- Software may include a computer program, code, an instruction or a combination of one or more of them and may configure a processor so that it operates as desired or may instruct the processor independently or collectively.
- the software and/or data may be embodied in a machine, component, physical device, virtual equipment or computer storage medium or device of any type in order to be interpreted by the processor or to provide an instruction or data to the processor.
- the software may be distributed to computer systems connected over a network and may be stored or executed in a distributed manner.
- the software and data may be stored in one or more computer-readable recording media.
- the method according to the embodiment may be implemented in the form of a program instruction executable by various computer means and stored in a computer-readable recording medium.
- the computer-readable recording medium may include a program instruction, a data file, and a data structure solely or in combination.
- the program instruction recorded on the recording medium may have been specially designed and configured for the embodiment or may have been known to those skilled in the computer software.
- the computer-readable recording medium includes magnetic media such as a hard disk, a floppy disk and a magnetic tape, optical media such as a CD-ROM and a DVD, magneto-optical media such as a floptical disk, and hardware devices specially configured to store and execute program instructions, such as ROM, RAM, and flash memory, for example.
- Examples of the program instruction may include high-level language code executable by a computer using an interpreter in addition to machine-language code, such as code written by a compiler.
- the embodiments can provide a fast and efficient method of determining a concentration of a subject based on fraction bound measurement, which can determine a relative concentration of a sample based on a comparison with a reference signal through only one signal measurement at any reaction timing in addition to an initial stage.
- the embodiments can provide a method of determining a concentration of a subject based on fraction bound measurement which enables accurate measurement by offsetting an external factor that may affect experiment results through the simultaneous measurement of a reference signal and a sample signal.
Abstract
Description
fb(t,c)=fbeq(c)×[1−exp(−k on obs ·t)]: measured value of photodetector
in the saturation state. In
In an initial condition, R(t) corresponds to
This results in
that is, the ratio of the original concentration. In a full saturation state, R(t) may be arranged as
In a transition period, R(t) is a monotone function, and thus the R(t) value is located between an initial value and a saturation value. That is, the error rate of R(t) according to the ratio of the original concentration defined as
is 0 in the initial state, and monotonically increases up to
that is, a maximum value occurring in the full saturation state. A relative peak shift compared with the reference based on the calculation is measured to prove that the concentration of the analysis material is determined as a constant error rate or less. A maximum error rate obtained using such a method is the function of an analysis material concentration. Accordingly, maximum error rates for the normalized concentrations of the sample and the reference defined as
are illustrated in
Claims (8)
Applications Claiming Priority (3)
| Application Number | Priority Date | Filing Date | Title |
|---|---|---|---|
| KR1020190125916 | 2019-10-11 | ||
| KR10-2019-0125916 | 2019-10-11 | ||
| KR1020190125916A KR102245892B1 (en) | 2019-10-11 | 2019-10-11 | Method for determining the concentration of subject based on fraction bound measurement |
Publications (2)
| Publication Number | Publication Date |
|---|---|
| US20210109096A1 US20210109096A1 (en) | 2021-04-15 |
| US11733161B2 true US11733161B2 (en) | 2023-08-22 |
Family
ID=75382274
Family Applications (1)
| Application Number | Title | Priority Date | Filing Date |
|---|---|---|---|
| US16/907,728 Active 2040-06-24 US11733161B2 (en) | 2019-10-11 | 2020-06-22 | Method of determining concentration of subject based on fraction bound measurement |
Country Status (2)
| Country | Link |
|---|---|
| US (1) | US11733161B2 (en) |
| KR (1) | KR102245892B1 (en) |
Citations (10)
| Publication number | Priority date | Publication date | Assignee | Title |
|---|---|---|---|---|
| US20030162236A1 (en) * | 2001-03-26 | 2003-08-28 | Response Biomedical Corporation | Compensation for variability in specific binding in quantitative assays |
| US6632613B1 (en) * | 1993-06-02 | 2003-10-14 | University Of Utah Research Foundation | Compositions and kits for fluorescence polarization assay of large molecules |
| US20040029293A1 (en) * | 2002-06-07 | 2004-02-12 | Nugent Anthony J. | Automated immunoassay cassette, apparatus and method |
| KR100480340B1 (en) | 2002-11-02 | 2005-03-31 | 한국전자통신연구원 | Apparatus of localized surface plasmon sensor using ordered nano-sized metal structures and method manufacturing the same |
| WO2007071349A1 (en) * | 2005-12-19 | 2007-06-28 | Roche Diagnostics Gmbh | Analytical method and instrument |
| US20070172906A1 (en) | 2005-12-22 | 2007-07-26 | Biosite Incorporated | Latent protein c assays and their uses for diagnosis and/or prognosis in systemic inflammatory response syndromes |
| US20090261269A1 (en) * | 2008-04-18 | 2009-10-22 | Fujifilm Corporation | Optical signal detection method, apparatus, sample cell and kit |
| US20120244554A1 (en) * | 2009-10-30 | 2012-09-27 | Proxentia S.R.L. | Method for the direct measure of molecular interactions by detection of light reflected from multilayered functionalized dielectrics |
| US20140227720A1 (en) * | 2011-06-09 | 2014-08-14 | Quanterix Corporation | Methods of determining a patient's prognosis for recurrence of prostate cancer and/or determining a course of treatment for prostate cancer following a radical prostatectomy |
| US20150247846A1 (en) * | 2014-02-26 | 2015-09-03 | Lamdagen Corporation | Digital lspr for enhanced assay sensitivity |
Family Cites Families (3)
| Publication number | Priority date | Publication date | Assignee | Title |
|---|---|---|---|---|
| KR101486422B1 (en) * | 2008-05-16 | 2015-01-27 | 삼성전자주식회사 | Optical amplifying medium, method of manufacturing the optical amplifying medium, and optical device comprising the optical amplifying medium |
| JP6273107B2 (en) * | 2013-08-02 | 2018-01-31 | デンカ生研株式会社 | Method for enhancing detection light using light reflector in immunochromatography |
| KR101575203B1 (en) * | 2014-11-19 | 2015-12-09 | 한국과학기술원 | Metal nano slots and methods of manufacturing the same |
-
2019
- 2019-10-11 KR KR1020190125916A patent/KR102245892B1/en active IP Right Grant
-
2020
- 2020-06-22 US US16/907,728 patent/US11733161B2/en active Active
Patent Citations (10)
| Publication number | Priority date | Publication date | Assignee | Title |
|---|---|---|---|---|
| US6632613B1 (en) * | 1993-06-02 | 2003-10-14 | University Of Utah Research Foundation | Compositions and kits for fluorescence polarization assay of large molecules |
| US20030162236A1 (en) * | 2001-03-26 | 2003-08-28 | Response Biomedical Corporation | Compensation for variability in specific binding in quantitative assays |
| US20040029293A1 (en) * | 2002-06-07 | 2004-02-12 | Nugent Anthony J. | Automated immunoassay cassette, apparatus and method |
| KR100480340B1 (en) | 2002-11-02 | 2005-03-31 | 한국전자통신연구원 | Apparatus of localized surface plasmon sensor using ordered nano-sized metal structures and method manufacturing the same |
| WO2007071349A1 (en) * | 2005-12-19 | 2007-06-28 | Roche Diagnostics Gmbh | Analytical method and instrument |
| US20070172906A1 (en) | 2005-12-22 | 2007-07-26 | Biosite Incorporated | Latent protein c assays and their uses for diagnosis and/or prognosis in systemic inflammatory response syndromes |
| US20090261269A1 (en) * | 2008-04-18 | 2009-10-22 | Fujifilm Corporation | Optical signal detection method, apparatus, sample cell and kit |
| US20120244554A1 (en) * | 2009-10-30 | 2012-09-27 | Proxentia S.R.L. | Method for the direct measure of molecular interactions by detection of light reflected from multilayered functionalized dielectrics |
| US20140227720A1 (en) * | 2011-06-09 | 2014-08-14 | Quanterix Corporation | Methods of determining a patient's prognosis for recurrence of prostate cancer and/or determining a course of treatment for prostate cancer following a radical prostatectomy |
| US20150247846A1 (en) * | 2014-02-26 | 2015-09-03 | Lamdagen Corporation | Digital lspr for enhanced assay sensitivity |
Non-Patent Citations (4)
| Title |
|---|
| Kim et al., "Luminescent Silicon-Rich Nitride Horizontal Air-Slot Microdisk Resonators for Biosensing", 2016, IEEE Photonics Technology Letters, vol. 28, No. 21 (Year: 2016). * |
| Kim, et al., "Towards next-generation label-free biosensors: recent advances in whispering gallery mode sensors", Lab on a Chip, vol. 17, No. 7, Apr. 2017, pp. 1190-1205. |
| Taniguchi et al., "Detection of antibody-antigen reaction by silicon nitride slot-ring biosensors using protein G", 2016, Optics Communications, 365, pp. 16-23 (Year: 2016). * |
| Vollmer et al., "Whispering-gallery-mode biosensing: label-free detection down to single molecules", 2008, Nature Methods, 5, 591-596 (Year: 2008). * |
Also Published As
| Publication number | Publication date |
|---|---|
| KR102245892B1 (en) | 2021-04-29 |
| KR20210043126A (en) | 2021-04-21 |
| US20210109096A1 (en) | 2021-04-15 |
Similar Documents
| Publication | Publication Date | Title |
|---|---|---|
| US20240053268A1 (en) | Fluorescence-detected assays on microfluidic chips | |
| US7749748B2 (en) | Biosensor using microdisk laser | |
| US8537353B2 (en) | Sensor chip for biological and chemical sensing | |
| US8314935B2 (en) | Target substance-detecting apparatus and target substance-detecting method | |
| US8268637B2 (en) | Label-free biosensors based upon distributed feedback laser | |
| US8094314B2 (en) | Optical sensing based on surface plasmon resonances in nanostructures | |
| US8320718B2 (en) | Optical sensors and methods of making the same | |
| EP2904376B1 (en) | Optical sensor for analyte detection | |
| US7612883B2 (en) | Dynamic plasmonics-enabled signal enhancement, a device comprising the same, and a method using the same | |
| US7915053B2 (en) | Substrate for target substance detecting device, target substance detecting device, target substance detecting apparatus and method using the same, and kit therefor | |
| JP2000516719A (en) | Photodetector | |
| US9176051B2 (en) | Micro-optical element, micro-optical array, and optical sensor system | |
| US8268613B2 (en) | Surface plasmon resonance measuring chip and method of manufacture thereof | |
| SE538896C2 (en) | Device and method for simultaneously measuring the properties of molecular bonds and refractive index of buffer solution | |
| JP2014531595A (en) | System and method for self-contrast detection and imaging of a sample array | |
| KR20090064917A (en) | Fluorescence microscope using surface plasmon resonance | |
| CN110023739A (en) | Liquid based on trapezoidal incidence structure prism incidence type silicon soaks microchannel measuring device and measuring method | |
| Zhou et al. | Development of localized surface plasmon resonance-based point-of-care system | |
| US20200256794A1 (en) | Nanoplasmonic devices and applications thereof | |
| US20070147727A1 (en) | Optical waveguide bio-sensing device | |
| JP2009204476A (en) | Sensing device | |
| US11733161B2 (en) | Method of determining concentration of subject based on fraction bound measurement | |
| KR102245891B1 (en) | Apparatus for on-chip label-free sensors based on the optically active resonators integrated with microfluidic channels and method of manufacturing the same | |
| US7009706B2 (en) | Measuring chip | |
| Pokhriyal et al. | Coupled external cavity photonic crystal enhanced fluorescence |
Legal Events
| Date | Code | Title | Description |
|---|---|---|---|
| FEPP | Fee payment procedure |
Free format text: ENTITY STATUS SET TO UNDISCOUNTED (ORIGINAL EVENT CODE: BIG.); ENTITY STATUS OF PATENT OWNER: SMALL ENTITY |
|
| FEPP | Fee payment procedure |
Free format text: ENTITY STATUS SET TO SMALL (ORIGINAL EVENT CODE: SMAL); ENTITY STATUS OF PATENT OWNER: SMALL ENTITY |
|
| AS | Assignment |
Owner name: KOREA ADVANCED INSTITUTE OF SCIENCE AND TECHNOLOGY, KOREA, REPUBLIC OF Free format text: ASSIGNMENT OF ASSIGNORS INTEREST;ASSIGNORS:LEE, HANSUEK;KIM, YESEUL;REEL/FRAME:053120/0779 Effective date: 20200630 |
|
| STPP | Information on status: patent application and granting procedure in general |
Free format text: DOCKETED NEW CASE - READY FOR EXAMINATION |
|
| STPP | Information on status: patent application and granting procedure in general |
Free format text: NON FINAL ACTION MAILED |
|
| STPP | Information on status: patent application and granting procedure in general |
Free format text: NON FINAL ACTION MAILED |
|
| STPP | Information on status: patent application and granting procedure in general |
Free format text: RESPONSE TO NON-FINAL OFFICE ACTION ENTERED AND FORWARDED TO EXAMINER |
|
| STPP | Information on status: patent application and granting procedure in general |
Free format text: FINAL REJECTION MAILED |
|
| STPP | Information on status: patent application and granting procedure in general |
Free format text: RESPONSE AFTER FINAL ACTION FORWARDED TO EXAMINER |
|
| STPP | Information on status: patent application and granting procedure in general |
Free format text: ADVISORY ACTION MAILED |
|
| STPP | Information on status: patent application and granting procedure in general |
Free format text: DOCKETED NEW CASE - READY FOR EXAMINATION |
|
| STPP | Information on status: patent application and granting procedure in general |
Free format text: NON FINAL ACTION MAILED |
|
| STPP | Information on status: patent application and granting procedure in general |
Free format text: PUBLICATIONS -- ISSUE FEE PAYMENT VERIFIED |
|
| STCF | Information on status: patent grant |
Free format text: PATENTED CASE |