US11720230B2 - Interactive data visualization user interface with hierarchical filtering based on gesture location on a chart - Google Patents
Interactive data visualization user interface with hierarchical filtering based on gesture location on a chart Download PDFInfo
- Publication number
- US11720230B2 US11720230B2 US17/478,815 US202117478815A US11720230B2 US 11720230 B2 US11720230 B2 US 11720230B2 US 202117478815 A US202117478815 A US 202117478815A US 11720230 B2 US11720230 B2 US 11720230B2
- Authority
- US
- United States
- Prior art keywords
- chart
- data
- location
- region
- visual marks
- Prior art date
- Legal status (The legal status is an assumption and is not a legal conclusion. Google has not performed a legal analysis and makes no representation as to the accuracy of the status listed.)
- Active, expires
Links
Images


Classifications
-
- G—PHYSICS
- G06—COMPUTING; CALCULATING OR COUNTING
- G06F—ELECTRIC DIGITAL DATA PROCESSING
- G06F3/00—Input arrangements for transferring data to be processed into a form capable of being handled by the computer; Output arrangements for transferring data from processing unit to output unit, e.g. interface arrangements
- G06F3/01—Input arrangements or combined input and output arrangements for interaction between user and computer
- G06F3/048—Interaction techniques based on graphical user interfaces [GUI]
- G06F3/0481—Interaction techniques based on graphical user interfaces [GUI] based on specific properties of the displayed interaction object or a metaphor-based environment, e.g. interaction with desktop elements like windows or icons, or assisted by a cursor's changing behaviour or appearance
- G06F3/0482—Interaction with lists of selectable items, e.g. menus
-
- G—PHYSICS
- G06—COMPUTING; CALCULATING OR COUNTING
- G06F—ELECTRIC DIGITAL DATA PROCESSING
- G06F3/00—Input arrangements for transferring data to be processed into a form capable of being handled by the computer; Output arrangements for transferring data from processing unit to output unit, e.g. interface arrangements
- G06F3/01—Input arrangements or combined input and output arrangements for interaction between user and computer
- G06F3/048—Interaction techniques based on graphical user interfaces [GUI]
- G06F3/0484—Interaction techniques based on graphical user interfaces [GUI] for the control of specific functions or operations, e.g. selecting or manipulating an object, an image or a displayed text element, setting a parameter value or selecting a range
- G06F3/04842—Selection of displayed objects or displayed text elements
-
- G—PHYSICS
- G06—COMPUTING; CALCULATING OR COUNTING
- G06F—ELECTRIC DIGITAL DATA PROCESSING
- G06F3/00—Input arrangements for transferring data to be processed into a form capable of being handled by the computer; Output arrangements for transferring data from processing unit to output unit, e.g. interface arrangements
- G06F3/01—Input arrangements or combined input and output arrangements for interaction between user and computer
- G06F3/048—Interaction techniques based on graphical user interfaces [GUI]
- G06F3/0484—Interaction techniques based on graphical user interfaces [GUI] for the control of specific functions or operations, e.g. selecting or manipulating an object, an image or a displayed text element, setting a parameter value or selecting a range
- G06F3/04845—Interaction techniques based on graphical user interfaces [GUI] for the control of specific functions or operations, e.g. selecting or manipulating an object, an image or a displayed text element, setting a parameter value or selecting a range for image manipulation, e.g. dragging, rotation, expansion or change of colour
-
- G—PHYSICS
- G06—COMPUTING; CALCULATING OR COUNTING
- G06F—ELECTRIC DIGITAL DATA PROCESSING
- G06F3/00—Input arrangements for transferring data to be processed into a form capable of being handled by the computer; Output arrangements for transferring data from processing unit to output unit, e.g. interface arrangements
- G06F3/01—Input arrangements or combined input and output arrangements for interaction between user and computer
- G06F3/048—Interaction techniques based on graphical user interfaces [GUI]
- G06F3/0484—Interaction techniques based on graphical user interfaces [GUI] for the control of specific functions or operations, e.g. selecting or manipulating an object, an image or a displayed text element, setting a parameter value or selecting a range
- G06F3/04847—Interaction techniques to control parameter settings, e.g. interaction with sliders or dials
-
- G—PHYSICS
- G06—COMPUTING; CALCULATING OR COUNTING
- G06F—ELECTRIC DIGITAL DATA PROCESSING
- G06F3/00—Input arrangements for transferring data to be processed into a form capable of being handled by the computer; Output arrangements for transferring data from processing unit to output unit, e.g. interface arrangements
- G06F3/01—Input arrangements or combined input and output arrangements for interaction between user and computer
- G06F3/048—Interaction techniques based on graphical user interfaces [GUI]
- G06F3/0487—Interaction techniques based on graphical user interfaces [GUI] using specific features provided by the input device, e.g. functions controlled by the rotation of a mouse with dual sensing arrangements, or of the nature of the input device, e.g. tap gestures based on pressure sensed by a digitiser
- G06F3/0488—Interaction techniques based on graphical user interfaces [GUI] using specific features provided by the input device, e.g. functions controlled by the rotation of a mouse with dual sensing arrangements, or of the nature of the input device, e.g. tap gestures based on pressure sensed by a digitiser using a touch-screen or digitiser, e.g. input of commands through traced gestures
- G06F3/04883—Interaction techniques based on graphical user interfaces [GUI] using specific features provided by the input device, e.g. functions controlled by the rotation of a mouse with dual sensing arrangements, or of the nature of the input device, e.g. tap gestures based on pressure sensed by a digitiser using a touch-screen or digitiser, e.g. input of commands through traced gestures for inputting data by handwriting, e.g. gesture or text
-
- G—PHYSICS
- G06—COMPUTING; CALCULATING OR COUNTING
- G06F—ELECTRIC DIGITAL DATA PROCESSING
- G06F40/00—Handling natural language data
- G06F40/10—Text processing
- G06F40/166—Editing, e.g. inserting or deleting
- G06F40/177—Editing, e.g. inserting or deleting of tables; using ruled lines
- G06F40/18—Editing, e.g. inserting or deleting of tables; using ruled lines of spreadsheets
-
- G—PHYSICS
- G06—COMPUTING; CALCULATING OR COUNTING
- G06T—IMAGE DATA PROCESSING OR GENERATION, IN GENERAL
- G06T13/00—Animation
- G06T13/80—2D [Two Dimensional] animation, e.g. using sprites
-
- G—PHYSICS
- G06—COMPUTING; CALCULATING OR COUNTING
- G06F—ELECTRIC DIGITAL DATA PROCESSING
- G06F2203/00—Indexing scheme relating to G06F3/00 - G06F3/048
- G06F2203/048—Indexing scheme relating to G06F3/048
- G06F2203/04808—Several contacts: gestures triggering a specific function, e.g. scrolling, zooming, right-click, when the user establishes several contacts with the surface simultaneously; e.g. using several fingers or a combination of fingers and pen
Definitions
- the disclosed implementations relate generally to data visualization and more specifically to systems, methods, and user interfaces that enable a user to interactively explore and investigate a data set.
- Data visualization is a powerful tool for exploring data sets. Graphical views provide user-friendly ways to visualize and interpret data. However, the task of effectively visualizing databases imposes significant demands on the human-computer interface to the visualization system, especially on a mobile device with a small screen.
- Such methods and interfaces may complement or replace conventional methods for visualizing data.
- Such methods and interfaces reduce the cognitive burden on a user and produce a more efficient human-machine interface.
- For battery-operated devices, such methods and interfaces conserve power and increase the time between battery charges.
- FIG. 1 illustrates a portable multifunction device having a touch screen, in accordance with some implementations.
- FIG. 2 illustrates a multifunction device having a touch-sensitive surface that is separate from the display, in accordance with some implementations.
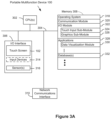
- FIG. 3 A is a block diagram illustrating a portable multifunction device having a touch screen, in accordance with some implementations.
- FIG. 3 B is a block diagram illustrating a multifunction device having a touch-sensitive surface, in accordance with some implementations.
- FIG. 4 is a block diagram of a computing device according to some implementations.
- FIGS. 5 A- 5 I illustrate user interfaces for adjusting data visualization filters, in accordance with some implementations.
- FIGS. 6 A- 6 S illustrate a graphical user interface that provides for interactive hierarchical filtering, in accordance with some implementations.
- FIGS. 7 A- 7 N illustrate a process of adding an additional dimension to a data visualization based on an interaction gesture with an existing data visualization, in accordance with some implementations.
- FIGS. 8 A- 8 M illustrate an alternative animated transition when an additional dimension is added to an existing data visualization, in accordance with some implementations.
- FIGS. 9 A- 9 D illustrate a process of adding an additional measure to a data visualization based on an interaction gesture with an existing data visualization, in accordance with some implementations.
- FIGS. 10 A- 10 C illustrate an animated transition when selecting a different dimension for an existing data visualization, in accordance with some implementations.
- GUIs graphical user interfaces
- a data visualization is referred to as a “chart.”
- a number of different intuitive user interfaces for data visualizations are described below. For example, applying a filter to a data set can be accomplished by a simple touch input on a given portion of a displayed data visualization rather than via a nested menu system.
- the device is a portable communications device, such as a mobile telephone, that also contains other functions, such as PDA and/or music player functions.
- Other portable electronic devices include laptops or tablet computers with touch-sensitive surfaces (e.g., touch screen displays and/or touch pads).
- the device is not a portable communications device, but is a desktop computer with a touch-sensitive surface (e.g., a touch screen display and/or a touch pad).
- a touch-sensitive surface e.g., a touch screen display and/or a touch pad.
- an electronic device that includes a display and a touch-sensitive surface is described. It should be understood, however, that the electronic device optionally includes one or more other physical user-interface devices, such as a physical keyboard, a mouse, a microphone, and/or a joystick.
- FIG. 1 illustrates portable multifunction device 100 having a touch screen 102 , in accordance with some implementations.
- the device 100 is a mobile phone, a laptop computer, a personal digital assistant (PDA), or a tablet computer.
- the touch screen 102 is also sometimes called a touch-sensitive display and/or a touch-sensitive display system.
- the touch screen 102 displays one or more graphics within a user interface (UI).
- UI user interface
- a user is enabled to select one or more of the graphics by making a touch input (e.g., touch input 108 ) on the graphics.
- the touch input is a contact on the touch screen.
- the touch input is a gesture that includes a contact and movement of the contact on the touch screen.
- the gesture optionally includes one or more taps, one or more swipes (from left to right, right to left, upward and/or downward) and/or a rolling of a finger (from right to left, left to right, upward and/or downward) that has made contact with device 100 .
- a touch input may be made with one or more fingers 110 (not drawn to scale in the figure) or one or more styluses 112 (not drawn to scale in the figure).
- selection of one or more graphics occurs when the user breaks contact with the one or more graphics. In some circumstances, inadvertent contact with a graphic does not select the graphic.
- a swipe gesture that sweeps over a visual mark optionally does not select the visual mark when the gesture corresponding to selection is a tap.
- the device 100 includes one or more physical buttons and/or other input/output devices, such as a microphone for verbal inputs.
- FIG. 2 illustrates a multifunction device 200 in accordance with some implementations.
- the device 200 need not be portable.
- the device 200 is a laptop computer, a desktop computer, a tablet computer, or an educational device.
- the device 200 includes a screen 202 and a touch-sensitive surface 204 .
- the screen 202 displays one or more graphics within a UI.
- a user is enabled to select one or more of the graphics by making a touch input (e.g., touch input 210 ) on the touch-sensitive surface 204 such that a corresponding cursor (e.g., the cursor 212 ) on the screen 202 selects the one or more graphics.
- a touch input e.g., touch input 210
- a corresponding cursor e.g., the cursor 212
- the particular user interface element is adjusted in accordance with the detected input.
- FIG. 3 A is a block diagram illustrating a portable multifunction device 100 , in accordance with some implementations. It should be appreciated that the device 100 is only one example of a portable multifunction device. In some implementations, the device 100 has more or fewer components than shown, combines two or more components, or has a different configuration or arrangement of the components.
- the various components shown in FIG. 3 A are implemented in hardware, software, firmware, or a combination of hardware, software, and/or firmware, including one or more signal processing and/or application specific integrated circuits.
- the device 100 includes one or more processing units (CPU's) 302 , an input/output (I/O) subsystem 306 , memory 308 (which optionally includes one or more computer readable storage media), and a network communications interface 310 .
- these components communicate over one or more communication buses or signal lines 304 .
- the communication buses 304 include circuitry (sometimes called a chipset) that interconnects and controls communications between system components.
- the memory 308 includes high-speed random access memory, such as DRAM, SRAM, DDR RAM or other random access solid state memory devices, and may include non-volatile memory, such as one or more magnetic disk storage devices, optical disk storage devices, flash memory devices, or other non-volatile solid state storage devices.
- the memory 308 includes one or more storage devices remotely located from processor(s) 302 .
- the memory 308 or alternately the non-volatile memory device(s) within the memory 308 , comprises a non-transitory computer readable storage medium.
- the software components stored in the memory 308 include an operating system 318 , a communication module 320 , an input/output (I/O) module 322 , and one or more applications 328 (e.g., a data visualization application 422 ).
- one or more of the various modules comprises a set of instructions in memory 308 .
- the memory 308 stores one or more data sets in one or more database(s) 332 .
- the operating system 318 (e.g., Darwin, RTXC, LINUX, UNIX, OS X, WINDOWS, or an embedded operating system such as VxWorks) includes various software components and/or drivers for controlling and managing general system tasks (e.g., memory management, storage device control, power management, etc.) and facilitates communication between various hardware, software, and/or firmware components.
- general system tasks e.g., memory management, storage device control, power management, etc.
- the communication module 320 facilitates communication with other devices over one or more external ports and also includes various software components for handling data received from other devices.
- the I/O module 322 includes a touch input sub-module 324 and a graphics sub-module 326 .
- the touch input sub-module 324 detects touch inputs with touch screen 102 and other touch sensitive devices (e.g., a touchpad or physical click wheel).
- the touch input sub-module 324 includes various software components for performing various operations related to detection of a touch input, such as determining if contact has occurred (e.g., detecting a finger-down event), determining if there is movement of the contact and tracking the movement across the touch-sensitive surface (e.g., detecting one or more finger-dragging events), and determining if the contact has ceased (e.g., detecting a finger-up event or a break in contact).
- the touch input sub-module 324 receives contact data from the touch-sensitive surface (e.g., touch screen 102 ). In some implementations, these operations are applied to single touch inputs (e.g., one finger contacts) or to multiple simultaneous touch inputs (e.g., “multitouch”/multiple finger contacts). In some implementations, the touch input sub-module 324 detects contact on a touchpad.
- the touch input sub-module 324 detects a gesture input by a user. Different gestures on the touch-sensitive surface have different contact patterns. In some implementations, a gesture is detected by detecting a particular contact pattern. For example, detecting a finger tap gesture includes detecting a finger-down event followed by detecting a finger-up (lift off) event at the same position (or substantially the same position) as the finger-down event (e.g., at the position of an data mark). As another example, detecting a finger swipe gesture on the touch-sensitive surface includes detecting a finger-down event followed by detecting one or more finger-dragging events, and subsequently followed by detecting a finger-up (lift off) event.
- the graphics sub-module 326 includes various known software components for rendering and displaying graphics on the touch screen 102 or other display, including components for changing the visual impact (e.g., brightness, transparency, saturation, contrast or other visual property) of graphics that are displayed.
- graphics includes any object that can be displayed to a user, including data visualizations, icons (such as user-interface objects including soft keys), text, digital images, animations, and the like.
- the graphics sub-module 326 stores data representing graphics to be used.
- each graphic is assigned a corresponding code.
- the graphics sub-module 326 receives (e.g., from applications) one or more codes specifying graphics to be displayed along with, if necessary, coordinate data and other graphic property data, and then generates screen image data to output to the display or touch screen.
- the applications 328 include a data visualization module 330 or data visualization application 422 for displaying graphical views of data and one or more other applications.
- Examples of other applications that are optionally stored in the memory 308 include word processing applications, email applications, and presentation applications.
- the data visualization module 330 includes executable instructions for displaying and manipulating various graphical views of data.
- modules and applications corresponds to a set of executable instructions for performing one or more functions described above and the methods described in this application (e.g., the computer-implemented methods and other information processing methods described herein).
- modules i.e., sets of instructions
- the memory 308 stores a subset of the modules and data structures identified above. In some implementations, the memory 308 stores additional modules and data structures not described above.
- FIG. 3 B is a block diagram illustrating a multifunction device 200 , in accordance with some implementations. It should be appreciated that the device 200 is only one example of a multifunction device. In some implementations, the device 200 has more or fewer components than shown, combines two or more components, or has a different configuration or arrangement of the components.
- the various components shown in FIG. 3 B are implemented in hardware, software, or firmware, or a combination of hardware, software, and/or firmware, including one or more signal processing and/or application specific integrated circuits.
- the device 200 typically includes one or more processing units/cores (CPUs) 352 , one or more network or other communications interfaces 362 , memory 350 , an I/O interface 356 , and one or more communication buses 354 for interconnecting these components.
- the communication buses 354 include circuitry (sometimes called a chipset) that interconnects and controls communications between system components.
- the I/O interface 306 includes a screen 202 (also sometimes called a display), a touch-sensitive surface 204 , and one or more sensor(s) 360 (e.g., optical, acceleration, proximity, and/or touch-sensitive sensors).
- the I/O interface 356 includes a keyboard and/or mouse (or other pointing device) 358 .
- the I/O interface 356 couples input/output peripherals on the device 200 , such as the screen 202 , the touch-sensitive surface 204 , other input devices 358 , and one or more sensor(s) 360 , to the CPU(s) 352 and/or the memory 350 .
- the screen 202 provides an output interface between the device and a user.
- the screen 202 displays visual output to the user.
- the visual output includes graphics, text, icons, data marks, and any combination thereof (collectively termed “graphics”).
- some or all of the visual output corresponds to user-interface objects.
- the screen 202 uses LCD (liquid crystal display) technology, LPD (light emitting polymer display) technology, or LED (light emitting diode) technology, although other display technologies are used in other implementations.
- the device 200 includes a touch-sensitive surface 204 (e.g., a touchpad) for detecting touch inputs.
- the touch-sensitive surface 204 accepts input from the user via touch inputs (e.g., the touch input 210 in FIG. 2 ).
- the touch-sensitive surface 204 (along with any associated modules and/or sets of instructions in memory 350 ) detects touch inputs and converts the detected inputs into interaction with user-interface objects (e.g., one or more icons, data marks, or images) that are displayed on the screen 202 .
- user-interface objects e.g., one or more icons, data marks, or images
- a point of contact between the touch-sensitive surface 204 and the user corresponds to a finger of the user.
- the memory 350 includes high-speed random access memory, such as DRAM, SRAM, DDR RAM or other random access solid state memory devices.
- the memory includes non-volatile memory, such as one or more magnetic disk storage devices, optical disk storage devices, flash memory devices, or other non-volatile solid state storage devices.
- the memory 350 includes one or more storage devices remotely located from CPU(s) 352 .
- the software components stored in the memory 350 include an operating system 364 , a communication module 366 , an input/output (I/O) module 368 , and one or more applications 374 (e.g., a data visualization application 422 ).
- one or more of the various modules comprises a set of instructions in the memory 350 .
- the memory 350 stores one or more data sets in one or more database(s) 378 .
- the I/O module 368 includes a touch input sub-module 370 and a graphics sub-module 372 .
- the applications 374 include data visualization module 376 .
- the memory 350 stores programs, modules, and data structures analogous to the programs, modules, and data structures stored in the memory 308 of the portable multifunction device 100 , or a subset thereof. In some implementations, the memory 350 stores additional programs, modules, and data structures not present in the memory 308 of the portable multifunction device 100 . In some implementations, the memory 350 of the device 200 stores drawing, presentation, and word processing applications.
- the device 200 also includes a power system for powering the various components.
- the power system optionally includes a power management system, one or more power sources (e.g., battery, alternating current (AC)), a recharging system, a power failure detection circuit, a power converter or inverter, a power status indicator (e.g., a light-emitting diode (LED)) and any other components associated with the generation, management, and distribution of power in portable devices.
- a power management system e.g., one or more power sources (e.g., battery, alternating current (AC)), a recharging system, a power failure detection circuit, a power converter or inverter, a power status indicator (e.g., a light-emitting diode (LED)) and any other components associated with the generation, management, and distribution of power in portable devices.
- power sources e.g., battery, alternating current (AC)
- AC alternating current
- a recharging system
- Each of the above identified elements in FIG. 3 B is stored in one or more of the previously mentioned memory devices.
- Each of the above identified modules corresponds to a set of instructions for performing a function described above.
- the above identified modules or programs i.e., sets of instructions
- the memory 350 stores a subset of the modules and data structures identified above.
- the memory 350 stores additional modules and data structures not described above.
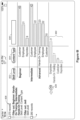
- FIG. 4 is a block diagram illustrating a computing device 400 that can display a graphical user interface for a data visualization application 422 in accordance with some implementations.
- Computing devices 400 include desktop computers, laptop computers, tablet computers, portable multifunction devices 100 , multifunction devices 200 , and other computing devices with a display and a processor capable of running a data visualization application 422 .
- a computing device 400 typically includes one or more processing units/cores (CPUs) 402 for executing modules, programs, and/or instructions stored in the memory 414 and thereby performing processing operations; one or more network or other communications interfaces 404 ; memory 414 ; and one or more communication buses 412 for interconnecting these components.
- the communication buses 412 may include circuitry that interconnects and controls communications between system components.
- a computing device 400 includes a user interface 406 comprising a display device 408 and one or more input devices or mechanisms 410 .
- the input device/mechanism includes a keyboard; in some implementations, the input device/mechanism includes a “soft” keyboard, which is displayed as needed on the display device 408 , enabling a user to “press keys” that appear on the display 408 .
- the display 408 and input device/mechanism 410 comprise a touch screen display (also called a touch sensitive display).
- the memory 414 includes high-speed random access memory, such as DRAM, SRAM, DDR RAM or other random access solid state memory devices.
- the memory 414 includes non-volatile memory, such as one or more magnetic disk storage devices, optical disk storage devices, flash memory devices, or other non-volatile solid state storage devices.
- the memory 414 includes one or more storage devices remotely located from the CPU(s) 402 .
- the memory 414 or alternately the non-volatile memory device(s) within the memory 414 , comprises a non-transitory computer readable storage medium.
- the memory 414 , or the computer readable storage medium of the memory 414 stores the following programs, modules, and data structures, or a subset thereof:
- Each of the above identified executable modules, applications, or set of procedures may be stored in one or more of the previously mentioned memory devices, and corresponds to a set of instructions for performing a function described above.
- the above identified modules or programs i.e., sets of instructions
- the memory 414 stores a subset of the modules and data structures identified above.
- the memory 414 may store additional modules or data structures not described above.
- FIG. 4 shows a computing device 400
- FIG. 4 is intended more as functional description of the various features that may be present rather than as a structural schematic of the implementations described herein. In practice, and as recognized by those of ordinary skill in the art, items shown separately could be combined and some items could be separated.
- Disclosed user interfaces are optionally implemented on a portable multifunction device 100 or device 200 .
- the following examples are shown utilizing a touch screen (e.g., a touch screen 102 ).
- the inputs e.g., finger contacts
- the inputs are detected on a touch-sensitive surface on a device that is distinct from a display on the device.
- finger inputs e.g., finger contacts, finger tap gestures, finger swipe gestures
- one or more of the finger inputs are replaced with input from another input device (e.g., a mouse based input or stylus input).
- a swipe gesture is, optionally, replaced with a mouse click (e.g., instead of a contact) followed by movement of the cursor along the path of the swipe (e.g., instead of movement of the contact).
- a tap gesture is, optionally, replaced with a mouse click while the cursor is located over the location of the tap gesture (e.g., instead of detection of the contact followed by ceasing to detect the contact).
- multiple user inputs it should be understood that multiple computer mice are, optionally, used simultaneously, or a mouse and finger contacts are, optionally, used simultaneously.
- FIGS. 5 A- 5 G illustrate user interfaces for adjusting data visualization filters, in accordance with some implementations.
- FIG. 5 A shows a UI 518 including a category 502 - 1 and a category label 508 - 1 .
- FIG. 5 A also shows a contact 510 detected at a position 510 - a corresponding to the visual mark 504 - 1 for the category 502 - 1 .
- FIG. 5 B shows a UI 520 including the contact 510 detected at a position 510 - b and the visual mark 504 - 1 for category 502 - 1 moving in concert with movement of the contact 510 via an animated transition.
- FIG. 5 A shows a UI 518 including a category 502 - 1 and a category label 508 - 1 .
- FIG. 5 A also shows a contact 510 detected at a position 510 - a corresponding to the visual mark 504 - 1 for the category 502 - 1 .
- FIG. 5 B shows a
- FIG. 5 C shows a UI 522 including the contact 510 detected at a position 510 - c and the visual mark 504 - 1 for the category 502 - 1 continuing to move in concert with movement of the contact 510 via an animated transition.
- FIG. 5 C also shows an indicium 504 indicating that the category 502 - 1 (Catering) is being filtered out of the data as a result of the current action (e.g., the movement of the contact 510 ).
- FIG. 5 D shows a UI 524 including the indicium 504 , the contact 510 detected at a position 510 - d , and the visual mark 504 - 1 for category 502 - 1 continuing to move in concert with movement of the contact 510 via an animated transition.
- FIG. 5 E shows a UI 526 including the indicium 504 and the removal of the visual mark 504 - 1 for the category 502 - 1 from the data visualization.
- FIG. 5 F illustrates the process of returning a data item (Catering) to a displayed data visualization after being previously filtered out.
- the process starts with a contact 510 on the indicium 504 , and the user returns the visual mark 504 - 1 for the category 502 - 1 to the display.
- FIG. 5 F shows a UI 528 including the indicium 504 , and a contact 510 detected at position 510 - e , and the visual mark for category 502 - 1 move in concert with movement of a contact 510 via an animated transition, bringing the visual mark 504 - 1 back to the data visualization.
- FIGS. 5 A- 5 F thus illustrate filtering out or returning an individual visual mark 504 - 1 to a data visualization. Note that multiple marks can be filtered out. In some instances, a user filters out one mark at a time, and may intersperse removing and returning visual marks to the data visualization. Some implementations enable a user to remove or return multiple visual marks simultaneously. In this illustrated implementation, moving a visual mark 504 - 1 to the left removes just that individual item.
- FIGS. 5 G- 5 I illustrate an implementation in which moving a visual mark to the right performs a filtering operation in which only the selected visual mark 504 - 1 is kept.
- FIG. 5 G shows a UI 530 including an indicium 506 , which indicates that the category Catering 502 - 1 is the only category that will be kept.
- the visual marks for the other categories are shown dimmed, providing feedback to the user that they are being filtered out.
- the other category labels 512 are moving to the left.
- the contact 510 is detected at a position 510 - f on the visual mark 504 - 1 .
- the visual mark 504 - 1 does not move; instead, the other visual marks fade out and the other category labels 512 move to the left in concert with movement of a contact 510 via an animated transition.
- FIG. 5 H the user has continued to move the contact 510 to the right, which is now at a position 510 - g .
- the visual mark 504 - 1 for the Catering category has not moved, but the visual marks for the other categories have faded further and the corresponding labels 512 has moved further to the left, in concert with the movement of the contact position 510 .
- the Catering mark 504 - 1 With a little more movement of the contact position, only the Catering mark 504 - 1 remains, as illustrated in FIG. 5 I .
- FIGS. 6 A- 6 S illustrate a graphical user interface that provides for interactive hierarchical filtering, in accordance with some implementations.
- the data set is for a user conference with many individual sessions for people to attend.
- the session has both a skill level 602 and a content type 604 .
- the visual marks represent the number of records 606 for each skill level/content type combination.
- the upper left corner is an indicium 608 of what records are being displayed. Initially, there are 270 records, and none of the records are being filtered out. The user can filter out data in the data visualization, and what is filtered depends on what is selected.
- the interface contact point 610 is on a specific bar, so moving the contact point to the left proceeds to remove just the one selected bar, which represents the hands on training sessions for beginners.
- the bar that is being removed begins to fade as it is removed, as illustrated in FIG. 6 C .
- the indicium 608 is updated to provide the user feedback about the current option.
- the indicium 608 indicates that the beginner hands on training sessions will be filtered out.
- the indicium for the filtering condition remains dimmed until the action is complete.
- FIG. 6 D illustrates completion of the action to filter out beginner hands on training sessions.
- FIG. 6 E the user places the contact position 618 on the hands on training sessions for intermediate users and begins to move the contact position to the left.
- the indicium 608 is updated to indicate that this additional set of sessions is filtered out, as illustrated in FIG. 6 F .
- the user places the contact position 622 on the Empire skill level and begins to move the contact to the left. Because the user has selected a skill level 602 , moving the contact position 624 results in moving out all of the sessions 660 for this skill level, regardless of the content type, as illustrated in FIG. 6 H . As the contact point 626 moves further, the set 660 of sessions continue to move in concert, and in some implementations the visual marks for the set 660 are dimmed, as illustrated in FIG. 6 I . As illustrated in FIGS. 6 I and 6 J , the indicium 608 updates to show the additional filter. In some implementations, filters are displayed differently within the indicium depending on whether the filter applies to a single visual mark or an entire dimension.
- the user places the contact position 630 on the “employee” contact type within the advanced skill level. Because the user has selected a content type rather than an individual data mark, as the user moves the contact position 632 to the left, all three of the data marks 670 are moved in concert with the movement of the contact position. That is the user is filtering out the “employee” contact type, regardless of skill level. As the contact position 634 moves to the left, all three of the visual marks 670 for this contact type are moved in concert to be filtered out, as illustrated in FIG. 6 M . As illustrated in FIG. 6 N , the indicium 608 is updated to show that this content type is being filtered out.
- FIGS. 6 O- 6 S illustrate reversing the process, bringing back the sessions for the “employee” content type.
- the user selects 638 the “employee” content type from the indicium 608 , and moves it to the right, through positions 640 , 642 , and 644 , until the marks for these sessions are back in the data visualization, as shown in FIG. 6 S .
- FIGS. 6 A- 6 S depict a scenario where two dimensions are displayed (Skill Level and Content Type), the same methodology applies when three of more dimensions are displayed.
- a specific data mark is moved, just that one mark is filtered out.
- what is filtered out depends on the dimension selected.
- FIGS. 7 A- 7 N illustrate a process of adding an additional dimension to a data visualization based on an interaction gesture with an existing data visualization, in accordance with some implementations.
- This sequence of illustrations uses the same data set illustrated previously in FIGS. 6 A- 6 S .
- FIG. 7 A provides a user interface showing a bar chart data visualization in which each bar represents the number of records 706 corresponding to each skill level 702 .
- the user initiates an user interface gesture with two contact points 710 moving apart. In some implementations this is referred to as an “unpinch.”
- FIGS. 7 B- 7 D illustrate that as the contact points 710 move apart, a new column 700 opens up.
- the data visualization application 422 identifies the dimensions in the data set and displays the possible dimensions 712 in an initially dimmed display, as illustrated in FIG. 7 E .
- some implementations temporarily display the label “Drill Down” 704 , indicating that the user action is triggering a drill down into the data set.
- One of the possible dimensions 712 is selected and highlighted, as illustrated by the “Content Type” dimension 714 in FIG. 7 F .
- the selection is based on previous selection by the user or a group of user, or other heuristics.
- the selection is random or pseudo random.
- the selection is based on an alphabetical listing of the field names.
- the user can select the dimension from the displayed list.
- FIG. 7 G indicates that the contact points 710 have been released.
- FIG. 7 H indicates that the “Content Type” dimension 714 will be used for the drill down, and an animation begins to move this field upward to form the column header.
- the bars from the bar chart being to split based on this additional dimension, as illustrated in the data visualization region 716 of FIG. 7 H .
- the first bar for beginner sessions is split into four separate bars based on the content type.
- FIG. 7 I continues to illustrate this transition, with the Content Type dimension 714 continuing to move to the header, and the splitting of the bars continuing vertically.
- the former list 712 of dimensions fades out.
- FIG. 7 J illustrates, when the split bars have moved enough vertically, the “content type” labels 720 for each bar are displayed in the new column 700 .
- the “Content Type” label 718 is now displayed in the header of the new column 700 .
- FIGS. 7 K and 7 L illustrate the continued animation of the bars in the data visualization region 716 . In this case, the bars move horizontally to the left so that they will be in a typical position for a bar chart with two dimension levels (“skill level” 702 and “content type” 718 ).
- the smooth animation assists the user in understanding the data, including the splitting of individual bars in one data visualization to multiple sub-bars in a second data visualization.
- FIG. 7 M illustrates a contact 722 being detected at a location over the dimension label for “Content Type” dimension 718 .
- FIG. 7 N shows a menu 724 of dimension options being displayed as a result of the contact 722 being detected.
- the menu 724 includes various dimension options that, if selected, will be displayed in place of the “Content Type” dimension 718 . For example, if a contact is detected at a location over dimension option “Session ID” then, in response, content type dimension 718 will be replaced by the “Session ID” dimension.
- menu 724 in FIG. 7 N displays the dimension label and a plurality of dimension categories for each dimension option.
- the column header “content type” 718 can be switched to another dimension. In some implementations, this can be achieved by doing a horizontal scroll at a contact point on the content type header.
- FIGS. 8 A- 8 M illustrate an alternative animated transition when an additional dimension is added to an existing data visualization, in accordance with some implementations.
- the process begins when a user moves two contact points away from each other in a region where dimensions are displayed (e.g., the dimension “Skill Level”). This opens up a new column 700 as before, but the horizontal bars initially split into distinct bars horizontally, leaving gaps, such as the gap 802 between the third and four splits of the top bar. As the contact points move further apart, the gaps grow wider, as illustrated by the gap 802 in FIG. 8 D . At a certain point in the animation, the bars begin to move vertically downward 804 as well, as illustrated in FIG. 8 E . In some implementations, the vertical motion occurs only after the horizontal splitting is done, but in other implementations, horizontal and vertical motion occur simultaneously.
- a portion of the animation includes just vertical motion 804 .
- the motion of the bars in the animation proceed downward and to the left.
- the bars also begin to expand.
- the top bar expands from its original size 810 -A in FIG. 8 I , to a larger size 810 -B in FIG. 8 J , to an even larger size 810 -C in FIG. 8 K , to its final size 810 -D in FIG. 8 L .
- the expanded sizes utilize more of the available space on the screen.
- the new column header 812 appears, as illustrated in FIG. 8 J .
- the column header 812 is initially dimmed, and shown brighter as the animation progresses.
- the new column header 812 may be selected in various ways, and may be swapped once it has been selected.
- One of skill in the art recognizes that various alternative animations similar to the ones illustrated in FIGS. 7 A- 7 L and 8 A- 8 M are possible based on the specific animations described here.
- FIGS. 9 A- 9 D illustrate a process of adding an additional measure to a data visualization based on an interaction gesture with an existing data visualization, in accordance with some implementations.
- a dimension was added to a data visualization based on a user interaction on the left side of the data visualization.
- the left side displayed a dimension, so opening up a new column 700 created space to insert another dimension.
- FIGS. 9 A- 9 D in contrast, the user opens up a new column 906 on the right hand side of the data visualization, where the measures are being displayed. In this case, opening up a new column displays another measure.
- FIG. 9 A displays a bar chart in which sales amount 904 is displayed for each of the menu items 902 .
- the user establishes two contact points 910 on the right hand side of the data visualization (where the bars are currently displayed), and moves the contact points apart as illustrated by the arrows. As noted previously, this is sometimes referred to as an “unpinch” operation.
- a new column 906 is displayed, which has data for another measure in the data set.
- the data visualization application 422 selects the measure in some way, which can include user preferences, prior selection by the user or a group of users, or other techniques. In some implementations, the new column 906 is shown initially dimmed.
- the data visualization lists the menu items 902 as before, but now shows a first column 904 for the Sales Amount and a second column 906 for the Quantity of sales. Having the two pieces of data can be very useful to compare the number of sales in each category (the quantity) versus the dollar value of those sales. For example, the first row 920 shows that the total sales dollars for catering exceed all of the other menu items, but there were only 8 catering events (which was too small to even show a bar).
- FIGS. 10 A- 10 C illustrate an animated transition when selecting a different dimension for an existing data visualization, in accordance with some implementations.
- FIG. 10 A shows a user interface including a chart with chart dimension 1002 (Hour) and measure 1004 (Sum of Sales Amount).
- FIG. 10 B shows contact 1006 at a position corresponding to chart dimension 1002 and moving to the left.
- FIG. 10 B further shows chart dimension 1002 (Hour) being replaced by chart dimension 1008 (Menu Item) via an animated transition.
- FIG. 10 C shows a resulting chart with chart dimension 1008 (Menu Item) and measure 1004 (Sum of Sales Amount).
- FIGS. 10 B and 10 C also show measure 1004 (Sum of Sales Amount) updating via an animated transition to correspond to chart dimension 1008 (Menu Item).
Abstract
A device displays a chart representing data from a dataset. The chart has a first region displaying labels corresponding to data values of a first data field, a second region displaying labels corresponding to data values of a second data field, and a third region displaying visual marks representing aggregated data corresponding to pairs of data values from the first and second data fields. In response to a user input, the device removes visual marks from the chart. When the input location is the first region, the device removes visual marks in the first chart corresponding to a first data value of the first data field. When the input location is the second region, the device removes visual marks corresponding to a second data value of the second data field. Otherwise, the device removes only one visual mark. This updates the displayed chart.
Description
This application is a continuation of U.S. patent application Ser. No. 16/860,969, filed Apr. 28, 2020, entitled “Interactive Data Visualization User Interface with Gesture-based Data Field Selection,” which is a continuation of U.S. patent application Ser. No. 15/172,052, filed Jun. 2, 2016, entitled “Interactive Data Visualization User Interface with Gesture-Based Data Field Selection,” now U.S. Pat. No. 10,635,262, which is a continuation-in-part of U.S. patent application Ser. No. 14/603,302, filed Jan. 22, 2015, entitled “Methods and Devices for Adjusting Chart Filters,” now U.S. Pat. No. 10,706,597, which claims priority to U.S. Provisional Application No. 62/047,429, filed Sep. 8, 2014, entitled “Methods and Devices for Manipulating Graphical Views of Data,” each of which is hereby incorporated by reference in its entirety. U.S. patent application Ser. No. 15/172,052 further claims priority to U.S. Provisional Application No. 62/221,084, filed Sep. 20, 2015, entitled “Interactive Data Visualization User Interface,” which is hereby incorporated by reference in its entirety.
This application is related to U.S. patent application Ser. No. 15/172,076, filed Jun. 2, 2016, and U.S. patent application Ser. No. 15/172,085, filed Jun. 2, 2016, each of which is hereby incorporated by reference in its entirety.
The disclosed implementations relate generally to data visualization and more specifically to systems, methods, and user interfaces that enable a user to interactively explore and investigate a data set.
Data visualization is a powerful tool for exploring data sets. Graphical views provide user-friendly ways to visualize and interpret data. However, the task of effectively visualizing databases imposes significant demands on the human-computer interface to the visualization system, especially on a mobile device with a small screen.
As computing and networking speeds increase, data visualization that was traditionally performed on desktop computers can also be performed on portable electronic devices, such as smart phones, tablets, and laptop computers. These portable devices typically use touch-sensitive surfaces (e.g., touch screens and/or trackpads) as input devices. These portable devices typically have significantly smaller displays than desktop computers. Thus, additional challenges arise in using touch-sensitive surfaces to manipulate graphical views of data in a user-friendly manner on portable devices.
Consequently, there is a need for faster, more efficient methods and interfaces for manipulating graphical views of data. Such methods and interfaces may complement or replace conventional methods for visualizing data. Such methods and interfaces reduce the cognitive burden on a user and produce a more efficient human-machine interface. For battery-operated devices, such methods and interfaces conserve power and increase the time between battery charges.
The above deficiencies and other problems associated with visualizing data are reduced or eliminated by the disclosed methods, devices, graphical user interfaces, and computer readable storage media. Various implementations of methods, devices, graphical user interfaces, and storage media within the scope of this disclosure and the appended claims each have several aspects, no single one of which is solely responsible for the attributes described herein.
Thus methods, systems, and graphical user interfaces are provided that enable users to more easily and more efficiently analyze data sets.
For a better understanding of the aforementioned implementations of the invention as well as additional implementations thereof, reference should be made to the Description of Implementations below, in conjunction with the following drawings in which like reference numerals refer to corresponding parts throughout the figures.
Reference will now be made in detail to implementations, examples of which are illustrated in the accompanying drawings. In the following detailed description, numerous specific details are set forth in order to provide a thorough understanding of the present invention. However, it will be apparent to one of ordinary skill in the art that the present invention may be practiced without these specific details.
As portable electronic devices become more compact, and the number of functions performed by applications on any given device increase, it has become a significant challenge to design user interfaces that allow users to interact with the applications easily. This challenge is particularly significant for portable devices with smaller screens and/or limited input devices. In addition, data visualization applications need to provide user-friendly ways to explore data in order to enable a user to extract significant meaning from a particular data set. Some application designers have resorted to using complex menu systems to enable a user to perform desired functions. These conventional user interfaces often result in complicated key sequences and/or menu hierarchies that must be memorized by the user and/or that are otherwise cumbersome and/or not intuitive to use.
The methods, devices, and graphical user interfaces (GUIs) described herein make manipulation of data sets and data visualizations more efficient and intuitive for a user. In some instances, a data visualization is referred to as a “chart.” A number of different intuitive user interfaces for data visualizations are described below. For example, applying a filter to a data set can be accomplished by a simple touch input on a given portion of a displayed data visualization rather than via a nested menu system.
Attention is now directed toward implementations of portable devices with touch-sensitive displays. Implementations of electronic devices and user interfaces for such devices are described. In some implementations, the device is a portable communications device, such as a mobile telephone, that also contains other functions, such as PDA and/or music player functions. Other portable electronic devices include laptops or tablet computers with touch-sensitive surfaces (e.g., touch screen displays and/or touch pads). It should also be understood that, in some implementations, the device is not a portable communications device, but is a desktop computer with a touch-sensitive surface (e.g., a touch screen display and/or a touch pad). In the discussion that follows, an electronic device that includes a display and a touch-sensitive surface is described. It should be understood, however, that the electronic device optionally includes one or more other physical user-interface devices, such as a physical keyboard, a mouse, a microphone, and/or a joystick.
The device 100 includes one or more processing units (CPU's) 302, an input/output (I/O) subsystem 306, memory 308 (which optionally includes one or more computer readable storage media), and a network communications interface 310. In some implementations, these components communicate over one or more communication buses or signal lines 304. In some implementations, the communication buses 304 include circuitry (sometimes called a chipset) that interconnects and controls communications between system components.
The memory 308 includes high-speed random access memory, such as DRAM, SRAM, DDR RAM or other random access solid state memory devices, and may include non-volatile memory, such as one or more magnetic disk storage devices, optical disk storage devices, flash memory devices, or other non-volatile solid state storage devices. In some implementations, the memory 308 includes one or more storage devices remotely located from processor(s) 302. The memory 308, or alternately the non-volatile memory device(s) within the memory 308, comprises a non-transitory computer readable storage medium.
In some implementations, the software components stored in the memory 308 include an operating system 318, a communication module 320, an input/output (I/O) module 322, and one or more applications 328 (e.g., a data visualization application 422). In some implementations, one or more of the various modules comprises a set of instructions in memory 308. In some implementations, the memory 308 stores one or more data sets in one or more database(s) 332.
The operating system 318 (e.g., Darwin, RTXC, LINUX, UNIX, OS X, WINDOWS, or an embedded operating system such as VxWorks) includes various software components and/or drivers for controlling and managing general system tasks (e.g., memory management, storage device control, power management, etc.) and facilitates communication between various hardware, software, and/or firmware components.
The communication module 320 facilitates communication with other devices over one or more external ports and also includes various software components for handling data received from other devices.
The I/O module 322 includes a touch input sub-module 324 and a graphics sub-module 326. In some implementations, the touch input sub-module 324 detects touch inputs with touch screen 102 and other touch sensitive devices (e.g., a touchpad or physical click wheel). The touch input sub-module 324 includes various software components for performing various operations related to detection of a touch input, such as determining if contact has occurred (e.g., detecting a finger-down event), determining if there is movement of the contact and tracking the movement across the touch-sensitive surface (e.g., detecting one or more finger-dragging events), and determining if the contact has ceased (e.g., detecting a finger-up event or a break in contact). The touch input sub-module 324 receives contact data from the touch-sensitive surface (e.g., touch screen 102). In some implementations, these operations are applied to single touch inputs (e.g., one finger contacts) or to multiple simultaneous touch inputs (e.g., “multitouch”/multiple finger contacts). In some implementations, the touch input sub-module 324 detects contact on a touchpad.
In some implementations, the touch input sub-module 324 detects a gesture input by a user. Different gestures on the touch-sensitive surface have different contact patterns. In some implementations, a gesture is detected by detecting a particular contact pattern. For example, detecting a finger tap gesture includes detecting a finger-down event followed by detecting a finger-up (lift off) event at the same position (or substantially the same position) as the finger-down event (e.g., at the position of an data mark). As another example, detecting a finger swipe gesture on the touch-sensitive surface includes detecting a finger-down event followed by detecting one or more finger-dragging events, and subsequently followed by detecting a finger-up (lift off) event.
The graphics sub-module 326 includes various known software components for rendering and displaying graphics on the touch screen 102 or other display, including components for changing the visual impact (e.g., brightness, transparency, saturation, contrast or other visual property) of graphics that are displayed. As used herein, the term “graphics” includes any object that can be displayed to a user, including data visualizations, icons (such as user-interface objects including soft keys), text, digital images, animations, and the like. In some implementations, the graphics sub-module 326 stores data representing graphics to be used. In some implementations, each graphic is assigned a corresponding code. The graphics sub-module 326 receives (e.g., from applications) one or more codes specifying graphics to be displayed along with, if necessary, coordinate data and other graphic property data, and then generates screen image data to output to the display or touch screen.
In some implementations, the applications 328 include a data visualization module 330 or data visualization application 422 for displaying graphical views of data and one or more other applications. Examples of other applications that are optionally stored in the memory 308 include word processing applications, email applications, and presentation applications.
In conjunction with the I/O interface 306, including the touch screen 102, the CPU(s) 302, and/or the database(s) 332, the data visualization module 330 includes executable instructions for displaying and manipulating various graphical views of data.
Each of the above identified modules and applications corresponds to a set of executable instructions for performing one or more functions described above and the methods described in this application (e.g., the computer-implemented methods and other information processing methods described herein). These modules (i.e., sets of instructions) need not be implemented as separate software programs, procedures, or modules, and thus various subsets of these modules are, optionally, combined or otherwise re-arranged in various implementations. In some implementations, the memory 308 stores a subset of the modules and data structures identified above. In some implementations, the memory 308 stores additional modules and data structures not described above.
The device 200 typically includes one or more processing units/cores (CPUs) 352, one or more network or other communications interfaces 362, memory 350, an I/O interface 356, and one or more communication buses 354 for interconnecting these components. In some implementations, the communication buses 354 include circuitry (sometimes called a chipset) that interconnects and controls communications between system components.
The I/O interface 306 includes a screen 202 (also sometimes called a display), a touch-sensitive surface 204, and one or more sensor(s) 360 (e.g., optical, acceleration, proximity, and/or touch-sensitive sensors). In some implementations, the I/O interface 356 includes a keyboard and/or mouse (or other pointing device) 358. The I/O interface 356 couples input/output peripherals on the device 200, such as the screen 202, the touch-sensitive surface 204, other input devices 358, and one or more sensor(s) 360, to the CPU(s) 352 and/or the memory 350.
The screen 202 provides an output interface between the device and a user. The screen 202 displays visual output to the user. In some implementations, the visual output includes graphics, text, icons, data marks, and any combination thereof (collectively termed “graphics”). In some implementations, some or all of the visual output corresponds to user-interface objects. In some implementations, the screen 202 uses LCD (liquid crystal display) technology, LPD (light emitting polymer display) technology, or LED (light emitting diode) technology, although other display technologies are used in other implementations.
In addition to the touch screen, the device 200 includes a touch-sensitive surface 204 (e.g., a touchpad) for detecting touch inputs. The touch-sensitive surface 204 accepts input from the user via touch inputs (e.g., the touch input 210 in FIG. 2 ). The touch-sensitive surface 204 (along with any associated modules and/or sets of instructions in memory 350) detects touch inputs and converts the detected inputs into interaction with user-interface objects (e.g., one or more icons, data marks, or images) that are displayed on the screen 202. Commonly, a point of contact between the touch-sensitive surface 204 and the user corresponds to a finger of the user.
The memory 350 includes high-speed random access memory, such as DRAM, SRAM, DDR RAM or other random access solid state memory devices. In some implementations, the memory includes non-volatile memory, such as one or more magnetic disk storage devices, optical disk storage devices, flash memory devices, or other non-volatile solid state storage devices. In some implementations, the memory 350 includes one or more storage devices remotely located from CPU(s) 352. In some implementations, the software components stored in the memory 350 include an operating system 364, a communication module 366, an input/output (I/O) module 368, and one or more applications 374 (e.g., a data visualization application 422). In some implementations, one or more of the various modules comprises a set of instructions in the memory 350. In some implementations, the memory 350 stores one or more data sets in one or more database(s) 378. In some implementations, the I/O module 368 includes a touch input sub-module 370 and a graphics sub-module 372. In some implementations, the applications 374 include data visualization module 376.
In some implementations, the memory 350 stores programs, modules, and data structures analogous to the programs, modules, and data structures stored in the memory 308 of the portable multifunction device 100, or a subset thereof. In some implementations, the memory 350 stores additional programs, modules, and data structures not present in the memory 308 of the portable multifunction device 100. In some implementations, the memory 350 of the device 200 stores drawing, presentation, and word processing applications.
The device 200 also includes a power system for powering the various components. The power system optionally includes a power management system, one or more power sources (e.g., battery, alternating current (AC)), a recharging system, a power failure detection circuit, a power converter or inverter, a power status indicator (e.g., a light-emitting diode (LED)) and any other components associated with the generation, management, and distribution of power in portable devices.
Each of the above identified elements in FIG. 3B is stored in one or more of the previously mentioned memory devices. Each of the above identified modules corresponds to a set of instructions for performing a function described above. The above identified modules or programs (i.e., sets of instructions) need not be implemented as separate software programs, procedures or modules, and thus various subsets of these modules are, optionally, combined or otherwise re-arranged in various implementations. In some implementations, the memory 350 stores a subset of the modules and data structures identified above. In some implementations, the memory 350 stores additional modules and data structures not described above.
In some implementations, the memory 414 includes high-speed random access memory, such as DRAM, SRAM, DDR RAM or other random access solid state memory devices. In some implementations, the memory 414 includes non-volatile memory, such as one or more magnetic disk storage devices, optical disk storage devices, flash memory devices, or other non-volatile solid state storage devices. In some implementations, the memory 414 includes one or more storage devices remotely located from the CPU(s) 402. The memory 414, or alternately the non-volatile memory device(s) within the memory 414, comprises a non-transitory computer readable storage medium. In some implementations, the memory 414, or the computer readable storage medium of the memory 414, stores the following programs, modules, and data structures, or a subset thereof:
-
- an
operating system 416 that includes procedures for handling various basic system services and for performing hardware dependent tasks; - a
communications module 418 that is used for connecting thecomputing device 400 to other computers and devices via the one or more communication network interfaces 404 (wired or wireless) and one or more communication networks, such as the Internet, other wide area networks, local area networks, metropolitan area networks, and so on; - a web browser 420 (or other client application) that enables a user to communicate over a network with remote computers or devices;
- a
data visualization application 422, which provides agraphical user interface 424 for a user to construct visual graphics. A user selects one or more data sources 430 (which may be stored on thecomputing device 400 or stored remotely), selects data fields from the data source(s), and uses the selected fields to define a visual graphic. In some implementations, the information the user provides is stored as avisual specification 428. Thedata visualization application 422 includes a datavisualization generation module 426, which takes the user input (e.g., the visual specification), and generates a corresponding visual graphic. Thedata visualization application 422 then displays the generated graphic in theuser interface 424. In some implementations, thedata visualization application 422 executes as a standalone application (e.g., a desktop application). In some implementations, thedata visualization application 422 executes within theweb browser 420; and - zero or more databases or data sources 430 (e.g., a first data source 430-1 and a second data source 430-2), which are used by the
data visualization application 422. In some implementations, the data sources can be stored as spreadsheet files, CSV files, XML files, flat files, or a relational database.
- an
Each of the above identified executable modules, applications, or set of procedures may be stored in one or more of the previously mentioned memory devices, and corresponds to a set of instructions for performing a function described above. The above identified modules or programs (i.e., sets of instructions) need not be implemented as separate software programs, procedures, or modules, and thus various subsets of these modules may be combined or otherwise re-arranged in various implementations. In some implementations, the memory 414 stores a subset of the modules and data structures identified above. Furthermore, the memory 414 may store additional modules or data structures not described above.
Although FIG. 4 shows a computing device 400, FIG. 4 is intended more as functional description of the various features that may be present rather than as a structural schematic of the implementations described herein. In practice, and as recognized by those of ordinary skill in the art, items shown separately could be combined and some items could be separated.
Disclosed user interfaces are optionally implemented on a portable multifunction device 100 or device 200. The following examples are shown utilizing a touch screen (e.g., a touch screen 102). However, it should be understood that, in some implementations, the inputs (e.g., finger contacts) are detected on a touch-sensitive surface on a device that is distinct from a display on the device. In addition, while the following examples are given primarily with reference to finger inputs (e.g., finger contacts, finger tap gestures, finger swipe gestures), it should be understood that, in some implementations, one or more of the finger inputs are replaced with input from another input device (e.g., a mouse based input or stylus input). For example, a swipe gesture is, optionally, replaced with a mouse click (e.g., instead of a contact) followed by movement of the cursor along the path of the swipe (e.g., instead of movement of the contact). As another example, a tap gesture is, optionally, replaced with a mouse click while the cursor is located over the location of the tap gesture (e.g., instead of detection of the contact followed by ceasing to detect the contact). Similarly, when multiple user inputs are simultaneously detected, it should be understood that multiple computer mice are, optionally, used simultaneously, or a mouse and finger contacts are, optionally, used simultaneously.
In FIG. 6A , the interface contact point 610 is on a specific bar, so moving the contact point to the left proceeds to remove just the one selected bar, which represents the hands on training sessions for beginners. As illustrated in FIGS. 6B and 6C as the contact point reaches position 61 and then 614. In some implementations, the bar that is being removed begins to fade as it is removed, as illustrated in FIG. 6C . The indicium 608 is updated to provide the user feedback about the current option. Here, the indicium 608 indicates that the beginner hands on training sessions will be filtered out. In some implementations, the indicium for the filtering condition remains dimmed until the action is complete. FIG. 6D illustrates completion of the action to filter out beginner hands on training sessions.
In FIG. 6E , the user places the contact position 618 on the hands on training sessions for intermediate users and begins to move the contact position to the left. The indicium 608 is updated to indicate that this additional set of sessions is filtered out, as illustrated in FIG. 6F .
In FIG. 6G , the user places the contact position 622 on the Jedi skill level and begins to move the contact to the left. Because the user has selected a skill level 602, moving the contact position 624 results in moving out all of the sessions 660 for this skill level, regardless of the content type, as illustrated in FIG. 6H . As the contact point 626 moves further, the set 660 of sessions continue to move in concert, and in some implementations the visual marks for the set 660 are dimmed, as illustrated in FIG. 6I . As illustrated in FIGS. 6I and 6J , the indicium 608 updates to show the additional filter. In some implementations, filters are displayed differently within the indicium depending on whether the filter applies to a single visual mark or an entire dimension.
In FIG. 6K , the user places the contact position 630 on the “employee” contact type within the advanced skill level. Because the user has selected a content type rather than an individual data mark, as the user moves the contact position 632 to the left, all three of the data marks 670 are moved in concert with the movement of the contact position. That is the user is filtering out the “employee” contact type, regardless of skill level. As the contact position 634 moves to the left, all three of the visual marks 670 for this contact type are moved in concert to be filtered out, as illustrated in FIG. 6M . As illustrated in FIG. 6N , the indicium 608 is updated to show that this content type is being filtered out.
Although FIGS. 6A-6S depict a scenario where two dimensions are displayed (Skill Level and Content Type), the same methodology applies when three of more dimensions are displayed. When a specific data mark is moved, just that one mark is filtered out. For the other dimensions, what is filtered out depends on the dimension selected.
When the dimensions are independent of each other, the process is as described. In some instances, there are hierarchical dependencies between the dimensions. In some implementations, when there is a hierarchical dependency between the selected dimensions, filtering out a dependent value filters out the dependent value only within its hierarchy.
One of the possible dimensions 712 is selected and highlighted, as illustrated by the “Content Type” dimension 714 in FIG. 7F . In some implementations, the selection is based on previous selection by the user or a group of user, or other heuristics. In some implementations, the selection is random or pseudo random. In some implementations, the selection is based on an alphabetical listing of the field names. In some implementations, the user can select the dimension from the displayed list. FIG. 7G indicates that the contact points 710 have been released.
As FIG. 7J illustrates, when the split bars have moved enough vertically, the “content type” labels 720 for each bar are displayed in the new column 700. In addition, the “Content Type” label 718 is now displayed in the header of the new column 700. FIGS. 7K and 7L illustrate the continued animation of the bars in the data visualization region 716. In this case, the bars move horizontally to the left so that they will be in a typical position for a bar chart with two dimension levels (“skill level” 702 and “content type” 718). The smooth animation assists the user in understanding the data, including the splitting of individual bars in one data visualization to multiple sub-bars in a second data visualization.
In some implementations, the column header “content type” 718 can be switched to another dimension. In some implementations, this can be achieved by doing a horizontal scroll at a contact point on the content type header.
As illustrated in FIGS. 8F and 8G , in some implementations a portion of the animation includes just vertical motion 804. As illustrated in FIGS. 8H and 8I , at a certain point the motion of the bars in the animation proceed downward and to the left. In this animation, once the bars have moved sufficiently apart vertically, the bars also begin to expand. For example, the top bar expands from its original size 810-A in FIG. 8I , to a larger size 810-B in FIG. 8J , to an even larger size 810-C in FIG. 8K , to its final size 810-D in FIG. 8L . The expanded sizes utilize more of the available space on the screen. At some point in the animation, the new column header 812 appears, as illustrated in FIG. 8J . Typically, the column header 812 is initially dimmed, and shown brighter as the animation progresses.
As described above with respect to FIGS. 7A-7L , the new column header 812 may be selected in various ways, and may be swapped once it has been selected. One of skill in the art recognizes that various alternative animations similar to the ones illustrated in FIGS. 7A-7L and 8A-8M are possible based on the specific animations described here.
The terminology used in the description of the invention herein is for the purpose of describing particular implementations only and is not intended to be limiting of the invention. As used in the description of the invention and the appended claims, the singular forms “a,” “an,” and “the” are intended to include the plural forms as well, unless the context clearly indicates otherwise. It will also be understood that the term “and/or” as used herein refers to and encompasses any and all possible combinations of one or more of the associated listed items. It will be further understood that the terms “comprises” and/or “comprising,” when used in this specification, specify the presence of stated features, steps, operations, elements, and/or components, but do not preclude the presence or addition of one or more other features, steps, operations, elements, components, and/or groups thereof.
The foregoing description, for purpose of explanation, has been described with reference to specific implementations. However, the illustrative discussions above are not intended to be exhaustive or to limit the invention to the precise forms disclosed. Many modifications and variations are possible in view of the above teachings. The implementations were chosen and described in order to best explain the principles of the invention and its practical applications, to thereby enable others skilled in the art to best utilize the invention and various implementations with various modifications as are suited to the particular use contemplated.
Claims (20)
1. A method, comprising:
at an electronic device with a display, one or more processors, and memory:
displaying a first chart representing data from a data set, the chart comprising (i) a first region displaying labels corresponding to data values of a first data field in the data set, (ii) a second region displaying labels corresponding to data values of a second data field in the data set, and (iii) a third region displaying a plurality of visual marks, each visual mark representing aggregated data corresponding to a respective pair of data values for the first data field and the second data field;
detecting a first user input at a first location;
determining whether the first location is in the first region, the second region, or the third region;
in response to the first user input, removing one or more of the visual marks from the first chart via an animated transition, wherein the one or more visual marks move in concert with movement of the first user input during at least a portion of the animated transition, including:
in accordance with a determination that the first location is in the first region and a determination that the first location corresponds to a label for a first data value for the first data field, removing all of the visual marks in the first chart that correspond to the first data value;
in accordance with a determination that the first location is in the second region and a determination that the first location corresponds to a label for a second data value for the second data field, removing all of the visual marks in the first chart that correspond to the second data value; and
in accordance with a determination that the location is in the third region and a determination that the location corresponds to a first visual mark, removing only the first visual mark from the first chart; and
updating display of the first chart in accordance with removing the one or more visual marks.
2. The method of claim 1 , wherein the first user input is a drag gesture or a swipe gesture that moves in a first predefined direction.
3. The method of claim 1 , wherein updating display of the first chart includes displaying an indicium that the one or more visual marks have been removed.
4. The method of claim 1 , wherein displaying the first chart includes displaying an indicium of a number of data rows represented in the first chart, and updating display of the first chart includes updating the indicium of the number of data rows represented.
5. The method of claim 1 , further comprising:
after removing the one or more visual marks from the first chart, detecting a second user input at a second location; and
in response to detecting the second user input, returning the one or more visual marks to the first chart.
6. The method of claim 5 , wherein the second location corresponds to display of an indicium that the one or more visual marks have been removed.
7. The method of claim 1 , further comprising:
detecting a second user input at a second location;
determining that the second user input corresponds to a subset of the visual marks; and
removing from the first chart, via a second animated transition, all of the visual marks in the first chart except the subset of visual marks, in accordance with at least one characteristic of the second user input.
8. An electronic device, comprising:
a display;
one or more processors; and
memory storing one or more programs configured for execution by the one or more processors, the one or more programs including instructions for:
displaying a first chart representing data from a data set, the chart comprising (i) a first region displaying labels corresponding to data values of a first data field in the data set, (ii) a second region displaying labels corresponding to data values of a second data field in the data set, and (iii) a third region displaying a plurality of visual marks, each visual mark representing aggregated data corresponding to a respective pair of data values for the first data field and the second data field;
detecting a first user input at a first location;
determining whether the first location is in the first region, the second region, or the third region;
in response to the first user input, removing one or more of the visual marks from the first chart via an animated transition, wherein the one or more visual marks move in concert with movement of the first user input during at least a portion of the animated transition, including:
in accordance with a determination that the first location is in the first region and a determination that the first location corresponds to a label for a first data value for the first data field, removing all of the visual marks in the first chart that correspond to the first data value;
in accordance with a determination that the first location is in the second region and a determination that the first location corresponds to a label for a second data value for the second data field, removing all of the visual marks in the first chart that correspond to the second data value; and
in accordance with a determination that the location is in the third region and a determination that the location corresponds to a first visual mark, removing only the first visual mark from the first chart; and
updating display of the first chart in accordance with removing the one or more visual marks.
9. The electronic device of claim 8 , wherein the first user input is a drag gesture or a swipe gesture that moves in a first predefined direction.
10. The electronic device of claim 8 , wherein updating display of the first chart includes displaying an indicium that the one or more visual marks have been removed.
11. The electronic device of claim 8 , wherein displaying the first chart includes displaying an indicium of a number of data rows represented in the first chart, and updating display of the first chart includes updating the indicium of the number of data rows represented.
12. The electronic device of claim 8 , wherein the one or more programs further comprise instructions for:
after removing the one or more visual marks from the first chart, detecting a second user input at a second location; and
in response to detecting the second user input, returning the one or more visual marks to the first chart.
13. The electronic device of claim 12 , wherein the second location corresponds to display of an indicium that the one or more visual marks have been removed.
14. The electronic device of claim 8 , wherein the one or more programs further comprise instructions for:
detecting a second user input at a second location;
determining that the second user input corresponds to a subset of the visual marks; and
removing from the first chart, via a second animated transition, all of the visual marks in the first chart except the subset of visual marks, in accordance with at least one characteristic of the second user input.
15. A non-transitory computer-readable storage medium storing one or more programs configured for execution by an electronic device having a display, one or more processors, and memory, the one or more programs comprising instructions for:
displaying a first chart representing data from a data set, the chart comprising (i) a first region displaying labels corresponding to data values of a first data field in the data set, (ii) a second region displaying labels corresponding to data values of a second data field in the data set, and (iii) a third region displaying a plurality of visual marks, each visual mark representing aggregated data corresponding to a respective pair of data values for the first data field and the second data field;
detecting a first user input at a first location;
determining whether the first location is in the first region, the second region, or the third region;
in response to the first user input, removing one or more of the visual marks from the first chart via an animated transition, wherein the one or more visual marks move in concert with movement of the first user input during at least a portion of the animated transition, including:
in accordance with a determination that the first location is in the first region and a determination that the first location corresponds to a label for a first data value for the first data field, removing all of the visual marks in the first chart that correspond to the first data value;
in accordance with a determination that the first location is in the second region and a determination that the first location corresponds to a label for a second data value for the second data field, removing all of the visual marks in the first chart that correspond to the second data value; and
in accordance with a determination that the location is in the third region and a determination that the location corresponds to a first visual mark, removing only the first visual mark from the first chart; and
updating display of the first chart in accordance with removing the one or more visual marks.
16. The computer-readable storage medium of claim 15 , wherein the first user input is a drag gesture or a swipe gesture that moves in a first predefined direction.
17. The computer-readable storage medium of claim 15 , wherein updating display of the first chart includes displaying an indicium that the one or more visual marks have been removed.
18. The computer-readable storage medium of claim 15 , wherein displaying the first chart includes displaying an indicium of a number of data rows represented in the first chart, and updating display of the first chart includes updating the indicium of the number of data rows represented.
19. The computer-readable storage medium of claim 15 , wherein the one or more programs further comprise instructions for:
after removing the one or more visual marks from the first chart, detecting a second user input at a second location; and
in response to detecting the second user input, returning the one or more visual marks to the first chart.
20. The computer-readable storage medium of claim 19 , wherein the second location corresponds to display of an indicium that the one or more visual marks have been removed.
Priority Applications (1)
| Application Number | Priority Date | Filing Date | Title |
|---|---|---|---|
| US17/478,815 US11720230B2 (en) | 2014-09-08 | 2021-09-17 | Interactive data visualization user interface with hierarchical filtering based on gesture location on a chart |
Applications Claiming Priority (6)
| Application Number | Priority Date | Filing Date | Title |
|---|---|---|---|
| US201462047429P | 2014-09-08 | 2014-09-08 | |
| US14/603,302 US10706597B2 (en) | 2014-09-08 | 2015-01-22 | Methods and devices for adjusting chart filters |
| US201562221084P | 2015-09-20 | 2015-09-20 | |
| US15/172,052 US10635262B2 (en) | 2014-09-08 | 2016-06-02 | Interactive data visualization user interface with gesture-based data field selection |
| US16/860,969 US11126327B2 (en) | 2014-09-08 | 2020-04-28 | Interactive data visualization user interface with gesture-based data field selection |
| US17/478,815 US11720230B2 (en) | 2014-09-08 | 2021-09-17 | Interactive data visualization user interface with hierarchical filtering based on gesture location on a chart |
Related Parent Applications (1)
| Application Number | Title | Priority Date | Filing Date |
|---|---|---|---|
| US16/860,969 Continuation US11126327B2 (en) | 2014-09-08 | 2020-04-28 | Interactive data visualization user interface with gesture-based data field selection |
Publications (2)
| Publication Number | Publication Date |
|---|---|
| US20220004293A1 US20220004293A1 (en) | 2022-01-06 |
| US11720230B2 true US11720230B2 (en) | 2023-08-08 |
Family
ID=57324443
Family Applications (3)
| Application Number | Title | Priority Date | Filing Date |
|---|---|---|---|
| US15/172,052 Active US10635262B2 (en) | 2014-09-08 | 2016-06-02 | Interactive data visualization user interface with gesture-based data field selection |
| US16/860,969 Active US11126327B2 (en) | 2014-09-08 | 2020-04-28 | Interactive data visualization user interface with gesture-based data field selection |
| US17/478,815 Active 2035-05-22 US11720230B2 (en) | 2014-09-08 | 2021-09-17 | Interactive data visualization user interface with hierarchical filtering based on gesture location on a chart |
Family Applications Before (2)
| Application Number | Title | Priority Date | Filing Date |
|---|---|---|---|
| US15/172,052 Active US10635262B2 (en) | 2014-09-08 | 2016-06-02 | Interactive data visualization user interface with gesture-based data field selection |
| US16/860,969 Active US11126327B2 (en) | 2014-09-08 | 2020-04-28 | Interactive data visualization user interface with gesture-based data field selection |
Country Status (1)
| Country | Link |
|---|---|
| US (3) | US10635262B2 (en) |
Families Citing this family (7)
| Publication number | Priority date | Publication date | Assignee | Title |
|---|---|---|---|---|
| US10489717B2 (en) | 2013-01-03 | 2019-11-26 | Aetna, Inc. | System and method for pharmacovigilance |
| US11424040B2 (en) | 2013-01-03 | 2022-08-23 | Aetna Inc. | System and method for pharmacovigilance |
| USD811432S1 (en) | 2016-04-18 | 2018-02-27 | Aetna Inc. | Computer display with graphical user interface for a pharmacovigilance tool |
| USD839893S1 (en) * | 2016-05-12 | 2019-02-05 | Sap Se | Display screen or portion thereof with graphical user interface for time sheet data presentation |
| US10620824B2 (en) * | 2016-09-30 | 2020-04-14 | Atlassian Pty Ltd | Creating tables using gestures |
| USD871433S1 (en) * | 2018-05-31 | 2019-12-31 | Inspire Medical Systems, Inc. | Display screen or portion thereof with a graphical user interface |
| US11782576B2 (en) * | 2021-01-29 | 2023-10-10 | Adobe Inc. | Configuration of user interface for intuitive selection of insight visualizations |
Citations (128)
| Publication number | Priority date | Publication date | Assignee | Title |
|---|---|---|---|---|
| US5414809A (en) | 1993-04-30 | 1995-05-09 | Texas Instruments Incorporated | Graphical display of data |
| US5717939A (en) | 1991-11-18 | 1998-02-10 | Compaq Computer Corporation | Method and apparatus for entering and manipulating spreadsheet cell data |
| US5806078A (en) | 1994-06-09 | 1998-09-08 | Softool Corporation | Version management system |
| US5874965A (en) | 1995-10-11 | 1999-02-23 | Sharp Kabushiki Kaisha | Method for magnifying a plurality of display images to reveal more detailed information |
| US20020024535A1 (en) | 2000-02-21 | 2002-02-28 | Michiko Ueno | Network management equipment and communication path setting method |
| US6400366B1 (en) | 1998-09-14 | 2002-06-04 | Visual Insights, Inc. | Method and system for the interactive visualization and examination of data |
| US20020118192A1 (en) | 2001-02-27 | 2002-08-29 | Microsoft Corporation | Multiple chart user interface |
| US20020129053A1 (en) | 2001-01-05 | 2002-09-12 | Microsoft Corporation, Recordation Form Cover Sheet | Enhanced find and replace for electronic documents |
| US6480194B1 (en) | 1996-11-12 | 2002-11-12 | Silicon Graphics, Inc. | Computer-related method, system, and program product for controlling data visualization in external dimension(s) |
| US6529217B1 (en) | 1999-06-15 | 2003-03-04 | Microsoft Corporation | System and method for graphically displaying a set of data fields |
| US20050060647A1 (en) | 2002-12-23 | 2005-03-17 | Canon Kabushiki Kaisha | Method for presenting hierarchical data |
| US20060080594A1 (en) | 2004-10-07 | 2006-04-13 | Chavoustie Michael D | Methods, systems and computer program products for facilitating visualization of interrelationships in a spreadsheet |
| US20070176933A1 (en) | 2006-01-20 | 2007-08-02 | Newport Corporation | Self-centering zoom bar graph |
| US20070190924A1 (en) | 2005-09-29 | 2007-08-16 | Stadheim Andrew D | System and method for balancing of ventilation systems |
| US20070233666A1 (en) | 2006-03-31 | 2007-10-04 | Microsoft Corporation | Drilling on elements in arbitrary ad-hoc reports |
| US20070285426A1 (en) | 2006-06-08 | 2007-12-13 | Matina Nicholas A | Graph with zoom operated clustering functions |
| US20080010670A1 (en) | 2005-09-09 | 2008-01-10 | Microsoft Corporation | Named object view of electronic data report |
| US20080046805A1 (en) | 2006-08-17 | 2008-02-21 | Cognos Incorporated | Method and System for Display Of Business Intelligence Data |
| US7345688B2 (en) | 2004-10-18 | 2008-03-18 | Microsoft Corporation | Semantic thumbnails |
| US20080195930A1 (en) | 2007-02-08 | 2008-08-14 | Microsoft Corporation | User Interface Pane for an Interactive Chart |
| US20080192056A1 (en) | 2007-02-12 | 2008-08-14 | Microsoft Corporation | Animated transitions for data visualization |
| US7420562B2 (en) | 2005-08-29 | 2008-09-02 | I-N Information Systems, Ltd. | Chart display device and program for the same |
| US20080229242A1 (en) | 2007-03-16 | 2008-09-18 | Sap Ag | Navigator for displays |
| US7469381B2 (en) | 2007-01-07 | 2008-12-23 | Apple Inc. | List scrolling and document translation, scaling, and rotation on a touch-screen display |
| US20090013287A1 (en) | 2007-05-07 | 2009-01-08 | Oracle International Corporation | Aggregate layout for data visualization techniques |
| US20090135240A1 (en) | 2004-11-15 | 2009-05-28 | Michael William Phaneuf | System and Method for Focused Ion Beam Data Analysis |
| US20090171606A1 (en) | 2007-12-31 | 2009-07-02 | Takahiro Murata | Semiconductor manufacture performance analysis |
| US20090178007A1 (en) | 2008-01-06 | 2009-07-09 | Michael Matas | Touch Screen Device, Method, and Graphical User Interface for Displaying and Selecting Application Options |
| US20090254557A1 (en) | 2008-04-02 | 2009-10-08 | Ebay Inc. | System and method for visualization of data |
| US20090313537A1 (en) | 2008-06-17 | 2009-12-17 | Microsoft Corporation | Micro browser spreadsheet viewer |
| US20100083089A1 (en) | 2008-09-30 | 2010-04-01 | Apple Inc. | Token representation of references and function arguments |
| US20100079499A1 (en) | 2008-09-30 | 2010-04-01 | Scott Steven J | Human-machine interface having multiple touch trend manipulation capabilities |
| US20100174678A1 (en) | 2009-01-07 | 2010-07-08 | Deepak Massand | System and method for comparing digital data in spreadsheets or database tables |
| US20100205520A1 (en) | 2009-02-09 | 2010-08-12 | Micrososoft Corporation | Grid presentation in web-based spreadsheet services |
| US20100211920A1 (en) | 2007-01-06 | 2010-08-19 | Wayne Carl Westerman | Detecting and Interpreting Real-World and Security Gestures on Touch and Hover Sensitive Devices |
| US20100214300A1 (en) | 2009-02-25 | 2010-08-26 | Quinton Alsbury | Displaying Bar Charts With A Fish-Eye Distortion Effect |
| US20100238176A1 (en) | 2008-09-08 | 2010-09-23 | Apple Inc. | Systems, methods, and devices for flash exposure control using preflash statistics |
| US20100283800A1 (en) | 2009-05-08 | 2010-11-11 | International Business Machines Corporation | Magnifying content on a graphical display |
| US20110074710A1 (en) | 2009-09-25 | 2011-03-31 | Christopher Douglas Weeldreyer | Device, Method, and Graphical User Interface for Manipulating User Interface Objects |
| US20110106791A1 (en) | 2007-02-23 | 2011-05-05 | Enrico Maim | Method for enriching data sources |
| US20110115814A1 (en) | 2009-11-16 | 2011-05-19 | Microsoft Corporation | Gesture-controlled data visualization |
| US20110145689A1 (en) | 2005-09-09 | 2011-06-16 | Microsoft Corporation | Named object view over multiple files |
| US20110154188A1 (en) | 2006-09-06 | 2011-06-23 | Scott Forstall | Portable Electronic Device, Method, and Graphical User Interface for Displaying Structured Electronic Documents |
| US20110164055A1 (en) | 2010-01-06 | 2011-07-07 | Mccullough Ian Patrick | Device, Method, and Graphical User Interface for Manipulating a Collection of Objects |
| EP2386940A1 (en) | 2010-05-14 | 2011-11-16 | Sap Ag | Methods and systems for performing analytical procedures by interactions with visiual representations of datasets |
| US20120005045A1 (en) | 2010-07-01 | 2012-01-05 | Baker Scott T | Comparing items using a displayed diagram |
| US20120013540A1 (en) | 2010-07-13 | 2012-01-19 | Hogan Edward P A | Table editing systems with gesture-based insertion and deletion of columns and rows |
| US20120023449A1 (en) | 2010-07-26 | 2012-01-26 | International Business Machines Corporation | System and method for an interactive filter |
| US8106856B2 (en) | 2006-09-06 | 2012-01-31 | Apple Inc. | Portable electronic device for photo management |
| US20120158623A1 (en) | 2010-12-21 | 2012-06-21 | Microsoft Corporation | Visualizing machine learning accuracy |
| US20120159380A1 (en) | 2010-12-20 | 2012-06-21 | Kocienda Kenneth L | Device, Method, and Graphical User Interface for Navigation of Concurrently Open Software Applications |
| US20120166470A1 (en) | 2010-12-22 | 2012-06-28 | Dirk Baumgaertel | Systems and methods providing touchscreen report navigation |
| US20120180002A1 (en) | 2011-01-07 | 2012-07-12 | Microsoft Corporation | Natural input for spreadsheet actions |
| US20120191704A1 (en) | 2011-01-22 | 2012-07-26 | Jones Robert F | Data Visualization Interface |
| US20120233573A1 (en) | 2011-03-07 | 2012-09-13 | Sas Institute Inc. | Techniques to present hierarchical information using orthographic projections |
| US20120240064A1 (en) | 2011-03-15 | 2012-09-20 | Oracle International Corporation | Visualization and interaction with financial data using sunburst visualization |
| US20120254783A1 (en) | 2011-03-29 | 2012-10-04 | International Business Machines Corporation | Modifying numeric data presentation on a display |
| US20120313957A1 (en) | 2011-06-09 | 2012-12-13 | Microsoft Corporation | Staged Animated Transitions for Aggregation Charts |
| US20120324388A1 (en) | 2011-06-17 | 2012-12-20 | Business Objects Software Limited | Pie chart graphical user interface |
| US20120324357A1 (en) | 2011-06-17 | 2012-12-20 | Microsoft Corporation | Hierarchical, zoomable presentations of media sets |
| US20130009963A1 (en) | 2011-07-07 | 2013-01-10 | Microsoft Corporation | Graphical display of data with animation |
| US20130019205A1 (en) | 2011-07-14 | 2013-01-17 | Microsoft Corporation | Determining gestures on context based menus |
| US20130024803A1 (en) | 2011-07-18 | 2013-01-24 | Oracle International Corporation | Touch optimized pivot table |
| US20130080884A1 (en) | 2011-09-23 | 2013-03-28 | Microsoft Corporation | Semantic zoom of a document |
| US20130111319A1 (en) | 2011-11-02 | 2013-05-02 | Microsoft Corporation | Visual navigation of documents by object |
| US20130111321A1 (en) | 2011-11-01 | 2013-05-02 | Microsoft Corporation | Multi-dimentional Data Reporting |
| US20130120267A1 (en) | 2011-11-10 | 2013-05-16 | Research In Motion Limited | Methods and systems for removing or replacing on-keyboard prediction candidates |
| US20130120358A1 (en) | 2011-11-14 | 2013-05-16 | Microsoft Corporation | Chart animation |
| US20130174087A1 (en) | 2011-12-29 | 2013-07-04 | Billy Chen | Device, Method, and Graphical User Interface for Navigation of Information in a Map-Based Interface |
| US20130194272A1 (en) | 2012-02-01 | 2013-08-01 | Ming C. Hao | Placing pixels according to attribute values in positions in a graphical visualization that correspond to geographic locations |
| US8527909B1 (en) | 2012-05-29 | 2013-09-03 | Sencha, Inc. | Manipulating data visualizations on a touch screen |
| US20130275904A1 (en) | 2012-04-11 | 2013-10-17 | Secondprism Inc. | Interactive data visualization and manipulation |
| US20130298085A1 (en) | 2012-05-02 | 2013-11-07 | International Business Machines Corporation | Displayed content drilling in a touch screen device |
| US20130314341A1 (en) | 2011-12-16 | 2013-11-28 | Samsung Electronics Co., Ltd. | Method, apparatus, and graphical user interface for providing visual effects on a touchscreen display |
| US20130332810A1 (en) | 2012-06-07 | 2013-12-12 | Microsoft Corporation | Managing objects in panorama display to navigate spreadsheet |
| US20130339903A1 (en) | 2012-06-19 | 2013-12-19 | Microsoft Corporation | UI Differentiation Between Delete and Clear |
| US8654125B2 (en) | 2006-06-22 | 2014-02-18 | International Business Machines Corporation | System and method of chart data layout |
| US20140049557A1 (en) | 2012-08-20 | 2014-02-20 | Microsoft Corporation | User Interface Tools for Exploring Data Visualizations |
| US20140053091A1 (en) | 2012-08-20 | 2014-02-20 | Microsoft Corporation | Data Exploration User Interface |
| US20140068403A1 (en) | 2012-08-31 | 2014-03-06 | Microsoft Corporation | Cell view mode for outsized cells |
| US20140075286A1 (en) | 2012-09-10 | 2014-03-13 | Aradais Corporation | Display and navigation of structured electronic documents |
| US20140098020A1 (en) | 2012-10-10 | 2014-04-10 | Valdrin Koshi | Mid-gesture chart scaling |
| US20140109012A1 (en) | 2012-10-16 | 2014-04-17 | Microsoft Corporation | Thumbnail and document map based navigation in a document |
| US20140113268A1 (en) | 2012-10-22 | 2014-04-24 | Microsoft Corporation | Interactive visual assessment after a rehearsal of a presentation |
| US20140129985A1 (en) | 2012-11-02 | 2014-05-08 | Microsoft Corporation | Touch based selection of graphical elements |
| US20140136939A1 (en) | 2012-11-12 | 2014-05-15 | Microsoft Corporation | User control for viewing data in large data sets |
| US20140143738A1 (en) | 2012-11-20 | 2014-05-22 | Dropbox, Inc. | System and method for applying gesture input to digital content |
| US20140149947A1 (en) | 2012-11-29 | 2014-05-29 | Oracle International Corporation | Multi-touch interface for visual analytics |
| US20140157142A1 (en) | 2010-08-31 | 2014-06-05 | Sovanta Ag | Method for selecting a data set from a plurality of data sets by means of an input device |
| US8762867B1 (en) | 2011-05-16 | 2014-06-24 | Mellmo Inc. | Presentation of multi-category graphical reports |
| US20140181756A1 (en) | 2012-12-21 | 2014-06-26 | Business Objects Software Ltd. | Visualization interaction design for cross-platform utilization |
| US20140198105A1 (en) | 2012-09-11 | 2014-07-17 | International Business Machines Corporation | Determining alternative visualizations for data based on an initial data visualization |
| US20140218383A1 (en) | 2013-02-07 | 2014-08-07 | Oracle International Corporation | Visual data analysis for large data sets |
| US20140223350A1 (en) | 2013-02-03 | 2014-08-07 | Neutrino Concepts Ltd | User interface |
| US20140247268A1 (en) | 2013-03-04 | 2014-09-04 | Microsoft Corporation | Particle based visualizations of abstract information |
| US8832588B1 (en) | 2011-06-30 | 2014-09-09 | Microstrategy Incorporated | Context-inclusive magnifying area |
| US8836726B1 (en) | 2009-12-04 | 2014-09-16 | The Mathworks, Inc. | Automatic scaling of axes for displaying moving data |
| US20140267424A1 (en) | 2013-03-12 | 2014-09-18 | Sas Institute Inc. | Proportional highlighting of data |
| US20140282276A1 (en) | 2013-03-15 | 2014-09-18 | Microsoft Corporation | Gestures involving direct interaction with a data visualization |
| US20140281867A1 (en) | 2013-03-12 | 2014-09-18 | Microsoft Corporation | Viewing effects of proposed change in document before commiting change |
| US20140281868A1 (en) | 2013-03-13 | 2014-09-18 | Microsoft Corporation | Semantic zoom-based navigation of displayed content |
| US20140282124A1 (en) | 2013-03-14 | 2014-09-18 | Microsoft Corporation | Staged animation of charts for data updates |
| US20140320539A1 (en) | 2013-04-30 | 2014-10-30 | Hewlett-Packard Development Company, L.P. | Semantic zoom-in or drill-down in a visualization having cells with scale enlargement and cell position adjustment |
| US20140336786A1 (en) | 2013-05-09 | 2014-11-13 | Rockwell Automation Technologies, Inc. | Using cloud-based data for virtualization of an industrial automation environment with information overlays |
| US20140351732A1 (en) | 2013-05-21 | 2014-11-27 | Georges Antoine NASRAOUI | Selection and display of map data and location attribute data by touch input |
| US20140372952A1 (en) | 2013-06-14 | 2014-12-18 | Microsoft Corporation | Simplified Data Input in Electronic Documents |
| US20140380140A1 (en) | 2013-06-24 | 2014-12-25 | Oracle International Corporation | Facilitating touch screen users to select elements identified in a two dimensional space |
| US20140380178A1 (en) | 2013-06-24 | 2014-12-25 | Oracle International Corporation | Displaying interactive charts on devices with limited resources |
| US20150007078A1 (en) | 2013-06-28 | 2015-01-01 | Sap Ag | Data Displays in a Tile-Based User Interface |
| US20150015504A1 (en) | 2013-07-12 | 2015-01-15 | Microsoft Corporation | Interactive digital displays |
| US20150026554A1 (en) | 2010-01-06 | 2015-01-22 | Apple Inc. | Device, method, and graphical user interface for manipulating tables using multicontact gestures |
| US20150029213A1 (en) | 2013-07-25 | 2015-01-29 | Sas Institute Inc. | Visualizing high-cardinally data |
| US20150058801A1 (en) | 2013-08-23 | 2015-02-26 | General Electric Company | Multi-touch inspection tool |
| US20150135113A1 (en) | 2013-11-08 | 2015-05-14 | Business Objects Software Ltd. | Gestures for Manipulating Tables, Charts, and Graphs |
| US20150169531A1 (en) | 2013-12-17 | 2015-06-18 | Microsoft Corporation | Touch/Gesture-Enabled Interaction with Electronic Spreadsheets |
| US20150199096A1 (en) | 2014-01-10 | 2015-07-16 | Samsung Electronics Co., Ltd. | Electronic device and method of displaying data |
| US20150254369A1 (en) | 2014-03-07 | 2015-09-10 | Microsoft Corporation | Direct manipulation interface for data analysis |
| US20150278315A1 (en) | 2014-04-01 | 2015-10-01 | Microsoft Corporation | Data fitting selected visualization type |
| US20160004423A1 (en) | 2013-01-31 | 2016-01-07 | Hewlett-Packard Development Company, L.P. | Electronic device with touch gesture adjustment of a graphical representation |
| US20160055232A1 (en) | 2014-08-22 | 2016-02-25 | Rui Yang | Gesture-based on-chart data filtering |
| US20160070015A1 (en) | 2013-07-22 | 2016-03-10 | Hewlett-Packard Development Company, L.P. | Presenting data in a scalable format |
| US20160103886A1 (en) | 2014-10-10 | 2016-04-14 | Salesforce.Com, Inc. | Declarative Specification of Visualization Queries, Display Formats and Bindings |
| US20160104311A1 (en) | 2014-10-14 | 2016-04-14 | Microsoft Technology Licensing, Llc. | Animation framework |
| US20160154575A1 (en) | 2014-12-02 | 2016-06-02 | Yingyu Xie | Gesture-Based Visualization of Data Grid on Mobile Device |
| US20160188185A1 (en) | 2014-12-30 | 2016-06-30 | Geraldine BOUS | Interactive chart authoring through chart merging |
| US20160224221A1 (en) | 2013-09-11 | 2016-08-04 | Nokia Technologies Oy | Apparatus for enabling displaced effective input and associated methods |
| US20170004638A1 (en) | 2015-07-01 | 2017-01-05 | Oracle International Corporation | Chart data-binding design time user experience with dynamic sample generation |
| US20170169592A1 (en) | 2015-12-14 | 2017-06-15 | Microsoft Technology Licensing, Llc | Utilizing selective triggering events for optimizing chart visualization |
Family Cites Families (2)
| Publication number | Priority date | Publication date | Assignee | Title |
|---|---|---|---|---|
| US20080284400A1 (en) | 2007-05-18 | 2008-11-20 | Eric Gregory Oettinger | Methods and apparatus to monitor a digital power supply |
| US8525837B2 (en) | 2008-04-29 | 2013-09-03 | Teledyne Lecroy, Inc. | Method and apparatus for data preview |
-
2016
- 2016-06-02 US US15/172,052 patent/US10635262B2/en active Active
-
2020
- 2020-04-28 US US16/860,969 patent/US11126327B2/en active Active
-
2021
- 2021-09-17 US US17/478,815 patent/US11720230B2/en active Active
Patent Citations (135)
| Publication number | Priority date | Publication date | Assignee | Title |
|---|---|---|---|---|
| US5717939A (en) | 1991-11-18 | 1998-02-10 | Compaq Computer Corporation | Method and apparatus for entering and manipulating spreadsheet cell data |
| US5414809A (en) | 1993-04-30 | 1995-05-09 | Texas Instruments Incorporated | Graphical display of data |
| US5806078A (en) | 1994-06-09 | 1998-09-08 | Softool Corporation | Version management system |
| US5874965A (en) | 1995-10-11 | 1999-02-23 | Sharp Kabushiki Kaisha | Method for magnifying a plurality of display images to reveal more detailed information |
| US6480194B1 (en) | 1996-11-12 | 2002-11-12 | Silicon Graphics, Inc. | Computer-related method, system, and program product for controlling data visualization in external dimension(s) |
| US20030030634A1 (en) | 1996-11-12 | 2003-02-13 | Sang'udi Gerald P. | Computer-related method, system, and program product for controlling data visualization in external dimension(s) |
| US6400366B1 (en) | 1998-09-14 | 2002-06-04 | Visual Insights, Inc. | Method and system for the interactive visualization and examination of data |
| US6529217B1 (en) | 1999-06-15 | 2003-03-04 | Microsoft Corporation | System and method for graphically displaying a set of data fields |
| US20020024535A1 (en) | 2000-02-21 | 2002-02-28 | Michiko Ueno | Network management equipment and communication path setting method |
| US20020129053A1 (en) | 2001-01-05 | 2002-09-12 | Microsoft Corporation, Recordation Form Cover Sheet | Enhanced find and replace for electronic documents |
| US20120284601A1 (en) | 2001-01-05 | 2012-11-08 | Microsoft Corporation | Enhanced Find and Replace for Electronic Documents |
| US20020118192A1 (en) | 2001-02-27 | 2002-08-29 | Microsoft Corporation | Multiple chart user interface |
| US20050060647A1 (en) | 2002-12-23 | 2005-03-17 | Canon Kabushiki Kaisha | Method for presenting hierarchical data |
| US20060080594A1 (en) | 2004-10-07 | 2006-04-13 | Chavoustie Michael D | Methods, systems and computer program products for facilitating visualization of interrelationships in a spreadsheet |
| US7345688B2 (en) | 2004-10-18 | 2008-03-18 | Microsoft Corporation | Semantic thumbnails |
| US20090135240A1 (en) | 2004-11-15 | 2009-05-28 | Michael William Phaneuf | System and Method for Focused Ion Beam Data Analysis |
| US7420562B2 (en) | 2005-08-29 | 2008-09-02 | I-N Information Systems, Ltd. | Chart display device and program for the same |
| US20080010670A1 (en) | 2005-09-09 | 2008-01-10 | Microsoft Corporation | Named object view of electronic data report |
| US20110145689A1 (en) | 2005-09-09 | 2011-06-16 | Microsoft Corporation | Named object view over multiple files |
| US20070190924A1 (en) | 2005-09-29 | 2007-08-16 | Stadheim Andrew D | System and method for balancing of ventilation systems |
| US20070176933A1 (en) | 2006-01-20 | 2007-08-02 | Newport Corporation | Self-centering zoom bar graph |
| US20070233666A1 (en) | 2006-03-31 | 2007-10-04 | Microsoft Corporation | Drilling on elements in arbitrary ad-hoc reports |
| US20070285426A1 (en) | 2006-06-08 | 2007-12-13 | Matina Nicholas A | Graph with zoom operated clustering functions |
| US8654125B2 (en) | 2006-06-22 | 2014-02-18 | International Business Machines Corporation | System and method of chart data layout |
| US20080046805A1 (en) | 2006-08-17 | 2008-02-21 | Cognos Incorporated | Method and System for Display Of Business Intelligence Data |
| US20110154188A1 (en) | 2006-09-06 | 2011-06-23 | Scott Forstall | Portable Electronic Device, Method, and Graphical User Interface for Displaying Structured Electronic Documents |
| US8106856B2 (en) | 2006-09-06 | 2012-01-31 | Apple Inc. | Portable electronic device for photo management |
| US20100211920A1 (en) | 2007-01-06 | 2010-08-19 | Wayne Carl Westerman | Detecting and Interpreting Real-World and Security Gestures on Touch and Hover Sensitive Devices |
| US7469381B2 (en) | 2007-01-07 | 2008-12-23 | Apple Inc. | List scrolling and document translation, scaling, and rotation on a touch-screen display |
| US20080195930A1 (en) | 2007-02-08 | 2008-08-14 | Microsoft Corporation | User Interface Pane for an Interactive Chart |
| US20080192056A1 (en) | 2007-02-12 | 2008-08-14 | Microsoft Corporation | Animated transitions for data visualization |
| US20110106791A1 (en) | 2007-02-23 | 2011-05-05 | Enrico Maim | Method for enriching data sources |
| US20080229242A1 (en) | 2007-03-16 | 2008-09-18 | Sap Ag | Navigator for displays |
| US20090013287A1 (en) | 2007-05-07 | 2009-01-08 | Oracle International Corporation | Aggregate layout for data visualization techniques |
| US20090171606A1 (en) | 2007-12-31 | 2009-07-02 | Takahiro Murata | Semiconductor manufacture performance analysis |
| US20090178007A1 (en) | 2008-01-06 | 2009-07-09 | Michael Matas | Touch Screen Device, Method, and Graphical User Interface for Displaying and Selecting Application Options |
| US20090254557A1 (en) | 2008-04-02 | 2009-10-08 | Ebay Inc. | System and method for visualization of data |
| US20090313537A1 (en) | 2008-06-17 | 2009-12-17 | Microsoft Corporation | Micro browser spreadsheet viewer |
| US20100238176A1 (en) | 2008-09-08 | 2010-09-23 | Apple Inc. | Systems, methods, and devices for flash exposure control using preflash statistics |
| US20100083089A1 (en) | 2008-09-30 | 2010-04-01 | Apple Inc. | Token representation of references and function arguments |
| US20100079499A1 (en) | 2008-09-30 | 2010-04-01 | Scott Steven J | Human-machine interface having multiple touch trend manipulation capabilities |
| US20100174678A1 (en) | 2009-01-07 | 2010-07-08 | Deepak Massand | System and method for comparing digital data in spreadsheets or database tables |
| US20100205520A1 (en) | 2009-02-09 | 2010-08-12 | Micrososoft Corporation | Grid presentation in web-based spreadsheet services |
| US20100214300A1 (en) | 2009-02-25 | 2010-08-26 | Quinton Alsbury | Displaying Bar Charts With A Fish-Eye Distortion Effect |
| US20100283800A1 (en) | 2009-05-08 | 2010-11-11 | International Business Machines Corporation | Magnifying content on a graphical display |
| US20110074710A1 (en) | 2009-09-25 | 2011-03-31 | Christopher Douglas Weeldreyer | Device, Method, and Graphical User Interface for Manipulating User Interface Objects |
| US20110115814A1 (en) | 2009-11-16 | 2011-05-19 | Microsoft Corporation | Gesture-controlled data visualization |
| US8836726B1 (en) | 2009-12-04 | 2014-09-16 | The Mathworks, Inc. | Automatic scaling of axes for displaying moving data |
| US20110164055A1 (en) | 2010-01-06 | 2011-07-07 | Mccullough Ian Patrick | Device, Method, and Graphical User Interface for Manipulating a Collection of Objects |
| US20150026554A1 (en) | 2010-01-06 | 2015-01-22 | Apple Inc. | Device, method, and graphical user interface for manipulating tables using multicontact gestures |
| EP2386940A1 (en) | 2010-05-14 | 2011-11-16 | Sap Ag | Methods and systems for performing analytical procedures by interactions with visiual representations of datasets |
| US8996978B2 (en) | 2010-05-14 | 2015-03-31 | Sap Se | Methods and systems for performing analytical procedures by interactions with visual representations of datasets |
| US20110283231A1 (en) | 2010-05-14 | 2011-11-17 | Sap Ag | Methods and systems for performing analytical procedures by interactions with visual representations of datasets |
| US20120005045A1 (en) | 2010-07-01 | 2012-01-05 | Baker Scott T | Comparing items using a displayed diagram |
| US20120013540A1 (en) | 2010-07-13 | 2012-01-19 | Hogan Edward P A | Table editing systems with gesture-based insertion and deletion of columns and rows |
| US20120023449A1 (en) | 2010-07-26 | 2012-01-26 | International Business Machines Corporation | System and method for an interactive filter |
| US20140157142A1 (en) | 2010-08-31 | 2014-06-05 | Sovanta Ag | Method for selecting a data set from a plurality of data sets by means of an input device |
| US20120159380A1 (en) | 2010-12-20 | 2012-06-21 | Kocienda Kenneth L | Device, Method, and Graphical User Interface for Navigation of Concurrently Open Software Applications |
| US20120158623A1 (en) | 2010-12-21 | 2012-06-21 | Microsoft Corporation | Visualizing machine learning accuracy |
| US20120166470A1 (en) | 2010-12-22 | 2012-06-28 | Dirk Baumgaertel | Systems and methods providing touchscreen report navigation |
| US20120180002A1 (en) | 2011-01-07 | 2012-07-12 | Microsoft Corporation | Natural input for spreadsheet actions |
| US20120191704A1 (en) | 2011-01-22 | 2012-07-26 | Jones Robert F | Data Visualization Interface |
| US20120233573A1 (en) | 2011-03-07 | 2012-09-13 | Sas Institute Inc. | Techniques to present hierarchical information using orthographic projections |
| US20120240064A1 (en) | 2011-03-15 | 2012-09-20 | Oracle International Corporation | Visualization and interaction with financial data using sunburst visualization |
| US20120254783A1 (en) | 2011-03-29 | 2012-10-04 | International Business Machines Corporation | Modifying numeric data presentation on a display |
| US8762867B1 (en) | 2011-05-16 | 2014-06-24 | Mellmo Inc. | Presentation of multi-category graphical reports |
| US20120313957A1 (en) | 2011-06-09 | 2012-12-13 | Microsoft Corporation | Staged Animated Transitions for Aggregation Charts |
| US20120324388A1 (en) | 2011-06-17 | 2012-12-20 | Business Objects Software Limited | Pie chart graphical user interface |
| US20120324357A1 (en) | 2011-06-17 | 2012-12-20 | Microsoft Corporation | Hierarchical, zoomable presentations of media sets |
| US8832588B1 (en) | 2011-06-30 | 2014-09-09 | Microstrategy Incorporated | Context-inclusive magnifying area |
| US20130009963A1 (en) | 2011-07-07 | 2013-01-10 | Microsoft Corporation | Graphical display of data with animation |
| US20130019205A1 (en) | 2011-07-14 | 2013-01-17 | Microsoft Corporation | Determining gestures on context based menus |
| US20130024803A1 (en) | 2011-07-18 | 2013-01-24 | Oracle International Corporation | Touch optimized pivot table |
| US20130080884A1 (en) | 2011-09-23 | 2013-03-28 | Microsoft Corporation | Semantic zoom of a document |
| US20130111321A1 (en) | 2011-11-01 | 2013-05-02 | Microsoft Corporation | Multi-dimentional Data Reporting |
| US20130111319A1 (en) | 2011-11-02 | 2013-05-02 | Microsoft Corporation | Visual navigation of documents by object |
| US20130120267A1 (en) | 2011-11-10 | 2013-05-16 | Research In Motion Limited | Methods and systems for removing or replacing on-keyboard prediction candidates |
| US20130120358A1 (en) | 2011-11-14 | 2013-05-16 | Microsoft Corporation | Chart animation |
| US20130314341A1 (en) | 2011-12-16 | 2013-11-28 | Samsung Electronics Co., Ltd. | Method, apparatus, and graphical user interface for providing visual effects on a touchscreen display |
| US20130174087A1 (en) | 2011-12-29 | 2013-07-04 | Billy Chen | Device, Method, and Graphical User Interface for Navigation of Information in a Map-Based Interface |
| US20130194272A1 (en) | 2012-02-01 | 2013-08-01 | Ming C. Hao | Placing pixels according to attribute values in positions in a graphical visualization that correspond to geographic locations |
| US20130275904A1 (en) | 2012-04-11 | 2013-10-17 | Secondprism Inc. | Interactive data visualization and manipulation |
| US20130298085A1 (en) | 2012-05-02 | 2013-11-07 | International Business Machines Corporation | Displayed content drilling in a touch screen device |
| US20130293480A1 (en) | 2012-05-02 | 2013-11-07 | International Business Machines Corporation | Drilling of displayed content in a touch screen device |
| US8527909B1 (en) | 2012-05-29 | 2013-09-03 | Sencha, Inc. | Manipulating data visualizations on a touch screen |
| US20130332810A1 (en) | 2012-06-07 | 2013-12-12 | Microsoft Corporation | Managing objects in panorama display to navigate spreadsheet |
| US20130339903A1 (en) | 2012-06-19 | 2013-12-19 | Microsoft Corporation | UI Differentiation Between Delete and Clear |
| US20140053091A1 (en) | 2012-08-20 | 2014-02-20 | Microsoft Corporation | Data Exploration User Interface |
| US20140049557A1 (en) | 2012-08-20 | 2014-02-20 | Microsoft Corporation | User Interface Tools for Exploring Data Visualizations |
| US20140068403A1 (en) | 2012-08-31 | 2014-03-06 | Microsoft Corporation | Cell view mode for outsized cells |
| US20140075286A1 (en) | 2012-09-10 | 2014-03-13 | Aradais Corporation | Display and navigation of structured electronic documents |
| US20140198105A1 (en) | 2012-09-11 | 2014-07-17 | International Business Machines Corporation | Determining alternative visualizations for data based on an initial data visualization |
| US20140098020A1 (en) | 2012-10-10 | 2014-04-10 | Valdrin Koshi | Mid-gesture chart scaling |
| US20140109012A1 (en) | 2012-10-16 | 2014-04-17 | Microsoft Corporation | Thumbnail and document map based navigation in a document |
| US20140113268A1 (en) | 2012-10-22 | 2014-04-24 | Microsoft Corporation | Interactive visual assessment after a rehearsal of a presentation |
| US20140129985A1 (en) | 2012-11-02 | 2014-05-08 | Microsoft Corporation | Touch based selection of graphical elements |
| US20140136939A1 (en) | 2012-11-12 | 2014-05-15 | Microsoft Corporation | User control for viewing data in large data sets |
| US20140143738A1 (en) | 2012-11-20 | 2014-05-22 | Dropbox, Inc. | System and method for applying gesture input to digital content |
| US20140149947A1 (en) | 2012-11-29 | 2014-05-29 | Oracle International Corporation | Multi-touch interface for visual analytics |
| US20140181756A1 (en) | 2012-12-21 | 2014-06-26 | Business Objects Software Ltd. | Visualization interaction design for cross-platform utilization |
| US20160004423A1 (en) | 2013-01-31 | 2016-01-07 | Hewlett-Packard Development Company, L.P. | Electronic device with touch gesture adjustment of a graphical representation |
| US20140223350A1 (en) | 2013-02-03 | 2014-08-07 | Neutrino Concepts Ltd | User interface |
| US20140218383A1 (en) | 2013-02-07 | 2014-08-07 | Oracle International Corporation | Visual data analysis for large data sets |
| US20140247268A1 (en) | 2013-03-04 | 2014-09-04 | Microsoft Corporation | Particle based visualizations of abstract information |
| US20140281867A1 (en) | 2013-03-12 | 2014-09-18 | Microsoft Corporation | Viewing effects of proposed change in document before commiting change |
| US20140267424A1 (en) | 2013-03-12 | 2014-09-18 | Sas Institute Inc. | Proportional highlighting of data |
| US20140281868A1 (en) | 2013-03-13 | 2014-09-18 | Microsoft Corporation | Semantic zoom-based navigation of displayed content |
| US20140282124A1 (en) | 2013-03-14 | 2014-09-18 | Microsoft Corporation | Staged animation of charts for data updates |
| US20140282276A1 (en) | 2013-03-15 | 2014-09-18 | Microsoft Corporation | Gestures involving direct interaction with a data visualization |
| US20140320539A1 (en) | 2013-04-30 | 2014-10-30 | Hewlett-Packard Development Company, L.P. | Semantic zoom-in or drill-down in a visualization having cells with scale enlargement and cell position adjustment |
| US20140336786A1 (en) | 2013-05-09 | 2014-11-13 | Rockwell Automation Technologies, Inc. | Using cloud-based data for virtualization of an industrial automation environment with information overlays |
| US20140351732A1 (en) | 2013-05-21 | 2014-11-27 | Georges Antoine NASRAOUI | Selection and display of map data and location attribute data by touch input |
| US20140372952A1 (en) | 2013-06-14 | 2014-12-18 | Microsoft Corporation | Simplified Data Input in Electronic Documents |
| US20140380178A1 (en) | 2013-06-24 | 2014-12-25 | Oracle International Corporation | Displaying interactive charts on devices with limited resources |
| US20140380140A1 (en) | 2013-06-24 | 2014-12-25 | Oracle International Corporation | Facilitating touch screen users to select elements identified in a two dimensional space |
| US20150007078A1 (en) | 2013-06-28 | 2015-01-01 | Sap Ag | Data Displays in a Tile-Based User Interface |
| US20150015504A1 (en) | 2013-07-12 | 2015-01-15 | Microsoft Corporation | Interactive digital displays |
| US20160070015A1 (en) | 2013-07-22 | 2016-03-10 | Hewlett-Packard Development Company, L.P. | Presenting data in a scalable format |
| US20150029213A1 (en) | 2013-07-25 | 2015-01-29 | Sas Institute Inc. | Visualizing high-cardinally data |
| US20150058801A1 (en) | 2013-08-23 | 2015-02-26 | General Electric Company | Multi-touch inspection tool |
| US20160224221A1 (en) | 2013-09-11 | 2016-08-04 | Nokia Technologies Oy | Apparatus for enabling displaced effective input and associated methods |
| US20150135113A1 (en) | 2013-11-08 | 2015-05-14 | Business Objects Software Ltd. | Gestures for Manipulating Tables, Charts, and Graphs |
| US9389777B2 (en) | 2013-11-08 | 2016-07-12 | Business Objects Software Ltd. | Gestures for manipulating tables, charts, and graphs |
| US20150169531A1 (en) | 2013-12-17 | 2015-06-18 | Microsoft Corporation | Touch/Gesture-Enabled Interaction with Electronic Spreadsheets |
| US20150199096A1 (en) | 2014-01-10 | 2015-07-16 | Samsung Electronics Co., Ltd. | Electronic device and method of displaying data |
| US20150254369A1 (en) | 2014-03-07 | 2015-09-10 | Microsoft Corporation | Direct manipulation interface for data analysis |
| US10416871B2 (en) | 2014-03-07 | 2019-09-17 | Microsoft Technology Licensing, Llc | Direct manipulation interface for data analysis |
| US20150278315A1 (en) | 2014-04-01 | 2015-10-01 | Microsoft Corporation | Data fitting selected visualization type |
| US20160055232A1 (en) | 2014-08-22 | 2016-02-25 | Rui Yang | Gesture-based on-chart data filtering |
| US20160103886A1 (en) | 2014-10-10 | 2016-04-14 | Salesforce.Com, Inc. | Declarative Specification of Visualization Queries, Display Formats and Bindings |
| US20160104311A1 (en) | 2014-10-14 | 2016-04-14 | Microsoft Technology Licensing, Llc. | Animation framework |
| US20160154575A1 (en) | 2014-12-02 | 2016-06-02 | Yingyu Xie | Gesture-Based Visualization of Data Grid on Mobile Device |
| US20160188185A1 (en) | 2014-12-30 | 2016-06-30 | Geraldine BOUS | Interactive chart authoring through chart merging |
| US20170004638A1 (en) | 2015-07-01 | 2017-01-05 | Oracle International Corporation | Chart data-binding design time user experience with dynamic sample generation |
| US20170169592A1 (en) | 2015-12-14 | 2017-06-15 | Microsoft Technology Licensing, Llc | Utilizing selective triggering events for optimizing chart visualization |
Non-Patent Citations (2)
| Title |
|---|
| Stewart, Office Action, U.S. Appl. No. 14/603,302, dated Apr. 6, 2018, 17 pgs. |
| Stewart, Office Action, U.S. Appl. No. 14/603,312, dated Apr. 4, 2018, 12 pgs. |
Also Published As
| Publication number | Publication date |
|---|---|
| US11126327B2 (en) | 2021-09-21 |
| US20200393940A1 (en) | 2020-12-17 |
| US20220004293A1 (en) | 2022-01-06 |
| US20160342292A1 (en) | 2016-11-24 |
| US10635262B2 (en) | 2020-04-28 |
Similar Documents
| Publication | Publication Date | Title |
|---|---|---|
| US10657685B2 (en) | Methods and devices for adjusting chart magnification | |
| US11720230B2 (en) | Interactive data visualization user interface with hierarchical filtering based on gesture location on a chart | |
| US10347027B2 (en) | Animated transition between data visualization versions at different levels of detail | |
| JP7397881B2 (en) | Systems, methods, and user interfaces for interacting with multiple application windows | |
| US20220083214A1 (en) | Systems and Methods for Interacting with Multiple Applications that are Simultaneously Displayed on an Electronic Device with a Touch-Sensitive Display | |
| US10705707B2 (en) | User interface for editing a value in place | |
| US10347018B2 (en) | Interactive data visualization user interface with hierarchical filtering based on gesture location on a chart | |
| US11704330B2 (en) | User interface for generating data visualizations that use table calculations | |
| AU2021204190B2 (en) | Interactive data visualization user interface with gesture-based data field selection |
Legal Events
| Date | Code | Title | Description |
|---|---|---|---|
| FEPP | Fee payment procedure |
Free format text: ENTITY STATUS SET TO UNDISCOUNTED (ORIGINAL EVENT CODE: BIG.); ENTITY STATUS OF PATENT OWNER: LARGE ENTITY |
|
| STPP | Information on status: patent application and granting procedure in general |
Free format text: DOCKETED NEW CASE - READY FOR EXAMINATION |
|
| STPP | Information on status: patent application and granting procedure in general |
Free format text: PUBLICATIONS -- ISSUE FEE PAYMENT VERIFIED |
|
| STCF | Information on status: patent grant |
Free format text: PATENTED CASE |