US11717256B2 - Motion independence in acoustic radiation force impulse imaging - Google Patents
Motion independence in acoustic radiation force impulse imaging Download PDFInfo
- Publication number
- US11717256B2 US11717256B2 US14/991,635 US201614991635A US11717256B2 US 11717256 B2 US11717256 B2 US 11717256B2 US 201614991635 A US201614991635 A US 201614991635A US 11717256 B2 US11717256 B2 US 11717256B2
- Authority
- US
- United States
- Prior art keywords
- displacements
- locations
- velocity
- wave
- displacement
- Prior art date
- Legal status (The legal status is an assumption and is not a legal conclusion. Google has not performed a legal analysis and makes no representation as to the accuracy of the status listed.)
- Active, expires
Links
Images


Classifications
-
- A—HUMAN NECESSITIES
- A47—FURNITURE; DOMESTIC ARTICLES OR APPLIANCES; COFFEE MILLS; SPICE MILLS; SUCTION CLEANERS IN GENERAL
- A47L—DOMESTIC WASHING OR CLEANING; SUCTION CLEANERS IN GENERAL
- A47L13/00—Implements for cleaning floors, carpets, furniture, walls, or wall coverings
- A47L13/10—Scrubbing; Scouring; Cleaning; Polishing
- A47L13/50—Auxiliary implements
- A47L13/58—Wringers for scouring pads, mops, or the like, combined with buckets
-
- A—HUMAN NECESSITIES
- A61—MEDICAL OR VETERINARY SCIENCE; HYGIENE
- A61B—DIAGNOSIS; SURGERY; IDENTIFICATION
- A61B8/00—Diagnosis using ultrasonic, sonic or infrasonic waves
- A61B8/08—Detecting organic movements or changes, e.g. tumours, cysts, swellings
- A61B8/0833—Detecting organic movements or changes, e.g. tumours, cysts, swellings involving detecting or locating foreign bodies or organic structures
-
- A—HUMAN NECESSITIES
- A61—MEDICAL OR VETERINARY SCIENCE; HYGIENE
- A61B—DIAGNOSIS; SURGERY; IDENTIFICATION
- A61B8/00—Diagnosis using ultrasonic, sonic or infrasonic waves
- A61B8/08—Detecting organic movements or changes, e.g. tumours, cysts, swellings
-
- A—HUMAN NECESSITIES
- A61—MEDICAL OR VETERINARY SCIENCE; HYGIENE
- A61B—DIAGNOSIS; SURGERY; IDENTIFICATION
- A61B8/00—Diagnosis using ultrasonic, sonic or infrasonic waves
- A61B8/44—Constructional features of the ultrasonic, sonic or infrasonic diagnostic device
- A61B8/4483—Constructional features of the ultrasonic, sonic or infrasonic diagnostic device characterised by features of the ultrasound transducer
-
- A—HUMAN NECESSITIES
- A61—MEDICAL OR VETERINARY SCIENCE; HYGIENE
- A61B—DIAGNOSIS; SURGERY; IDENTIFICATION
- A61B8/00—Diagnosis using ultrasonic, sonic or infrasonic waves
- A61B8/46—Ultrasonic, sonic or infrasonic diagnostic devices with special arrangements for interfacing with the operator or the patient
- A61B8/467—Ultrasonic, sonic or infrasonic diagnostic devices with special arrangements for interfacing with the operator or the patient characterised by special input means
- A61B8/469—Ultrasonic, sonic or infrasonic diagnostic devices with special arrangements for interfacing with the operator or the patient characterised by special input means for selection of a region of interest
-
- A—HUMAN NECESSITIES
- A61—MEDICAL OR VETERINARY SCIENCE; HYGIENE
- A61B—DIAGNOSIS; SURGERY; IDENTIFICATION
- A61B8/00—Diagnosis using ultrasonic, sonic or infrasonic waves
- A61B8/48—Diagnostic techniques
- A61B8/485—Diagnostic techniques involving measuring strain or elastic properties
-
- A—HUMAN NECESSITIES
- A61—MEDICAL OR VETERINARY SCIENCE; HYGIENE
- A61B—DIAGNOSIS; SURGERY; IDENTIFICATION
- A61B8/00—Diagnosis using ultrasonic, sonic or infrasonic waves
- A61B8/52—Devices using data or image processing specially adapted for diagnosis using ultrasonic, sonic or infrasonic waves
- A61B8/5269—Devices using data or image processing specially adapted for diagnosis using ultrasonic, sonic or infrasonic waves involving detection or reduction of artifacts
- A61B8/5276—Devices using data or image processing specially adapted for diagnosis using ultrasonic, sonic or infrasonic waves involving detection or reduction of artifacts due to motion
-
- B—PERFORMING OPERATIONS; TRANSPORTING
- B08—CLEANING
- B08B—CLEANING IN GENERAL; PREVENTION OF FOULING IN GENERAL
- B08B3/00—Cleaning by methods involving the use or presence of liquid or steam
- B08B3/04—Cleaning involving contact with liquid
- B08B3/10—Cleaning involving contact with liquid with additional treatment of the liquid or of the object being cleaned, e.g. by heat, by electricity or by vibration
-
- G—PHYSICS
- G01—MEASURING; TESTING
- G01S—RADIO DIRECTION-FINDING; RADIO NAVIGATION; DETERMINING DISTANCE OR VELOCITY BY USE OF RADIO WAVES; LOCATING OR PRESENCE-DETECTING BY USE OF THE REFLECTION OR RERADIATION OF RADIO WAVES; ANALOGOUS ARRANGEMENTS USING OTHER WAVES
- G01S7/00—Details of systems according to groups G01S13/00, G01S15/00, G01S17/00
- G01S7/52—Details of systems according to groups G01S13/00, G01S15/00, G01S17/00 of systems according to group G01S15/00
- G01S7/52017—Details of systems according to groups G01S13/00, G01S15/00, G01S17/00 of systems according to group G01S15/00 particularly adapted to short-range imaging
- G01S7/52019—Details of transmitters
- G01S7/5202—Details of transmitters for pulse systems
- G01S7/52022—Details of transmitters for pulse systems using a sequence of pulses, at least one pulse manipulating the transmissivity or reflexivity of the medium
-
- G—PHYSICS
- G01—MEASURING; TESTING
- G01S—RADIO DIRECTION-FINDING; RADIO NAVIGATION; DETERMINING DISTANCE OR VELOCITY BY USE OF RADIO WAVES; LOCATING OR PRESENCE-DETECTING BY USE OF THE REFLECTION OR RERADIATION OF RADIO WAVES; ANALOGOUS ARRANGEMENTS USING OTHER WAVES
- G01S7/00—Details of systems according to groups G01S13/00, G01S15/00, G01S17/00
- G01S7/52—Details of systems according to groups G01S13/00, G01S15/00, G01S17/00 of systems according to group G01S15/00
- G01S7/52017—Details of systems according to groups G01S13/00, G01S15/00, G01S17/00 of systems according to group G01S15/00 particularly adapted to short-range imaging
- G01S7/52023—Details of receivers
- G01S7/52036—Details of receivers using analysis of echo signal for target characterisation
- G01S7/52042—Details of receivers using analysis of echo signal for target characterisation determining elastic properties of the propagation medium or of the reflective target
Definitions
- the present embodiments relate to acoustic radiation force impulse (ARFI) imaging.
- ARFI acoustic radiation force impulse
- ultrasound may be used to displace tissue through generation of a shear or longitudinal wave.
- the displacement resulting from the wave generated by the excitation pulse may be measured using further ultrasound scanning or tracking.
- displacements are estimated over time for each location.
- the maximum displacement over time and/or the relative phase shift in displacement temporal profiles between locations is found. Since the cardiac and/or breathing motion of the patient causes different amount of tissue movement at different times, noise is introduced into the displacements over time. This motion may cause undesired variation in occurrence of the maximum displacement and relative phase shift, resulting in incorrect velocity determination.
- the preferred embodiments described below include methods, instructions, and systems for motion independent acoustic radiation force impulse imaging. Rather than rely on the displacement over time for each location, the displacements over locations for each time are used. Parallel beamforming is used to simultaneously sample across a region of interest. Since it may be assumed that the different locations are subjected to the same motion at the same time, finding a peak displacement over locations for each given time provides peak or profile information independent of the motion. The velocity or other viscoelastic parameter may be estimated from the displacements over locations.
- a method for motion independent acoustic radiation force impulse imaging An ultrasound scanner transmits an acoustic radiation force impulse into tissue of a patient along a first line.
- the ultrasound scanner detects displacements of the tissue generated in response to the transmitting with four or more receive beams at four or more locations, respectively, along each of four or more tracking lines, respectively, spaced from the first line.
- the detection for each of the four or more locations is repeated multiple times. For each of the multiple times, which of the four or more locations has the greatest displacement is determined.
- a velocity of a wave caused by the transmitting is calculated as a function of the greatest displacements from the multiple times. An image of the velocity is generated.
- a system for motion independent acoustic radiation force impulse imaging.
- a transmit beamformer is configured to generate an excitation pulse.
- a parallel receive beamformer is configured to detect responses of tissue to a wave generated by the excitation pulse. The responses are detected at each of a plurality of locations at each of a plurality of times.
- a processor is configured to locate a peak in the responses over the locations at each of the times and to determine a velocity of the wave from the peaks.
- a display is operable to display the velocity.
- a non-transitory computer readable storage medium has stored therein data representing instructions executable by a programmed processor for acoustic radiation force impulse imaging.
- the storage medium includes instructions for: measuring, using an ultrasound scanner, displacements in response to an excitation pulse, the displacements measured simultaneously at different locations; determining a characteristic of a wave generated by the excitation pulse from a relative amount of the simultaneously measured displacements; and outputting the characteristic.
- FIG. 1 illustrates an approach for sampling displacement by time
- FIG. 2 is an example distribution of displacement by receive line and time for a region of interest
- FIG. 3 is a graph showing an example estimation of velocity using displacements not subject to physiological motion
- FIG. 4 is a graph showing the example estimation of velocity using the displacements of FIG. 3 , but with physiological motion;
- FIG. 5 is a flow chart diagram of one embodiment of a method for motion independent acoustic radiation force impulse imaging
- FIG. 6 A is an example displacement map for position as a function of time
- FIG. 6 B is a graph of displacements as a function of location for a given time in the map of FIG. 6 A ;
- FIG. 7 is a graph showing an example estimation of velocity using the displacement peaks in spatial displacement profiles
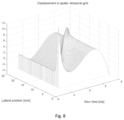
- FIG. 8 shows an example grid of displacements as a function of position and time
- FIG. 9 shows an example grid of the displacements of FIG. 8 but as a function of time and position.
- FIG. 10 is one embodiment of a system for motion independent acoustic radiation force impulse imaging.
- Physiological motion during acoustic radiation force impulse (ARFI) scans may lead to large errors in the estimates of shear or longitudinal wave speed or other viscoelastic parameters.
- ARFI imaging independent of physiological motion an ultrasound imaging system with high parallel beamforming capability tracks the shear wave at multiple spatial locations simultaneously. The relative displacement or peak over space is used instead of over time. Since the displacements at different locations but a same time are subject to the same motion, the peak identification or displacement profile is independent of the physiological motion.
- FIGS. 1 - 4 show the effects of physiological motion where the peak is determined over time instead of space.
- FIGS. 1 and 2 show displacement sampling in conventional ARFI imaging. Displacements estimated over a large region with a system that has a limited beamformation require repeated ARFI pushes.
- FIG. 1 shows a region of interest as the dashed box. Four simultaneous receive beams along the four receive lines are shown in the box. After transmission of an ARFI excitation pulse, multiple scans of the same four lines are performed to track displacement at the four locations over time. For the temporal scanning, the same group of receive lines are scanned over a period, such as over 7 ms. With each ARFI push, only a limited number of locations are tracked over N slow time samples. Given the region of interest of FIG. 1 , seven repetitions of the ARFI excitation pulse and responsive displacement monitoring at respective seven different sets of receive lines are performed.
- FIG. 2 shows a representation of the displacement information.
- the x-axis is the slow time or sample rate for displacement, and the y-axis is the lateral position or receive line.
- the brightness is the magnitude of the displacement.
- displacements over 7 ms are measured. In this example, about five displacements are measured sequentially over each millisecond. Since four simultaneous receive beams are used, the displacements over the slow time for four lateral positions are acquired at the same times. For other receive lines, the sequence of ARFI excitation pulse and tracking displacement over the 7 ms is repeated.
- the maximum displacement over time is found for each lateral position. Given the distance from the ARFI focus and the time of the maximum displacement caused by the wave, a velocity of the wave traveling to that location is calculated. A velocity is determined for each location. The velocities may be displayed as spatial information or combined (e.g., averaged) to represent a velocity in that area.
- This maximum displacement process while direct, may require multiple tracking locations and consequently many ARFI pushes as represented in FIG. 1 .
- the result is an increased risk of transducer and patient motion.
- the physiological motion varies over time so that the peak displacements for different times at each location are subject to different amounts of motion. This variation in displacement over time may result in the maximum peak being at a different time than if caused only by the ARFI induced wave.
- FIG. 3 shows the time of the peak displacement for each location.
- the slope of the fit line is directly proportional to the shear velocity estimate. This mapping of FIG. 3 is without physiological motion.
- the peak of the displacement profiles are correctly estimated, and the linear fit yields accurate shear wave speed.
- FIG. 4 shows the time-to-peak displacement for each location where physiological motion corrupts the ARFI induced displacements.
- the linear fit of time-to-peak estimates from the displacement profiles has a different slope than shown in FIG. 3 . Because of physiological motion, several time-to peak estimates are incorrect. This leads to errors in the estimated shear wave speed.
- An ultrasound imaging system with high parallel beamforming capability may sample all, most, or many of the spatial locations simultaneously. Assuming that the spatial locations within the region of interest experience the same physiological motion, then at a given slow time, the spatial displacement caused by the ARFI push is biased by the displacement caused by the physiological motion. This bias is the same for all locations at that given time. Rather than find the peak displacement over time for a location, the peak displacement over location for each given time is found. The shear or longitudinal wave motion is tracked based on the spatial distribution of the displacement rather than temporal. As a result, the peak and resulting velocity information may be independent of physiological motion.
- the amplitude and phase information of the ARFI-induced displacements is preserved. Furthermore, no models are needed to model physiological motion. For each peak selection, the displacements are subject to the same or similar motion, so the distortion caused by motion in peak selection is minimized. The errors caused by physiological motion in shear wave speed or other viscoelastic parameters may be eliminated.
- FIG. 5 shows one embodiment of a method for motion independent acoustic radiation force impulse imaging. Rather than finding the peak displacement over time for each location, the peak displacement over location is found for each time. As a result, the velocity estimated from the peak displacements may be more independent of motion. Extra processing to account for or remove physiological or other motion from the displacements or peaks may not be needed.
- any now known or later developed ultrasound scanner performs acts 24 and 26 .
- a processor, controller, or image processor of the ultrasound scanner performs acts 28 - 38 .
- a processor of a computer or workstation separate or remote from the ultrasound scanner performs any one or more of acts 28 - 38 .
- Transmit beamformers, memory, detectors and/or other devices may be used to acquire the data, perform one or more of the acts, and/or output the data.
- the processor may control the devices to perform the method of FIG. 5 .
- shear wave velocity estimation The acts described below are for shear wave velocity estimation. Shear waves travel laterally, so lateral estimates at a given depth or depth range are used. In other embodiments, the velocity of a longitudinal or other wave is estimated. The displacement sampling may be at locations distributed laterally and/or in depth. Any of elasticity, shear wave, or other ARFI induced wave characteristic estimation may use the peak displacement by location for a given time. Velocity is used herein as the characteristic, but other characteristics parameterizing the tissue response to the acoustically induced wave may be estimated, such as Young's Modulus, strain, strain rate, or shear modulus.
- acts 24 - 30 represent one example sequence for determining the velocity of act 32 .
- Other acts or sub-sets may be used to determine the velocity.
- acts 34 and 36 are not performed.
- the motion may remain in the displacements as the use of peak displacement over space removes the motion-induced error in the velocity estimation.
- filtering or other data processing is applied to the displacements.
- act 24 shows transmission of a single excitation pulse.
- Act 24 and the responsive acts 26 , 28 and 30 , may be repeated to measure over a larger region of interest. This repetition occurs before the determination of act 32 .
- the physiological motion is estimated in acts 34 and removed from the displacements prior to act 28 .
- an ARFI push is transmitted by the ultrasound scanner into tissue of a patient.
- the transmission is a transmit beam focused at a depth or range of depths.
- the ARFI transmit beam is transmitted along a transmit scan line.
- the focal depth is on the transmit scan line.
- An array of elements in an ultrasound transducer transmits the ARFI beam converted from electrical waveforms.
- the acoustic energy is transmitted to the tissue in a patient.
- the acoustic waveform is transmitted for generating a shear, longitudinal, or other wave as stress to displace tissue.
- the excitation is an ultrasound excitation pulse.
- the acoustic energy is focused to apply sufficient energy to cause generation of one or more waves that then travel through the tissue from the focal location.
- the acoustic waveform may itself displace the tissue. Other sources of stress may be used.
- the excitation has a mechanical index of close to but not exceeding 1.9 at any of the focal locations and/or in the field of view.
- mechanical index of 1.7 or other level may be used as the upper limit. Greater (e.g., MI exceeding 1.9) or lesser powers may be used.
- the excitation pulse is transmitted with waveforms having any number of cycles.
- one, most, or all of the waveforms for a pushing pulse transmit event have 100-2,000 cycles.
- the number of cycles is tens, hundreds, thousands, or more for the continuous transmit waveforms applied to the elements of the array for the excitation pulse.
- the ARFI excitation or pushing pulse has a greater number of cycles to generate sufficient stress to cause the wave for displacing tissue with an amplitude sufficient to detect.
- the shear wave or waves are generated at the focal region and propagate laterally, axially, and/or in other directions from the focal region.
- the waves may travel in multiple directions.
- the waves reduce in amplitude as the waves travel through the tissue.
- a single excitation pulse is generated.
- a pattern of excitation pulses may be generated. Any pre-determined pattern may be used, such as pulses overlapping in time but with different frequency, focus, or other characteristic.
- One example pattern is a sequence of excitations with a short pause between the pulses. Short may be less than a time for reverberation reduction and/or less than a length of an excitation pulse.
- the pattern provides different excitations prior to tracking in act 26 . Because of the pattern, a series of shear or other waves are generated. This results in a pattern of waves and corresponding displacements at different locations. This pattern may be used to provide additional peaks or other information for estimating a characteristic of the tissue and/or wave.
- the ultrasound scanner measures or detects displacements of the tissue generated in response to the ARFI transmission.
- the response of tissue to the excitation is detected and used to measure the displacement.
- the generated wave is tracked.
- the wave is generated in response to the ARFI transmission.
- the tissue response is a function of the wave created by the ARFI beam and the tissue characteristics.
- the wave is tracked at multiple locations. For a shear wave, the wave is tracked at laterally spaced locations of a same depth or depth range. The tracking detects the effects of the wave rather than specifically identifying where the wave is located at a given time.
- the tracking is performed by ultrasound scanning.
- ultrasound energy is transmitted to the tissue undergoing displacement, and reflections of the acoustic energy are received.
- tissue response to waves in a region of interest transmissions are made to the region, and detection is performed in the region. These other transmissions are for detecting the waves or displacement rather than causing the wave or displacement.
- the transmissions for detection may have lower power and/or short pulses (e.g., 1-5 carrier cycles).
- the displacement indicates the effects of the wave, such as no displacement indicating an absence of the wave and a displacement indicating tissue movement caused by the wave.
- the tissue displaces by an amount or distance that increases to a peak amount and then decreases as the tissue returns to rest.
- one location may be displaced more than other locations since the peak of the wave is located at or by that location.
- the tracking may detect the effects of the wave at any stage (i.e., no wave, increasing displacement, maximum, or decreasing displacement).
- the tissue is scanned multiple times to determine the displacement, such as scanning a region at least twice.
- a sample echo return is compared to a reference.
- the displacement is provided as the difference or offset from the reference scan (first scan) and a later scan (displacement measure).
- the tissue is scanned using any imaging modality capable of scanning for displacement during the tissue's response, such as during or after application of the ARFI excitation pulse.
- the wave is detected at locations adjacent to and/or spaced from the focal region for the ARFI excitation pulse.
- the displacements are sampled at various receive lines (e.g., FIG. 1 shows four receive lines as parallel vertical lines). Non-parallel and/or non-vertical receive lines may be used.
- any number of lateral locations may be used, such as twenty-eight.
- the transmissions for detection may have a wider beam profile along at least one dimension, such as laterally, for simultaneously forming receive samples along a plurality of scan lines (e.g., receive beamforming simultaneously along four or more receive lines). Any number of simultaneous receive beams may be formed, such as four, eight, sixteen, thirty-two, sixty-four, or more.
- the parallel receive beamformer forms beams to sample the entire region of interest, such as the twenty-eight lateral locations. For larger regions of interest, the receive beam spacing is shifted to sample across the full extent of the region in response to each tracking transmission. Parallel beamformation is used to sample across the entire region of interest. For shear wave tracking, four or more receive beams sample four or more locations along four or more tracking lines spaced from the ARFI transmission line or focal point. Each sample location is at a same depth along the tracking lines. Using parallel beamformation, the different locations are sampled simultaneously.
- the tracking transmissions and corresponding receive beams are performed sequentially. For a given receive event (i.e., receiving echoes responsive to a given transmission for tracking), N receive beams are formed. To sample over time, the tracking transmission and receiving of echoes from the multiple locations simultaneously is repeated.
- a region of interest is monitored to detect the wave.
- the region of interest is any size.
- the wave is detected along various depths of one or more lines in ARFI imaging.
- the displacements are tracked at each of a plurality of laterally spaced locations for a limited depth in shear wave imaging.
- the transmission and reception for detection or tracking are performed multiple times for each receive line to determine change due to displacement over time. Due to parallel beamforming, the transmission and reception for detection or tracking allow for detection of displacements at different locations at a same time. Any transmission and reception sequence may be used.
- N is a multiple of two or more and does not exceed the number of simultaneous receive beams for which the receive beamformer is capable.
- N is an integer greater than 8, 16, 32, 64, or other number.
- the tracking allows for measuring N displacements per receive event for N tracking lines, respectively, at one time, and repeating the measuring for the N tracking lines at other times.
- the samples or measured tissue responses are used to determine displacement in act 26 .
- the displacement at each of the locations for any time for which an echo was sampled is determined.
- the displacement at the depth or depth range along each tracking line is determined.
- the displacement is calculated from the ultrasound scan data.
- the tissue moves between two scans.
- a reference scan is performed before the ARFI transmit of act 24 and/or after the generated wave has passed the location.
- the data of the sample scan or the reference scan is translated or shifted in one, two, or three dimensions relative to the data in the other scan.
- an amount of similarity is calculated for data around the location.
- the amount of similarity is determined with correlation, such as a cross-correlation. A minimum sum of absolute differences or other function may be used.
- the spatial offset with the highest or sufficient correlation indicates the amount of displacement for a given location.
- a phase offset of data received from different times is calculated.
- the phase offset indicates the amount of displacement.
- data representing a line e.g., axial
- FIG. 6 A shows estimation of all locations in a 22 mm region of interest at a given depth.
- excitation pulse and tracking may be repeated for different depths. To monitor a larger lateral region, excitation pulses and tracking may repeated for other locations.
- FIG. 6 A shows the displacements as gray-scale amplitude for the various locations and times.
- a bar on the right indicates the mapping of displacement to color (shown as gray level).
- the wave causes a ridge of greater displacements that occur on one lateral side early and the other lateral side later.
- the wave propagates over time across the region of interest, occurring earlier at locations closer to the ARFI focus.
- FIG. 6 B shows a graph of the displacements as a function of location for a given time.
- the time is 3.4 ms.
- FIG. 6 A shows a vertical line at 3.4 ms.
- FIG. 6 B shows the wave causing displacements with greater magnitude starting from 0 mm and increasing to a peak at about 9 mm, and then decreasing until a steady state around 11 mm.
- the steady state shows displacements caused by other factors than the wave or displacements without any contribution by the wave. If the profile of displacements as a function of location were for a later time, then the peak may be shifted to a further location and the steady state may begin to occur at the closer (e.g., lower position) locations.
- FIG. 6 B shows one peak.
- a pattern of excitation pulses are used, multiple waves may be generated. Depending on whether the multiple excitation pulses have a same or different focal location and/or relative timing and the time being sampled, more than one peak may occur in the displacement as a function of location profile.
- the displacements caused by the pattern of waves are detected after the pattern of excitation pulses occurs (e.g., after the multiple shear waves are generated).
- a processor determines a characteristic of the tissue and/or wave or waves generated by the excitation pulse or pulses. Any characteristic may be determined. For example, the shear speed or velocity is determined. In other examples, other viscoelastic parameters (e.g., Young's Modulus) are determined.
- the determination is represented as acts 30 and 32 . Additional, different, or fewer acts may be provided.
- a Fourier transform is applied to the displacements, such as the displacement profile over time. Since the temporal response is used, act 34 is performed prior to calculation of the parameter in act 36 , which replaces act 32 .
- the processor determines the characteristic from a relative amount of the simultaneously measured displacements.
- the displacements from different locations are compared.
- any peaks in the displacement profile over location are identified.
- the displacements are compared to find the greatest displacement.
- a curve is fit to the displacements and the location of the peak in the curve is found.
- the peak of a fit curve may be between two sampling locations.
- Other approaches may be used. The various approaches locate the greatest peak or different peaks in the simultaneously measured displacements. The peak or peaks are across the locations for a given time. The wave is located from the spatial distribution of the displacements. The peak indicates the location of the wave at that time.
- one peak is provided at about 9 mm. Since the peak is found across locations instead of time, the motion (e.g., horizontal line at about 3.3 ⁇ m) contributes a same offset to all of the displacements, so does not affect the shape of the profile or location of the peak.
- the physiological motion biases the profile, such as biasing by adding displacement in this example.
- the analysis is repeated for one or more times.
- the peak or peaks are determined for each of multiple times.
- FIG. 7 shows the location of the peak mapped to the times. As compared to FIG. 3 , the axes of FIG. 7 are reversed or flipped. In this embodiment, the location of the peak displacement at each time is found. In alternative embodiments, only one, two or other sub-sets of the sample times are used.
- a pattern of excitations and resulting waves are used, more than one peak may be located for some or all of the times. This resulting pattern of peaks may be used to estimate the characteristics.
- the peak or peaks are not identified. Instead, the relative displacements as a function of location (e.g., the displacement profile) are used to calculate the characteristic without determining the peak.
- the characteristic such as velocity
- the processor calculates the velocity of the wave caused by the ARFI transmission. Other characteristics may be calculated, but velocity is used in the discussion below.
- the velocity is calculated from the peak or peaks.
- the greatest or locally greater displacement over location is used to calculated velocity.
- the calculation is simply the sample time for the peak and the distance of the location of the peak from the ARFI focal position. This calculation may be repeated for other times, providing velocities at different locations of peaks. Alternatively, the locations of peaks from different times are used to estimate a velocity for the tissue region or region of interest.
- the locations of the peak as a function of time are used.
- a line is fit to the locations of the peaks as a function of time. Any fitting may be used, such as a least squares fit.
- the velocity may be calculated from the slope or inverse of the slope.
- the greatest of the displacements is represented by the locations of the peak displacements at different times.
- a straight line is fit to the locations as a function of time. Accurate estimates of the shear wave speed are found by fitting a line based on the lateral positions of the peaks of the displacement profiles at multiple slow times. For shear-wave speed imaging, it is sufficient to use the spatial profiles with no physiological motion compensation.
- the peaks are independent of the physiological motion, errors caused by the physiological motion variation over time are reduced or eliminated.
- the peaks are found across space for each given time, making the location of the peaks independent of motion. Comparatively, finding the peak for each location over time subjects analysis to variation in displacements caused by physiological motion. As a result, the detected peak may be at a time different than the peak caused by the wave.
- the characteristic is alternatively calculated using phasing.
- the profiles of displacements as a function of locations for different times are correlated.
- the phase offset and the temporal sampling difference may be used to determine the velocity.
- the fitting is directly to the map of displacements (e.g., see FIG. 6 A ) without identifying peaks.
- the fitting may be weighted by the magnitudes of the displacements.
- the displacement magnitudes may be adjusted to account for wave attenuation as a function of distance before the displacement weighted fitting.
- the line provides a slope or angle used to calculate the velocity. By using parallel beamforming across the entire region of interest, the resulting fit may be less susceptible to errors caused by physiological motion.
- FIG. 8 show an example surface or three-dimensional plot of the displacement over position as a function of time. This arrangement represents motion independent velocity determination.
- FIG. 9 shows an example surface or three-dimensional plot of displacement over time as a function of position. The arrangement represents finding the peak over time rather than location. While both FIGS. 8 and 9 show a similar ridge, the reversal of the axes enabled by parallel beamforming allows estimation independent of physiological motion.
- the fitting may be different. For each time, multiple peaks are provided. The peaks may be distinguished from each other so that the different waves are separated.
- the pattern of wave generation e.g., focal location and/or timing
- Velocities for each wave are calculated separately. The resulting velocities may be combined.
- template patterns are matched or fit to the pattern of locations of peaks. The best-fit pattern is associated with a pre-determined velocity. Other approaches may be used, such as using a separation of the locations of peaks at a given time to indicate the velocity.
- the processor estimates physiological motion.
- the contribution of the physiological motion to the displacements may be determined.
- a steady state offset in the displacements is identified.
- displacement from physiological motion may be estimated from the bias of the spatial profile at a time.
- a lowest displacement constant over a threshold distance e.g., 3 or 5 mm
- That lowest displacement represents the bias or physiological motion.
- the bias due to physiological motion is about 3.3 ⁇ m.
- the physiological motion may vary over time. Since displacement profiles as a function of location are created for different times, the bias may be found for each of multiple slow times. The bias for each slow time is the physiological motion for that time. Variation across time may be used to find the period or other motion information.
- the physiological motion may be removed from the displacements.
- the offset or bias for each time is subtracted from the displacements for that time.
- the removal may occur prior to identifying the peaks. Alternatively, the removal occurs after finding the peaks, such as where the displacements are to be used in other analysis.
- the bias is removed to estimate other viscoelastic parameters than velocity.
- Displacement from physiological motion is first estimated from each spatial profile and subtracted prior to further displacement data processing.
- the further data processing may be calculation of a value of a viscoelastic parameter in act 36 .
- a Fourier transform is applied to the displacements after removal of the physiological motion.
- the value of the viscoelastic parameter is derived from the transformed displacements without or with reduced errors from physiological motion contribution.
- the processor outputs the characteristic.
- the output is to a memory, over a network, or on a display.
- the velocity or other characteristic of the wave is displayed as a value in numbers and/or letters (e.g., “2.0 m/s”).
- a graphic representation of the velocity or characteristic is used, such as a pointer on a scale or a bar graph.
- the velocity may be displayed as a color or other indexed symbol.
- a single velocity is determined.
- a user positions a pointer on an image.
- the ultrasound scanner outputs a velocity calculated for that point (e.g., the point is used for the ARFI focus and the velocity for a small region next to or around the point is calculated).
- more than one velocity is output.
- the velocities at different locations are found. For example, a curve is fit, and the slope of the curve at different locations represents the different velocities. As another example, different measurements are made for different locations.
- An image of the velocity is a display of a single velocity or a display of multiple velocities.
- the image may include a one, two, or three-dimensional representation of the velocity or characteristic as a function of space or location.
- the shear velocity throughout a region is displayed.
- Shear velocity values modulate color for pixels in a region in a gray-scale modulated B-mode image.
- the image may represent displacement information, such as shear or moduli (e.g., the shear moduli) for different locations.
- the display grid may be different from the scan grid and/or grid for which displacements are calculated. Color, brightness, luminance, hue, or other characteristic of pixels is modulated as a function of the information derived from the displacements.
- FIG. 10 shows one embodiment of a system for motion independent acoustic radiation force impulse imaging.
- Ultrasound generates tissue displacement, such as through creation of a shear or longitudinal wave, and scan data responsive to the tissue responding to the displacement is used to determine velocity or other characteristic of the wave in the tissue.
- the velocity or other characteristic uses relative displacements as a function of location for each time rather than as a function of time for each location.
- the system is a medical diagnostic ultrasound imaging system.
- the system is a personal computer, workstation, PACS station, or other arrangement at a same location or distributed over a network for real-time or post acquisition imaging.
- the system implements the method of FIG. 5 or other methods.
- the system includes a transmit beamformer 12 , a transducer 14 , a receive beamformer 16 , an image processor 18 , a display 20 , and a memory 22 . Additional, different or fewer components may be provided. For example, a user input is provided for manual or assisted designation of a region of interest for which information is to be obtained.
- the transmit beamformer 12 is an ultrasound transmitter, memory, pulser, analog circuit, digital circuit, or combinations thereof.
- the transmit beamformer 12 is configured to generate waveforms for a plurality of channels with different or relative amplitudes, delays, and/or phasing.
- the waveforms are generated and applied to elements of the transducer 14 with any timing or pulse repetition frequency.
- the transmit beamformer 12 generates a excitation pulse for generating a shear wave in a region of interest and generates corresponding transmissions for tracking resulting displacements with ultrasound.
- the transmit beamformer 12 may be configured to generate a sequence or other combination of excitation pulses for generating multiple waves to be tracked.
- the transmit beamformer 12 connects with the transducer 14 , such as through a transmit/receive switch. Upon transmission of acoustic waves from the transducer 14 , one or more beams are formed during a given transmit event.
- the beams are excitation pulses and/or tracking beams. For scanning tissue displacement, a sequence of transmit beams are generated to scan a one, two or three-dimensional region. Sector, Vector®, linear, or other scan formats may be used.
- the scanning by the transmit beamformer 12 occurs after transmission of the excitation pulse, but may include scanning for reference frames used in tracking before transmitting the excitation pulse.
- the same elements of the transducer 14 are used for both scanning and displacing tissue, but different elements, transducers, and/or beamformers may be used.
- the transducer 14 is a 1-, 1.25-, 1.5-, 1.75- or 2-dimensional array of piezoelectric or capacitive membrane elements.
- the transducer 14 includes a plurality of elements for transducing between acoustic and electrical energies.
- the transducer 14 is a one-dimensional PZT array with about 64-256 elements.
- the transducer 14 connects with the transmit beamformer 12 for converting electrical waveforms into acoustic waveforms, and connects with the receive beamformer 16 for converting acoustic echoes into electrical signals.
- the transducer 14 transmits the excitation pulse and tracking beams.
- the waveforms are focused at a tissue region or location of interest in the patient.
- the acoustic waveforms are generated in response to applying the electrical waveforms to the transducer elements.
- the transducer 14 For scanning with ultrasound to detect displacement, transmits acoustic energy and receives echoes. Receive signals are generated in response to ultrasound energy (echoes) impinging on the elements of the transducer 14 .
- the receive beamformer 16 includes a plurality of channels with amplifiers, delays, and/or phase rotators, and one or more summers. Each channel connects with one or more transducer elements.
- the receive beamformer 16 applies relative delays, phases, and/or apodization to form multiple receive beams in response to each transmission for detection of the tissue response or tracking. Dynamic focusing on receive may be provided. Where only one depth or depth range is of interest, dynamic focusing may or may not be provided.
- the receive beamformer 16 outputs data representing spatial locations using the received acoustic signals. Relative delays and/or phasing and summation of signals from different elements provide beamformation.
- the receive beamformer 16 is a processor for generating samples using Fourier or other transforms.
- the receive beamformer 16 is a parallel receive beamformer configured to include additional sets of channels and corresponding summers. Each channel applies relative delays and/or phasing to form a beam with the summer.
- the receive beams may be formed as a regular sampling of space in a region of interest. The locations are simultaneously sampled by respective receive beams formed by the receive beamformer 16 .
- the receive beamformer 16 may include a filter, such as a filter for isolating information at a second harmonic or other frequency band relative to the transmit frequency band. Such information may more likely include desired tissue, contrast agent, and/or flow information.
- the receive beamformer 16 outputs beam summed data representing spatial locations. Data for a single location, locations along a line, locations for an area, or locations for a volume are output. The data may be for different purposes. For example, different scans are performed for B-mode or tissue detection than for shear or longitudinal wave detection. Alternatively, the B-mode data is also used to determine displacement caused by a shear or longitudinal wave.
- the receive beamformer 16 is configured to detect responses of tissue to the wave generated by the excitation pulse.
- the tissue is scanned.
- the receive signals generated by the receive beamformer 16 represent response from the tissue at the time of sampling.
- different locations are sampled simultaneously. Since the tissue is subject to any displacement caused by the wave, the tissue response is captured by the sampling.
- the acoustic responses are detected at each of a plurality of locations at each of a plurality of times. The responses of the tissue to more than one wave may be detected.
- the processor 18 or a separate beamformer controller configures the beamformers 12 , 16 .
- the values of acquisition parameters used by the beamformers 12 , 16 for ARFI imaging are set. Any control structure or format may be used to establish the ARFI imaging sequence.
- the beamformers 12 , 16 are caused to acquire data for ARFI imaging at a frame rate and/or with a resolution. Different values of one or more acquisition parameters may result in a different frame rate and/or resolution.
- the processor 18 is a B-mode detector, Doppler detector, pulsed wave Doppler detector, correlation processor, Fourier transform processor, application specific integrated circuit, general processor, control processor, image processor, field programmable gate array, digital signal processor, analog circuit, digital circuit, combinations thereof or other now known or later developed device for calculating displacements from responses output by the receive beamformer 16 .
- the processor 18 includes one or more detectors and a separate processor.
- the separate processor is a control processor, general processor, digital signal processor, graphics processing unit, application specific integrated circuit, field programmable gate array, network, server, group of processors, data path, combinations thereof or other now known or later developed device for determining displacement and/or calculating velocity from displacements.
- the processor 18 is configured by software and/or hardware to perform the acts.
- the processor 18 estimates tissue displacement for each of a plurality of lateral locations. The displacements occurring at a same time are estimated. Estimates of displacements for the various locations are formed for each of the sample times. The data output by the receive beamformer 16 is used to determine the displacement at different locations for each of a plurality of times. The displacements may be obtained by correlating or otherwise determining level of similarity between reference data and data obtained to represent the tissue at a time.
- the processor 18 is configured to calculate tissue characteristics form the displacements of the tissue at different locations. For example, a shear velocity is calculated from the displacements. In another example, the processor 18 calculates viscosity and/or modulus. The processor 18 may calculate other properties, such as strain or elasticity.
- the processor 18 is configured to estimate the velocity or other characteristic from the relative displacements over space. One or more peaks in a profile of the displacements as a function of location are found. Using parallel beamforming, the displacements for the various locations at a given time are subject to the same or similar motion. By finding peaks over space for each time, the variability of the motion may be ignored.
- the processor 18 is configured to determine the velocity of the wave in the tissue from the peaks.
- a line or pattern is fit to the peaks by location as a function of time.
- the slope of the line, slopes of lines in the pattern, or label with the pattern indicates the velocity.
- Other calculations for velocity may be used.
- Pattern matching, phasing, or other approaches using the simultaneously acquired displacements for each time may be used.
- the processor 18 is configured to identify the part of the displacements caused by physiological motion for each time. This undesired motion may be removed. As a result, viscoelastic parameters relying on variance over time of the displacements may be calculated with minimal influence by physiological motion.
- the processor 18 generates and outputs image or display values mapped from the characteristic to the display 20 . For example, the velocity, shear modulus or other value is determined. A text or numerical indication of the characteristic is displayed to the user. A graph of the characteristic over time may be displayed.
- the property is displayed as a function of location. Values, graphs, and/or tissue representations may be displayed using the velocity at different locations. For a representation of the tissue, the magnitude of the wave or tissue characteristic modulates the color, hue, brightness, and/or other display characteristic for different pixels representing a tissue region.
- the processor 18 determines a pixel value (e.g., RGB) or a scalar value converted to a pixel value. The image is generated as the scalar or pixel values. The image may be output to a video processor, look-up table, color map, or directly to the display 20 .
- the display 20 is a CRT, LCD, monitor, plasma, projector, printer, or other device for displaying an image or sequence of images. Any now known or later developed display 20 may be used.
- the display 20 is operable to display one image or a sequence of images.
- the display 20 displays two-dimensional images or three-dimensional representations.
- the display 20 displays one or more images representing the tissue characteristic or other information derived from displacements. As an example, a velocity associated with a location indicated on a two-dimensional image or three-dimensional B-mode representation is displayed. Alternatively or additionally, the image is a graph.
- the processor 18 , the receive beamformer 16 , and the transmit beamformer 12 operate pursuant to instructions stored in the memory 22 or another memory.
- the instructions configure the system for performance of the acts of FIG. 5 .
- the instructions configure the processor 18 , the receive beamformer 16 , and/or the transmit beamformer 12 for operation by being loaded into a controller, by causing loading of a table of values (e.g., elasticity imaging sequence), and/or by being executed.
- the transmit beamformer 12 is configured by the instructions to cause generation of an excitation beam and tracking beams.
- the receive beamformer 16 is configured by the instruction to acquire data for tracking.
- the processor 18 is configured to estimate displacements and determine the velocity from peaks detected as a function of location for each of various times.
- the memory 22 is a non-transitory computer readable storage media.
- the instructions for implementing the processes, methods and/or techniques discussed herein are provided on the computer-readable storage media or memories, such as a cache, buffer, RAM, removable media, hard drive or other computer readable storage media.
- Computer readable storage media include various types of volatile and nonvolatile storage media.
- the functions, acts, or tasks illustrated in the figures or described herein are executed in response to one or more sets of instructions stored in or on computer readable storage media.
- the functions, acts or tasks are independent of the particular type of instructions set, storage media, processor or processing strategy and may be performed by software, hardware, integrated circuits, firmware, micro code and the like, operating alone or in combination.
- processing strategies may include multiprocessing, multitasking, parallel processing, and the like.
- the instructions are stored on a removable media device for reading by local or remote systems.
- the instructions are stored in a remote location for transfer through a computer network or over telephone lines.
- the instructions are stored within a given computer, CPU, GPU or system.
Abstract
Description
Claims (19)
Priority Applications (4)
| Application Number | Priority Date | Filing Date | Title |
|---|---|---|---|
| US14/991,635 US11717256B2 (en) | 2016-01-08 | 2016-01-08 | Motion independence in acoustic radiation force impulse imaging |
| FR1750074A FR3046693B1 (en) | 2016-01-08 | 2017-01-05 | MOVEMENT INDEPENDENCE IN ACOUSTIC RADIATION PULSE IMAGING |
| KR1020170002489A KR101914706B1 (en) | 2016-01-08 | 2017-01-06 | Motion independence in acoustic radiation force impulse imaging |
| CN201710009554.1A CN106955125B (en) | 2016-01-08 | 2017-01-06 | Motion independence in acoustic radiation force pulse imaging |
Applications Claiming Priority (1)
| Application Number | Priority Date | Filing Date | Title |
|---|---|---|---|
| US14/991,635 US11717256B2 (en) | 2016-01-08 | 2016-01-08 | Motion independence in acoustic radiation force impulse imaging |
Publications (2)
| Publication Number | Publication Date |
|---|---|
| US20170196533A1 US20170196533A1 (en) | 2017-07-13 |
| US11717256B2 true US11717256B2 (en) | 2023-08-08 |
Family
ID=59241569
Family Applications (1)
| Application Number | Title | Priority Date | Filing Date |
|---|---|---|---|
| US14/991,635 Active 2041-07-04 US11717256B2 (en) | 2016-01-08 | 2016-01-08 | Motion independence in acoustic radiation force impulse imaging |
Country Status (4)
| Country | Link |
|---|---|
| US (1) | US11717256B2 (en) |
| KR (1) | KR101914706B1 (en) |
| CN (1) | CN106955125B (en) |
| FR (1) | FR3046693B1 (en) |
Families Citing this family (4)
| Publication number | Priority date | Publication date | Assignee | Title |
|---|---|---|---|---|
| CN108852416B (en) | 2018-05-17 | 2021-03-30 | 深圳开立生物医疗科技股份有限公司 | Method and device for determining propagation speed of shear wave |
| US11311275B2 (en) * | 2019-03-28 | 2022-04-26 | Siemens Medical Solutions Usa, Inc. | Asymmetry for acoustic radiation force impulse |
| CN110547825B (en) * | 2019-09-03 | 2022-04-26 | 上海交通大学 | Ultrasonic elastography technology based on multi-frequency shear wave amplitude analysis |
| CN110613484B (en) * | 2019-09-26 | 2021-02-19 | 无锡海斯凯尔医学技术有限公司 | Tissue elasticity detection method and equipment |
Citations (19)
| Publication number | Priority date | Publication date | Assignee | Title |
|---|---|---|---|---|
| US20080021319A1 (en) * | 2006-07-20 | 2008-01-24 | James Hamilton | Method of modifying data acquisition parameters of an ultrasound device |
| US20080249408A1 (en) * | 2007-02-09 | 2008-10-09 | Palmeri Mark L | Methods, Systems and Computer Program Products for Ultrasound Shear Wave Velocity Estimation and Shear Modulus Reconstruction |
| US20100160778A1 (en) * | 2008-11-03 | 2010-06-24 | University Of British Columbia | Method and apparatus for determining viscoelastic parameters in tissue |
| US20120065507A1 (en) * | 2010-09-09 | 2012-03-15 | Siemens Medical Solutions Usa, Inc. | Reduction of motion artifacts in ultrasound imaging with a flexible ultrasound transducer |
| US20120089019A1 (en) | 2010-10-06 | 2012-04-12 | Siemens Medical Solutions Usa, Inc. | Solving for Shear Wave Information in Medical Ultrasound Imaging |
| US20120136250A1 (en) * | 2009-09-04 | 2012-05-31 | Hitachi Medical Corporation | Ultrasonic diagnostic device |
| US20120215101A1 (en) * | 2011-02-17 | 2012-08-23 | Siemens Medical Solutions Usa, Inc | Viscoelasticity Measurement Using Amplitude-Phase Modulated Ultrasound Wave |
| US20130024136A1 (en) * | 2008-10-28 | 2013-01-24 | The University Of North Carolina At Chapel Hill | Methods, systems and computer readable media for applying multi-push acoustic radiation force to samples and monitoring a response to quantify mechanical properties of samples |
| US20130218011A1 (en) * | 2012-02-16 | 2013-08-22 | Siemens Medical Solutions Usa, Inc. | Visualization of Associated Information in Ultrasound Shear Wave Imaging |
| US8532430B2 (en) | 2011-07-28 | 2013-09-10 | General Electric Company | Methods for reducing motion artifacts in shear wave images |
| US20130267847A1 (en) | 2012-04-05 | 2013-10-10 | Tadashi Tamura | Methods and apparatus for ultrasound imaging |
| US20140330122A1 (en) * | 2011-08-19 | 2014-11-06 | The University Of British Columbia | Elastography Using Ultrasound Imaging of a Thin Volume |
| US20150005633A1 (en) * | 2013-07-01 | 2015-01-01 | Kabushiki Kaisha Toshiba | Ultrasonic diagnostic apparatus and method of ultrasonic imaging |
| US20150087976A1 (en) | 2013-09-24 | 2015-03-26 | Siemens Medical Solutions Usa, Inc. | Shear Wave Estimation from Analytic Data |
| KR20150037689A (en) | 2013-09-30 | 2015-04-08 | 지멘스 메디컬 솔루션즈 유에스에이, 인크. | Shear wave detection in medical ultrasound imaging |
| US20150133783A1 (en) | 2013-11-08 | 2015-05-14 | Hitachi Aloka Medical, Ltd. | Apparatus and method for ultrasonic diagnosis |
| US20150201905A1 (en) | 2014-01-21 | 2015-07-23 | Siemens Medical Solutions Usa, Inc. | Swept focus for acoustic radiation force impulse |
| US20160199034A1 (en) | 2015-01-12 | 2016-07-14 | Siemens Medical Solutions Usa, Inc. | Sparse tracking in acoustic radiation force impulse imaging |
| US9794394B2 (en) | 2013-07-23 | 2017-10-17 | Lg Electronics Inc. | Mobile terminal |
-
2016
- 2016-01-08 US US14/991,635 patent/US11717256B2/en active Active
-
2017
- 2017-01-05 FR FR1750074A patent/FR3046693B1/en active Active
- 2017-01-06 KR KR1020170002489A patent/KR101914706B1/en active IP Right Grant
- 2017-01-06 CN CN201710009554.1A patent/CN106955125B/en active Active
Patent Citations (24)
| Publication number | Priority date | Publication date | Assignee | Title |
|---|---|---|---|---|
| US20080021319A1 (en) * | 2006-07-20 | 2008-01-24 | James Hamilton | Method of modifying data acquisition parameters of an ultrasound device |
| US20080249408A1 (en) * | 2007-02-09 | 2008-10-09 | Palmeri Mark L | Methods, Systems and Computer Program Products for Ultrasound Shear Wave Velocity Estimation and Shear Modulus Reconstruction |
| US20130024136A1 (en) * | 2008-10-28 | 2013-01-24 | The University Of North Carolina At Chapel Hill | Methods, systems and computer readable media for applying multi-push acoustic radiation force to samples and monitoring a response to quantify mechanical properties of samples |
| US20100160778A1 (en) * | 2008-11-03 | 2010-06-24 | University Of British Columbia | Method and apparatus for determining viscoelastic parameters in tissue |
| US20120136250A1 (en) * | 2009-09-04 | 2012-05-31 | Hitachi Medical Corporation | Ultrasonic diagnostic device |
| US8727995B2 (en) | 2010-09-09 | 2014-05-20 | Siemens Medical Solutions Usa, Inc. | Reduction of motion artifacts in ultrasound imaging with a flexible ultrasound transducer |
| US20120065507A1 (en) * | 2010-09-09 | 2012-03-15 | Siemens Medical Solutions Usa, Inc. | Reduction of motion artifacts in ultrasound imaging with a flexible ultrasound transducer |
| US20120089019A1 (en) | 2010-10-06 | 2012-04-12 | Siemens Medical Solutions Usa, Inc. | Solving for Shear Wave Information in Medical Ultrasound Imaging |
| KR20120035901A (en) | 2010-10-06 | 2012-04-16 | 지멘스 메디컬 솔루션즈 유에스에이, 인크. | Solving for shear wave information in medical ultrasound imaging |
| US20120215101A1 (en) * | 2011-02-17 | 2012-08-23 | Siemens Medical Solutions Usa, Inc | Viscoelasticity Measurement Using Amplitude-Phase Modulated Ultrasound Wave |
| US8532430B2 (en) | 2011-07-28 | 2013-09-10 | General Electric Company | Methods for reducing motion artifacts in shear wave images |
| US20140330122A1 (en) * | 2011-08-19 | 2014-11-06 | The University Of British Columbia | Elastography Using Ultrasound Imaging of a Thin Volume |
| US20130218011A1 (en) * | 2012-02-16 | 2013-08-22 | Siemens Medical Solutions Usa, Inc. | Visualization of Associated Information in Ultrasound Shear Wave Imaging |
| CN104244838A (en) | 2012-04-05 | 2014-12-24 | 日立阿洛卡医疗株式会社 | Methods and apparatus for ultrasound imaging |
| US20130267847A1 (en) | 2012-04-05 | 2013-10-10 | Tadashi Tamura | Methods and apparatus for ultrasound imaging |
| US20150005633A1 (en) * | 2013-07-01 | 2015-01-01 | Kabushiki Kaisha Toshiba | Ultrasonic diagnostic apparatus and method of ultrasonic imaging |
| US9794394B2 (en) | 2013-07-23 | 2017-10-17 | Lg Electronics Inc. | Mobile terminal |
| US20150087976A1 (en) | 2013-09-24 | 2015-03-26 | Siemens Medical Solutions Usa, Inc. | Shear Wave Estimation from Analytic Data |
| KR20150037689A (en) | 2013-09-30 | 2015-04-08 | 지멘스 메디컬 솔루션즈 유에스에이, 인크. | Shear wave detection in medical ultrasound imaging |
| US20150133783A1 (en) | 2013-11-08 | 2015-05-14 | Hitachi Aloka Medical, Ltd. | Apparatus and method for ultrasonic diagnosis |
| JP2015092937A (en) | 2013-11-08 | 2015-05-18 | 日立アロカメディカル株式会社 | Ultrasonic diagnostic apparatus, and method |
| US20150201905A1 (en) | 2014-01-21 | 2015-07-23 | Siemens Medical Solutions Usa, Inc. | Swept focus for acoustic radiation force impulse |
| US20160199034A1 (en) | 2015-01-12 | 2016-07-14 | Siemens Medical Solutions Usa, Inc. | Sparse tracking in acoustic radiation force impulse imaging |
| FR3031448A1 (en) | 2015-01-12 | 2016-07-15 | Siemens Medical Solutions Usa Inc |
Non-Patent Citations (5)
| Title |
|---|
| Dahl, et al., "A Parallel Tracking Method for Acoustic Radiation Force Impulse Imaging", IEEE Transactions on Ultrasonics, Ferroelectrics, and Frequency Control, vol. 54, No. 2, Feb. 2007, pp. 301-312 (Year: 2007). * |
| Nightingale, K., Acoustic Radiation Force Impulse (ARFI) Imaging: a Review, Current Medical Imaging Rev. Nov. 1, 2011; 7(4): 328-339. (Year: 2011). * |
| Office action from counterpart Korean application No. 10-2017-0002489, filed Jan. 6, 2017, 16 total pages (including English translation). |
| Sigrist et al. "Ultrasound Elastography: Review of Techniques and Clinical Applications", Theranostics 2017, vol. 7, Is. 5. pp. 1303-1329. * |
| U.S. Appl. No. 14/823,957, filed Aug. 11, 2015. |
Also Published As
| Publication number | Publication date |
|---|---|
| KR20170083507A (en) | 2017-07-18 |
| FR3046693A1 (en) | 2017-07-14 |
| US20170196533A1 (en) | 2017-07-13 |
| CN106955125B (en) | 2020-03-13 |
| FR3046693B1 (en) | 2020-11-20 |
| KR101914706B1 (en) | 2018-11-02 |
| CN106955125A (en) | 2017-07-18 |
Similar Documents
| Publication | Publication Date | Title |
|---|---|---|
| US10159466B2 (en) | Sparse tracking in acoustic radiation force impulse imaging | |
| US9554770B2 (en) | High pulse repetition frequency for detection of tissue mechanical property with ultrasound | |
| EP2926739B1 (en) | Acquisition control for elasticity ultrasound imaging | |
| US10278671B2 (en) | Shear wave detection in medical ultrasound imaging | |
| US10582911B2 (en) | Adaptive motion estimation in acoustic radiation force imaging | |
| US11154277B2 (en) | Tissue viscoelastic estimation from shear velocity in ultrasound medical imaging | |
| US8801614B2 (en) | On-axis shear wave characterization with ultrasound | |
| US11006928B2 (en) | Sound speed imaging using shear waves | |
| KR101935514B1 (en) | Frequency compounding in elasticity imaging | |
| KR101914706B1 (en) | Motion independence in acoustic radiation force impulse imaging | |
| CN110893103A (en) | Angle for ultrasound-based shear wave imaging | |
| KR102187153B1 (en) | Shear speed imaging using coherence | |
| EP2853918B1 (en) | Shear wave detection in medical ultrasound imaging | |
| US11452503B2 (en) | Shear wave imaging based on ultrasound with increased pulse repetition frequency | |
| US11963824B2 (en) | Shear wave imaging based on ultrasound with increased pulse repetition interval |
Legal Events
| Date | Code | Title | Description |
|---|---|---|---|
| AS | Assignment |
Owner name: SIEMENS MEDICAL SOLUTIONS USA, INC., PENNSYLVANIA Free format text: ASSIGNMENT OF ASSIGNORS INTEREST;ASSIGNORS:LABYED, YASSIN;FAN, LIEXIANG;REEL/FRAME:037614/0783 Effective date: 20160105 |
|
| STPP | Information on status: patent application and granting procedure in general |
Free format text: RESPONSE TO NON-FINAL OFFICE ACTION ENTERED AND FORWARDED TO EXAMINER |
|
| STPP | Information on status: patent application and granting procedure in general |
Free format text: FINAL REJECTION MAILED |
|
| STPP | Information on status: patent application and granting procedure in general |
Free format text: RESPONSE AFTER FINAL ACTION FORWARDED TO EXAMINER |
|
| STPP | Information on status: patent application and granting procedure in general |
Free format text: ADVISORY ACTION MAILED |
|
| STCV | Information on status: appeal procedure |
Free format text: NOTICE OF APPEAL FILED |
|
| STCV | Information on status: appeal procedure |
Free format text: APPEAL BRIEF (OR SUPPLEMENTAL BRIEF) ENTERED AND FORWARDED TO EXAMINER |
|
| STPP | Information on status: patent application and granting procedure in general |
Free format text: NON FINAL ACTION MAILED |
|
| STPP | Information on status: patent application and granting procedure in general |
Free format text: RESPONSE TO NON-FINAL OFFICE ACTION ENTERED AND FORWARDED TO EXAMINER |
|
| STPP | Information on status: patent application and granting procedure in general |
Free format text: FINAL REJECTION MAILED |
|
| STPP | Information on status: patent application and granting procedure in general |
Free format text: RESPONSE AFTER FINAL ACTION FORWARDED TO EXAMINER |
|
| STCV | Information on status: appeal procedure |
Free format text: NOTICE OF APPEAL FILED |
|
| STCV | Information on status: appeal procedure |
Free format text: APPEAL BRIEF (OR SUPPLEMENTAL BRIEF) ENTERED AND FORWARDED TO EXAMINER |
|
| STCV | Information on status: appeal procedure |
Free format text: EXAMINER'S ANSWER TO APPEAL BRIEF MAILED |
|
| STCV | Information on status: appeal procedure |
Free format text: ON APPEAL -- AWAITING DECISION BY THE BOARD OF APPEALS |
|
| STCV | Information on status: appeal procedure |
Free format text: BOARD OF APPEALS DECISION RENDERED |
|
| STPP | Information on status: patent application and granting procedure in general |
Free format text: DOCKETED NEW CASE - READY FOR EXAMINATION |
|
| STPP | Information on status: patent application and granting procedure in general |
Free format text: NON FINAL ACTION MAILED |
|
| STPP | Information on status: patent application and granting procedure in general |
Free format text: PUBLICATIONS -- ISSUE FEE PAYMENT VERIFIED |
|
| STCF | Information on status: patent grant |
Free format text: PATENTED CASE |