US11663262B2 - System and method for generating a geographic information card map - Google Patents
System and method for generating a geographic information card map Download PDFInfo
- Publication number
- US11663262B2 US11663262B2 US16/836,072 US202016836072A US11663262B2 US 11663262 B2 US11663262 B2 US 11663262B2 US 202016836072 A US202016836072 A US 202016836072A US 11663262 B2 US11663262 B2 US 11663262B2
- Authority
- US
- United States
- Prior art keywords
- geographic
- geographic information
- card
- information card
- entity
- Prior art date
- Legal status (The legal status is an assumption and is not a legal conclusion. Google has not performed a legal analysis and makes no representation as to the accuracy of the status listed.)
- Active, expires
Links
Images


Classifications
-
- G—PHYSICS
- G06—COMPUTING; CALCULATING OR COUNTING
- G06F—ELECTRIC DIGITAL DATA PROCESSING
- G06F16/00—Information retrieval; Database structures therefor; File system structures therefor
- G06F16/40—Information retrieval; Database structures therefor; File system structures therefor of multimedia data, e.g. slideshows comprising image and additional audio data
- G06F16/44—Browsing; Visualisation therefor
- G06F16/444—Spatial browsing, e.g. 2D maps, 3D or virtual spaces
-
- G—PHYSICS
- G06—COMPUTING; CALCULATING OR COUNTING
- G06F—ELECTRIC DIGITAL DATA PROCESSING
- G06F16/00—Information retrieval; Database structures therefor; File system structures therefor
- G06F16/20—Information retrieval; Database structures therefor; File system structures therefor of structured data, e.g. relational data
- G06F16/29—Geographical information databases
-
- G—PHYSICS
- G06—COMPUTING; CALCULATING OR COUNTING
- G06F—ELECTRIC DIGITAL DATA PROCESSING
- G06F16/00—Information retrieval; Database structures therefor; File system structures therefor
- G06F16/90—Details of database functions independent of the retrieved data types
- G06F16/904—Browsing; Visualisation therefor
-
- G—PHYSICS
- G06—COMPUTING; CALCULATING OR COUNTING
- G06F—ELECTRIC DIGITAL DATA PROCESSING
- G06F16/00—Information retrieval; Database structures therefor; File system structures therefor
- G06F16/90—Details of database functions independent of the retrieved data types
- G06F16/907—Retrieval characterised by using metadata, e.g. metadata not derived from the content or metadata generated manually
- G06F16/909—Retrieval characterised by using metadata, e.g. metadata not derived from the content or metadata generated manually using geographical or spatial information, e.g. location
-
- G—PHYSICS
- G06—COMPUTING; CALCULATING OR COUNTING
- G06F—ELECTRIC DIGITAL DATA PROCESSING
- G06F3/00—Input arrangements for transferring data to be processed into a form capable of being handled by the computer; Output arrangements for transferring data from processing unit to output unit, e.g. interface arrangements
- G06F3/01—Input arrangements or combined input and output arrangements for interaction between user and computer
- G06F3/017—Gesture based interaction, e.g. based on a set of recognized hand gestures
-
- G—PHYSICS
- G06—COMPUTING; CALCULATING OR COUNTING
- G06F—ELECTRIC DIGITAL DATA PROCESSING
- G06F3/00—Input arrangements for transferring data to be processed into a form capable of being handled by the computer; Output arrangements for transferring data from processing unit to output unit, e.g. interface arrangements
- G06F3/01—Input arrangements or combined input and output arrangements for interaction between user and computer
- G06F3/048—Interaction techniques based on graphical user interfaces [GUI]
- G06F3/0481—Interaction techniques based on graphical user interfaces [GUI] based on specific properties of the displayed interaction object or a metaphor-based environment, e.g. interaction with desktop elements like windows or icons, or assisted by a cursor's changing behaviour or appearance
- G06F3/0482—Interaction with lists of selectable items, e.g. menus
-
- G—PHYSICS
- G06—COMPUTING; CALCULATING OR COUNTING
- G06F—ELECTRIC DIGITAL DATA PROCESSING
- G06F3/00—Input arrangements for transferring data to be processed into a form capable of being handled by the computer; Output arrangements for transferring data from processing unit to output unit, e.g. interface arrangements
- G06F3/01—Input arrangements or combined input and output arrangements for interaction between user and computer
- G06F3/048—Interaction techniques based on graphical user interfaces [GUI]
- G06F3/0484—Interaction techniques based on graphical user interfaces [GUI] for the control of specific functions or operations, e.g. selecting or manipulating an object, an image or a displayed text element, setting a parameter value or selecting a range
- G06F3/04845—Interaction techniques based on graphical user interfaces [GUI] for the control of specific functions or operations, e.g. selecting or manipulating an object, an image or a displayed text element, setting a parameter value or selecting a range for image manipulation, e.g. dragging, rotation, expansion or change of colour
-
- G—PHYSICS
- G06—COMPUTING; CALCULATING OR COUNTING
- G06F—ELECTRIC DIGITAL DATA PROCESSING
- G06F3/00—Input arrangements for transferring data to be processed into a form capable of being handled by the computer; Output arrangements for transferring data from processing unit to output unit, e.g. interface arrangements
- G06F3/01—Input arrangements or combined input and output arrangements for interaction between user and computer
- G06F3/048—Interaction techniques based on graphical user interfaces [GUI]
- G06F3/0484—Interaction techniques based on graphical user interfaces [GUI] for the control of specific functions or operations, e.g. selecting or manipulating an object, an image or a displayed text element, setting a parameter value or selecting a range
- G06F3/0485—Scrolling or panning
-
- H—ELECTRICITY
- H04—ELECTRIC COMMUNICATION TECHNIQUE
- H04B—TRANSMISSION
- H04B1/00—Details of transmission systems, not covered by a single one of groups H04B3/00 - H04B13/00; Details of transmission systems not characterised by the medium used for transmission
- H04B1/38—Transceivers, i.e. devices in which transmitter and receiver form a structural unit and in which at least one part is used for functions of transmitting and receiving
- H04B1/3827—Portable transceivers
Definitions
- the present disclosure relates to displaying geographic data and more particularly, to dividing a geographic area into geographic entities of various shapes and sizes, and for each geographic entity, displaying a schematic representation of the geographic entity.
- map applications display map tiles which are equally sized portions of a geographic area that include map features, such as states, cities, roads, streets, rivers, mountains, etc., and/or map labels.
- map features such as states, cities, roads, streets, rivers, mountains, etc.
- map labels such as maps, cities, roads, streets, rivers, mountains, etc.
- the user may select among several scales for viewing the map. When the user increases the scale, the geographic area may be divided into a larger number of map tiles which display the map features at a higher level of detail.
- qualitative information for places is commonly displayed on computing devices, such as computers, tablets, and mobile phones via map applications, web browsers, etc. in displays separate from the map view. For example, reviews of points of interest (POIs) or photographs of a POI may be displayed.
- POIs points of interest
- photographs of a POI may be displayed.
- a card map application on a client computing device displays a schematic representation of geographic entities.
- the schematic representation includes qualitative information about each geographic entity, where the geographic entities are organized spatially.
- each of the U.S. states may be displayed on an individual geographic information card, which includes such information as photographs of the state, a description of the state, reviews of POIs in the state, a map view of the state, etc.
- the geographic information cards may be displayed side-by-side, above, and below each other in a grid pattern to define a “card map,” where the geographic information card for each state is positioned according to the state's location in relation to the other states.
- the geographic information card for California may be displayed to the left of the geographic information card for Nevada and below the geographic information card for Oregon on a card map display.
- the card map application Rather than dividing a geographic area (e.g., the United States) into map tiles which represent equally sized portions of the geographic area, or otherwise generating a digital map that accurately represents distances, sizes, and other geographic properties, the card map application generates the geographic information cards according to political boundaries, population, popularity, information density, etc. In this manner, a user may view portions of the geographic area which are recognizable and likely to be significant to the user. For example, if the information density in portions of Nevada is low, such as locations between Reno and Las Vegas, the card map application may not generate geographic information cards for such locations.
- a geographic area e.g., the United States
- the card map application may not generate geographic information cards for such locations.
- the user does not have to navigate through several geographic information cards between Reno and Las Vegas on the card map display, and also may learn that a big city does not exist between the two locations when planning a trip, for example.
- the present embodiments advantageously allow users to view spatially organized information along with qualitative information for places. In this manner, users do not have to navigate back and forth between multiple views (e.g., a map view and a review page) when researching a particular place.
- an example embodiment of the techniques of the present disclosure is a method for presenting geographic data on a client computing device.
- the method includes generating geographic information cards for respective geographic entities, where at least two of the geographic information cards of an equal size correspond to geographic areas of different sizes or geometries.
- the method further includes generating a representation of a geographic area using the geographic information cards, including placing each geographic information card relative to the rest of the geographic information cards in accordance with relative geographic positioning of the corresponding geographic entities.
- the method includes providing the representation of the geographic area via a user interface of the client computing device, where at least some of the geographic information cards are individually selectable to display additional information related to the corresponding geographic entities.
- Another example embodiment is a client computing device for presenting geographic data
- the client computing device includes a user interface, one or more processors coupled to the user interface, and a non-transitory computer-readable memory coupled to the one or more processors and storing thereon instructions.
- the instructions when executed by the one or more processors, cause the client computing device to generate geographic information cards for respective geographic entities, where at least two of the geographic information cards of an equal size correspond to geographic areas of different sizes or geometries, and generate a representation of a geographic area using the geographic information cards, including placing each geographic information card relative to the rest of the geographic information cards in accordance with relative geographic positioning of the corresponding geographic entities.
- the instructions further cause the client computing device to provide the representation of the geographic area via the user interface of the client computing device, where at least some of the geographic information cards are individually selectable to display additional information related to the corresponding geographic entities.
- Yet another example embodiment is a server device for presenting geographic data
- the server device includes one or more processors and a non-transitory computer-readable memory coupled to the one or more processors and storing thereon instructions.
- the instructions when executed by the one or more processors, cause the server device to divide a geographic area into a plurality of regions each representing a different geographic entity, where at each higher level of detail the geographic area is divided into more regions, and where at least two regions at a same level of detail correspond to geographic entities having different sizes or geometries.
- the instructions cause the server device to retrieve indications of geographic information data for the region and in response to receiving a request from a client computing device for the geographic information data for a geographic area, the instructions cause the server device to identify one or more regions corresponding to the geographic area. The instructions further cause the client computing device to provide the indications of the geographic information data for the one or more identified regions to the client computing device for displaying geographic information cards for the geographic area.
- FIG. 1 is a block diagram of an example system in which techniques for providing a card map display to a client computing device can be implemented;
- FIG. 2 is an example map view of a geographic area
- FIG. 3 A is an example schematic representation of the geographic area divided at a first level of detail for generating geographic information cards
- FIG. 3 B is an example schematic representation of a portion of the geographic area divided at a second level of detail for generating geographic information cards
- FIG. 4 is a diagram of an example knowledge repository which stores qualitative information for various geographic entities
- FIG. 5 A is a first view of an example card map display including several geographic information cards organized spatially in a grid pattern;
- FIG. 5 B is a second view of the example card map display after a user pans to the right from the first view as shown in FIG. 5 A ;
- FIG. 6 is a flow diagram of an example method for displaying the card map display, which can be implemented in the client computing device.
- FIG. 7 is a flow diagram of an example method for generating the geographic information cards, which can be implemented in a server device.
- the present embodiments allow a user to view a schematic representation of several geographic entities within a geographic area in a card map display.
- Each geographic entity may be presented in a geographic information card of the same size and shape on the card map display regardless of the geographic entity's geometry.
- the card map display presents geographic information data to a user in proportion to a likely level of importance of the geographic entity.
- each geographic information card may include qualitative information about the geographic entities in addition to map data.
- each geographic information card may include the name of the geographic entity, a description of the geographic entity, interactive icons with links to: a map display, reviews of the geographic entity, photographs of the geographic entity, etc.
- the geographic entities may be arranged on the card map display in a manner that allows the user may navigate from place to place by panning or zooming on the card map display. In this manner, a user can pan to the right to view geographic information cards to the east of the currently viewed geographic information card, can pan to the top to view geographic information cards to the north of the currently viewed geographic information card, etc.
- the user may be able to zoom in and out to view geographic information cards for geographic areas at higher and lower levels of detail.
- a user may view a geographic information card of Fremont, a neighborhood in Seattle.
- the geographic information card may include a description of Fremont and interactive icons with links to view a map of Fremont, and links to restaurants, bars, and shopping in Fremont.
- the user may zoom out of Fremont and view a geographic information card of Seattle, Wash.
- This geographic information card may include interactive icons with links to view a map of Seattle, links to restaurants, theaters, and historical landmarks in Seattle, and links to view photographs of Seattle.
- the user may zoom out once again to view a geographic information card of Washington.
- the server device may retrieve the information about a geographic area from a knowledge repository which organizes data or information about geographic entities around semantic principles, such as geographic relationships (e.g., city, country).
- a server device may construct a tree data structure, where descendant nodes correspond to a portion of a geographic area at a higher level of detail as their respective ancestor nodes (e.g., an ancestor node may represent the entire United States while a descendant node may represent the state of Washington).
- Each node may correspond to a different geographic information card.
- the nodes may not be assigned according to the size of a corresponding geographic area and instead may be assigned based on population, popularity, information density, etc.
- Several nodes at the same level of detail may correspond to portions of a geographic area having different sizes or geometries (e.g., Washington and California).
- a geographic information card may be generated for the United States, and a single geographic information card may be generated for the Pacific Ocean.
- a geographic information card for Japan may be displayed, for example.
- a “geographic information card” may refer to a rectangular display of one or several types of information for a particular geographic entity.
- the information may be geographic information data including a name of the geographic entity, a description of the geographic entity, POIs located within the geographic entity, reviews of the POIs, photographs of the geographic entity, a map view of the geographic entity, etc.
- the geographic information card may include indications of the geographic information data, which may be the geographic information data itself (e.g., a photograph of the geographic entity) and/or interactive icons with links to the geographic information data.
- the geographic information card may not necessarily be rectangular and can be any suitable shape.
- an example communication system 100 in which the techniques outlined above can be implemented includes a client computing device 102 , a server 101 , and a search server 110 .
- the client computing device 102 can display geographic information cards in a card map application 104 , which is stored in the memory 106 as a set of instructions and executes on one or more processor(s) (CPU) 107 and/or a graphics processing unit (GPU) 109 .
- the card map application 104 in general can display geographic information cards supplied by the server 101 via a network 112 , which can be a wired or wireless network including any suitable local or wide area network (e.g., the Internet).
- the card map application 104 may be a special-purpose application available at an online application store disposed at the server 101 or an application server.
- a user of the client computing device 102 may retrieve a copy of the card map application 104 from the application server and install the retrieved copy of the card map application 104 on the client computing device 102 .
- the card map application 104 can be a software component, such as a plug-in, that operates in a web browser (e.g., Google Chrome® or Apple's Safari®) or another application.
- the memory 106 may be a tangible, non-transitory memory and may include any types of suitable memory modules, including random access memory (RAM), read-only memory (ROM), a hard disk drive, flash memory, or other types of memory.
- the memory stores an operating system (OS) 114 and one or more local application(s) 116 or modules.
- the operating system 114 may be any type of suitable operating system.
- the one or more local application(s) 116 may include a variety of installed applications, such as contacts for a user, a weather application, etc.
- the local applications 116 and the card map application 104 can receive digital content via a network interface 118 .
- a user can interact with the applications 104 and 116 via a user interface 120 , which can include a touchscreen, a screen along with speakers 122 , a keyboard and a mouse, a microphone, a camera, a global positioning system (GPS) sensor, a WiFi module, etc.
- a user interface 120 can include a touchscreen, a screen along with speakers 122 , a keyboard and a mouse, a microphone, a camera, a global positioning system (GPS) sensor, a WiFi module, etc.
- GPS global positioning system
- the client computing device 102 can be any suitable portable or non-portable computing device.
- the client computing device 102 may be a smartphone, a tablet computer, a laptop computer, a wearable computing device, etc.
- the client computing device 102 can include fewer components than illustrated in FIG. 1 or conversely, additional components.
- the client computing device 102 may include multiple instances of the CPU 107 .
- the client computing device 102 may be operated by a user who views geographic information cards on the card map application 104 .
- the server 101 receives and subsequently stores geographic information data for the geographic information cards, and provides the geographic information cards to the client computing device 102 for a user to see.
- the server 101 from which the client computing device 102 receives geographic information cards may be communicatively coupled to one or several databases such as a map database 130 storing map data that can include street and road information, topographic data, satellite imagery, information related to public transport routes, information about businesses or other points of interest (POIs), information about current traffic conditions, etc.
- the map data can be stored in the map database 130 in a vector graphics format, a raster format, or both.
- the server 101 can receive information about geographically related objects from any number of suitable databases, web services, etc.
- the server 101 can correspond to multiple servers responsible for respective types of content or respective operations.
- the server 101 can include a server that stores geographic information cards and another server that searches for geographic information data associated with geographic entities within a geographic area.
- a search server 110 may search for geographic information data associated with a geographic entity after the server 101 does not identify a localized version of the geographic information data in a database.
- the search server 110 may search the Internet or any other machine-readable source of information for geographic information data in the public domain which may include photographs of the geographic entity, reviews of POIs within the geographic entity, a description of the geographic entity, etc.
- the search server 110 may then provide the geographic information data for the geographic entity or links to the geographic information data to the server 101 , which in turn may store the geographic information data with the geographic entity in a container.
- the server 101 may be communicatively connected to a knowledge base 138 .
- the knowledge base 138 is a machine-readable repository of data or information about geographic entities (e.g., objects of interest, places) organized around semantic principles.
- semantic principles may include geographic relationships (e.g., city, country).
- the data or information about entities may include descriptive data 136 (text descriptions, photographs, links to reviews of POIs, links to a map view, etc.) for each associated geographic entity.
- the geographic entity is Lynnwood, Wash.
- the geographic entity may be connected to links to restaurant reviews in Lynnwood, shopping reviews in Lynnwood, photographs of Lynnwood, a description of Lynnwood, etc.
- the knowledge base 138 is shown in FIG. 1 as storing the descriptive data 136 , some knowledge bases may be purely organizational databases in which relationships, or connections, between entities are defined, without storing specific digital content related to the entities.
- An example knowledge base 138 is described in further detail below with reference to FIG. 4 .
- the system for generating a card map display includes a card map generation module 140 (also referred to herein as “the module”) stored in a server memory 142 and executed by the server CPU 144 .
- the module 140 may generate geographic information cards for a geographic area received from a user based on related information in the knowledge base 138 .
- the user may request to view a card map display for the United States which is received at the server 101 .
- the server 101 may receive the user's current location based on the global positioning system (GPS) location of the user's computing device.
- the requested geographic area for the card map display may be a geographic area surrounding the user's current location.
- the user may be prompted to provide a requested geographic area when opening the card map application 104 .
- the module 140 may receive a requested geographic area.
- a requested geographic area may be received in any suitable manner.
- FIG. 2 illustrates an example map view 200 of a geographic area in a traditional map display.
- the geographic area includes a northwest portion of the United States (Washington, Oregon, and Idaho) as well as a southwestern portion of Canada (British Columbia and Alberta).
- the example map view 200 includes map features such as roads, mountains, bodies of water, etc., as well as map labels such as Oregon 202 , Washington 204 , and Idaho 206 .
- Each geographic entity (e.g., Washington, Oregon, Idaho, British Columbia, and Alberta) in the map view 200 is displayed according to its size and geometry. For example, the depiction of Washington is rectangular, whereas the depiction of Idaho is irregularly shaped, long and narrow at the top, and wider near the bottom. As shown in FIG. 2 , each of these geographic entities have different sizes and geometries.
- the server 101 as shown in FIG. 1 may convert the map view of a geographic area into a schematic diagram of geographic entities, where each depiction of a geographic entity in the schematic diagram is a same size and shape.
- the schematic diagram may display each of the geographic entities in equally sized geographic information cards, where the geographic information cards are displayed in a grid pattern.
- the geographic information cards may be different sizes but are not displayed according to the size and geometry of the corresponding geographic entities.
- one geographic information card may be rectangular and twice the size of another rectangular geographic information card. However, neither geographic information card is to scale for its corresponding geographic entity.
- the server 101 may identify geographic entities at several levels of detail. For example, at the lowest level of detail a single geographic entity may include the world. At the second level of detail geographic entities may include continents and oceans. At a third level of detail geographic entities may include countries, at a fourth level of detail geographic entities may include states and provinces, at a fifth level of detail geographic entities may include cities, etc.
- the server 101 divides the geographic area into segments (also referred to herein as “regions”) at each level of detail.
- the server 101 may divide the geographic area according to political boundaries (e.g., continents, countries, states, cities, etc.) or other criteria such as population, popularity, information density, etc.
- the server 101 may divide the geographic area according to political boundaries at some levels of detail and according to population, popularity, information density, etc., at other levels of detail. For example, the server 101 may divide the state of Illinois into cities including Chicago. The server 101 may then subdivide Chicago into neighborhoods based on the population of each neighborhood. Neighborhoods having populations below a population threshold may not be included as geographic segments at the neighborhood level of detail.
- Information density may include the amount of geographic information data available for a geographic entity.
- the information density may be based on the number of photographs, POIs, and reviews of POIs for the corresponding geographic entity.
- the card map generation module 140 may rank each of the geographic entities according to their respective information densities or assign a density score to each geographic entity. The geographic entities ranked below a threshold ranking or having density scores below a threshold score may be filtered out and not included on the card map display.
- the card map generation module 140 may determine popularity, for example, via travel guides or websites which rank popular travel destinations or via the number of users who view a particular location on a map display. Additionally, popularity may be based on social network commentary, such as the number of likes for the photographs and POIs for the corresponding geographic entity, comments on the photographs and POIs, or a ranking of the POIs provided by the reviews. Popularity may also be determined in any other suitable manner. In some embodiments, the card map generation module 140 may rank each of the geographic entities according to their respective popularities or assign a popularity score to each geographic entity. The geographic entities ranked below a threshold ranking or having popularity scores below a threshold score may be filtered out and not included on the card map display.
- FIG. 3 A illustrates an exemplary schematic representation 300 of the geographic area in the map view 200 shown in FIG. 2 , where the geographic area is segmented at a first level of detail for generating geographic information cards.
- the geographic area is divided according to political boundaries.
- Each geographic segment is presented in a same sized rectangle 302 - 324 within the schematic representation 300 .
- the schematic representation 300 includes states (Alaska 302 , Washington 310 , Idaho 312 , Oregon 316 , California 322 , Nevada 324 ), provinces (British Columbia 304 and Alberta 306 ), and a body of water (the Pacific Ocean 308 ).
- the geographic segments may be presented in different sized rectangles, where the rectangles do not accurately depict the size and geometry of the corresponding state, province, body of water, etc.
- the server 101 may not divide the Pacific Ocean into any further geographic segments or regions. This may be because, for example, the population of various portions of the Pacific Ocean is below a population threshold, the information density for various portions of the Pacific Ocean is below a density threshold, etc. Accordingly, the Pacific Ocean 308 may be included at each higher level of detail when the Pacific Ocean is not divided into geographic segments. For example, the Pacific Ocean 308 may be adjacent to an urban area such as San Francisco, Calif.
- the geographic entity may not be included at the higher level of detail, and a user may pan the card map display from Washington directly to a city in Japan without viewing the Pacific Ocean.
- Each of the geographic segments are positioned in the schematic representation 300 according to the physical locations of the geographic segments in relation to each other.
- Washington 310 is adjacent to Idaho 312 on the left in the schematic representation 300 and similarly borders Idaho 312 to the west in the physical world.
- Oregon 316 is adjacent to Washington 310 from below in the schematic representation 300 and similarly borders Washington 310 to the south in the physical world. While each pair of adjacent geographic segments in the schematic representation 300 do not necessarily share borders in the physical world, the geographic segments are positioned to indicate their physical locations with respect to each other.
- the schematic representation 300 includes several blank spaces 314 , 318 , 320 .
- the schematic representation 300 may include blank spaces 314 , 318 , 320 .
- the blank spaces 314 , 318 , 320 may act as placeholders when a user pans in one direction, so that when the user pans from several geographic segments, the same larger geographic segment may be displayed.
- the blank spaces 314 , 318 , 320 may also allow the user to skip directly from one geographic segment to the next without viewing several instances of the larger geographic segment.
- the user may pan to the left when viewing any of Washington 310 , Oregon 316 , and California 322 to view the Pacific Ocean 308 . Additionally, when the user is viewing Alaska 302 and pans down to view the Pacific Ocean 308 , the user may only need to pan down one more time to view Hawaii rather than viewing several instances or portions of the Pacific Ocean 308 .
- the schematic representation 300 may not include blank spaces and/or the blank spaces may not be visible to the user.
- the blank spaces are merely included to illustrate the functionality of allowing a user to pan to a same geographic segment from several other geographic segments when panning in one direction and allowing the user to pan to only a single instance of the geographic segment when panning in another direction.
- the server 101 may generate a geographic information card for each geographic segment in the schematic representation 300 .
- FIG. 3 B illustrates an exemplary schematic representation 350 of a portion of the geographic area in the map view 200 shown in FIG. 2 , where the geographic area is divided at a second level of detail for generating geographic information cards.
- the schematic representation 350 may include geographic segments or regions for a higher level of detail than the schematic representation 300 as shown in FIG. 3 A .
- the schematic representation 350 may include geographic segments for Washington 310 .
- the geographic area (Washington) is divided according to political boundaries. Each geographic segment is presented in a same sized rectangle 352 - 368 within the schematic representation 350 .
- the schematic representation 350 includes several cities (Lynnwood 354 , Redmond 356 , Bainbridge Island 358 , Seattle 360 , Bellevue 362 , SeaTac 364 , Renton 366 ) and similar to the schematic representation 300 , blank spaces 352 , 368 .
- Each of the geographic segments are positioned in the schematic representation 350 according to their respective physical locations.
- the server 101 may generate a geographic information card for each geographic segment in the schematic representation 350 .
- the schematic representation 350 includes geographic segments for Washington 310
- additional schematic representations which include geographic segments for the other U.S. states may also be included.
- the additional schematic representations may not be visible to the user on a card map display, but may become visible when the user pans away from the geographic segments for Washington 310 to other locations. For example, the user may pan to the right to view geographic segments for Idaho 312 .
- the server 101 obtains geographic information data for each of the geographic entities corresponding to the segments.
- the geographic information data may be obtained from a knowledge base 138 as shown in FIG. 4 .
- the example knowledge base 138 organizes connections between entities.
- the knowledge base may be stored at the server 101 or any other suitable server.
- entities such as people, places, etc.
- connections between entities are represented by lines connecting the circles.
- the geographic entity 402 represents the “World.”
- the example geographic entity 402 is connected to other geographic entities based on a common geographic area. For example, the continents “Asia,” “North America” and “Europe” and the “ Pacific Ocean” are connected to the “World.”
- geographic entities are connected to entities which provide information about the geographic entities (geographic information entities).
- the knowledge base 138 includes connections between the state of “Washington” 404 and a map view of Washington 406 , photographs of Washington 408 , a description of Washington 410 , and POIs in Washington 412 including reviews of the POIs.
- the geographic information entities may provide links to the geographic information data or may include the geographic information data such as the description, photographs, etc.
- the server 101 may connect geographic entities based on level of detail.
- the geographic entities may be determined by the server 101 in a similar manner as described above with reference to FIGS. 3 A and 3 B .
- the “World” may be divided according to political boundaries into continents and oceans. Each continent may be further divided according to political boundaries into countries and each country may be even further dividing according to political boundaries into states, provinces, or cities. In some scenarios, cities having a population below a population threshold or information density below a density threshold may be filtered out.
- the server 101 may further divide some cities into neighborhoods, suburbs, towns, etc., when the neighborhoods, suburbs, towns exceed population or density thresholds. Also in some scenarios, neighborhoods may be even further divided into streets for example, when the streets exceed population or density thresholds. For example, the city of Chicago may be divided into several neighborhoods each represented by a geographic entity. One of the neighborhoods, “River North” may be further divided into streets, such as Michigan Avenue, because Michigan Avenue is so well known for shopping and includes several POIs on the one street alone. The server 101 may not include many other streets as geographic entities because the information density and population for other streets do not meet density and population thresholds.
- the geographic entities which correspond to leaf nodes of the knowledge base 138 may be included on the card map display at the level of detail for which they correspond as well as each higher level of detail. For example, if the Pacific Ocean is included at level of detail 1 and is not subdivided any further, a geographic information card for the Pacific Ocean may be included at every level of detail starting at level of detail 1 . In other embodiments, when a user zooms to a level of detail which is higher than the level of detail for a leaf node, the geographic entity corresponding to the leaf node may not be included in the card map display.
- the server 101 may identify geographic entities which are above or below a geographic area or a portion thereof.
- New York City may include geographic entities for each borough as well as a geographic entity for the New York Subway which is located below the surface of New York City and directly underneath each of the boroughs. This is described in more detail below.
- the server 101 may search for geographic information data corresponding to the geographic entities or may direct the search server 110 in FIG. 1 to search for geographic information data.
- the search server 110 may search the Internet or any other machine-readable source of information for geographic information data corresponding to the geographic entities.
- the card map generation module 140 may store geographic information data or links to the geographic information data in the knowledge base 138 as an entity connected to the corresponding geographic entity.
- the geographic entities may be determined using an iterative process. For example, when a state is divided into several cities the geographic information data for each city may be used to identify population information, a number of POIs within the city, etc. The server 101 may then analyze the identified population information, number of POIs, etc., to determine the population and/or information density for the city which may be compared to population and/or density thresholds. When the city does not exceed one or several thresholds, the server 101 may filter out the city, and as a result the city may not be included as a geographic entity in the knowledge base 138 . On the other hand, when the city meets the thresholds, the city may remain as a geographic entity in the knowledge base 138 .
- the knowledge base 138 is depicted in FIG. 4 as a tree structure this is merely an exemplary embodiment.
- the knowledge base 138 may be organized in any suitable data structure, and the entities in the knowledge base 138 may be connected in any suitable manner.
- the entities are not limited to geographic entities and geographic information entities as illustrated in the exemplary embodiment of FIG. 4 .
- the entities may also include people, objects, etc.
- the knowledge base 138 stores a small number of geographic entities at a few levels of detail, this is for ease of illustration only.
- the knowledge base 138 may display any number of continents, countries, states, cities, etc., and corresponding geographic information data for each of them.
- the card map generation module 140 may retrieve the geographic entities and corresponding geographic information entities from the knowledge base 138 . In some embodiments, the card map generation module 140 may package the geographic information data for each corresponding geographic entity in a container and transmit the resulting containers to the client computing device 102 for rendering geographic information cards. In other embodiments, the card map generation module 140 may render the geographic information cards.
- the card map generation module 140 may transmit instructions to the client computing device 102 for organizing the geographic entities on the card map display.
- the equally sized geographic information cards may be organized in a grid pattern as shown in the schematic representation 300 of FIG. 3 A .
- the geographic information cards may be positioned in accordance with the geographic locations of their corresponding geographic entities.
- geographic information cards for geographic entities which share an eastern/western border may be positioned side-by side on the card map display.
- Geographic information cards for geographic entities which share a northern/southern border may be positioned above and below each other on the card map display.
- the corresponding geographic information card for underground geographic entity may be placed behind the geographic information card for the surface level geographic entity on the card map display. In this manner, the geographic information card for the surface level geographic entity may obscure the geographic information card for the underground geographic entity.
- FIG. 5 A illustrates a first view 540 of a card map display 500 depicting the city of Seattle at a neighborhood level of detail.
- the card map display 500 may be generated by the server 101 and presented on the client computing device 102 via the card map application 104 as shown in FIG. 1 .
- the server 101 may generate geographic information data for each geographic information card and transmit the geographic information data for each geographic information card (e.g., in a container) to the client computing device 102 for rendering the card map display 500 .
- the server 101 may generate geographic information cards or geographic information data for each of the geographic information cards in a batch mode. This may occur offline before geographic information data is requested.
- the server 101 may periodically update the batch of geographic information cards, for example, when the knowledge base 138 changes.
- the server 101 may generate the geographic information cards or geographic information data for each geographic information card in real-time, as the client computing device 102 requests geographic information data for a geographic area.
- the card map display 500 includes a geographic information card for Fremont 510 (Fremont card) which is a neighborhood in Seattle.
- the Fremont card 510 includes the name of the geographic entity (Fremont) 512 and several types of geographic information data for Fremont, including a description of Fremont 516 and interactive icons with links to POIs 514 a - c in Fremont, such as restaurants 514 a , coffee shops 514 b , and shopping 514 c .
- the Fremont card 510 also includes an interactive icon with a link to a street level map view 518 of Fremont.
- the interactive icons 514 a - c , 518 may be thumbnail views of the corresponding geographic information data, symbols representing the corresponding geographic information data (e.g., a knife and fork symbol representing restaurants), or any other suitable icons.
- the user selects one of the interactive icons 514 a - c , 518 for example using a tap gesture if the client computing device 102 includes a touch screen or a mouse click via a mouse, the corresponding map view, POI, etc., may be presented on the client computing device 102 .
- the user may then select a user control on the client computing device 102 , such as a “Back” button to return to the card map display 500 .
- the card map display 500 also includes geographic information cards for several other neighborhoods in Seattle which are adjacent to Fremont.
- the other neighborhoods may include Phinny Ridge, Ballard, Lower Queen Anne, Green Lake, East Queen Anne, Meridian, Wallingford, and Lake Union.
- Geographic information cards for each of the neighborhoods may be positioned on the card map display 500 according to their geographic locations in relation to Fremont. For example, the geographic information card for East Queen Anne 520 is displayed below the Fremont card 510 , because East Queen Anne borders Fremont to the south.
- the geographic information card for Wallingford 530 is displayed to the right of the Fremont card 510 , because Wallington borders Fremont to the east.
- one of the geographic information cards may be displayed more prominently than the others in an overlay screen on the card map display 500 and may obscure at least a portion of the other geographic information cards.
- the prominently displayed geographic information card does not obscure the other cards, but has highlighted or darkened borders.
- the prominently displayed geographic information card may correspond to a geographic entity that is the center of a requested geographic area and may be presented in the center of the card map display.
- the user may select the prominently displayed geographic information card, for example by panning or zooming to the geographic information card. As a result, the selected geographic information card may be displayed in an overlay screen obscuring the other geographic information cards.
- the Fremont card 510 is displayed in an overlay screen on the card map display 500 and at least partially obscures the other geographic information cards 520 , 530 .
- a user may pan to the Fremont card 510 from one of the other geographic information cards on the card map display 500 or from another geographic information card not included in the card map display 500 .
- the Fremont card 510 may pop up in front of the other cards on an overlay screen on the card map display 500 .
- the user may zoom in from Seattle and the Fremont may be located at or near the center of the Seattle.
- the client computing device 102 or the server 101 may determine which geographic information card to display in an overlay screen in any suitable manner. More specifically, the client computing device 102 may display the geographic information card in an overlay screen which corresponds to the geographic center of the geographic entity from which the user zoomed. As in the example above, when the user zooms in from Seattle, the client computing device 102 may display the geographic information card for Fremont in an overlay screen, because Fremont is the geographic center of Seattle. In another embodiment, the client computing device 102 may display the geographic information card having the highest information density, popularity, population, etc., in the overlay screen.
- the client computing device 102 or the server 101 may rank each of the geographic information cards for neighborhoods in Seattle according to information density, popularity, population, etc.
- the highest ranking geographic information card may be displayed in the overlay screen and the other geographic information cards for neighborhoods in Seattle may be placed on the card map display according to their geographic locations in relation to the highest ranking neighborhood.
- each of the geographic information cards is displayed in the same manner on the card map display 500 , where none of the geographic information cards are highlighted or pop out to obscure the other cards.
- a user may select one of the geographic information cards, via a tap gesture or a mouse click for example. As a result, the selected geographic information card may be displayed more prominently than the others on the card map display 500 .
- the card map display 500 includes nine geographic information cards, this is merely an exemplary embodiment. Any suitable of geographic information cards may be included in a card map display. Additionally, while geographic information cards representing neighborhoods in Seattle are visible to the user on the card map display 500 , the card map display 500 may also include geographic information cards for neighborhoods in several other cities, which may be visible in alternative views of the card map display 500 . As a result, the user may pan in any suitable direction to view geographic areas north, south, east, and west of the geographic area which is visible in the card map display 500 . The user may pan using touch gestures when the client computing device 102 includes a touchscreen, such as a slide or drag gesture or mouse gestures via a mouse, such as a click and drag gesture. The user may also zoom in or out to view the geographic area at various levels of detail (e.g., country, state, city, neighborhood) using pinch and pull gestures or button clicks via a mouse.
- levels of detail e.g., country, state, city, neighborhood
- the card map application 104 may display geographic information cards behind other geographic information cards, when a corresponding geographic entity is below the surface for example.
- the geographic information card for a geographic entity below the surface may be completely obscured by a geographic information for a surface level geographic entity.
- the user may select the geographic information card for the geographic entity below the surface via a three-dimensional (3D) gesture such as a peek gesture.
- the user may select the geographic information card in any other suitable manner.
- the geographic information card for the geographic entity below the surface may be displayed in front of the geographic information card for the surface level geographic entity, in a manner similar to the Fremont card 510 .
- the user may perform another 3D gesture or any other suitable gesture to switch the geographic information cards back to their original positions.
- FIG. 5 B illustrates an example second view 550 of the card map display 500 .
- the selected card (the Wallingford card 530 ) is displayed in an overlay screen on the card map display 500 . Similar to the Fremont card 510 as shown in FIG.
- the Wallingford card 530 includes the name of the geographic entity (Wallingford) 562 and several types of geographic information data for Wallingford, including a description of Wallingford 566 and interactive icons with links to POIs 516 a - c in Wallingford, such as restaurants 564 a , coffee shops 564 b , and shopping 564 c .
- the Wallingford card 530 also includes an interactive icon with a link to a street level map view 568 of Wallingford.
- the second view 550 also includes other geographic information cards from the first view (Green Lake, East Queen Anne, Meridian, and Lake Union) and geographic information cards for geographic entities east of the first view in response to the user panning to the right.
- the server 101 may provide the geographic information cards for the geographic entities east of the first view when the user pans to the right.
- card map display 500 may include the geographic entities east of the first view, but they may not be visible on the card map display 500 until the user pans to the right.
- a geographic information card for a geographic entity to the west of the Wallingford card 530 may be selected and geographic information cards for other geographic entities west of the second view 550 may be displayed.
- the server 101 may provide geographic information cards for geographic entities at the new level of detail.
- the server 101 may provide geographic information cards for geographic entities at several levels of detail, when the client computing device 102 initially requests geographic information data for a geographic area. Then, when the user requests a particular level of detail (e.g., by zooming in or out), the client computing device 102 may present the geographic information cards for the requested level of detail on the card map display 500 .
- John is planning a trip to the Pacific Northwest. He may view a card map display including geographic information cards for Washington, Oregon, and British Columbia. Each geographic information card may provide John with links to photographs, POIs and reviews of POIs for the corresponding geographic entity. Accordingly, John may plan his trip through the Pacific Northwest by following the links. He may also plan out an appropriate route for traveling through the Pacific Northwest based on the positions of each of the geographic information cards. For example, the geographic information card for Oregon may be placed below the geographic information card for Washington, which may be placed below the geographic information card for British Columbia. As a result, John may begin his trip in Oregon and travel north to British Columbia, stopping in Washington along the way.
- John may zoom in on each of the geographic information cards to view additional geographic information cards which represent cities in Washington, for example. John may navigate through the cities in Washington to further identify places to see on his trip. He may also pan up, down, to the right or to the left to view geographic information cards for regions to the north, south, east, and west of the Pacific Northwest in case he wants to extend his trip or for another trip in the future.
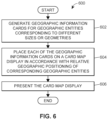
- FIG. 6 illustrates a flow diagram of an example method 600 for presenting the card map display.
- the method can be implemented in a set of instructions stored on a computer-readable memory and executable on one or more processors of the client computing device 102 .
- the method can be implemented by the card map application 104 .
- the client computing device 102 may generate equal sized geographic information cards similar to the Fremont card 510 as shown in FIG. 5 A , for several geographic entities in a geographic area, where the geographic entities have different sizes or geometries.
- the geographic information cards may be different sizes, but are not to scale for the corresponding geographic entities.
- Each geographic information card may include geographic information data for the corresponding geographic entity.
- the geographic information data may be arranged in any suitable manner on the geographic information card. For example, a name of the corresponding geographic entity may be displayed at the top followed by a description of the geographic entity and including photographs of the geographic entity or links to photographs just below the description.
- each type of geographic information data may be displayed side-by-side on the geographic information card.
- the geographic information cards may include interactive icons, which may be individually selectable links to further displays of each corresponding type of geographic information data.
- the client computing device 102 may generate the geographic information cards by transmitting a request to the server 101 for geographic information data for a geographic area. For example, the user may enter a query via the card map application 104 of the client computing device 102 requesting geographic information cards for the United States. In another example, the client computing device 102 may detect the user's current location based on the GPS location of the client computing device 102 . The client computing device 102 may then transmit a request for geographic information data for a geographic area surrounding the user's current location (e.g., within a five mile radius of the user's current location). In some embodiments, the client computing device 102 may also transmit a requested level of detail.
- the requested level of detail may be transmitted in response to the user zooming in and out of the card map display.
- the client computing device 102 may transmit a default level of detail (e.g., a city level), or the user may enter the level of detail into the query.
- the server 101 and more specifically, the card map generation module 140 may identify geographic entities within the geographic area at the requested level of detail.
- the geographic entities may be retrieved from the knowledge base 138 .
- the client computing device 102 may receive geographic information data for each of the identified geographic entities within the geographic area at the requested level of detail.
- the geographic information data may include a description of the geographic entity and links to photographs of the geographic entity, POIs within the geographic entity, reviews of the POIs, a map view of the geographic entity, etc.
- the client computing device 102 may receive a container including all of the geographic information data for a geographic entity.
- the client computing device 102 may receive indications of the locations of each geographic entity for positioning geographic information cards corresponding to the geographic entities on the card map display.
- the client computing device 102 may generate a representation of the geographic area (a card map display) by placing each of the geographic information cards in accordance with the relative geographic positioning of the corresponding geographic entities.
- the geographic information cards may be arranged in a grid pattern on the card map display, where geographic information cards at the top of the card map display correspond to geographic entities to the north of geographic entities for the geographic information cards at the bottom of the card map display.
- geographic information cards on the left side of the card map display correspond to geographic entities to the west of geographic entities for geographic information cards on the right side of the card map display.
- geographic information cards for geographic entities below the surface of a geographic area may be displayed behind the other geographic information cards and may not be visible to the user or may be at least partially obscured.
- the client computing device 102 may present the card map display on the user interface 120 (block 606 ).
- the user may pan or zoom in and out of the geographic area displayed on the user interface 120 to view additional geographic areas and/or to view the geographic area at different levels of detail.
- FIG. 7 illustrates a flow diagram of an example method 700 for generating the generating the geographic information cards.
- the method can be implemented in a set of instructions stored on a computer-readable memory and executable on one or more processors of the server 101 .
- the method can be implemented by the card map generation module 140 .
- the server 101 may divide a geographic area into segments or regions at several levels of detail.
- the server 101 may divide the geographic area according to political boundaries (e.g., continents, countries, states, cities, etc.) or other criteria such as population, popularity, information density, etc.
- the server 101 may divide the geographic area according to political boundaries at some levels of detail and according to population, popularity, information density, etc., at other levels of detail. For example, the server 101 may divide the state of Illinois into cities including Chicago. The server 101 may then subdivide Chicago into neighborhoods based on the population of each neighborhood. Neighborhoods having populations below a population threshold may not be included as geographic segments at the neighborhood level of detail. Each of the segments may represent a geographic entity.
- the server 101 may identify geographic information data for each geographic entity. For example, the server 101 may retrieve the geographic information data from geographic information entities connected to the geographic entities in a knowledge base 138 . If a geographic entity is not included in the knowledge base 138 or the geographic entity is not connected to geographic information entities, the server 101 may search for geographic information data corresponding to the geographic entities or may direct the search server 110 in FIG. 1 to search for geographic information data. The search server 110 may search the Internet or any other machine-readable source of information for geographic information data corresponding to the geographic entities. When geographic information data is identified, the card map generation module 140 may store geographic information data or links to the geographic information data in the knowledge base 138 as an entity connected to the corresponding geographic entity.
- the server 101 may package all of the geographic information data for the geographic entity and store the geographic information data in a container (block 706 ). The server 101 may then provide the resulting containers to the client computing device 102 for generating geographic information cards (block 708 ). In some embodiments, the server 101 may also transmit indications of the locations of each geographic entity for the client computing device 102 to arrange the corresponding geographic information cards in a card map display. In other embodiments, the server 101 may generate and transmit the geographic information cards to the client computing device 102 .
- Modules may constitute either software modules (e.g., code stored on a machine-readable medium) or hardware modules.
- a hardware module is tangible unit capable of performing certain operations and may be configured or arranged in a certain manner.
- one or more computer systems e.g., a standalone, client or server computer system
- one or more hardware modules of a computer system e.g., a processor or a group of processors
- software e.g., an application or application portion
- a hardware module may be implemented mechanically or electronically.
- a hardware module may comprise dedicated circuitry or logic that is permanently configured (e.g., as a special-purpose processor, such as a field programmable gate array (FPGA) or an application-specific integrated circuit (ASIC)) to perform certain operations.
- a hardware module may also comprise programmable logic or circuitry (e.g., as encompassed within a general-purpose processor or other programmable processor) that is temporarily configured by software to perform certain operations. It will be appreciated that the decision to implement a hardware module mechanically, in dedicated and permanently configured circuitry, or in temporarily configured circuitry (e.g., configured by software) may be driven by cost and time considerations.
- hardware should be understood to encompass a tangible entity, be that an entity that is physically constructed, permanently configured (e.g., hardwired), or temporarily configured (e.g., programmed) to operate in a certain manner or to perform certain operations described herein.
- “hardware-implemented module” refers to a hardware module. Considering embodiments in which hardware modules are temporarily configured (e.g., programmed), each of the hardware modules need not be configured or instantiated at any one instance in time. For example, where the hardware modules comprise a general-purpose processor configured using software, the general-purpose processor may be configured as respective different hardware modules at different times. Software may accordingly configure a processor, for example, to constitute a particular hardware module at one instance of time and to constitute a different hardware module at a different instance of time.
- Hardware modules can provide information to, and receive information from, other hardware. Accordingly, the described hardware modules may be regarded as being communicatively coupled. Where multiple of such hardware modules exist contemporaneously, communications may be achieved through signal transmission (e.g., over appropriate circuits and buses) that connect the hardware modules. In embodiments in which multiple hardware modules are configured or instantiated at different times, communications between such hardware modules may be achieved, for example, through the storage and retrieval of information in memory structures to which the multiple hardware modules have access. For example, one hardware module may perform an operation and store the output of that operation in a memory device to which it is communicatively coupled. A further hardware module may then, at a later time, access the memory device to retrieve and process the stored output. Hardware modules may also initiate communications with input or output devices, and can operate on a resource (e.g., a collection of information).
- a resource e.g., a collection of information
- the methods 600 and 700 may include one or more function blocks, modules, individual functions or routines in the form of tangible computer-executable instructions that are stored in a non-transitory computer-readable storage medium and executed using a processor of a computing device (e.g., a server, a personal computer, a smart phone, a tablet computer, a smart watch, a mobile computing device, or other client computing device, as described herein).
- a computing device e.g., a server, a personal computer, a smart phone, a tablet computer, a smart watch, a mobile computing device, or other client computing device, as described herein.
- the methods 600 and 700 may be included as part of any backend server (e.g., a search server, or any other type of server computing device, as described herein), client computing device modules of the example environment, for example, or as part of a module that is external to such an environment.
- the methods 600 and 700 can be utilized with other objects and user interfaces. Furthermore, although the explanation above describes steps of the methods 600 and 700 being performed by specific devices (such as a client computing device 102 , and a server 101 ), this is done for illustration purposes only. The blocks of the methods 600 and 700 may be performed by one or more devices or other parts of the environment.
- processors may be temporarily configured (e.g., by software) or permanently configured to perform the relevant operations. Whether temporarily or permanently configured, such processors may constitute processor-implemented modules that operate to perform one or more operations or functions.
- the modules referred to herein may, in some example embodiments, comprise processor-implemented modules.
- the methods or routines described herein may be at least partially processor-implemented. For example, at least some of the operations of a method may be performed by one or more processors or processor-implemented hardware modules. The performance of certain of the operations may be distributed among the one or more processors, not only residing within a single machine, but deployed across a number of machines. In some example embodiments, the processor or processors may be located in a single location (e.g., within a home environment, an office environment or as a server farm), while in other embodiments the processors may be distributed across a number of locations.
- the one or more processors may also operate to support performance of the relevant operations in a “cloud computing” environment or as an SaaS.
- a “cloud computing” environment or as an SaaS.
- at least some of the operations may be performed by a group of computers (as examples of machines including processors), these operations being accessible via a network (e.g., the Internet) and via one or more appropriate interfaces (e.g., APIs).
Abstract
Description
Claims (20)
Priority Applications (1)
| Application Number | Priority Date | Filing Date | Title |
|---|---|---|---|
| US16/836,072 US11663262B2 (en) | 2016-06-27 | 2020-03-31 | System and method for generating a geographic information card map |
Applications Claiming Priority (2)
| Application Number | Priority Date | Filing Date | Title |
|---|---|---|---|
| US15/193,596 US10642883B2 (en) | 2016-06-27 | 2016-06-27 | System and method for generating a geographic information card map |
| US16/836,072 US11663262B2 (en) | 2016-06-27 | 2020-03-31 | System and method for generating a geographic information card map |
Related Parent Applications (1)
| Application Number | Title | Priority Date | Filing Date |
|---|---|---|---|
| US15/193,596 Continuation US10642883B2 (en) | 2016-06-27 | 2016-06-27 | System and method for generating a geographic information card map |
Publications (2)
| Publication Number | Publication Date |
|---|---|
| US20200226169A1 US20200226169A1 (en) | 2020-07-16 |
| US11663262B2 true US11663262B2 (en) | 2023-05-30 |
Family
ID=59258382
Family Applications (2)
| Application Number | Title | Priority Date | Filing Date |
|---|---|---|---|
| US15/193,596 Active 2037-09-20 US10642883B2 (en) | 2016-06-27 | 2016-06-27 | System and method for generating a geographic information card map |
| US16/836,072 Active 2037-05-30 US11663262B2 (en) | 2016-06-27 | 2020-03-31 | System and method for generating a geographic information card map |
Family Applications Before (1)
| Application Number | Title | Priority Date | Filing Date |
|---|---|---|---|
| US15/193,596 Active 2037-09-20 US10642883B2 (en) | 2016-06-27 | 2016-06-27 | System and method for generating a geographic information card map |
Country Status (4)
| Country | Link |
|---|---|
| US (2) | US10642883B2 (en) |
| EP (1) | EP3475842B1 (en) |
| CN (1) | CN109313647B (en) |
| WO (1) | WO2018005147A1 (en) |
Families Citing this family (14)
| Publication number | Priority date | Publication date | Assignee | Title |
|---|---|---|---|---|
| US20160313957A1 (en) * | 2015-04-21 | 2016-10-27 | Wandr LLC | Real-time event management |
| US10593074B1 (en) * | 2016-03-16 | 2020-03-17 | Liberty Mutual Insurance Company | Interactive user interface for displaying geographic boundaries |
| CN110109917A (en) * | 2018-02-01 | 2019-08-09 | 董福田 | A kind of processing method and processing device of data |
| US20200134103A1 (en) * | 2018-10-26 | 2020-04-30 | Ca, Inc. | Visualization-dashboard narration using text summarization |
| CN109857950A (en) * | 2019-02-21 | 2019-06-07 | 孔瑜佳 | A kind of geologic information obtains, method for pushing and device |
| US10838599B2 (en) * | 2019-02-25 | 2020-11-17 | Snap Inc. | Custom media overlay system |
| US11397775B2 (en) * | 2019-05-24 | 2022-07-26 | Axim Geospatial, Llc | User interface for evaluating the quality of geospatial data |
| US11768878B2 (en) * | 2019-09-20 | 2023-09-26 | Fisher-Rosemount Systems, Inc. | Search results display in a process control system |
| US11768877B2 (en) * | 2019-09-20 | 2023-09-26 | Fisher-Rosemount Systems, Inc. | Smart search capabilities in a process control system |
| CN111475722B (en) * | 2020-03-31 | 2023-04-18 | 百度在线网络技术(北京)有限公司 | Method and apparatus for transmitting information |
| US11836826B2 (en) | 2020-09-30 | 2023-12-05 | Snap Inc. | Augmented reality content generators for spatially browsing travel destinations |
| US11538225B2 (en) | 2020-09-30 | 2022-12-27 | Snap Inc. | Augmented reality content generator for suggesting activities at a destination geolocation |
| US11809507B2 (en) * | 2020-09-30 | 2023-11-07 | Snap Inc. | Interfaces to organize and share locations at a destination geolocation in a messaging system |
| CN114861032A (en) * | 2021-02-04 | 2022-08-05 | 华为技术有限公司 | Searching method and electronic equipment |
Citations (16)
| Publication number | Priority date | Publication date | Assignee | Title |
|---|---|---|---|---|
| US20070211151A1 (en) | 2005-12-06 | 2007-09-13 | Sony Corporation | Image managing apparatus and image display apparatus |
| US7283909B1 (en) | 2004-03-24 | 2007-10-16 | Olsen Michael A | Overlaying orthorectified aerial images with map information tied to a state plane coordinate system |
| US20090210388A1 (en) | 2008-02-20 | 2009-08-20 | Microsoft Corporation | Efficiently discovering and synthesizing maps from a large corpus of maps |
| US20090241061A1 (en) * | 2008-03-21 | 2009-09-24 | Sony Corporation | Navigation apparatus, search result display method, and graphical user interface |
| US7600192B1 (en) | 1998-11-30 | 2009-10-06 | Sony Corporation | Method of zoom and fade transitioning between layers of information screens |
| US20110122153A1 (en) | 2009-11-26 | 2011-05-26 | Okamura Yuki | Information processing apparatus, information processing method, and program |
| US20110191014A1 (en) | 2010-02-04 | 2011-08-04 | Microsoft Corporation | Mapping interface with higher zoom level inset map |
| US20110316884A1 (en) * | 2010-06-25 | 2011-12-29 | Microsoft Corporation | Alternative semantics for zoom operations in a zoomable scene |
| US20130042180A1 (en) | 2011-08-11 | 2013-02-14 | Yahoo! Inc. | Method and system for providing map interactivity for a visually-impaired user |
| US20130047126A1 (en) | 2011-05-27 | 2013-02-21 | Microsoft Corporation | Switching back to a previously-interacted-with application |
| US20130063488A1 (en) * | 2011-09-12 | 2013-03-14 | Nokia Corporation | Method and apparatus for providing list-based exploration of mapping data |
| US20150254277A1 (en) * | 2014-03-04 | 2015-09-10 | Google Inc. | Schematic representation of geographic locations |
| US20160033295A1 (en) | 2014-07-29 | 2016-02-04 | Google Inc. | Presenting hierarchies of map data at different zoom levels |
| US20160054865A1 (en) | 2001-07-05 | 2016-02-25 | NexRf Corporation | System and method for map based exploration |
| US20160117348A1 (en) * | 2014-10-28 | 2016-04-28 | Here Global B.V. | Image Based Routing and Confirmation |
| US20180301111A1 (en) * | 2015-06-08 | 2018-10-18 | Samsung Electronics Co., Ltd. | Electronic device and method for displaying electronic map in electronic device |
Family Cites Families (7)
| Publication number | Priority date | Publication date | Assignee | Title |
|---|---|---|---|---|
| US7177761B2 (en) * | 2004-10-27 | 2007-02-13 | Navteq North America, Llc | Map display for a navigation system |
| CN101625689A (en) * | 2009-07-17 | 2010-01-13 | 王玮 | Internet information issuing and presenting system based on geographic system and method thereof |
| US8983973B2 (en) * | 2011-10-12 | 2015-03-17 | Mapquest, Inc. | Systems and methods for ranking points of interest |
| US20150062114A1 (en) * | 2012-10-23 | 2015-03-05 | Andrew Ofstad | Displaying textual information related to geolocated images |
| WO2015060791A1 (en) * | 2013-10-25 | 2015-04-30 | iBlast Pte Ltd | System and method for highly geolocalized multimedia based facility, site, or event related promotion and/or social networking |
| WO2015195923A1 (en) * | 2014-06-21 | 2015-12-23 | Google Inc. | Tile-based distribution of searchable geospatial data to client devices |
| CN105405354A (en) * | 2015-12-23 | 2016-03-16 | 天津大学 | Standard module of three-dimensional digital sand table |
-
2016
- 2016-06-27 US US15/193,596 patent/US10642883B2/en active Active
-
2017
- 2017-06-19 WO PCT/US2017/038118 patent/WO2018005147A1/en active Search and Examination
- 2017-06-19 CN CN201780038477.0A patent/CN109313647B/en active Active
- 2017-06-19 EP EP17734588.1A patent/EP3475842B1/en active Active
-
2020
- 2020-03-31 US US16/836,072 patent/US11663262B2/en active Active
Patent Citations (16)
| Publication number | Priority date | Publication date | Assignee | Title |
|---|---|---|---|---|
| US7600192B1 (en) | 1998-11-30 | 2009-10-06 | Sony Corporation | Method of zoom and fade transitioning between layers of information screens |
| US20160054865A1 (en) | 2001-07-05 | 2016-02-25 | NexRf Corporation | System and method for map based exploration |
| US7283909B1 (en) | 2004-03-24 | 2007-10-16 | Olsen Michael A | Overlaying orthorectified aerial images with map information tied to a state plane coordinate system |
| US20070211151A1 (en) | 2005-12-06 | 2007-09-13 | Sony Corporation | Image managing apparatus and image display apparatus |
| US20090210388A1 (en) | 2008-02-20 | 2009-08-20 | Microsoft Corporation | Efficiently discovering and synthesizing maps from a large corpus of maps |
| US20090241061A1 (en) * | 2008-03-21 | 2009-09-24 | Sony Corporation | Navigation apparatus, search result display method, and graphical user interface |
| US20110122153A1 (en) | 2009-11-26 | 2011-05-26 | Okamura Yuki | Information processing apparatus, information processing method, and program |
| US20110191014A1 (en) | 2010-02-04 | 2011-08-04 | Microsoft Corporation | Mapping interface with higher zoom level inset map |
| US20110316884A1 (en) * | 2010-06-25 | 2011-12-29 | Microsoft Corporation | Alternative semantics for zoom operations in a zoomable scene |
| US20130047126A1 (en) | 2011-05-27 | 2013-02-21 | Microsoft Corporation | Switching back to a previously-interacted-with application |
| US20130042180A1 (en) | 2011-08-11 | 2013-02-14 | Yahoo! Inc. | Method and system for providing map interactivity for a visually-impaired user |
| US20130063488A1 (en) * | 2011-09-12 | 2013-03-14 | Nokia Corporation | Method and apparatus for providing list-based exploration of mapping data |
| US20150254277A1 (en) * | 2014-03-04 | 2015-09-10 | Google Inc. | Schematic representation of geographic locations |
| US20160033295A1 (en) | 2014-07-29 | 2016-02-04 | Google Inc. | Presenting hierarchies of map data at different zoom levels |
| US20160117348A1 (en) * | 2014-10-28 | 2016-04-28 | Here Global B.V. | Image Based Routing and Confirmation |
| US20180301111A1 (en) * | 2015-06-08 | 2018-10-18 | Samsung Electronics Co., Ltd. | Electronic device and method for displaying electronic map in electronic device |
Non-Patent Citations (7)
| Title |
|---|
| "Grid" dictionary definition from online Google search, 1 page screenshot copy dated May 11, 2021. * |
| Google Maps (2016). Retrieved from the Internet at: <https://www.google.com/maps/@41.7920765,-87.5902684,3a,75y,251.93h,90t/data=!3m6!1e1!3m4!1s5V3yoxh4uGd-rV0UbHb9gQ!2e0!7i13312!8i6656>. |
| Google Search (2016). Retrieved from the Internet at: https://www.google.com/webhp?sourceid=chrome-instant&ion=1&espv=2&ie=UTF-8#q=seattle%20washington <https://www.google.com/webhp?sourceid=chrome-instant&ion=1&espv=2&ie=UTF-8>. |
| International Search Report and Written Opinion for Application No. PCT/US2017/038118, dated Sep. 21, 2017. |
| Office Action for U.S. Appl. No. 15/193,596, dated Aug. 30, 2018. |
| Office Action for U.S. Appl. No. 15/193,596, dated Mar. 15, 2019. |
| Office Action for U.S. Appl. No. 15/193,596, dated Nov. 25, 2019. |
Also Published As
| Publication number | Publication date |
|---|---|
| US20200226169A1 (en) | 2020-07-16 |
| WO2018005147A1 (en) | 2018-01-04 |
| EP3475842A1 (en) | 2019-05-01 |
| CN109313647A (en) | 2019-02-05 |
| CN109313647B (en) | 2023-12-26 |
| EP3475842B1 (en) | 2020-11-04 |
| US10642883B2 (en) | 2020-05-05 |
| US20170371883A1 (en) | 2017-12-28 |
Similar Documents
| Publication | Publication Date | Title |
|---|---|---|
| US11663262B2 (en) | System and method for generating a geographic information card map | |
| US9110573B2 (en) | Personalized viewports for interactive digital maps | |
| US10324601B2 (en) | Integrating maps and street views | |
| EP2954468B1 (en) | Providing indoor facility information on a digital map | |
| US20150254277A1 (en) | Schematic representation of geographic locations | |
| JP6546598B2 (en) | System and method for geolocation of images | |
| US20150062114A1 (en) | Displaying textual information related to geolocated images | |
| US20110074811A1 (en) | Map Layout for Print Production | |
| WO2013184838A2 (en) | System and method for providing content for a point of interest | |
| US10018480B2 (en) | Point of interest selection based on a user request | |
| CN110083286B (en) | System and method for disambiguating item selections | |
| KR102108488B1 (en) | Contextual Map View | |
| US10838988B2 (en) | System and method for efficient geospatial indexing | |
| US11402232B2 (en) | Off-viewport location indications for digital mapping | |
| CN112654837A (en) | Selecting points of interest for display on a personalized digital map | |
| WO2018080422A1 (en) | Point of interest selection based on a user request | |
| Antoniou et al. | An interactive story map for the Methana volcanic peninsula | |
| CN113886662A (en) | Method, system, and storage medium for rendering a map for a user | |
| JP2015053002A (en) | Information presentation program and mobile communication terminal utilizing the same | |
| KR101102083B1 (en) | System and method for diagramming geo-referenced data |
Legal Events
| Date | Code | Title | Description |
|---|---|---|---|
| FEPP | Fee payment procedure |
Free format text: ENTITY STATUS SET TO UNDISCOUNTED (ORIGINAL EVENT CODE: BIG.); ENTITY STATUS OF PATENT OWNER: LARGE ENTITY |
|
| AS | Assignment |
Owner name: GOOGLE LLC, CALIFORNIA Free format text: CHANGE OF NAME;ASSIGNOR:GOOGLE INC.;REEL/FRAME:052282/0058 Effective date: 20170929 Owner name: GOOGLE INC., CALIFORNIA Free format text: ASSIGNMENT OF ASSIGNORS INTEREST;ASSIGNORS:ZHOU, BAILIANG;ZHANG, GUANGQIANG;REEL/FRAME:052281/0925 Effective date: 20160628 |
|
| STPP | Information on status: patent application and granting procedure in general |
Free format text: RESPONSE TO NON-FINAL OFFICE ACTION ENTERED AND FORWARDED TO EXAMINER |
|
| STPP | Information on status: patent application and granting procedure in general |
Free format text: FINAL REJECTION MAILED |
|
| STPP | Information on status: patent application and granting procedure in general |
Free format text: DOCKETED NEW CASE - READY FOR EXAMINATION |
|
| STPP | Information on status: patent application and granting procedure in general |
Free format text: NON FINAL ACTION MAILED |
|
| STPP | Information on status: patent application and granting procedure in general |
Free format text: RESPONSE TO NON-FINAL OFFICE ACTION ENTERED AND FORWARDED TO EXAMINER |
|
| STPP | Information on status: patent application and granting procedure in general |
Free format text: FINAL REJECTION MAILED |
|
| STCV | Information on status: appeal procedure |
Free format text: NOTICE OF APPEAL FILED |
|
| STCV | Information on status: appeal procedure |
Free format text: APPEAL BRIEF (OR SUPPLEMENTAL BRIEF) ENTERED AND FORWARDED TO EXAMINER |
|
| STCV | Information on status: appeal procedure |
Free format text: EXAMINER'S ANSWER TO APPEAL BRIEF MAILED |
|
| STCV | Information on status: appeal procedure |
Free format text: ON APPEAL -- AWAITING DECISION BY THE BOARD OF APPEALS |
|
| STCF | Information on status: patent grant |
Free format text: PATENTED CASE |